Stellarone — Virginia Financial Group — Merger or Acquisition (July 2007)
18 slides from Stellarone's merger presentation, Jul 30, 2007
Slide 1: Virginia Financial Group and FNB Corporation Merger-of-Equals Transaction
Virginia FNB and are JulyCombining 27, Corporation 2007 Financial in a(FNBP) Group, Merger-of-Equals Inc. (VFGI)Transaction
Slide 2: Caution Regarding Forward-Looking Statements
Caution Statements and savings, future Securities plans limited synergies employee expected policies deposit electronic undertake are or results to: flows; based of Regarding strategies, enhanced timeframe and relationships systems; no Litigation (1) the made obligation or on cost the competition; U
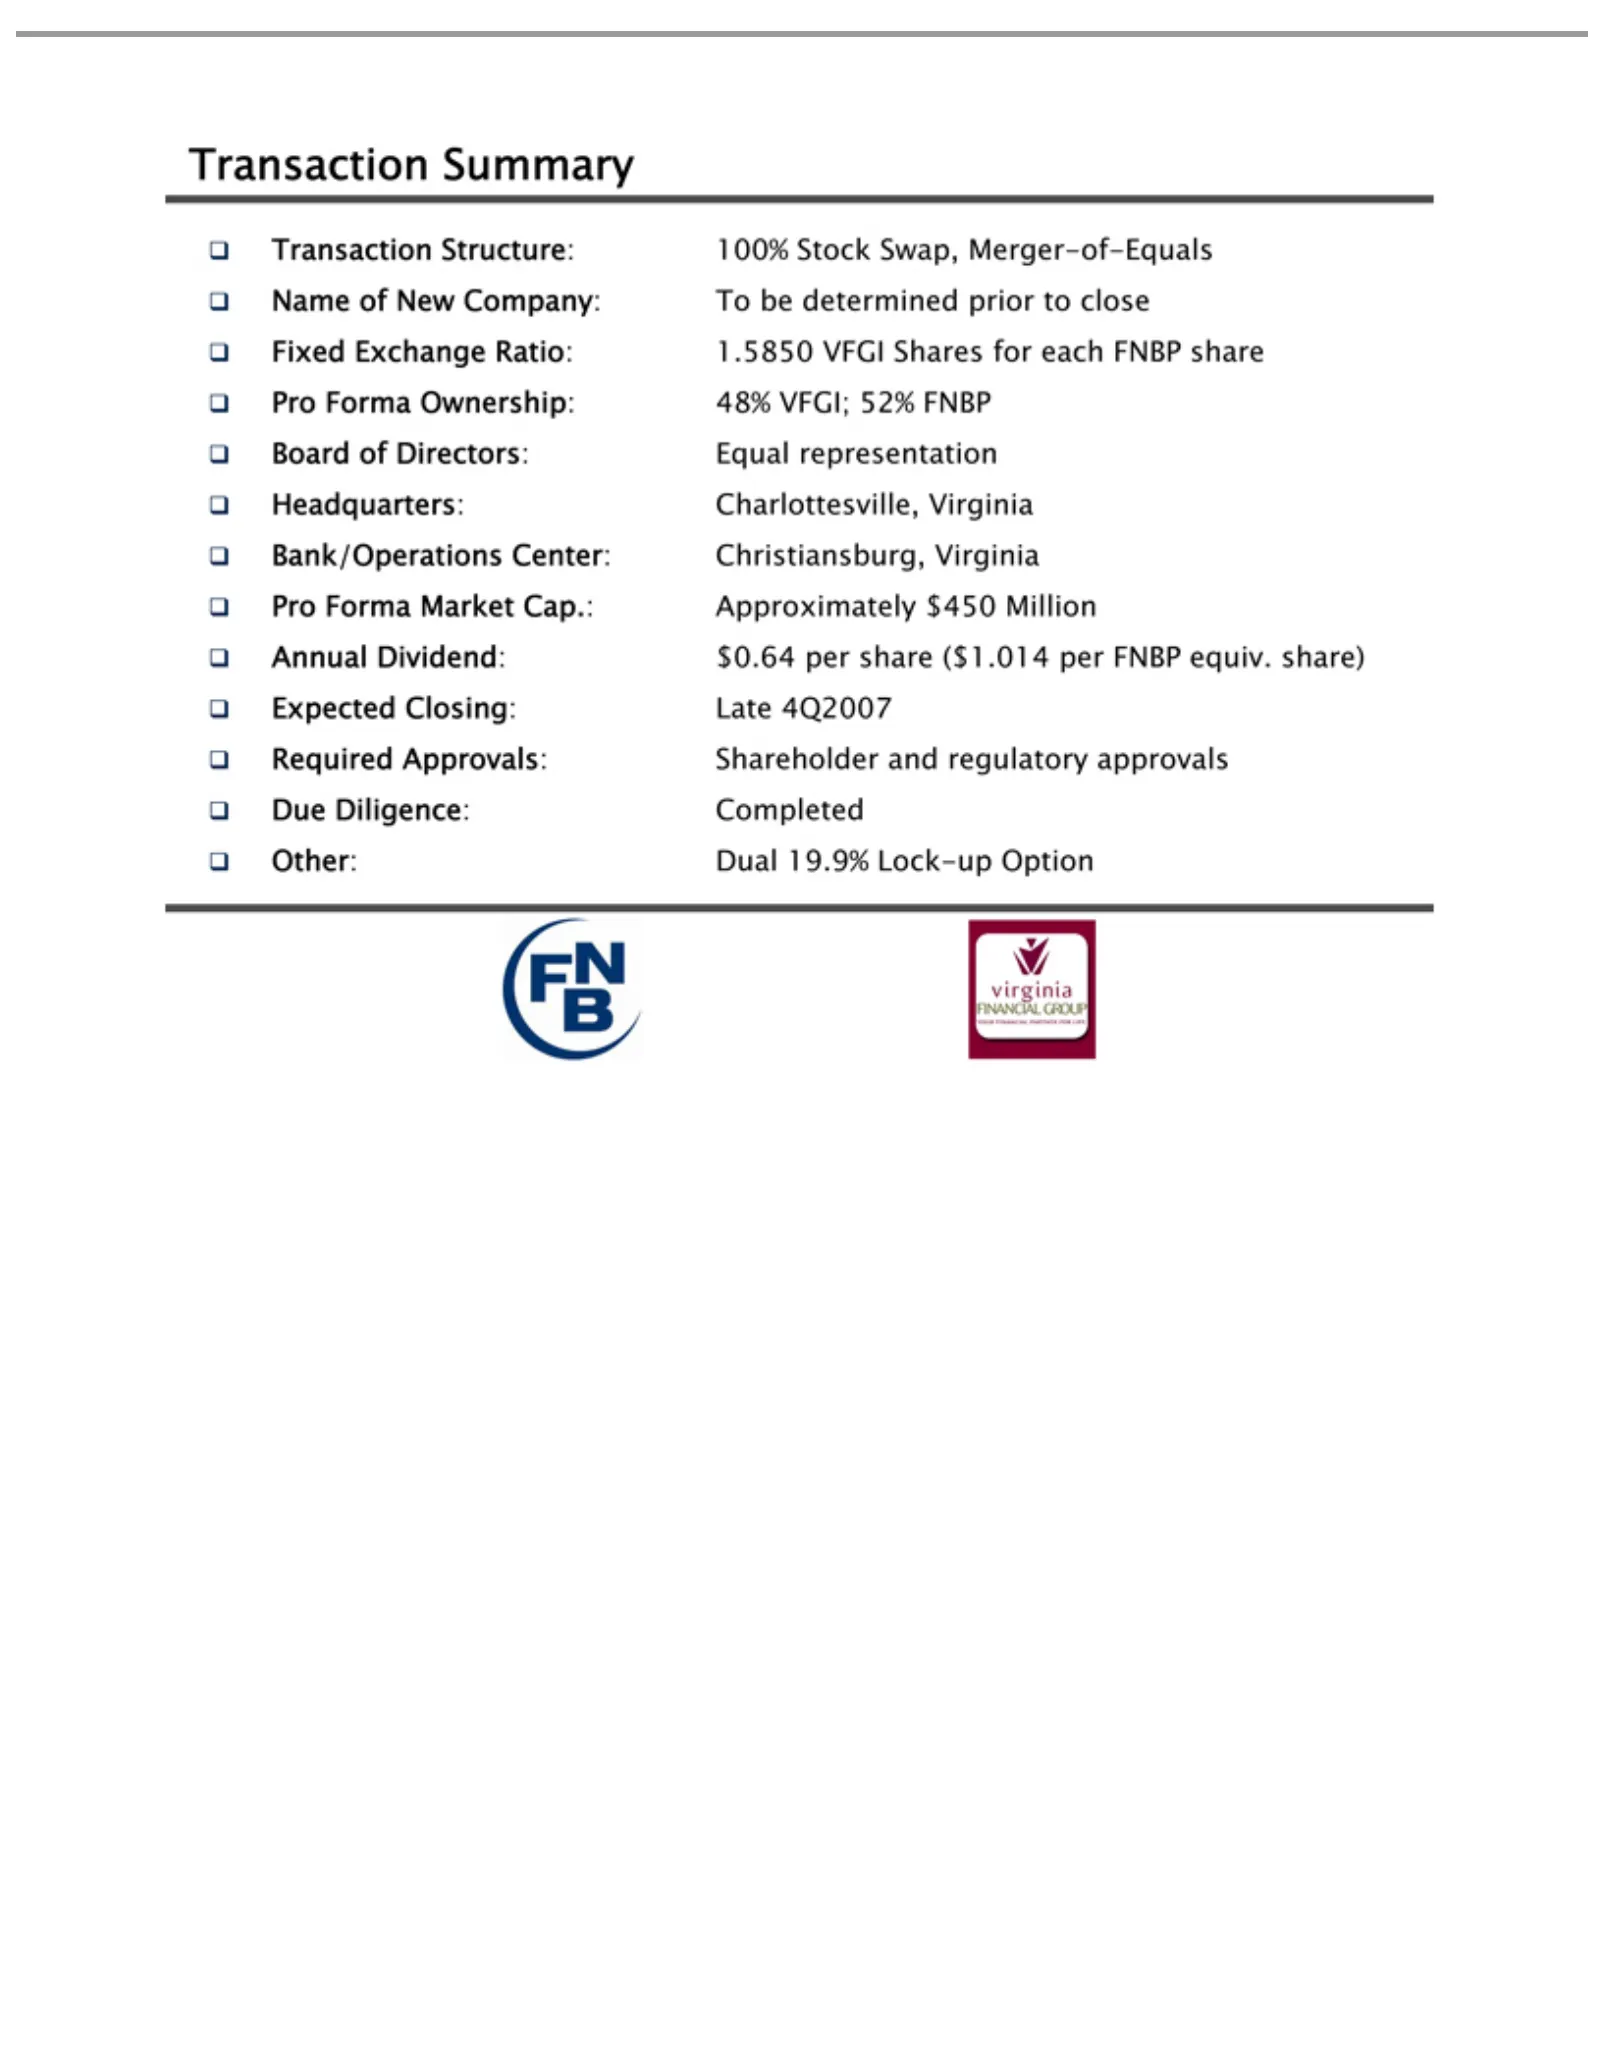
Slide 3: Transaction Summary
Transaction Name Fixed Board Headquarters: Bank/Operations Pro Annual Expected Required Due Other: Forma Diligence: Exchange of Dual Dividend: New Directors: Approvals: Closing: Ownership: Market Summary Structure: 19.9% Charlottesville, Company: Completed Ratio: Center: $0.64 Late Cap.: Lock-up Equ
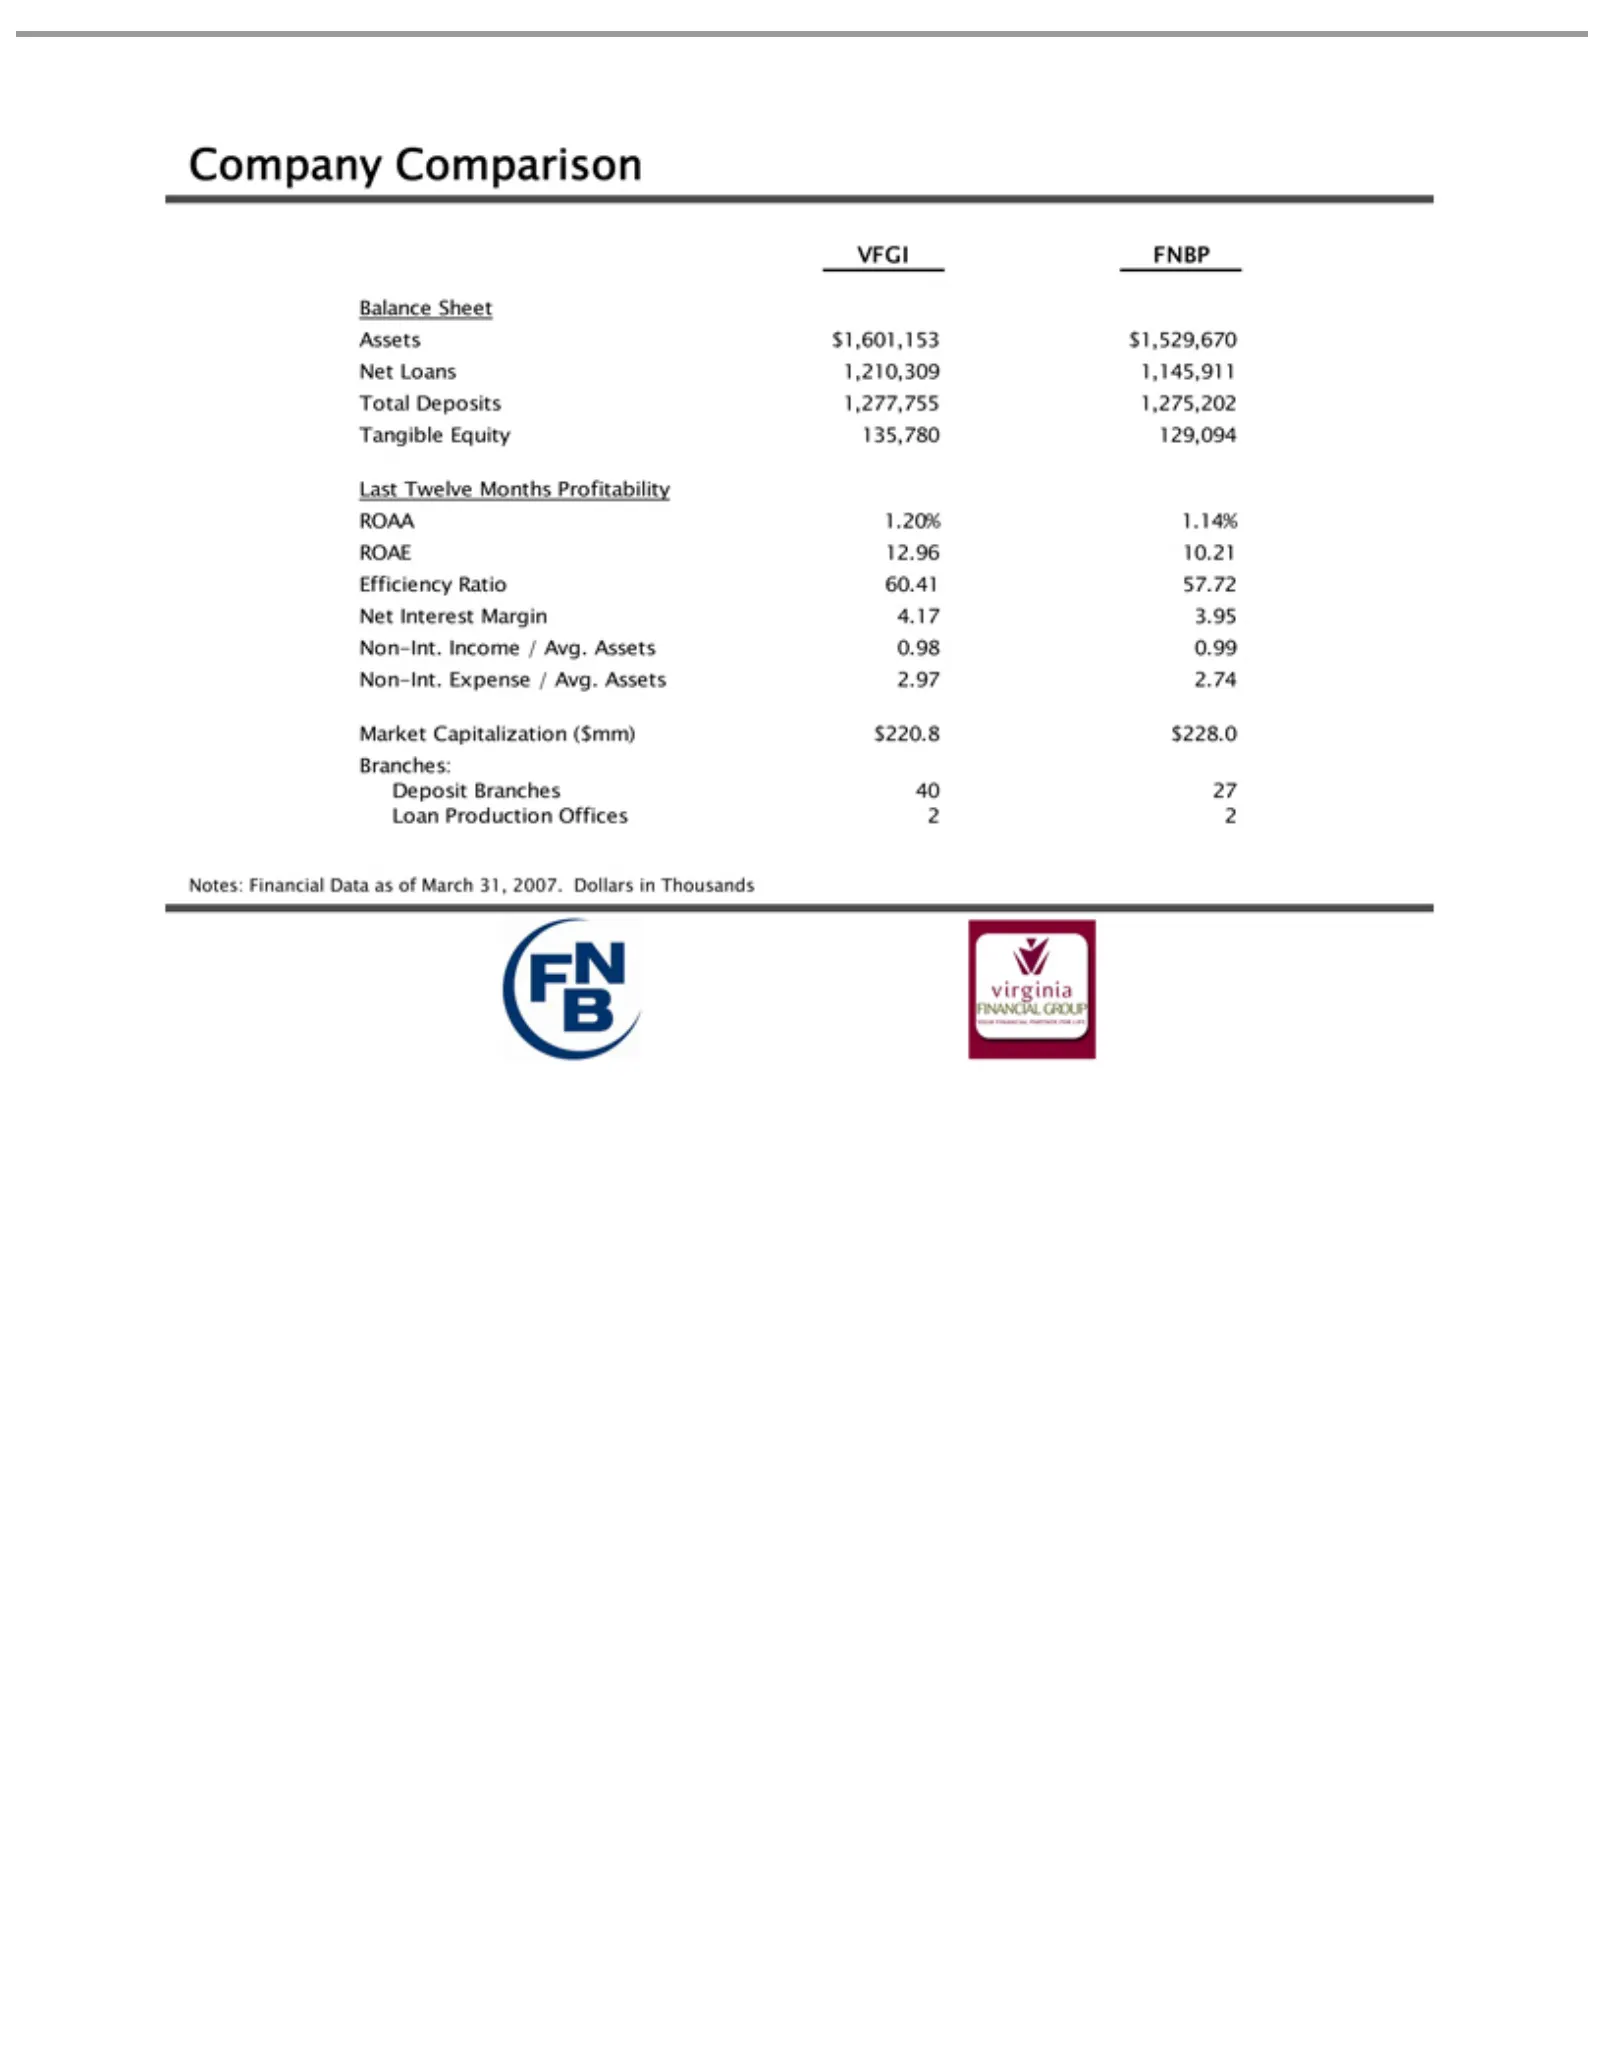
Slide 4: Company Comparison
Company VFGI Balance Assets Last ROAA Market Notes: Twelve FNBP Financial $1,601,153 1.20% Capitalization Sheet Comparison Months 1.14% Data $1,529,670 Profitability ROAE as ($mm) of March 12.96 $220.8 Net 31, Loans 10.21 $228.0 2007. Efficiency 1,210,309 Branches: Dollars 1,145,911 Ratio in Thousan
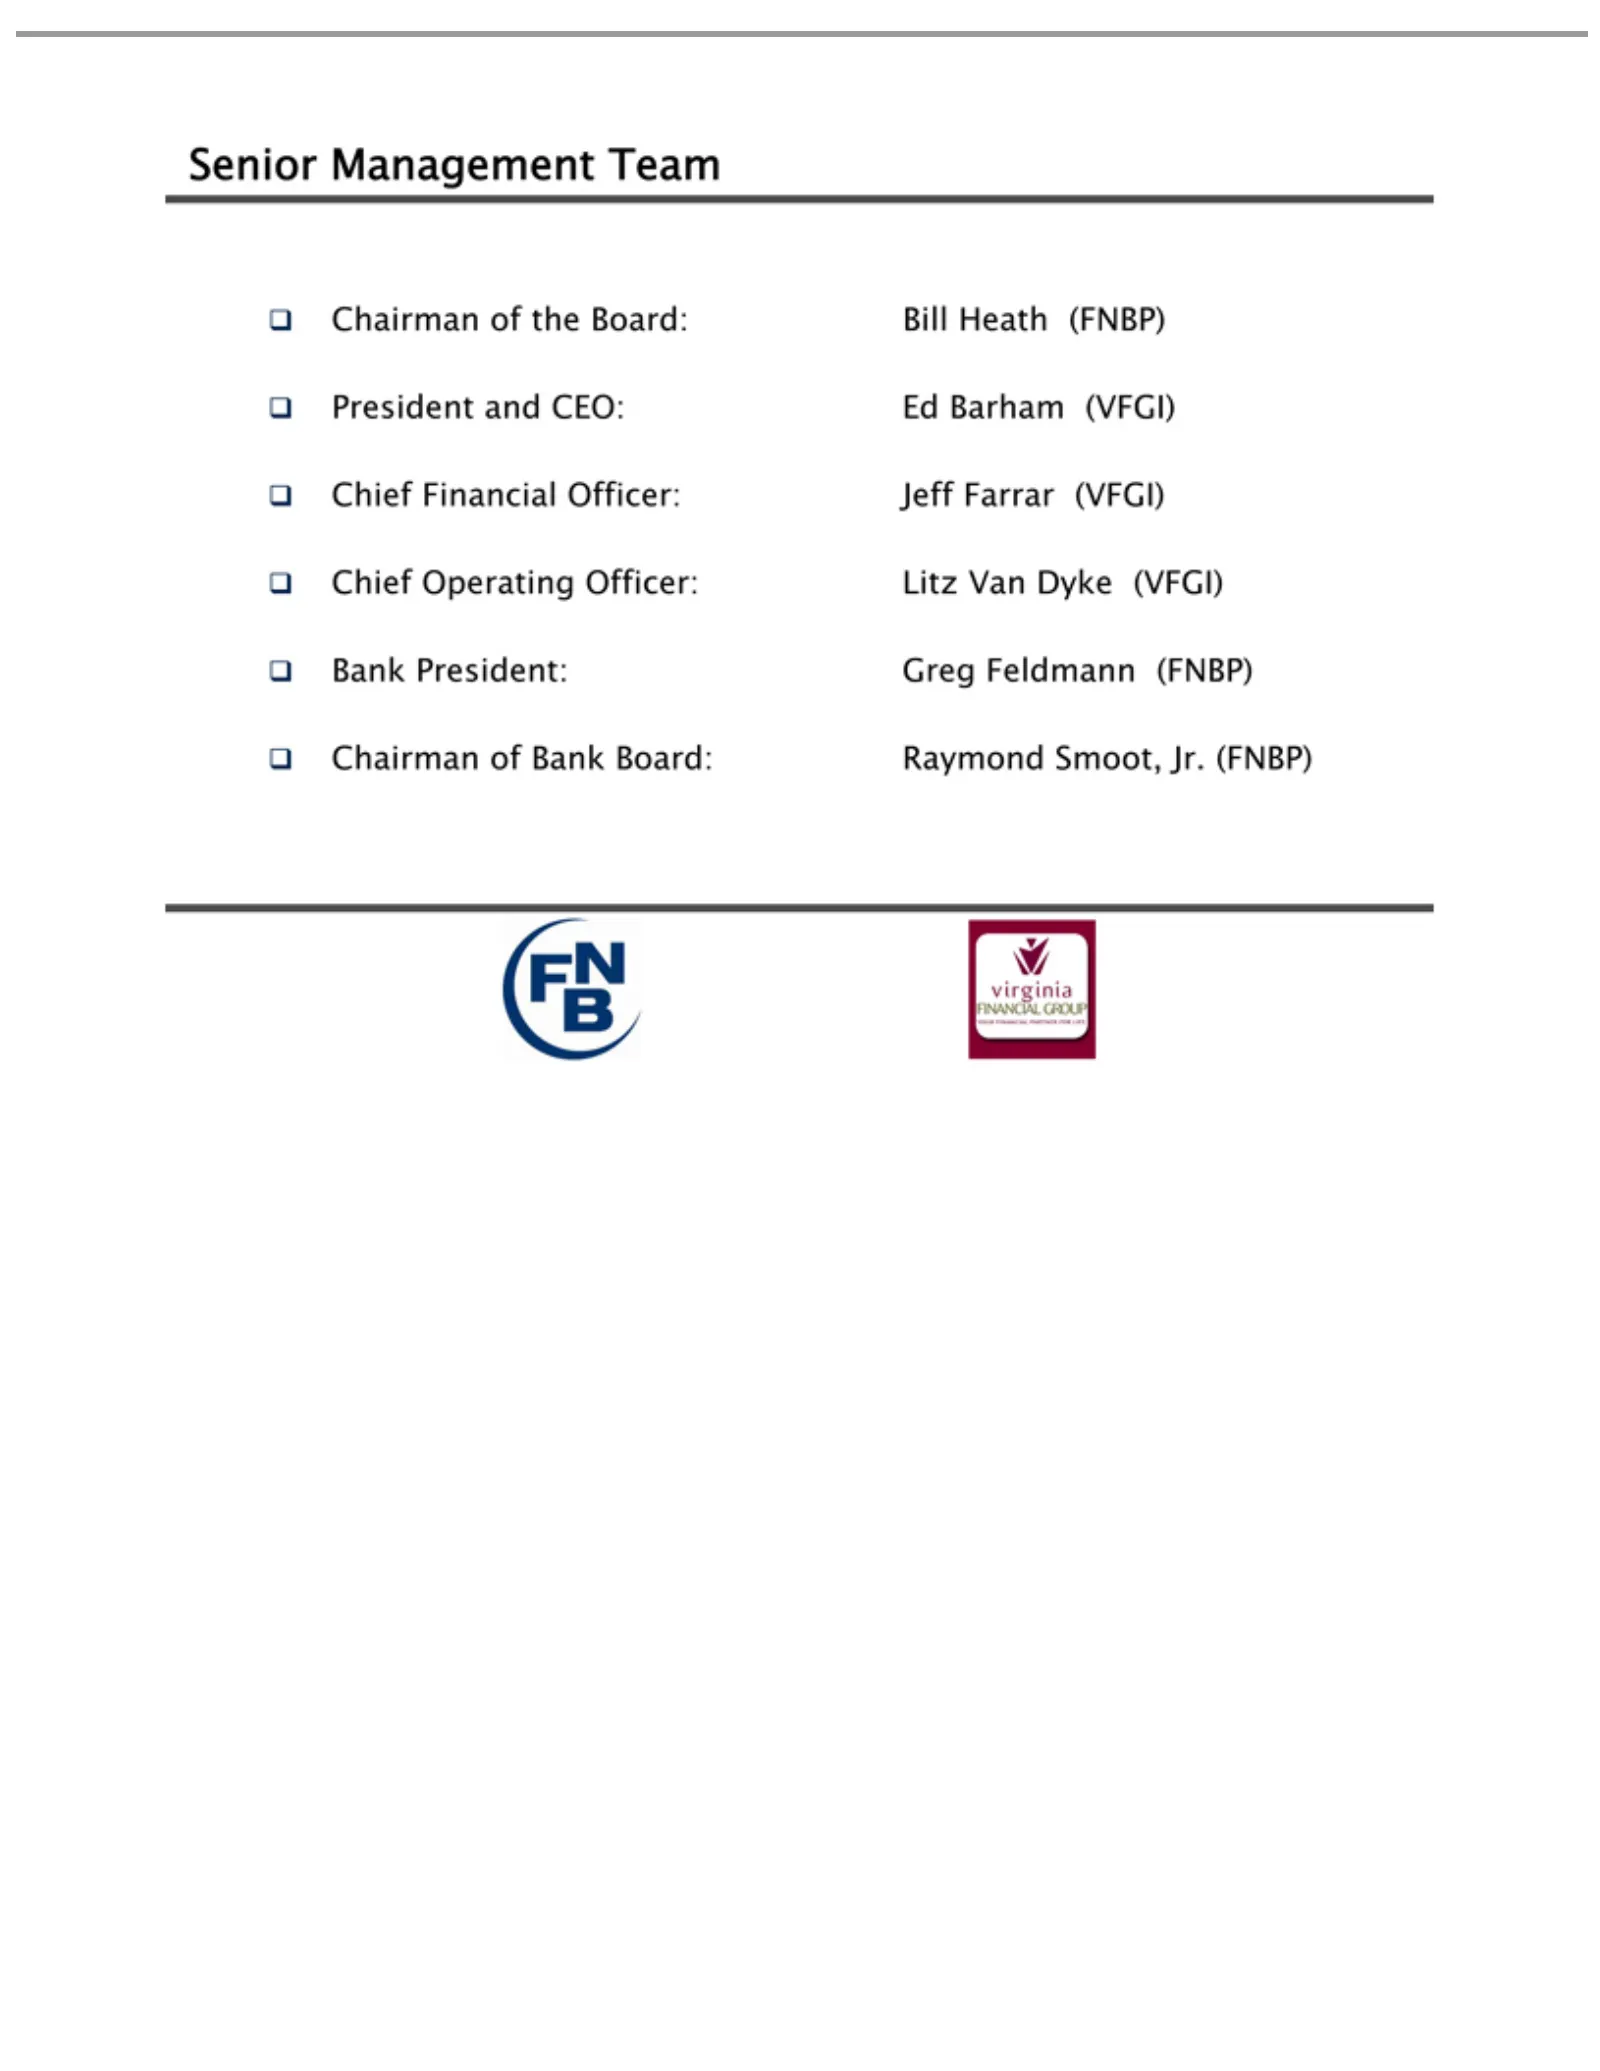
Slide 5: Senior Management Team
SeniorPresident: President Chief Bank Chairman Financial Operating Management and of Bank the CEO: Officer: Greg Officer: Board: Board: Ed Team Feldmann Barham Bill Jeff Litz Raymond Heath Farrar Van (VFGI) (FNBP) Dyke (FNBP) (VFGI) Smoot, (VFGI) Jr. (FNBP)
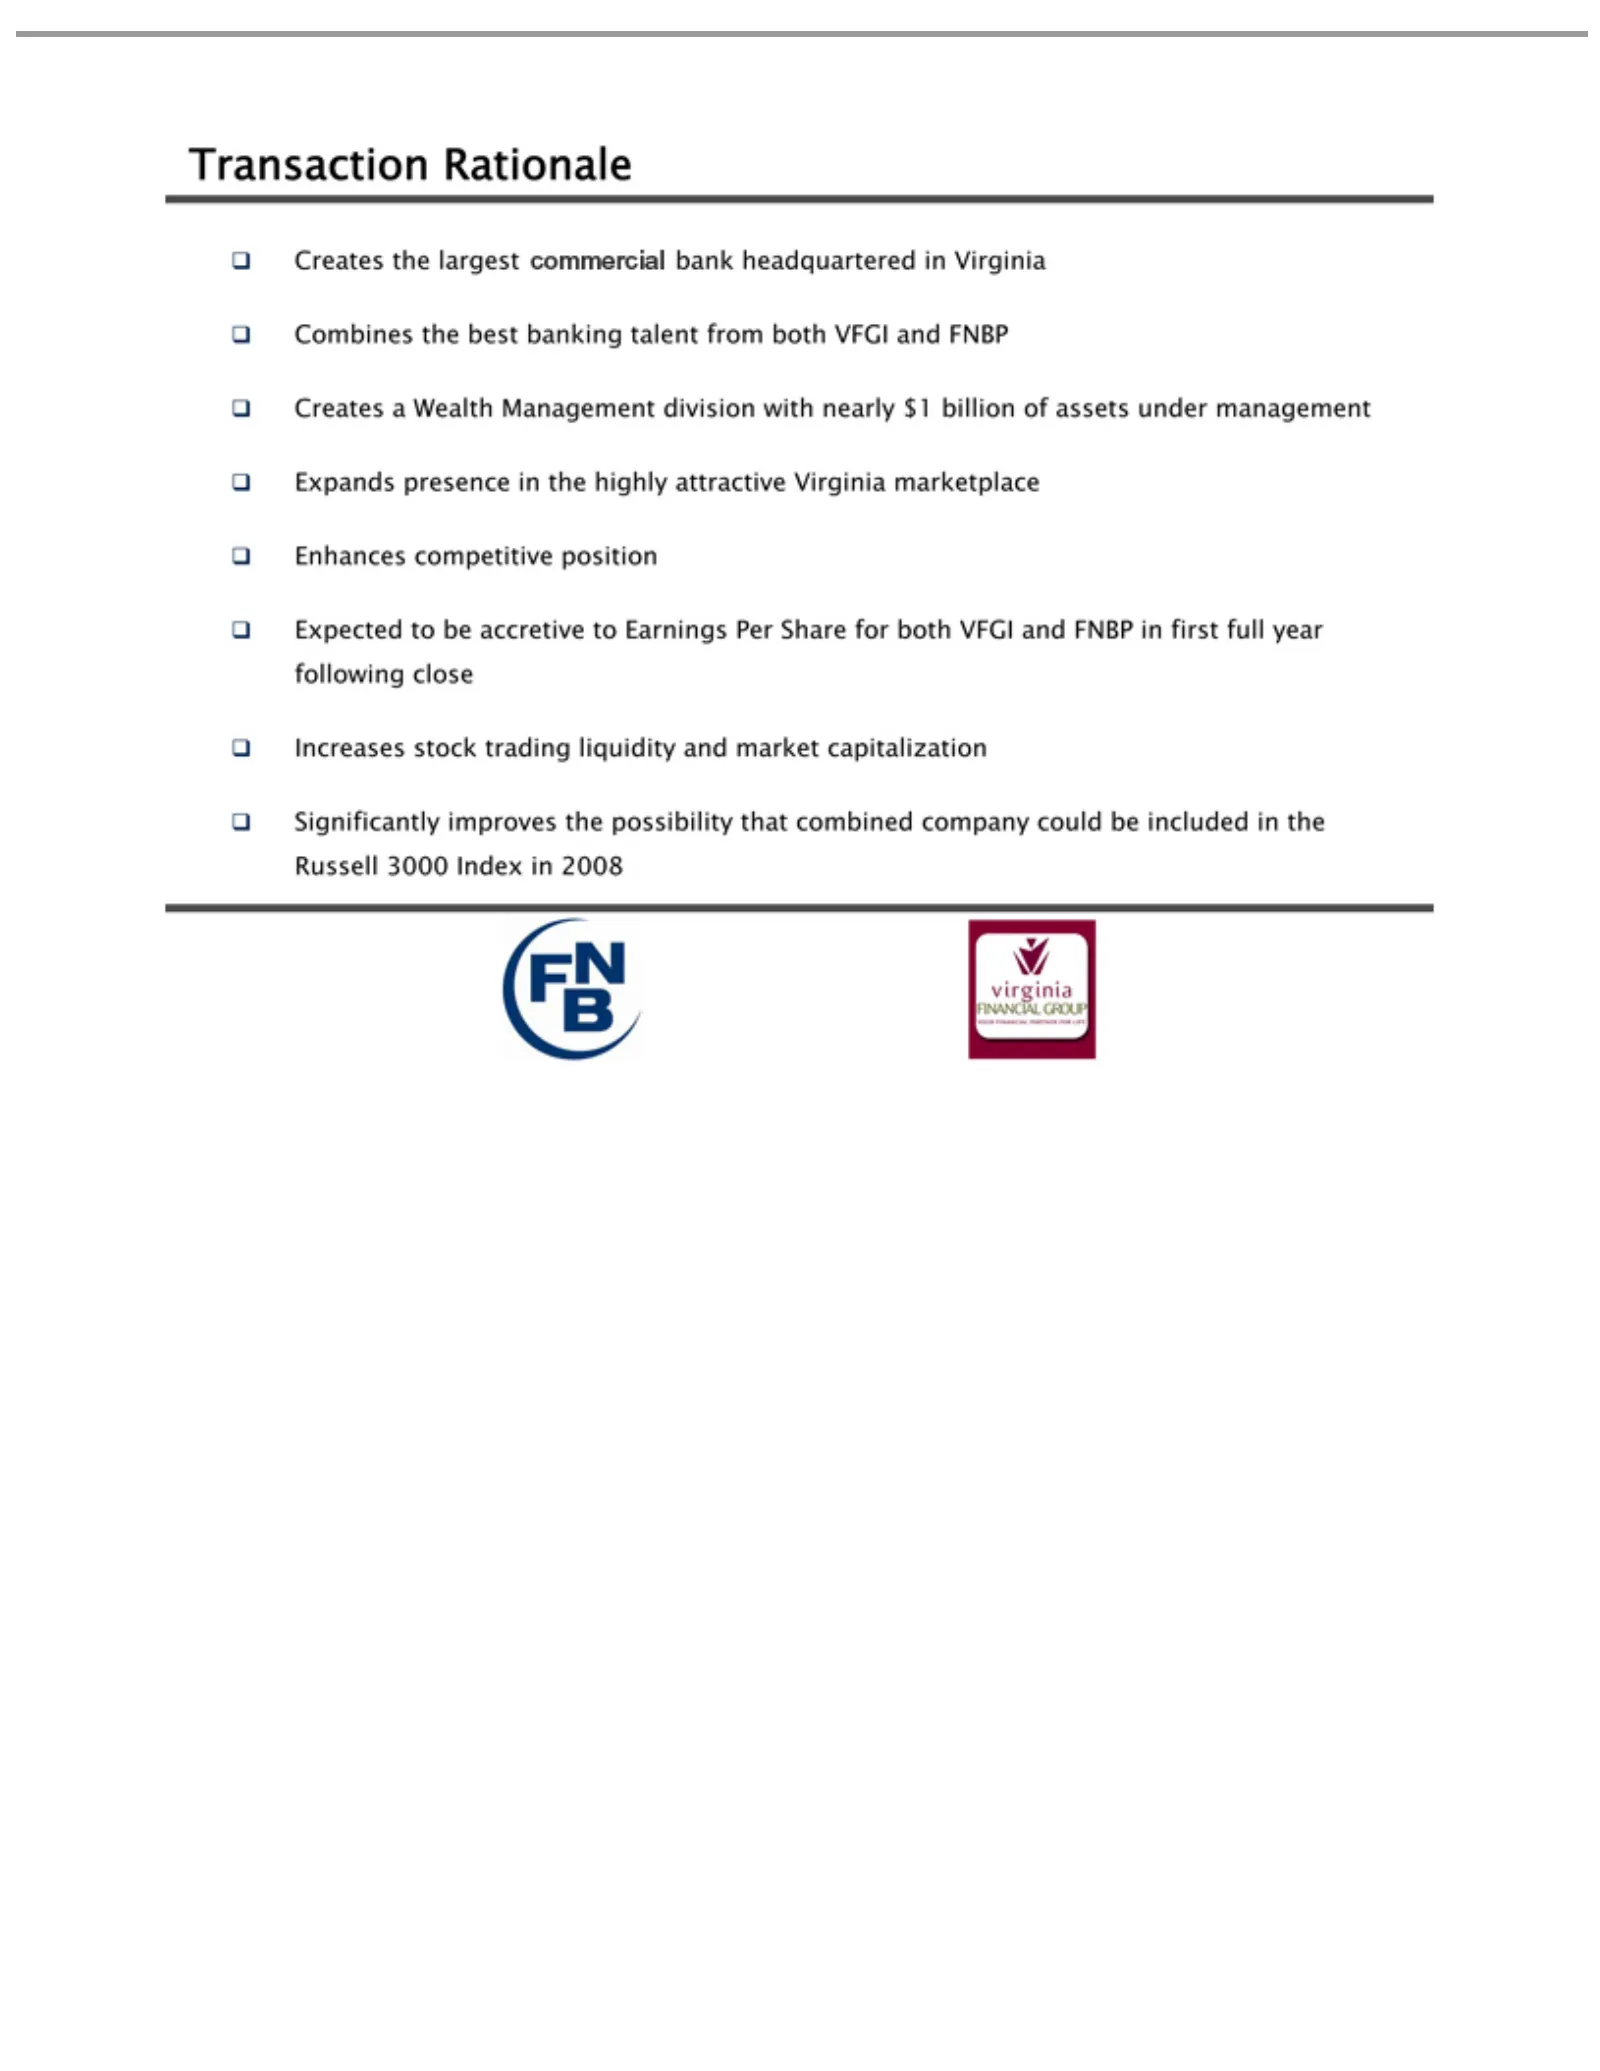
Slide 6: Transaction Rationale
Transaction Combines Creates Expands Enhances Expected Increases Significantly athe presence Wealth stock to competitive the largest Rationale be improves best accretive trading Management in independent banking the position the liquidity highly to possibility Earnings talent division attractive ban
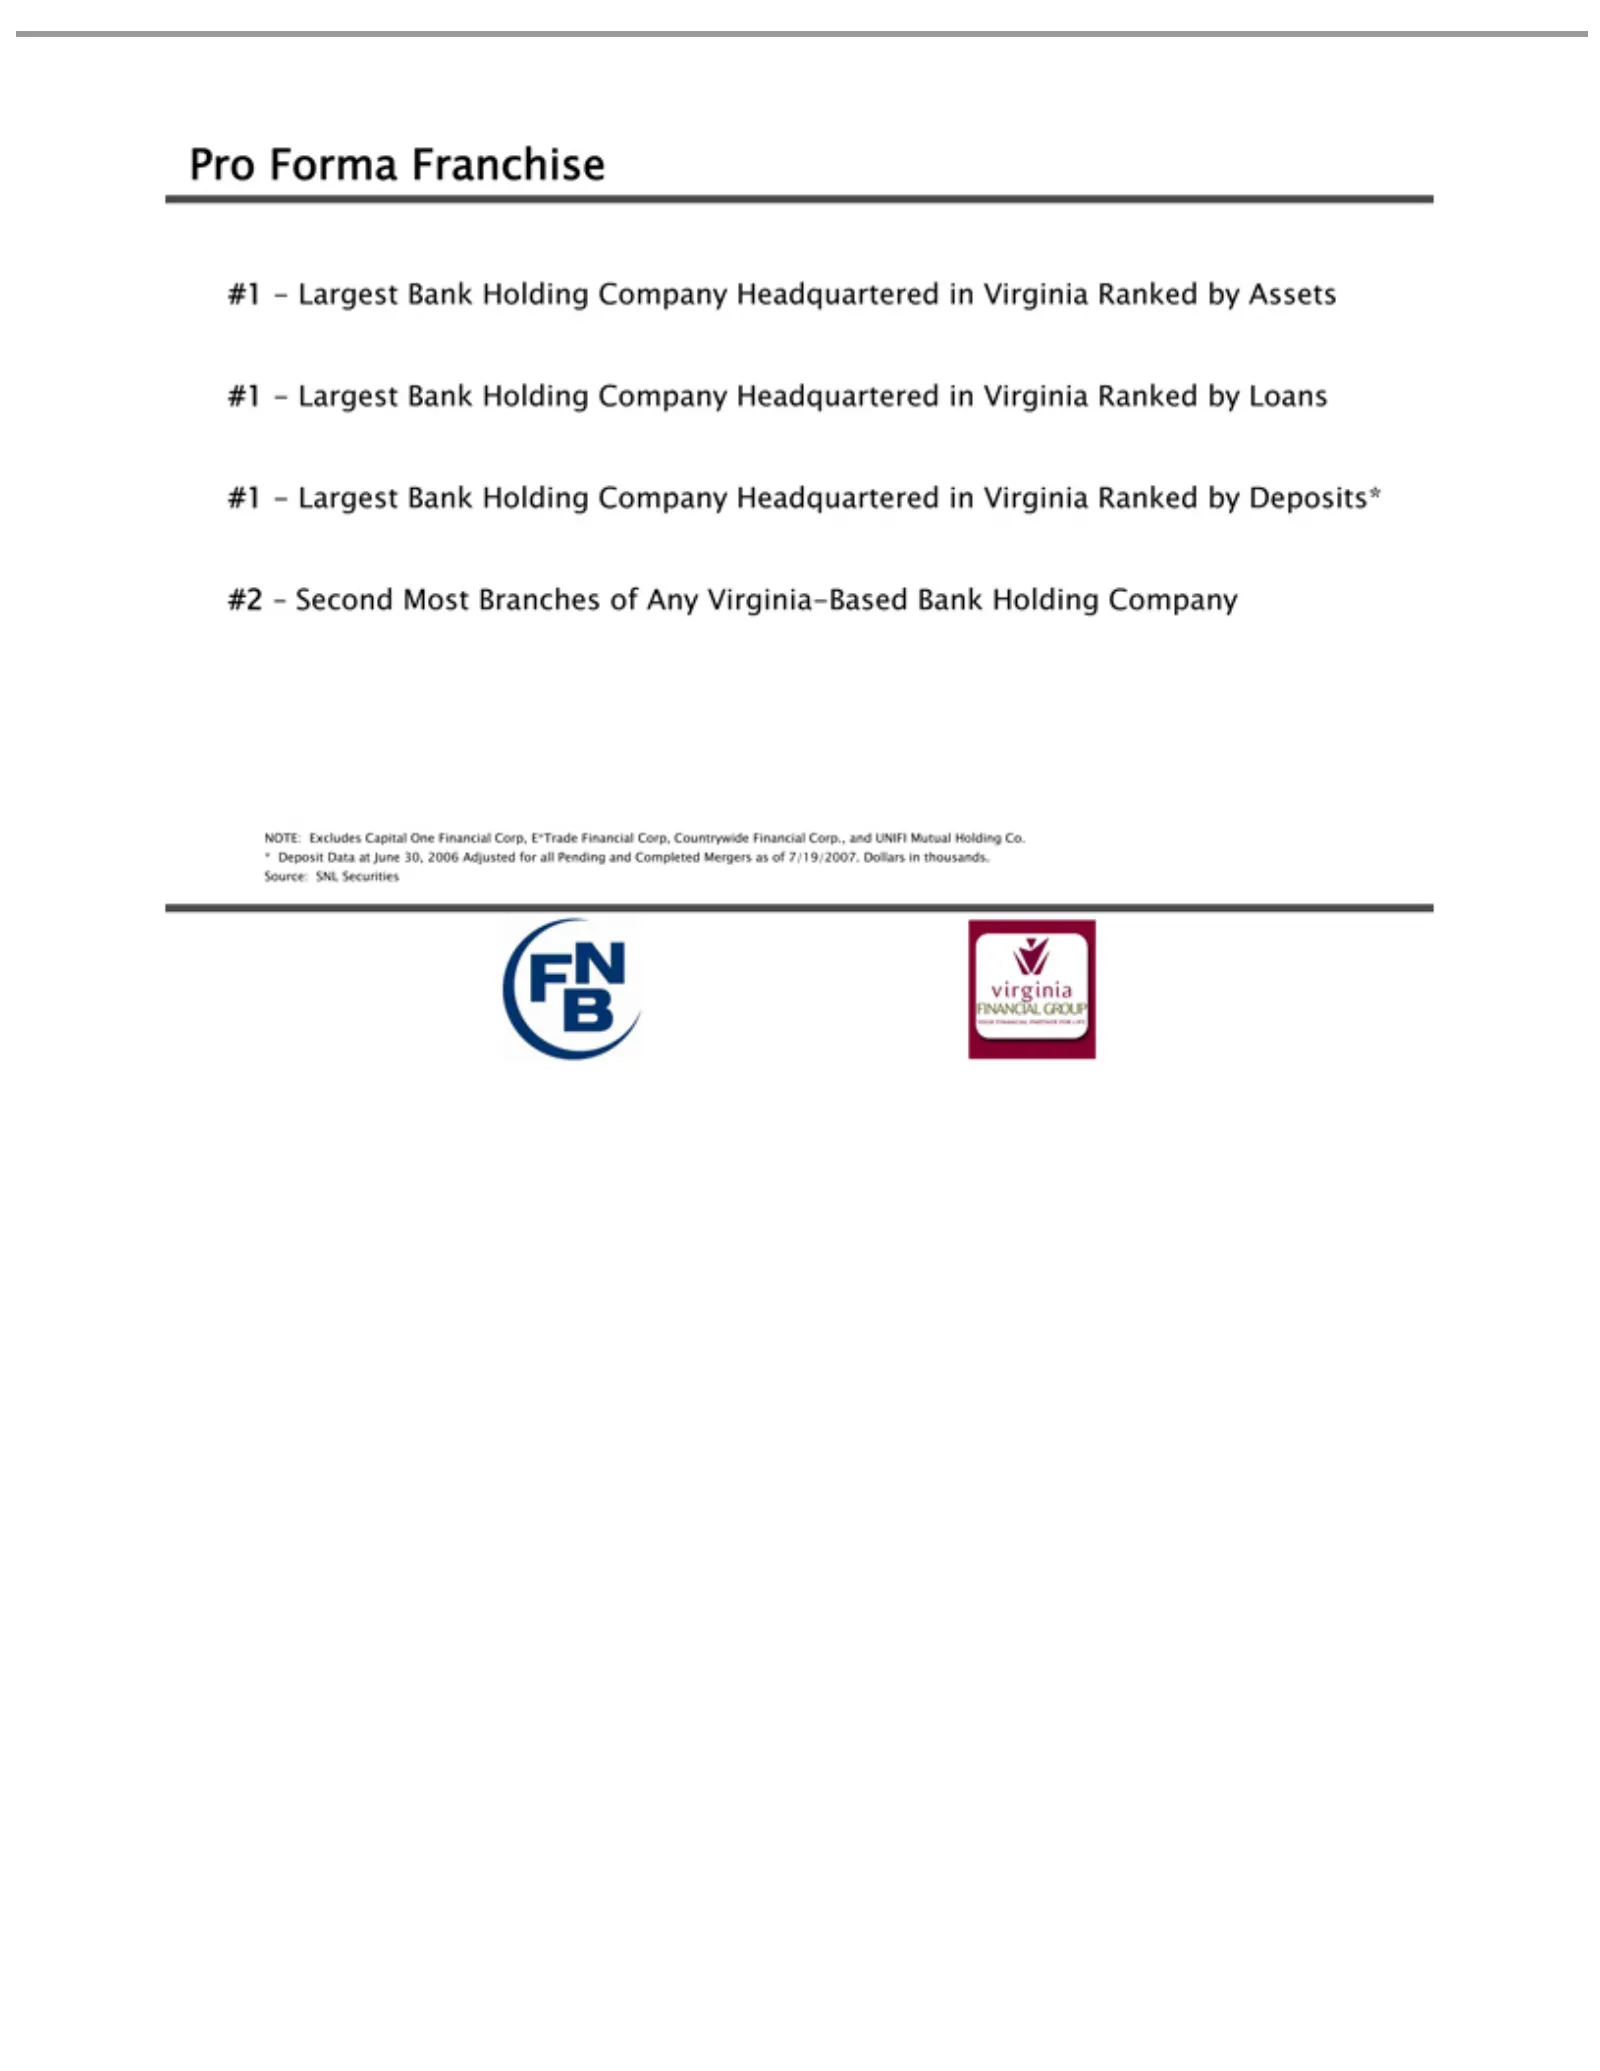
Slide 7: Pro Forma Franchise Ranking
Pro #1—Largest #2—Second NOTE: * Source: Deposit Forma Excludes SNL Data Franchise Most Bank Securities at Capital June Branches Holding 30,One 2006 Company ofFinancial Any Adjusted Virginia-Based Headquartered Corp, for all E*Trade Pending Bank in Financial Virginia and Holding Completed Ranked Cor
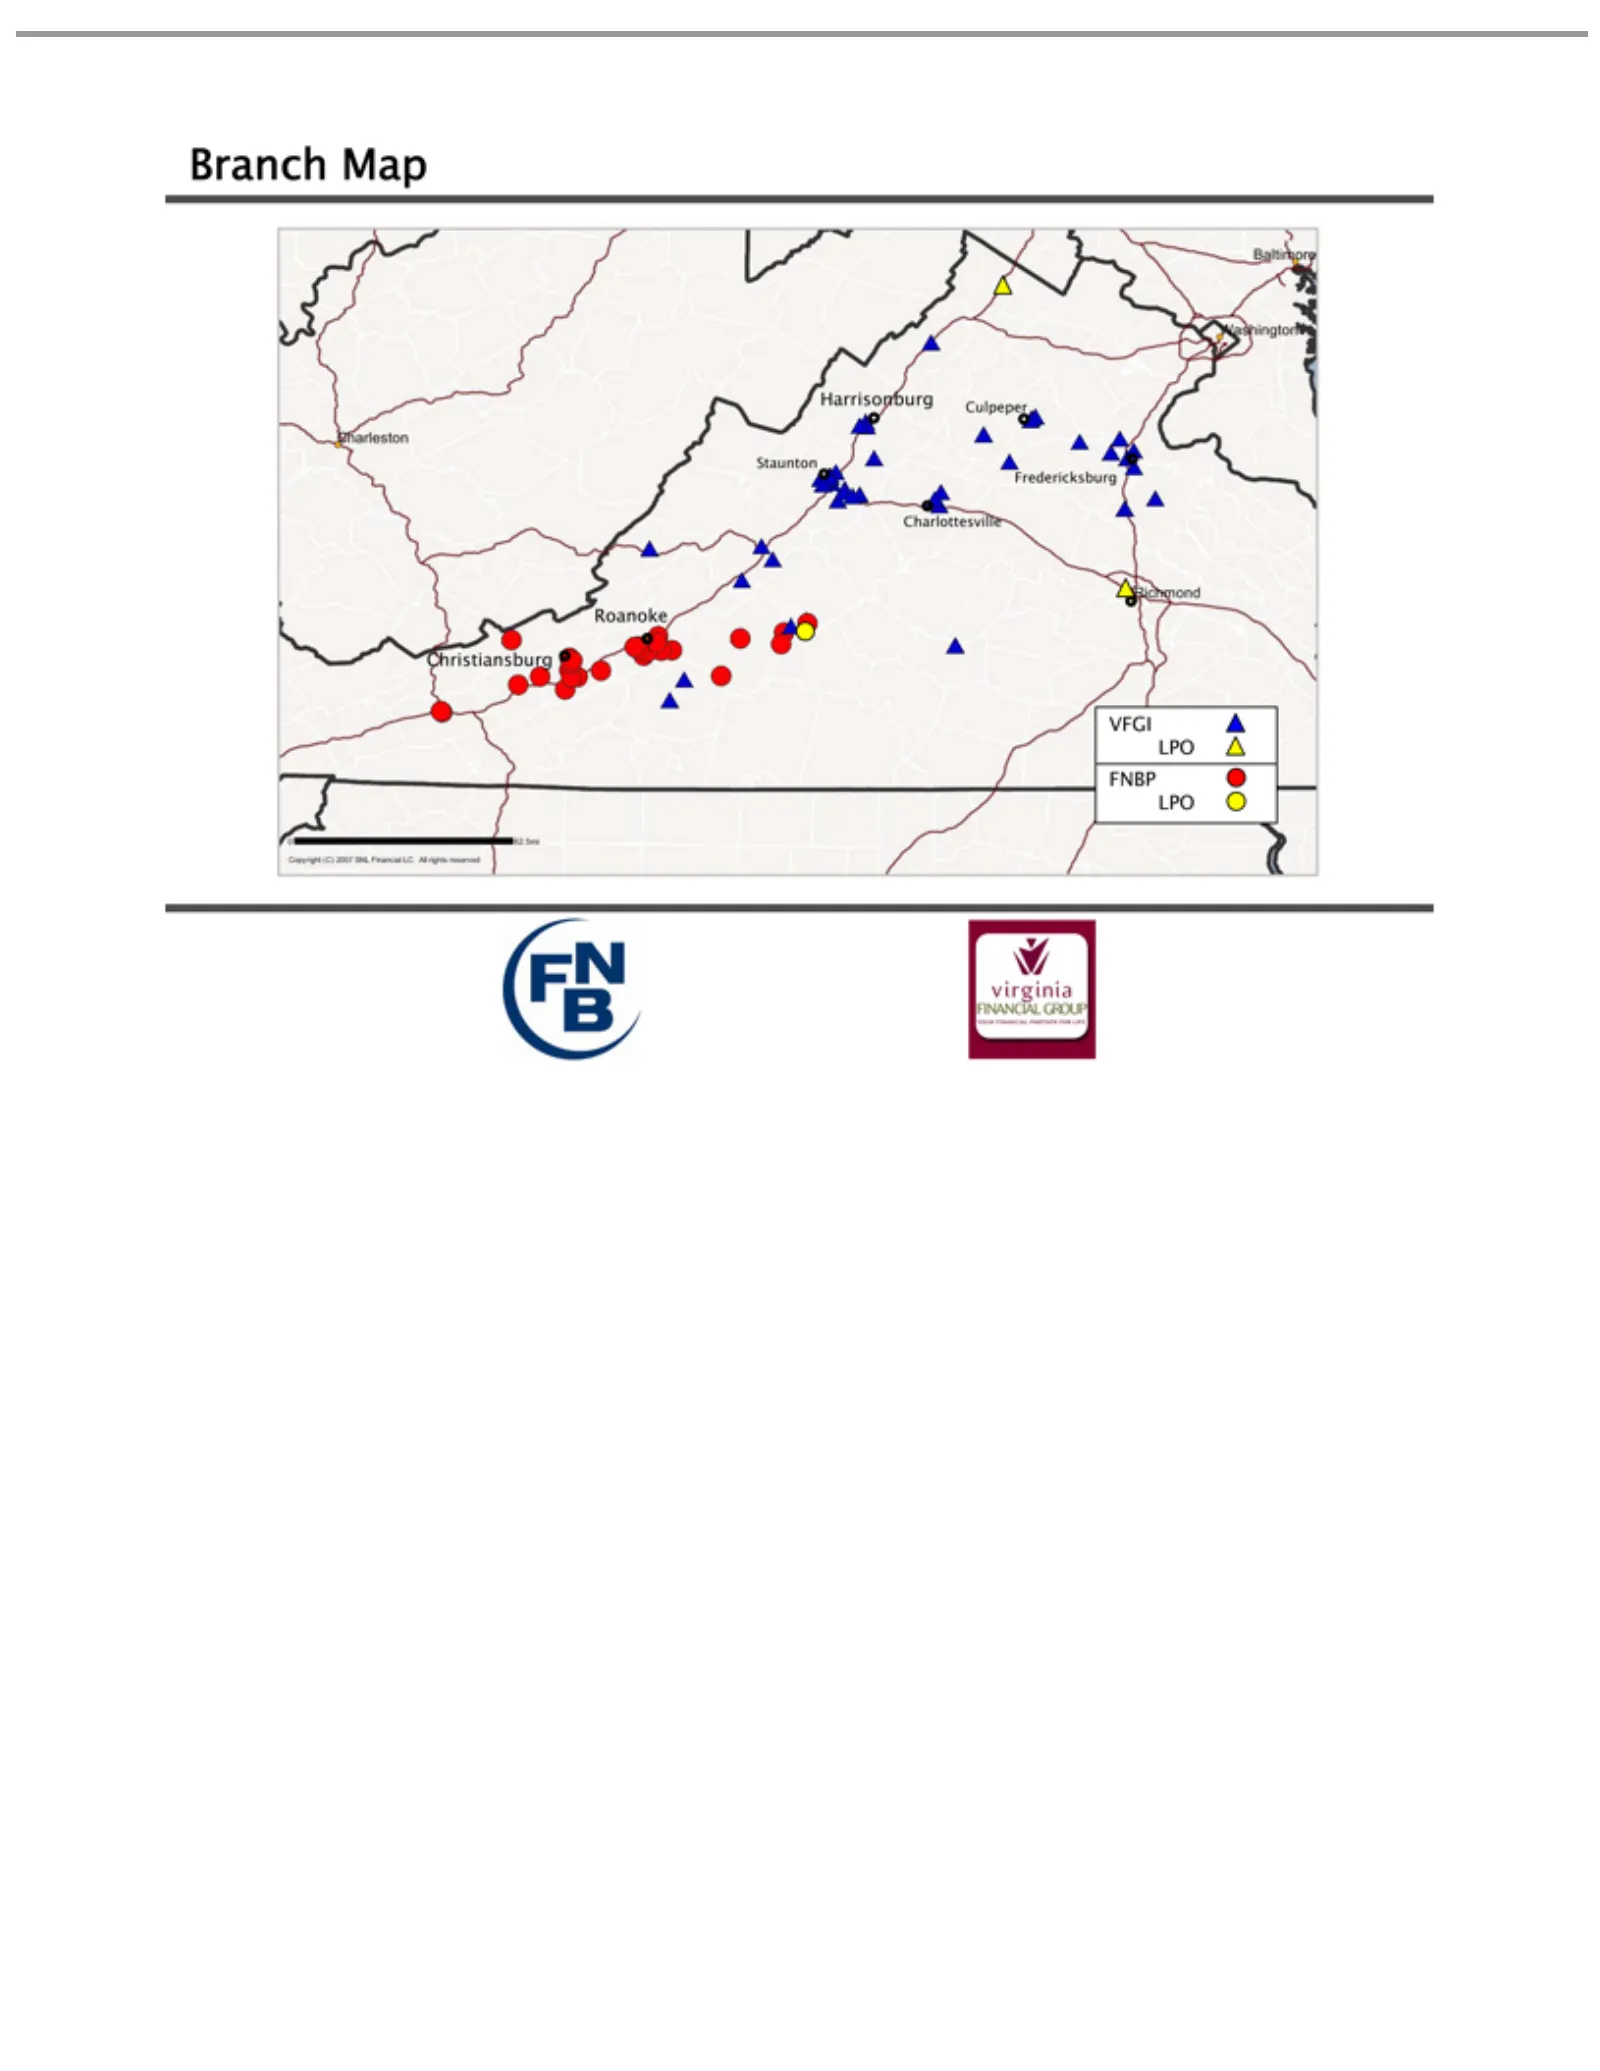
Slide 8: Branch Map
Branch Harrisonburg VFGI Christiansburg Roanoke Charlottesville Fredericksburg Staunton LPO FNBP Map Culpeper
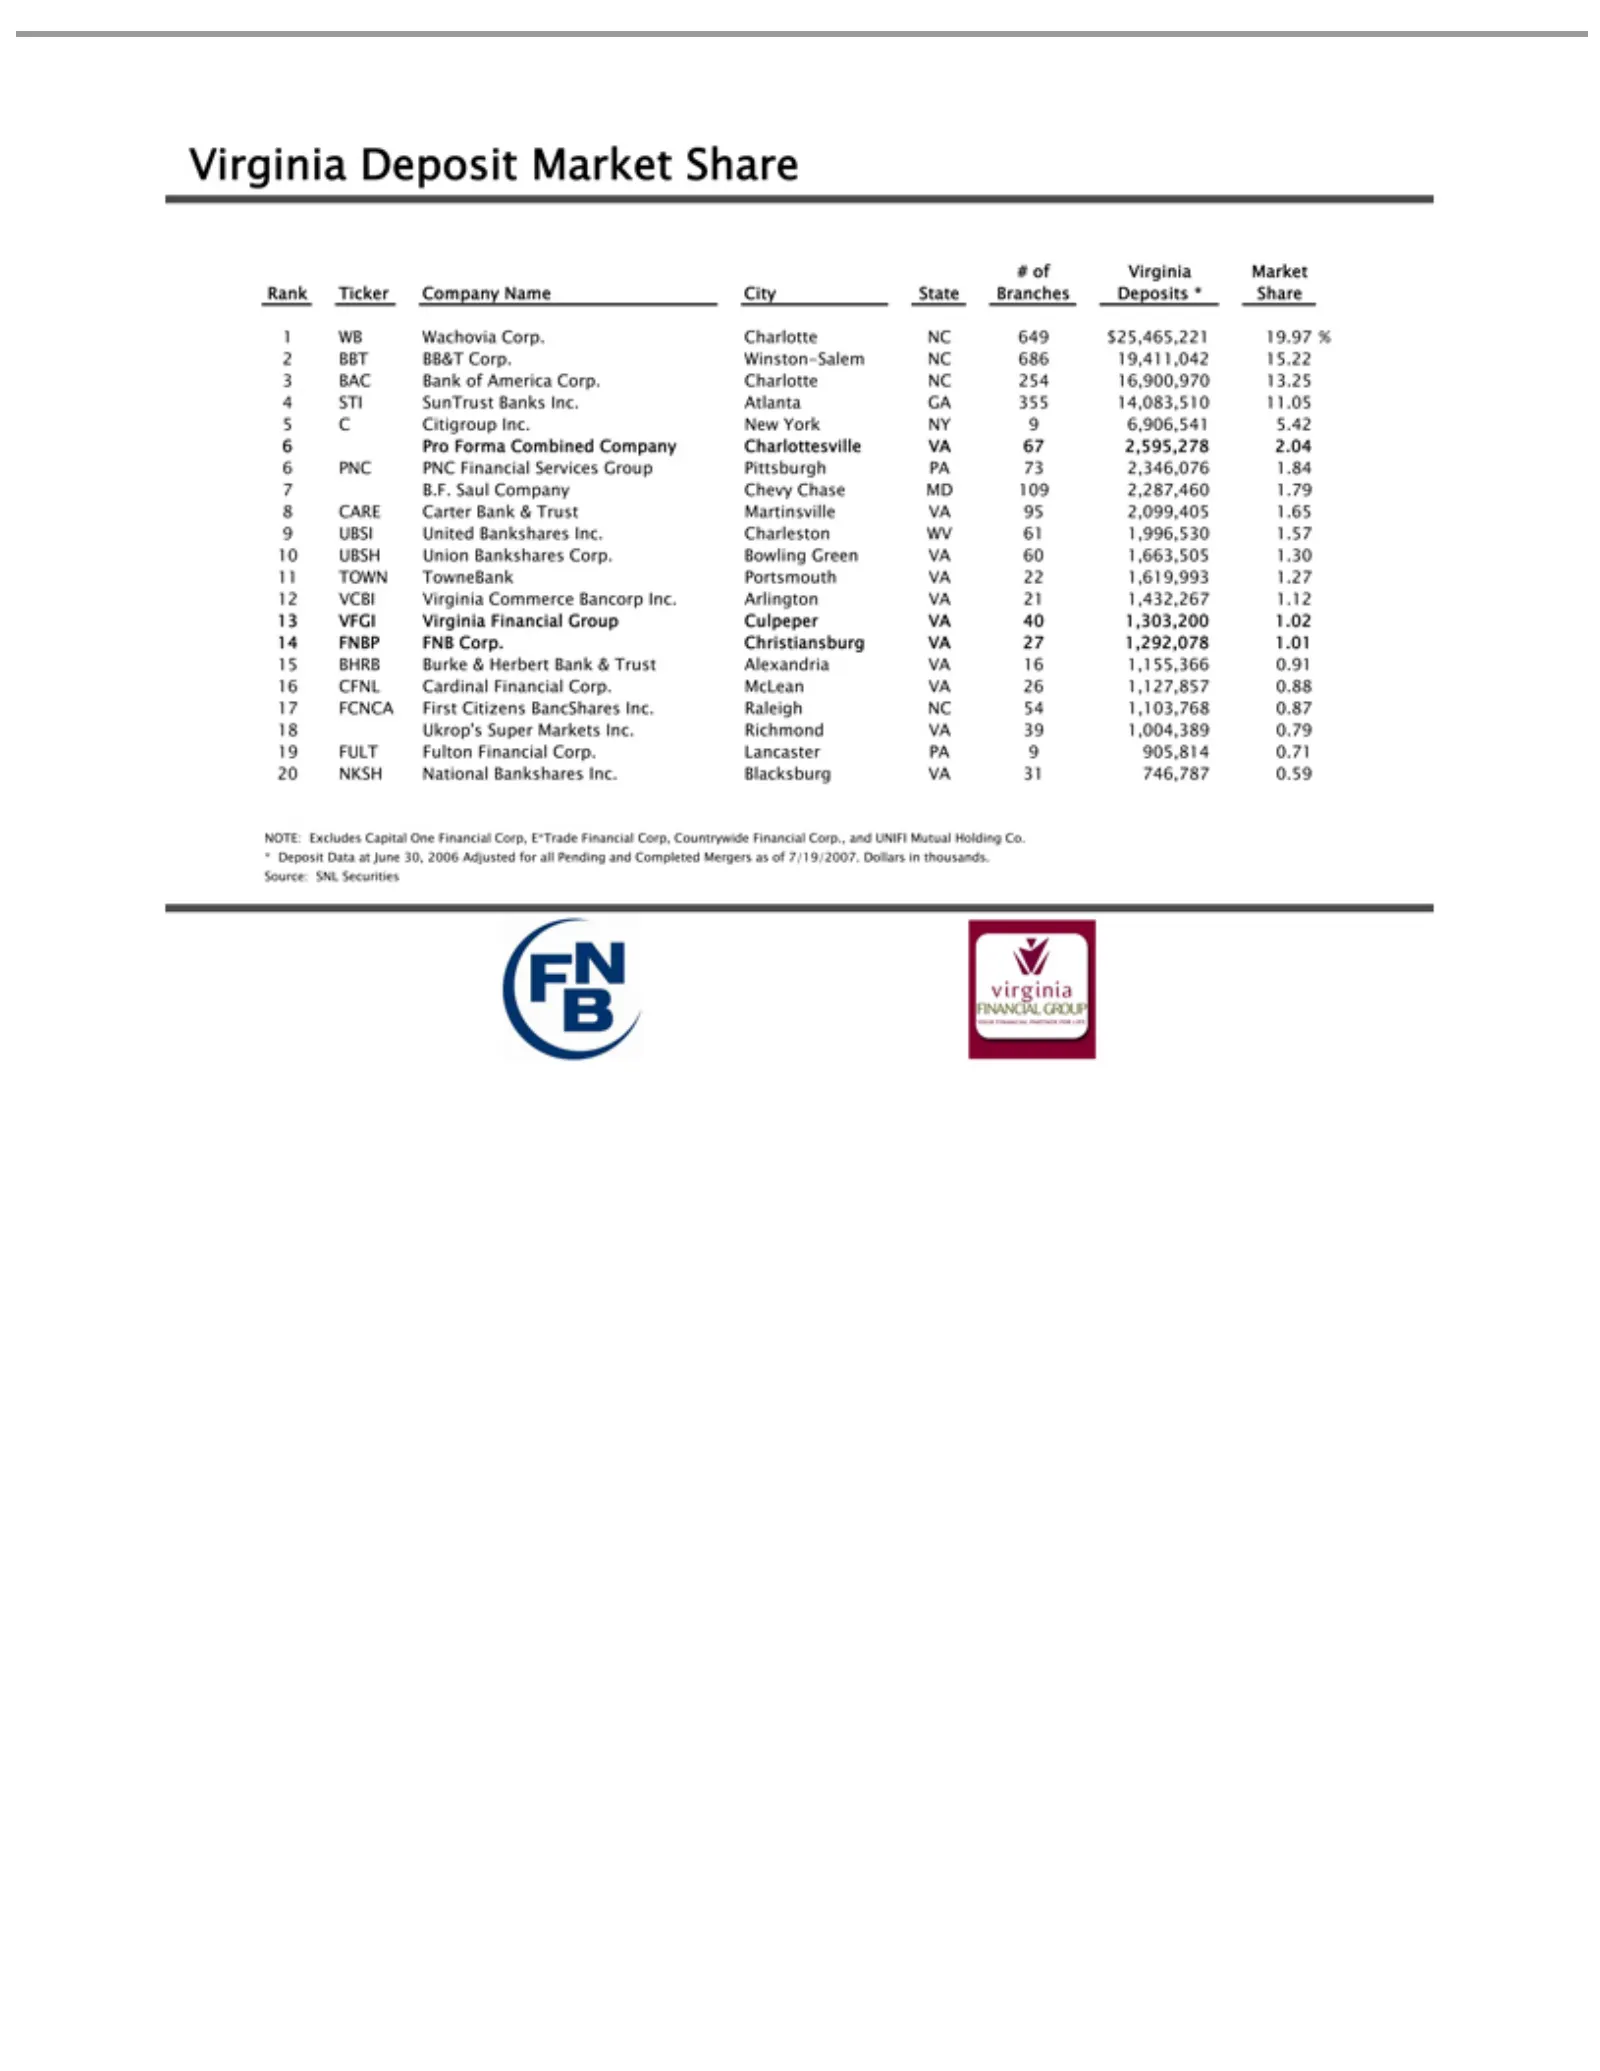
Slide 9: Virginia Deposit Market Share
Virginia # 1 2 3 4 5 6 7 8 9 10 11 12 13 14 15 16 17 18 19 20 NOTE: * Source: WB ofTOWN BBT BAC STI C Pro PNC B.F. CARE UBSI Deposit VCBI VFGI UBSH FNBP BHRB CFNL FCNCA Ukrop’s FULT NKSH Citigroup Virginia Forma SunTrust Wachovia Saul BB&T PNC Bank Excludes United SNL Deposit Carter Virginia Fulton
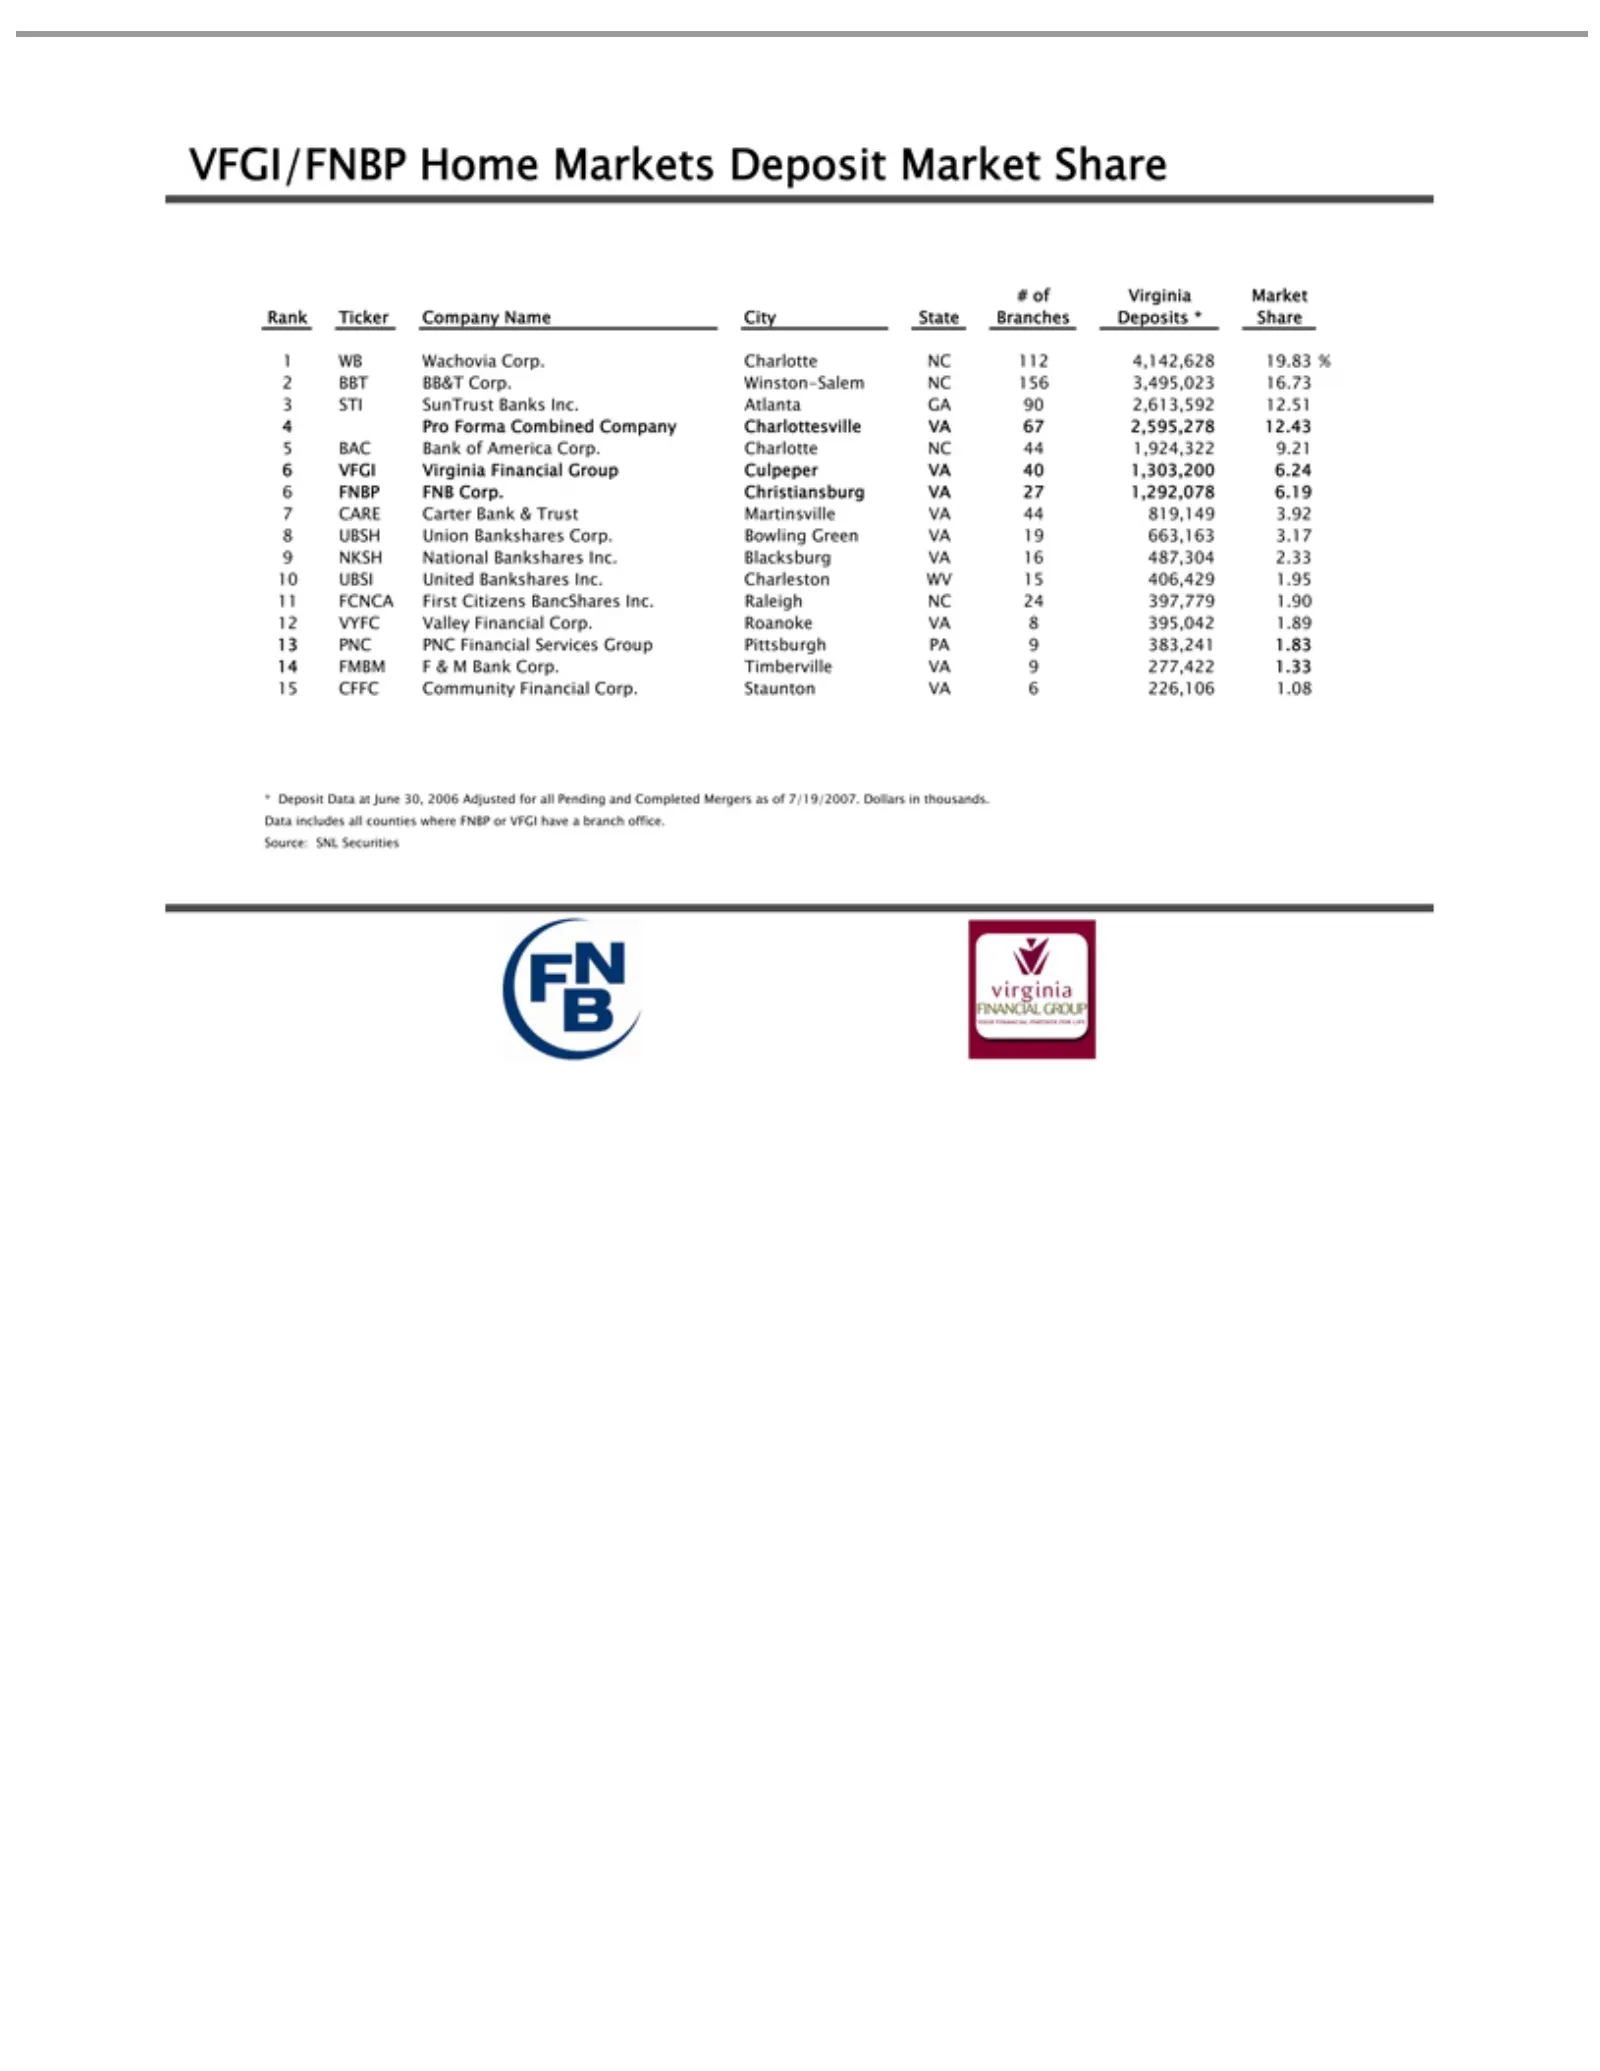
Slide 10: VFGI/FNBP Market Share Data
VFGI/FNBP # 1 2 3 4 5 6 7 8 9 10 11 12 13 14 15 * Data WB VFGI ofFCNCA BBT STI Pro BAC FNBP CARE UBSH NKSH Deposit VYFC UBSI PNC FMBM CFFC Virginia includes Forma SunTrust Wachovia BB&T Bank Virginia PNC FNB Carter Union National United Community Data Valley FFirst Combined & Market Home of Financia
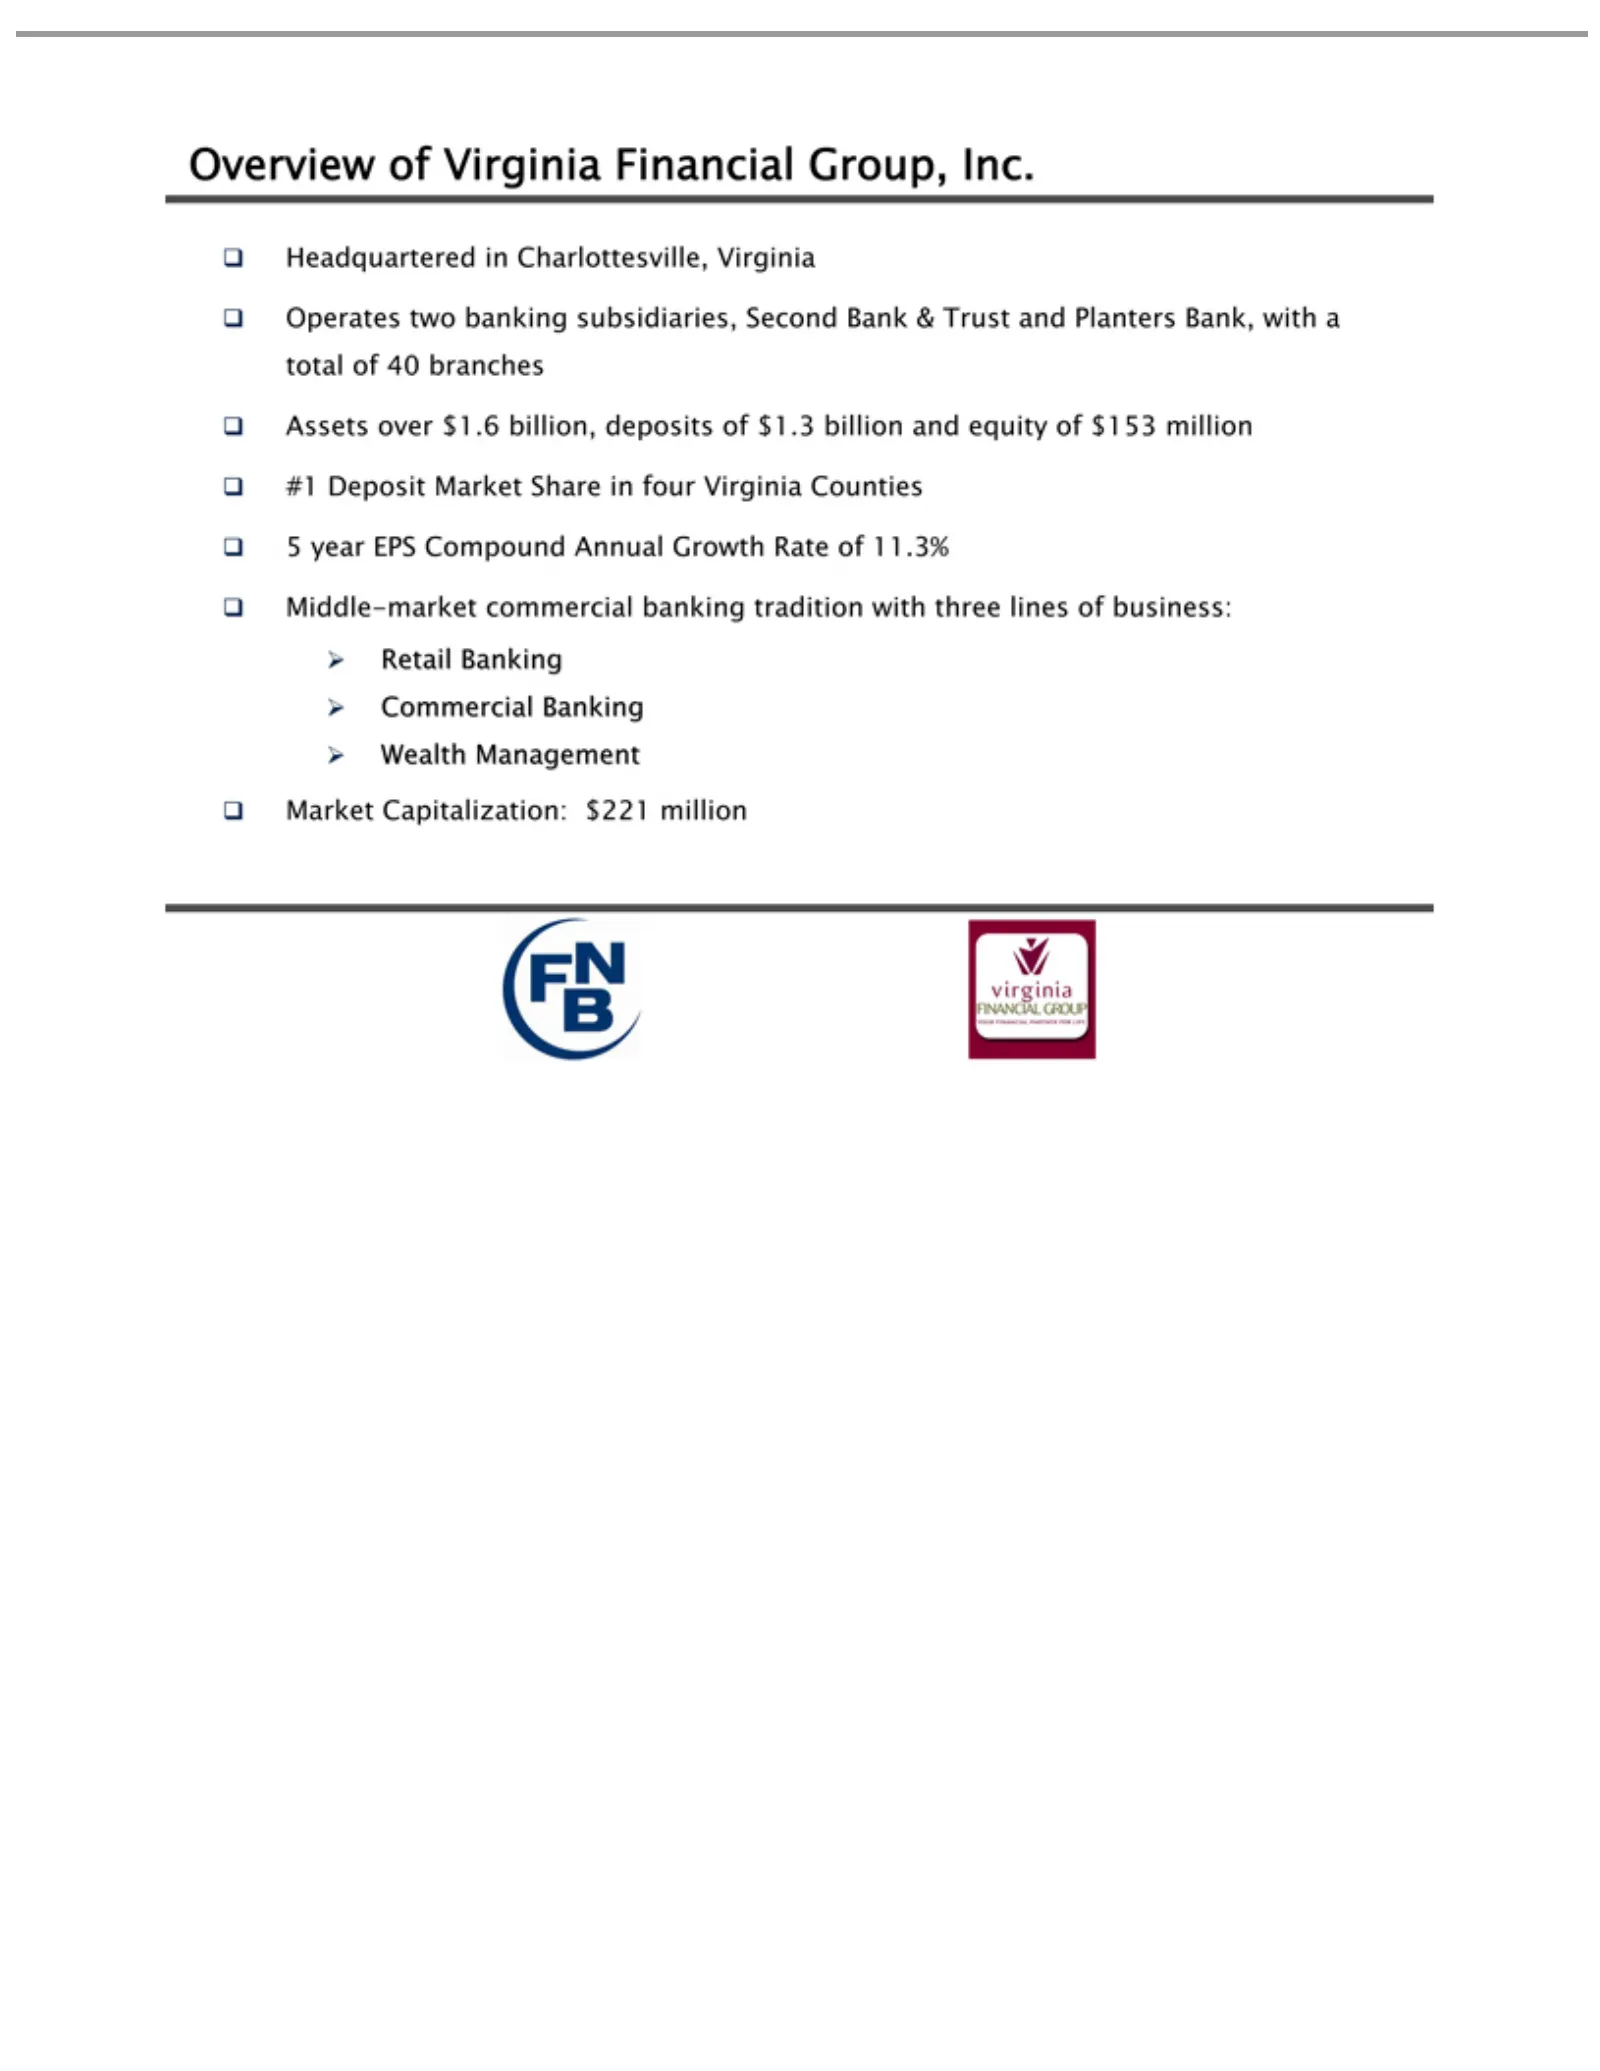
Slide 11: VFGI Overview
Overview Headquartered Operates Assets #1 5 Middle-market Retail Commercial Wealth Market year Deposit Banking EPS over Management Capitalization: two ofMarket Compound $1.6 Banking Virginia banking in commercial billion, Charlottesville, Share Financial subsidiaries, $221 Annual deposits in banking
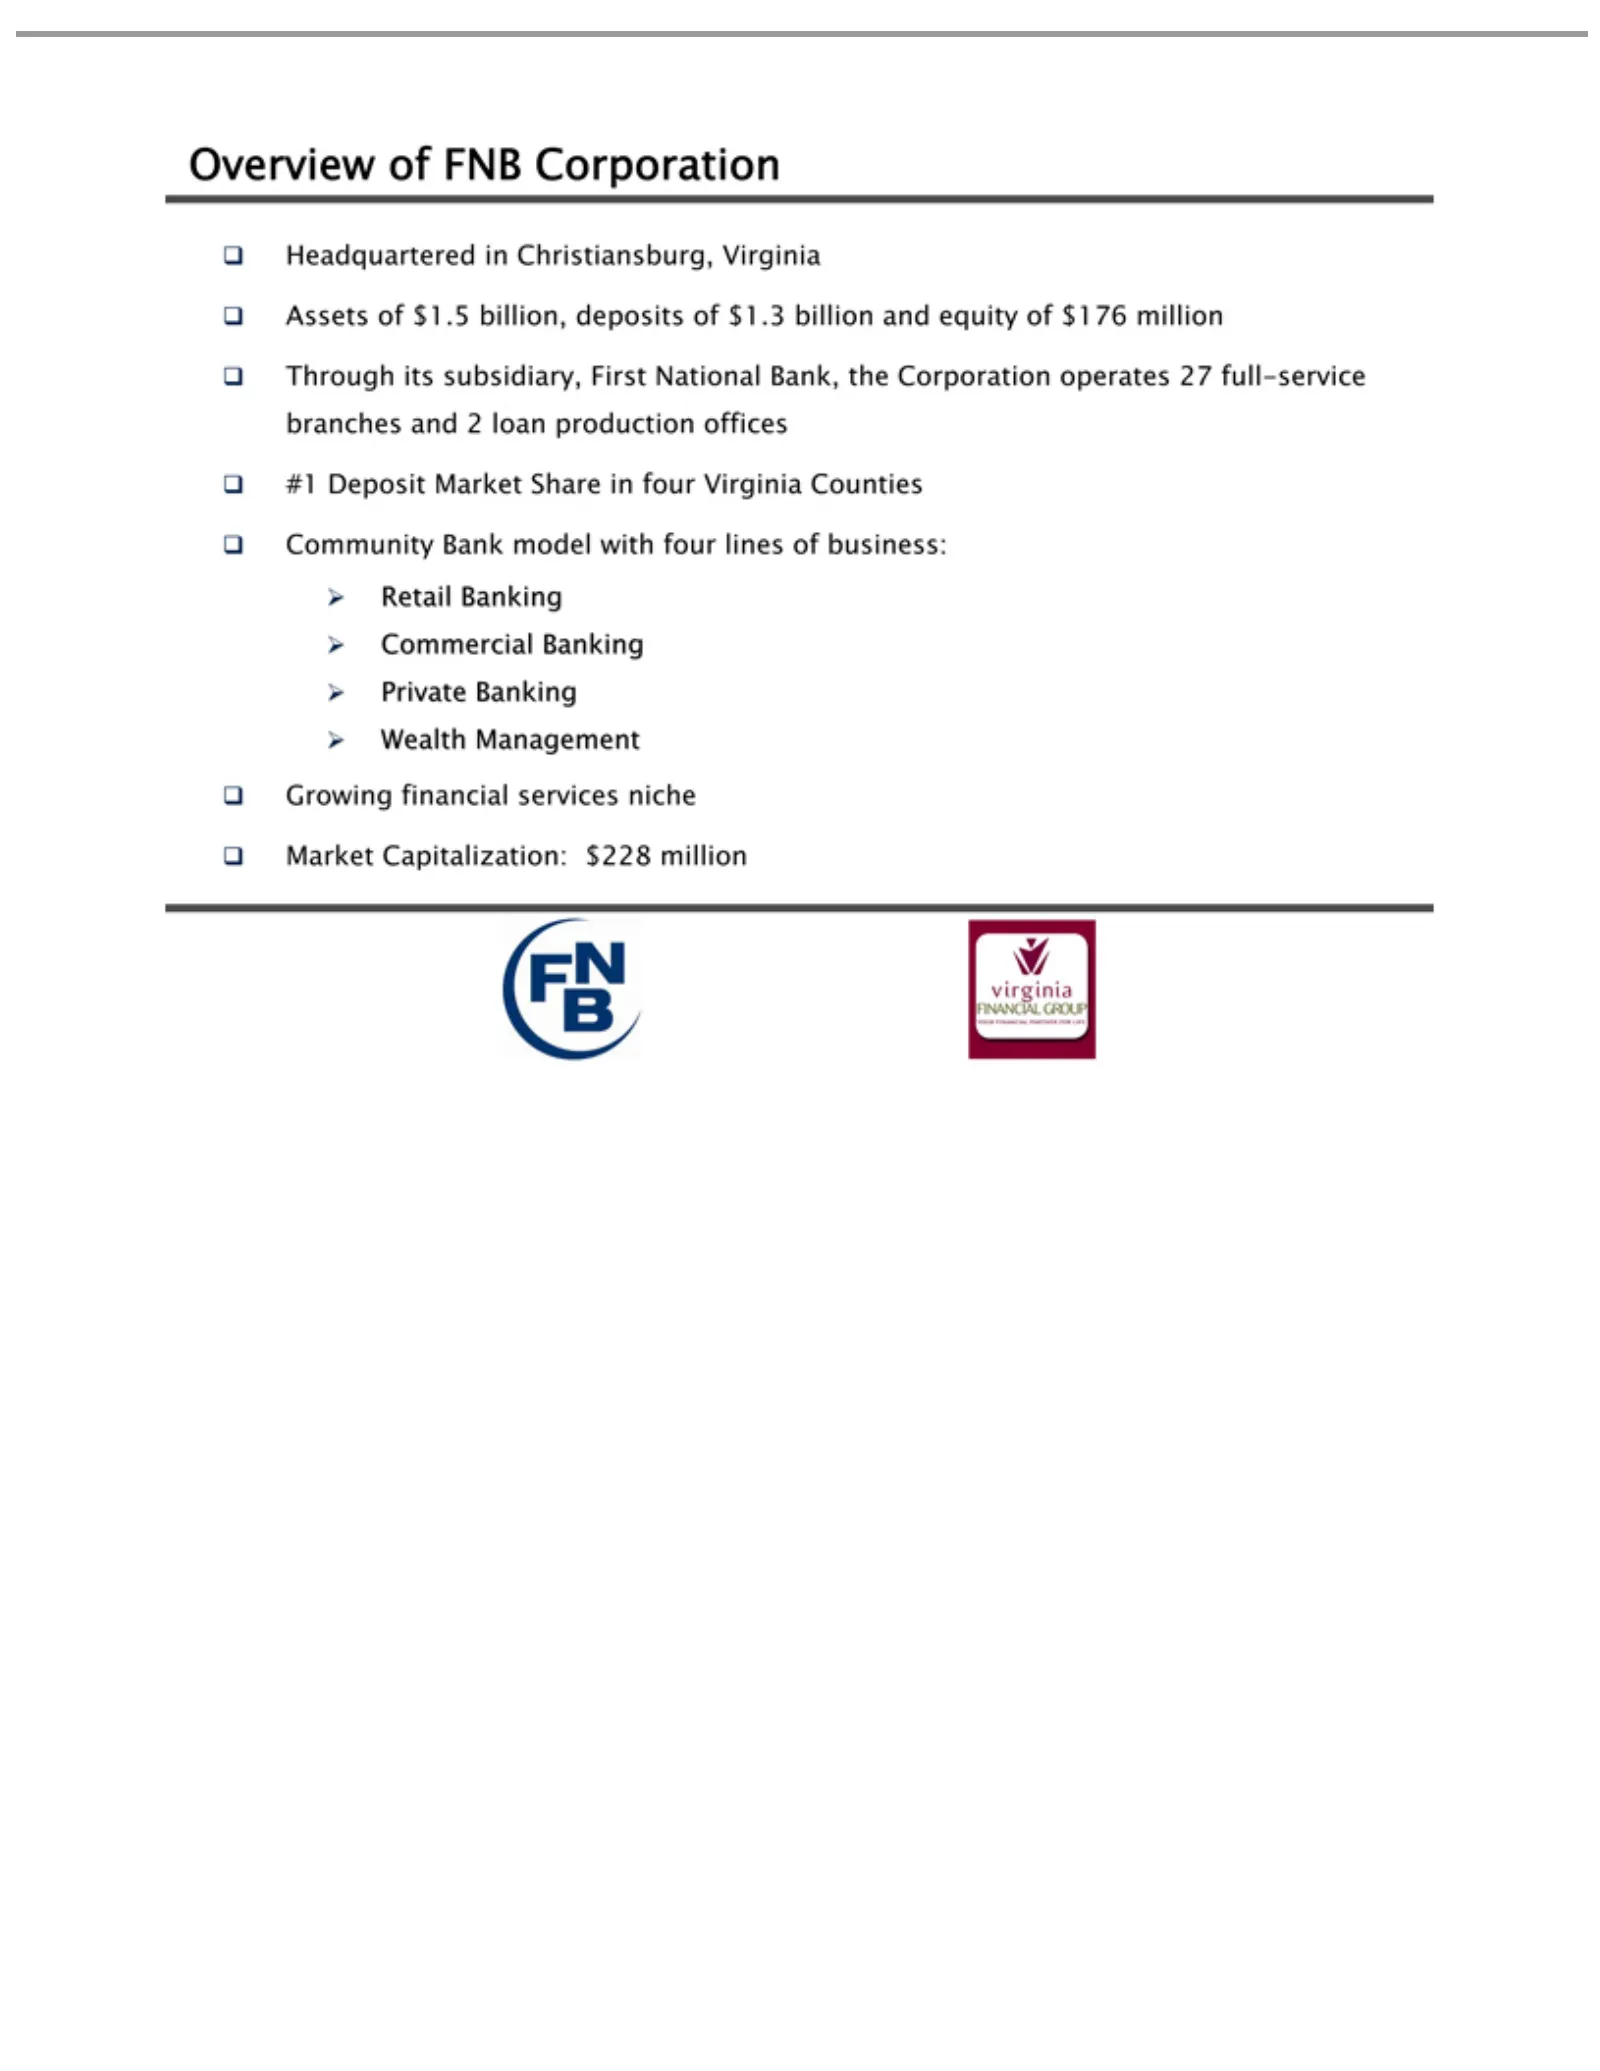
Slide 12: FNBP Overview
Overview Headquartered Assets Through #1 Community Retail Commercial Private Wealth Growing Market Deposit Banking of Management Banking Capitalization: its financial $1.5 ofMarket subsidiary, Bank Banking FNB billion, in Christiansburg, model Corporation services Share deposits $228 First with inni
Slide 13: Pro Forma Company Overview
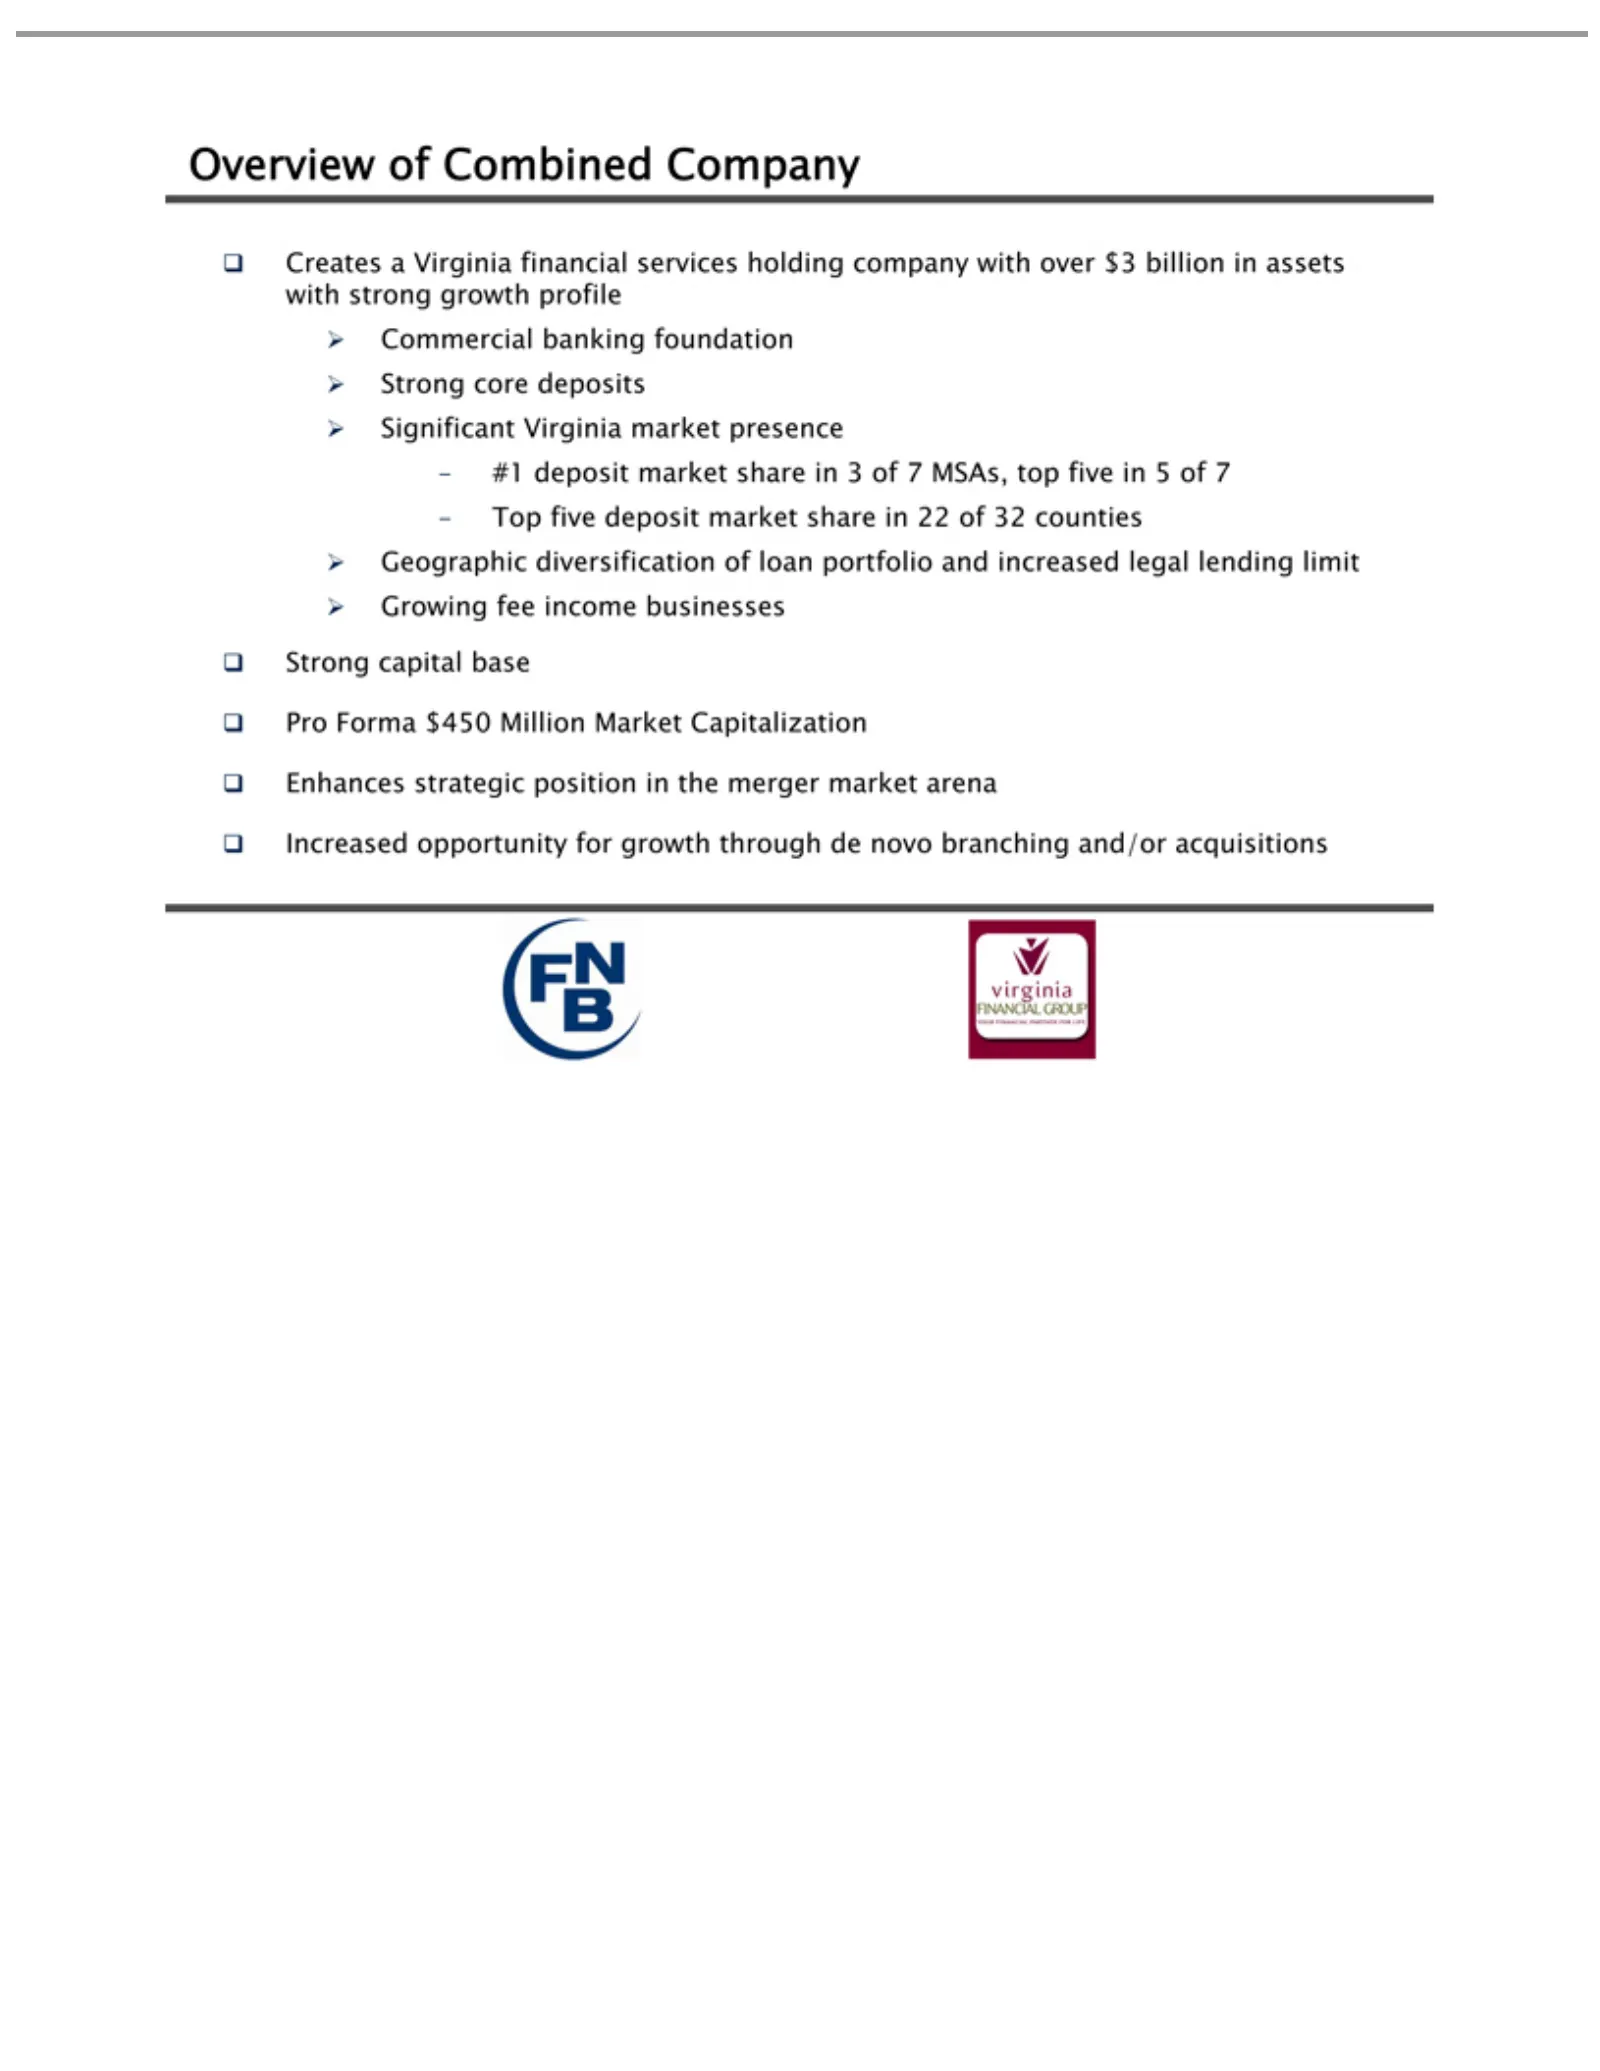
Overview Creates Commercial Significant #1 Top Geographic Growing Strong Pro Enhances Increased deposit Forma fivecapital core adeposit fee Virginia opportunity strategic of market $450 Virginia deposits diversification banking income Combined base market Million share financial position market busi
Slide 14: Expected Cost Savings
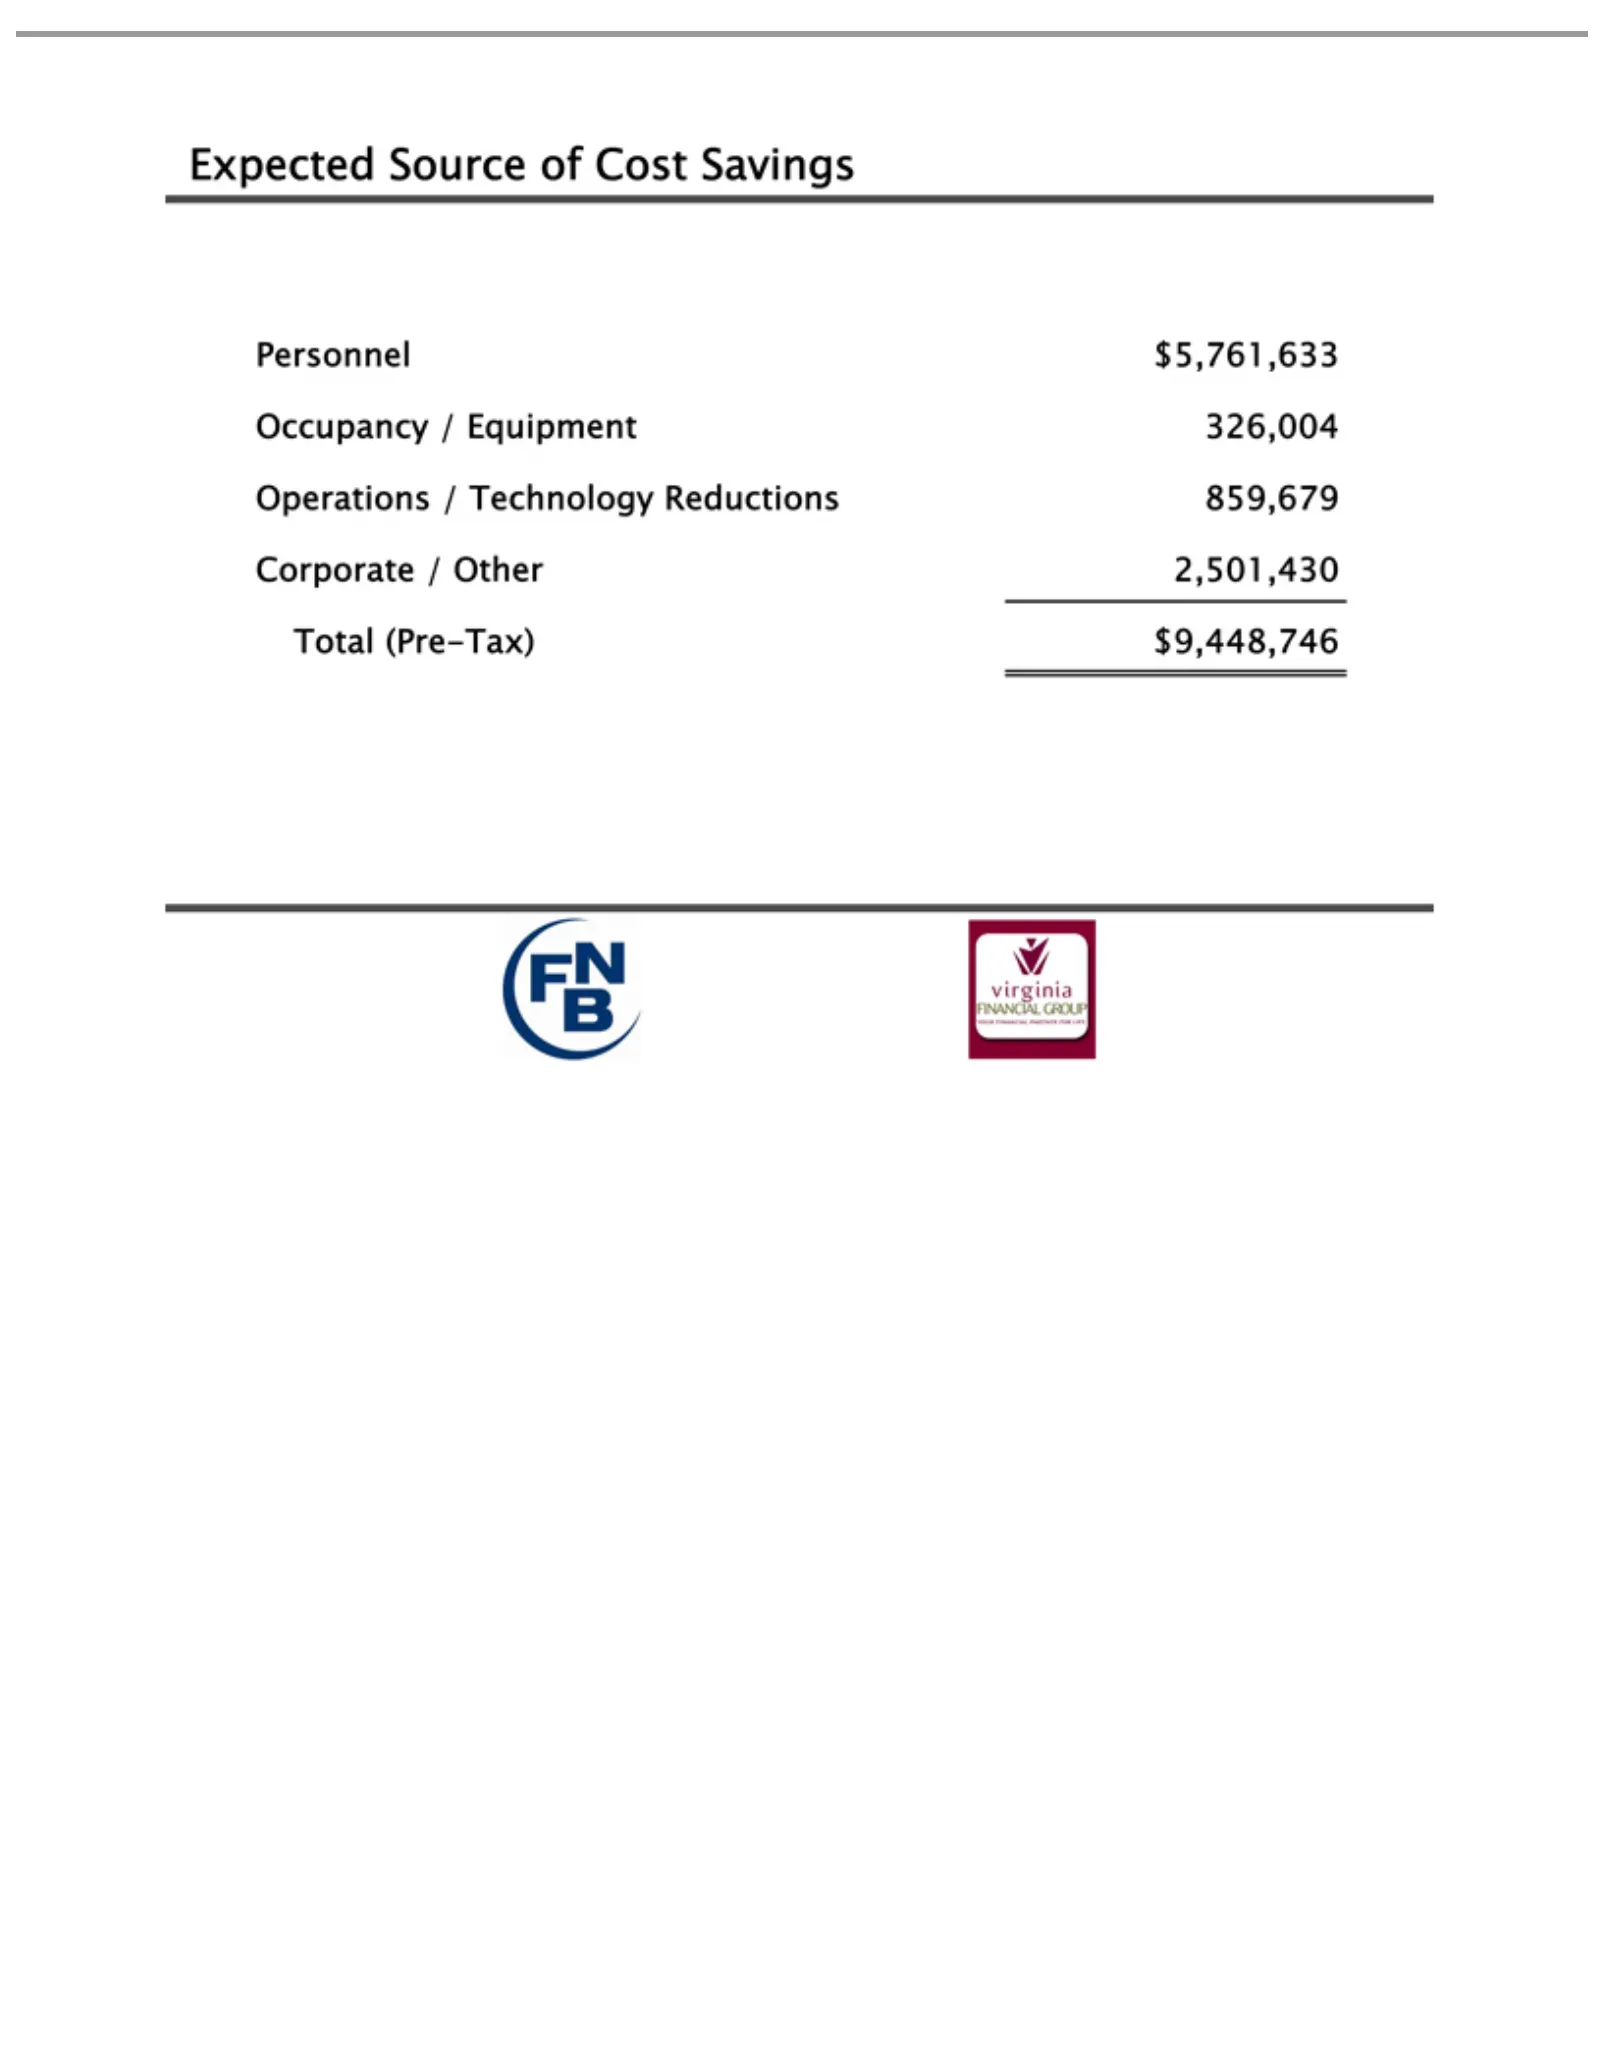
Expected Personnel Occupancy Operations Corporate Total (Pre-Tax) Source $5,761,633 / //Other Technology Equipment $9,448,746 of 2,501,430 Cost326,004 Reductions Savings 859,679
Slide 15: Pro Forma Loan Portfolio
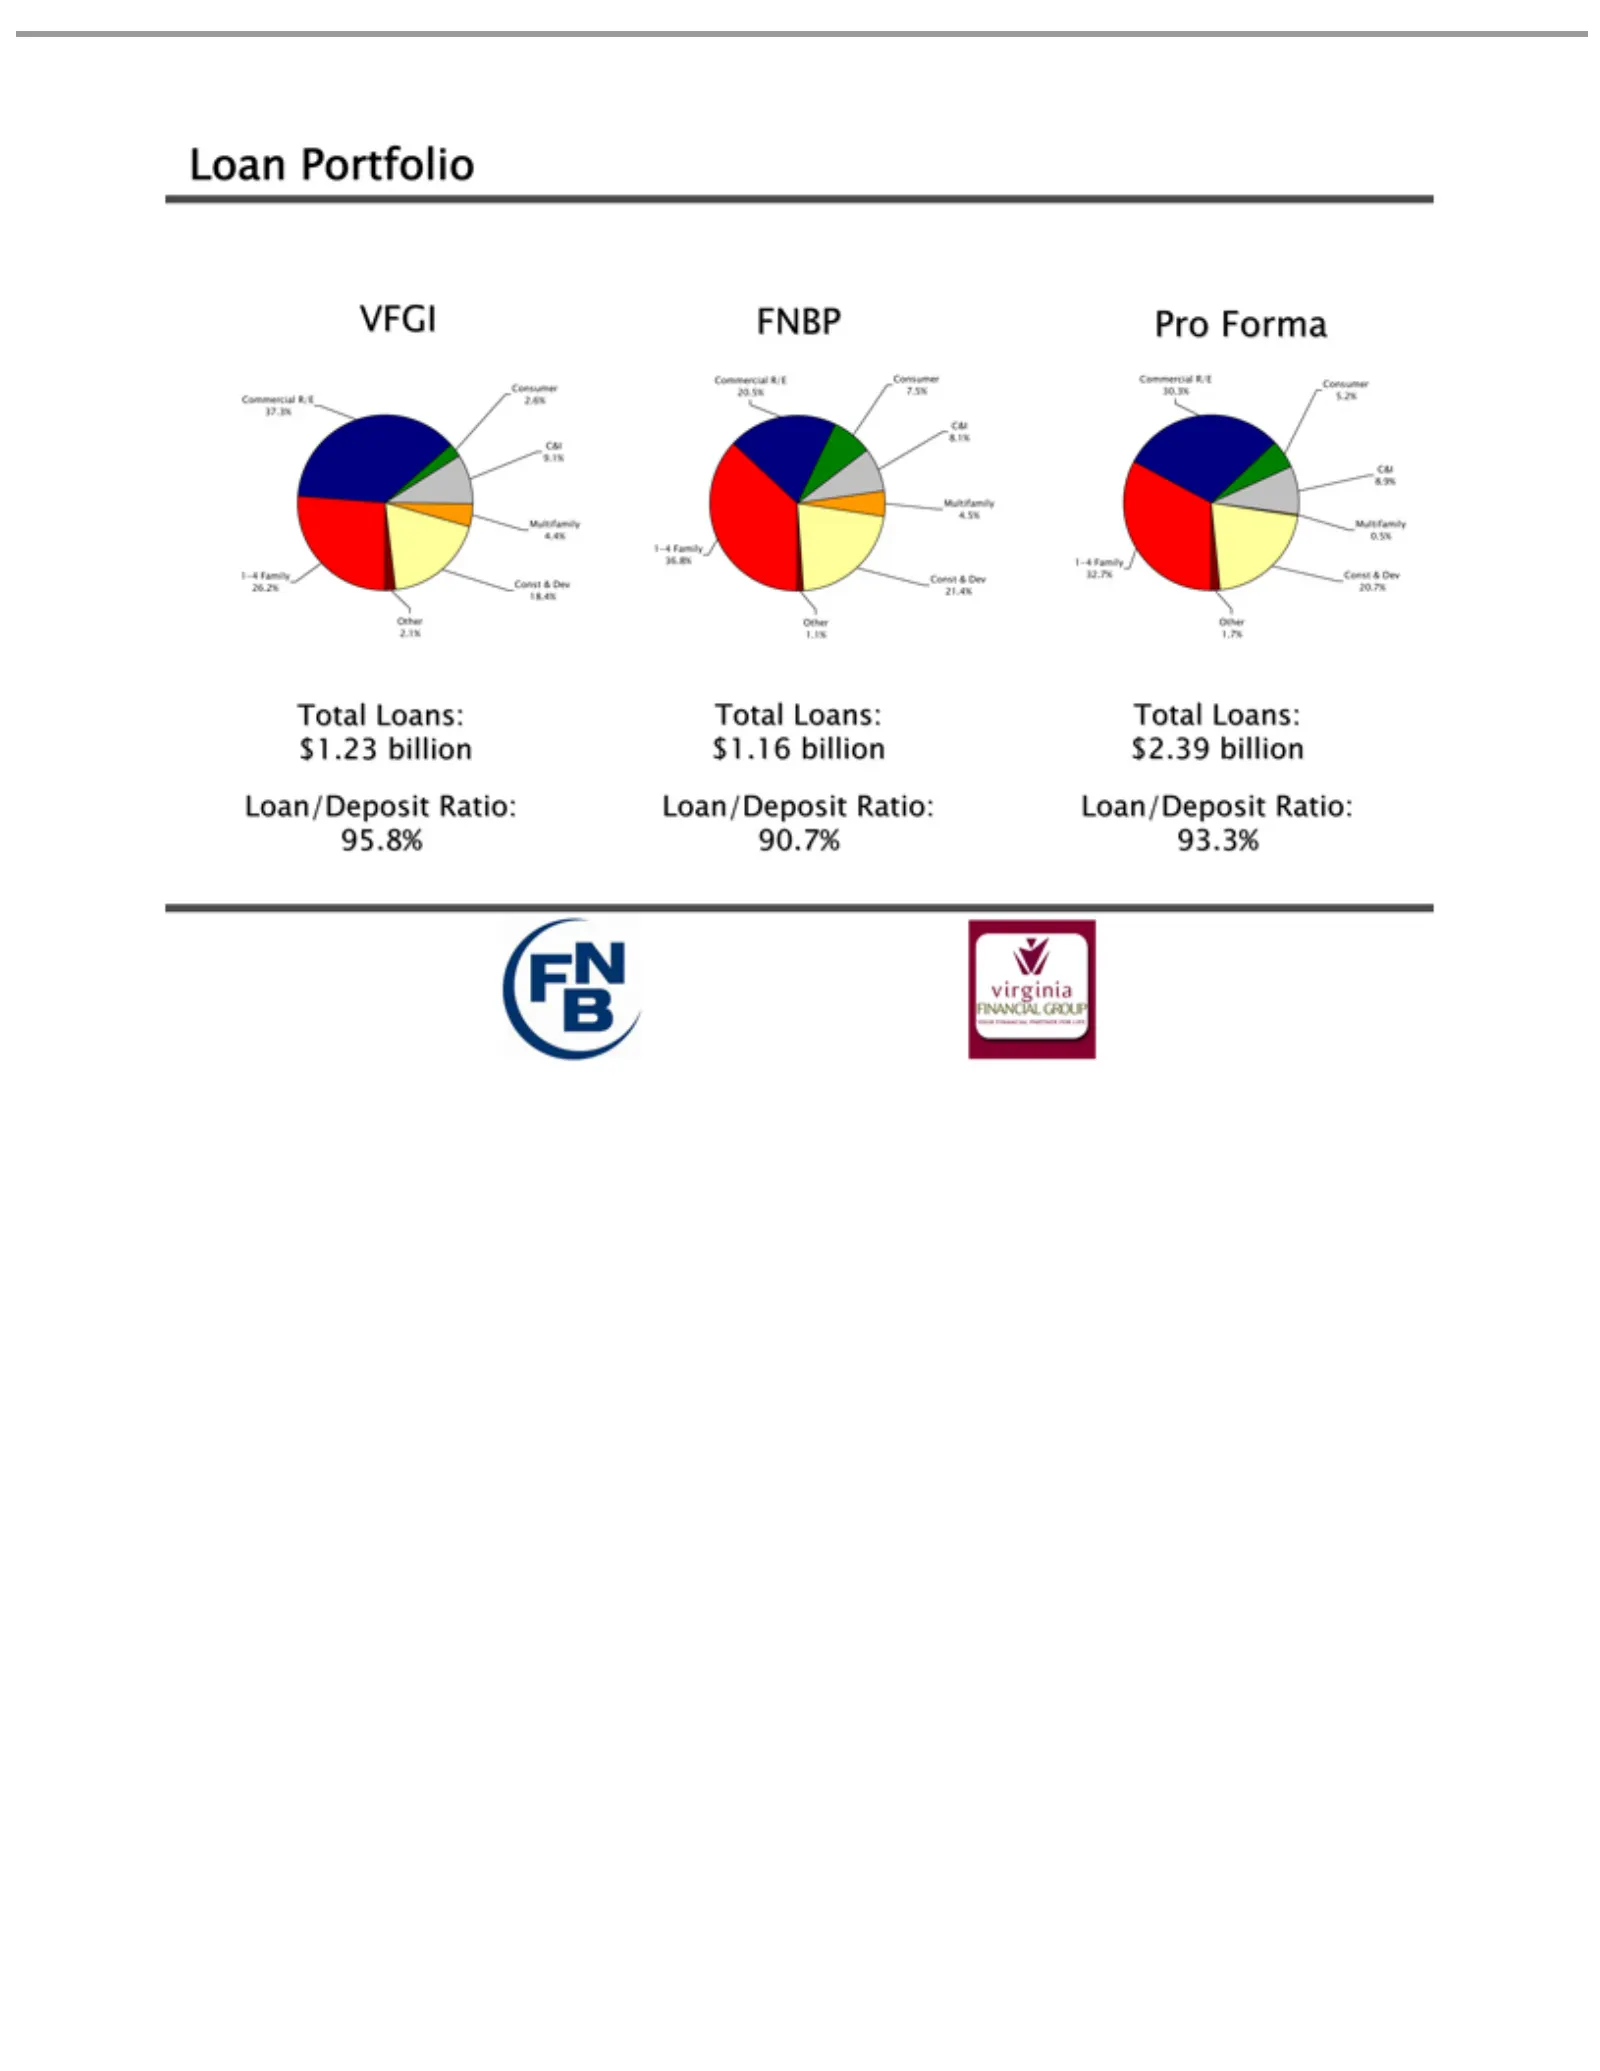
LoanForma VFGI Pro Commercial Consumer 8.1% C&I 9.1% Other Total8.9% Loans: Portfolio C&I Other FNBPMultifamily Consumer Other R/E TotalConsumer Loans: 2.1% 20.5% 4.5% 1.1% Total Commercial 7.5% Multifamily 1.7% Loans: 30.3%$1.23 R/E Commercial Multifamily billion $1.16 R/E 4.4%billion 2.6% 0.5%5.2%
Slide 16: Pro Forma Deposit Base
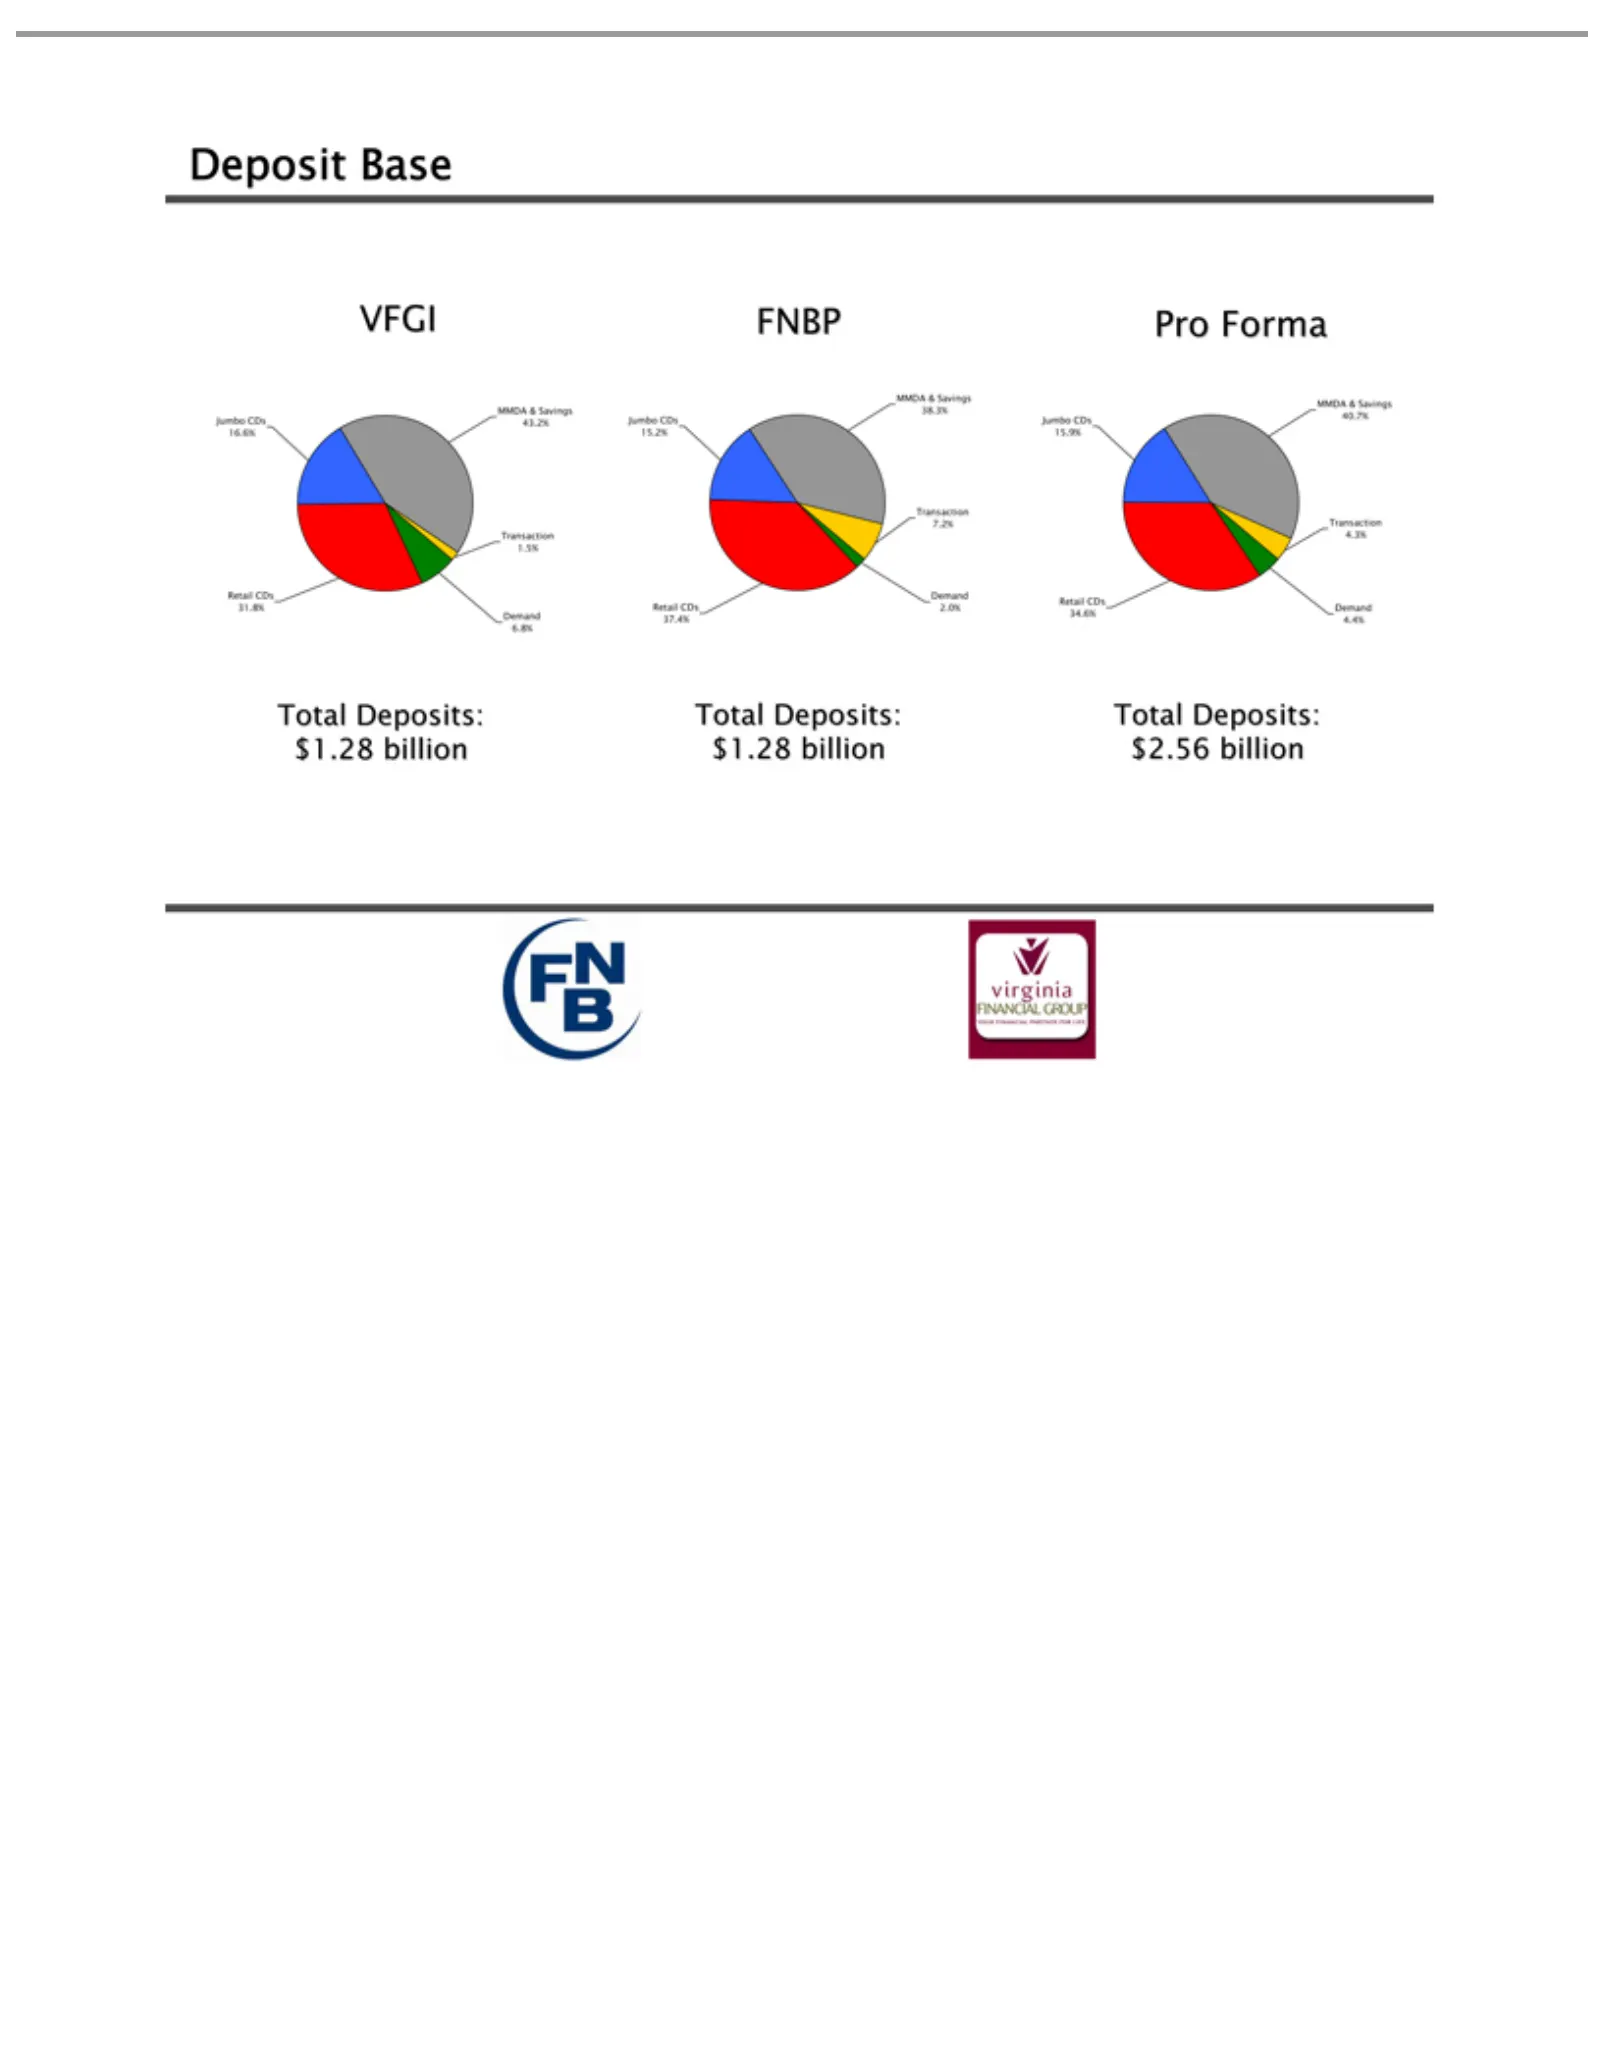
Deposit VFGI Pro MMDA 7.2% Transaction Retail 31.8% Total Forma Deposits: Transaction FNBP CDs Retail Base & Savings Demand CDs Total Transaction 2.0% MMDA Deposits: Demand & 4.3% Savings Total Demand 1.5% Deposits: 38.3% 34.6%Jumbo $1.28 37.4% billion CDs4.4% Jumbo $1.28 6.8% CDs billion Jumbo $2.5
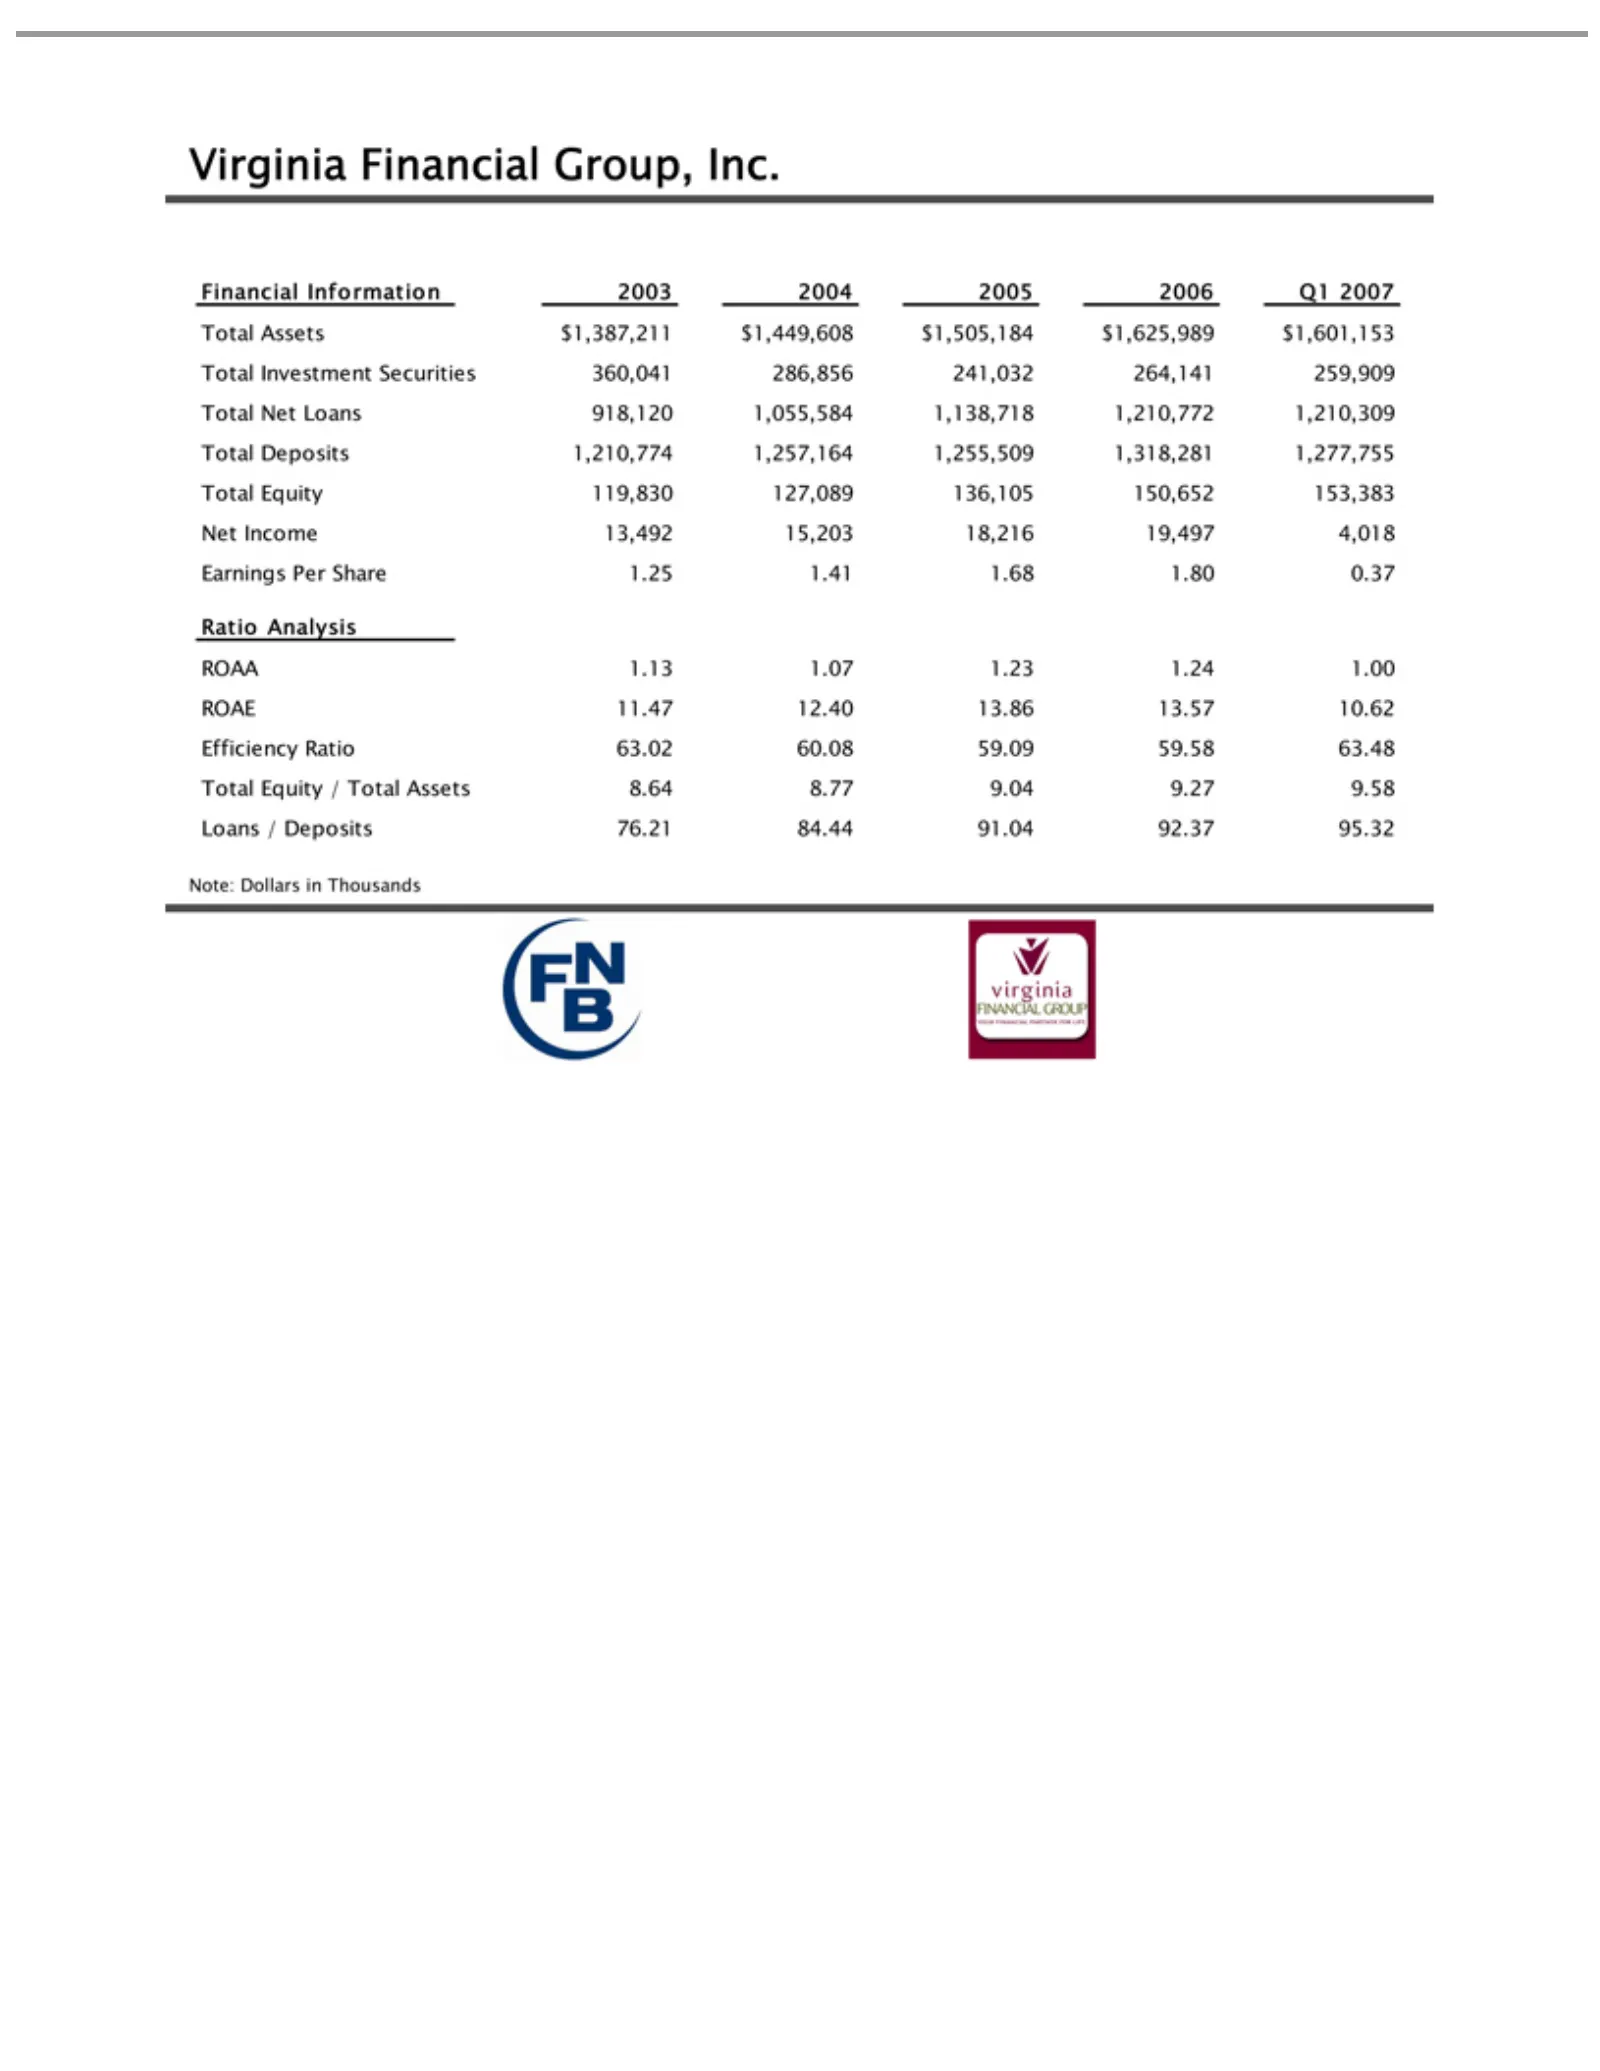
Slide 17: Virginia Financial Group Financial Analysis
Virginia Financial Total Income 1.25 Ratio ROAA 84.44 Note:1.41 Net Analysis Dollars 91.04 1.13 13,492 Financial Information Loans 1.68 92.37 1.07 in1.80 15,203 Thousands 918,120 1.23 Group, 95.32 0.37 2003 1.24 18,216 1,055,584 Inc. 1.00 2004 19,497 ROAE 2005 1,138,718 4,018 2006 11.47Earnings Q1 1
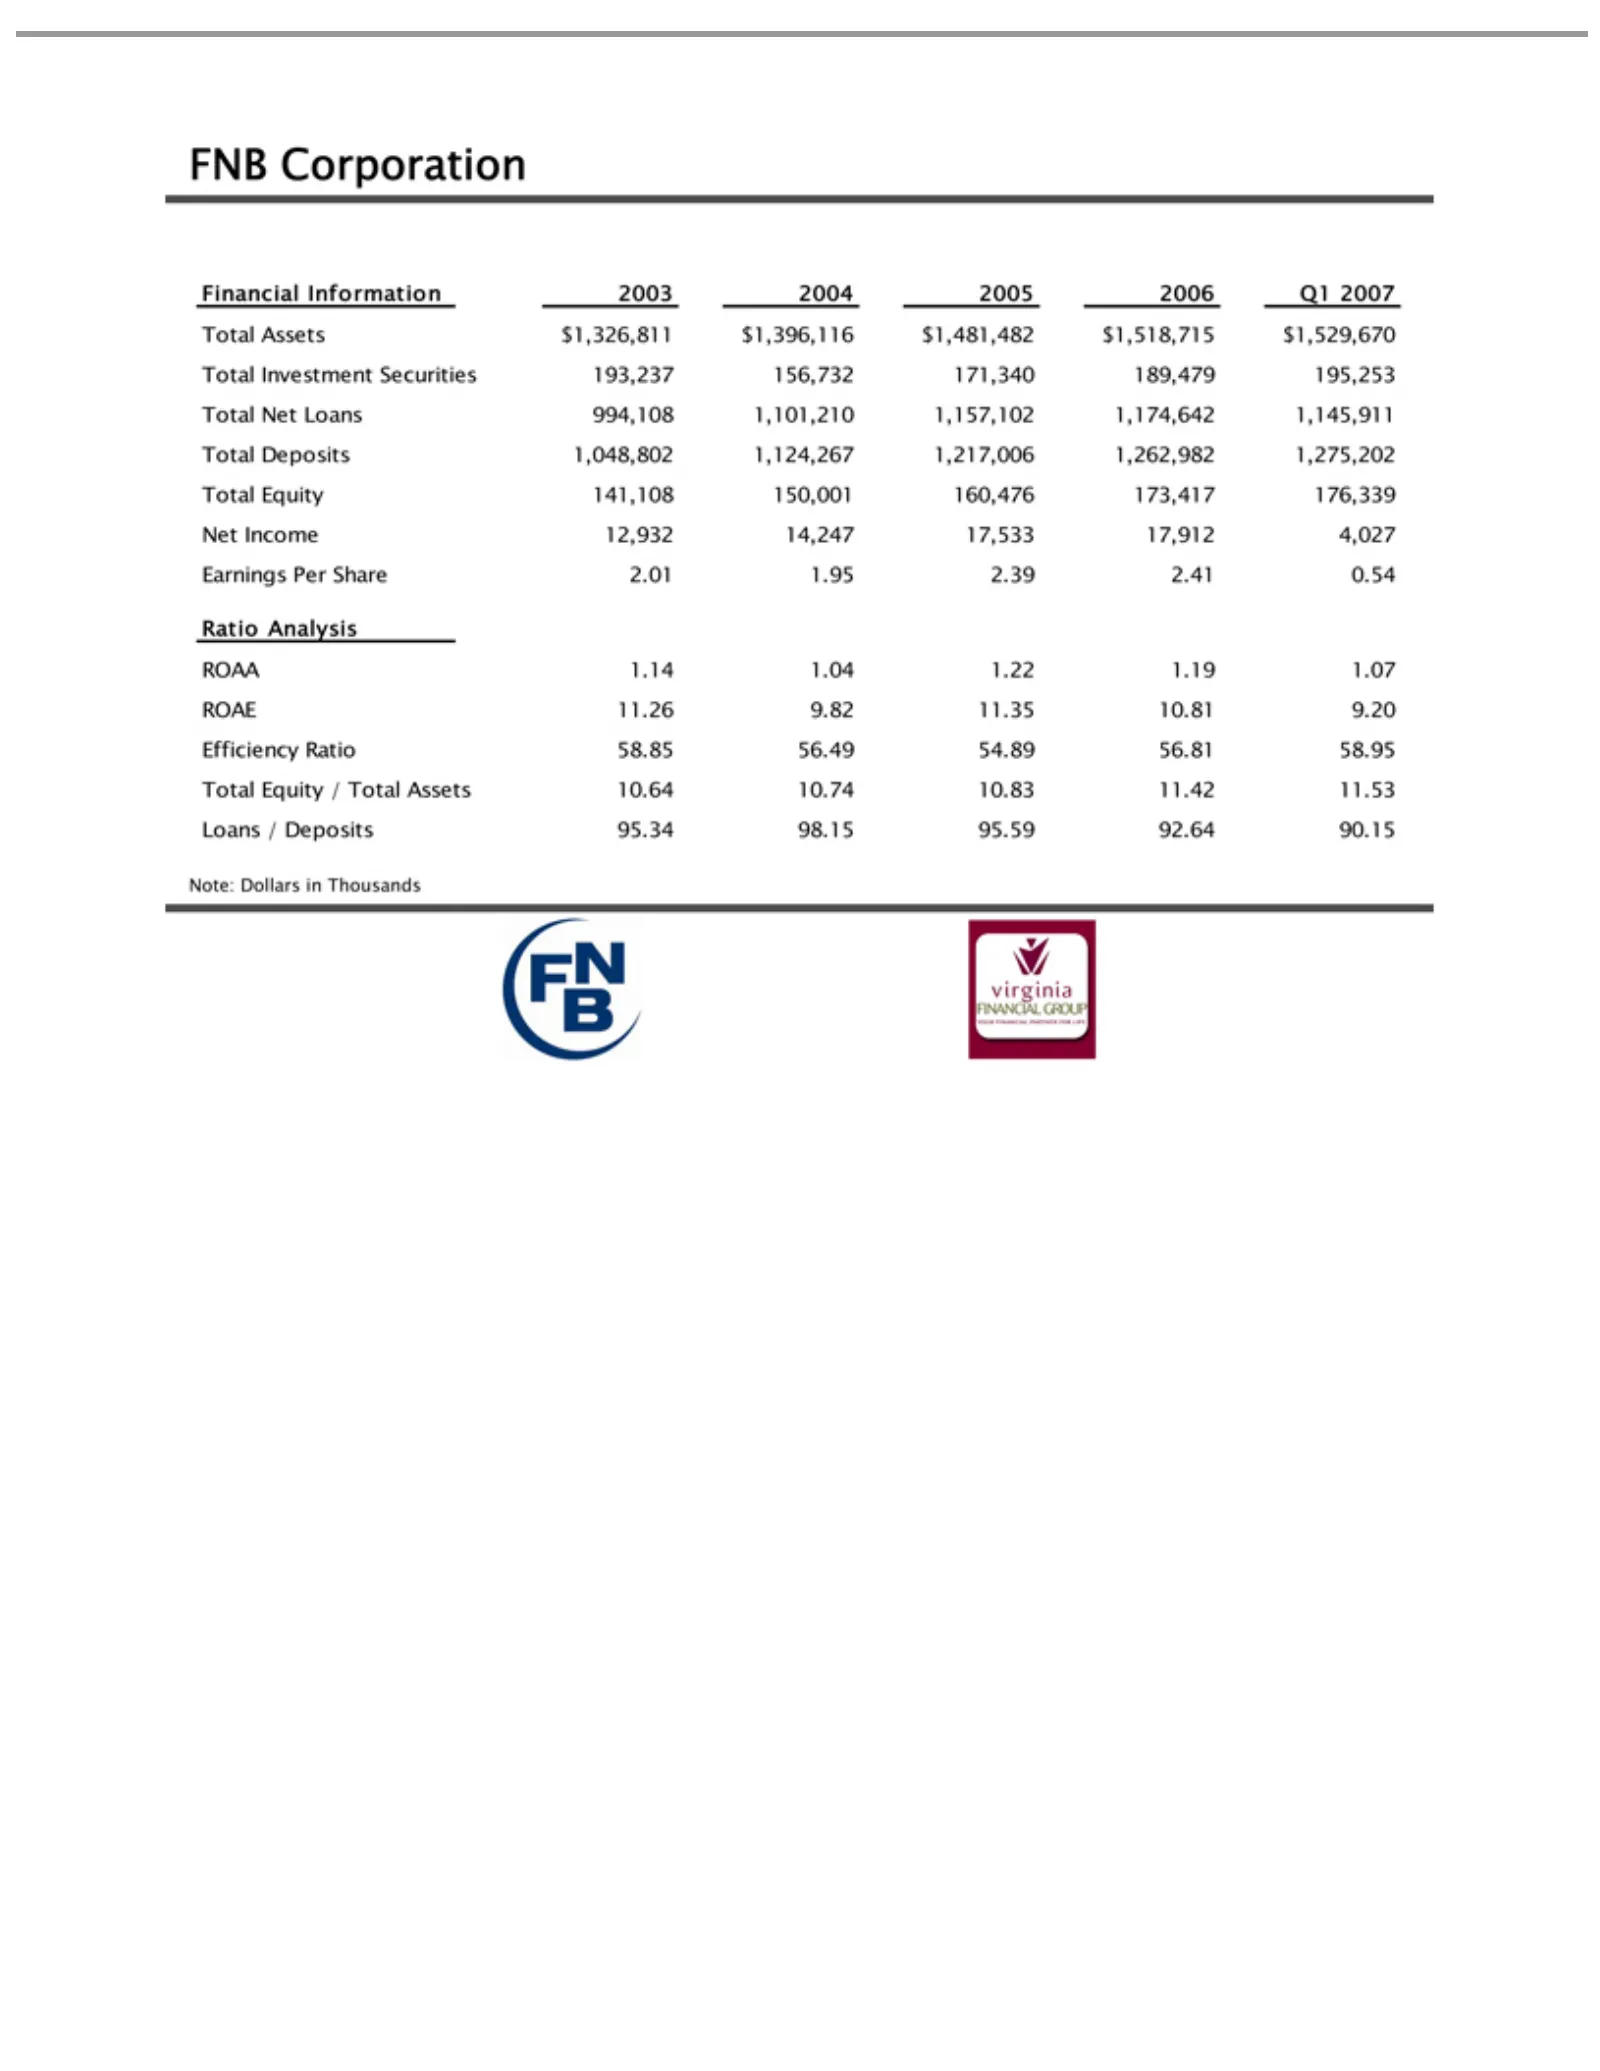
Slide 18: FNB Corporation Financial Analysis
FNB Corporation Financial Total Income Ratio ROAA 98.15 Note: Net Analysis Dollars 95.59 1.14 12,932 Information Loans 92.64 1.04 in14,247 Thousands 994,108 1.22 90.15 2003 1.19 17,533 1,101,210 1.07 2004 17,912 ROAE 2005 1,157,102 4,027 2006 11.26Earnings Q1 9.82 1,174,642 2007 11.35 Per Total 10.8
Source: SEC EDGAR · 8-K filed Jul 30, 2007
More decks from Stellarone Corp
 Merger or Acquisition (June 2013)17 slides · Jun 12, 2013
 Merger or Acquisition (June 2013)17 slides · Jun 10, 2013
 Q1 2010 Earnings Presentation23 slides · May 21, 2010
 Shareholder Meeting (April 2010)54 slides · Apr 27, 2010
 Keefe, Bruyette & Woods Community Bank Investor Conference (July 2009)32 slides · Jul 29, 2009
 FNB Corp (VA) — Merger or Acquisition (October 2007)5 slides · Oct 2, 2007