Stellarone — Shareholder Meeting (April 2010)
54 slides from Stellarone's shareholder meeting presentation, Apr 27, 2010

Slide 1: Welcome! 2010 Annual Meeting of Shareholders
Excellence. Partnership. Service Welcome! 2010 Annual Meeting of Shareholders April 27, 2010 Exhibit 99.1

Slide 2: Ed Barham, Corporate President & CEO
Ed Barham Corporate President & CEO

Slide 3: Forward Looking Statements
Forward Looking Statements • In addition to historical information, this presentation contains forward-looking statements. The forward-looking statements are subject to certain risks and uncertainties, which could cause actual results to differ materially from historical results, or those anticipate
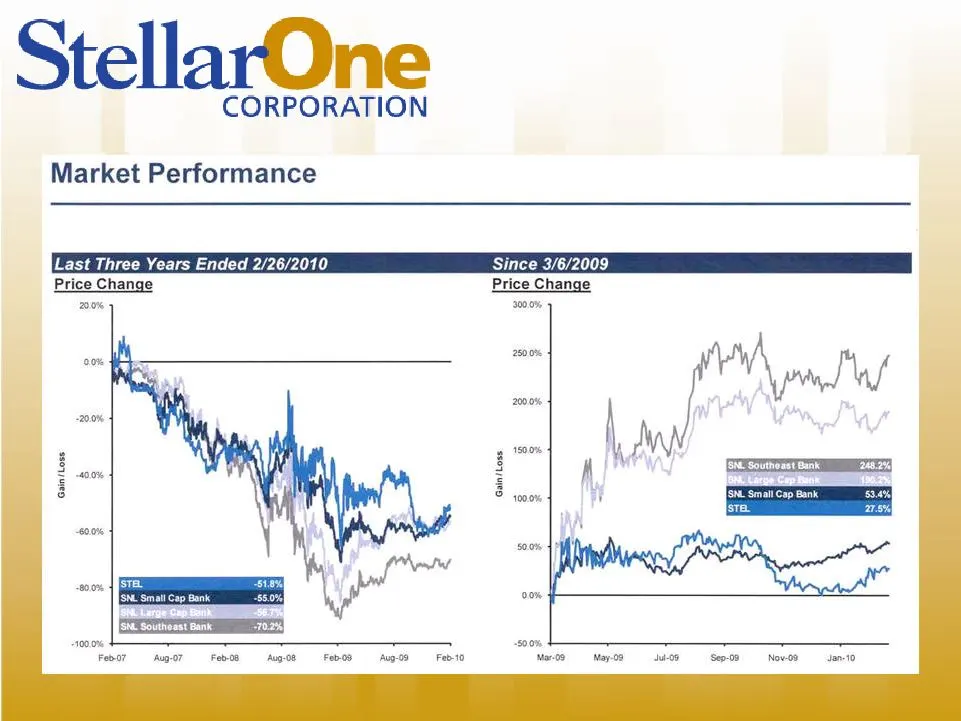
Slide 4: Market Performance
tellarOne CORPORATION Market Performance Last Three Years Ended 2/26/2010 e 3/6/2009 Price Change Change 20% 000% 20% 200% 700% B ii i a 3 é © coon 00% f‘ soon {of 000% 00%, 300.0% 00% Febo? — Aug.07 —FebosAug0dFebooAug.09Feb-10 Ma:0o—May08Ju-09Sep-09 Novos Jan-to
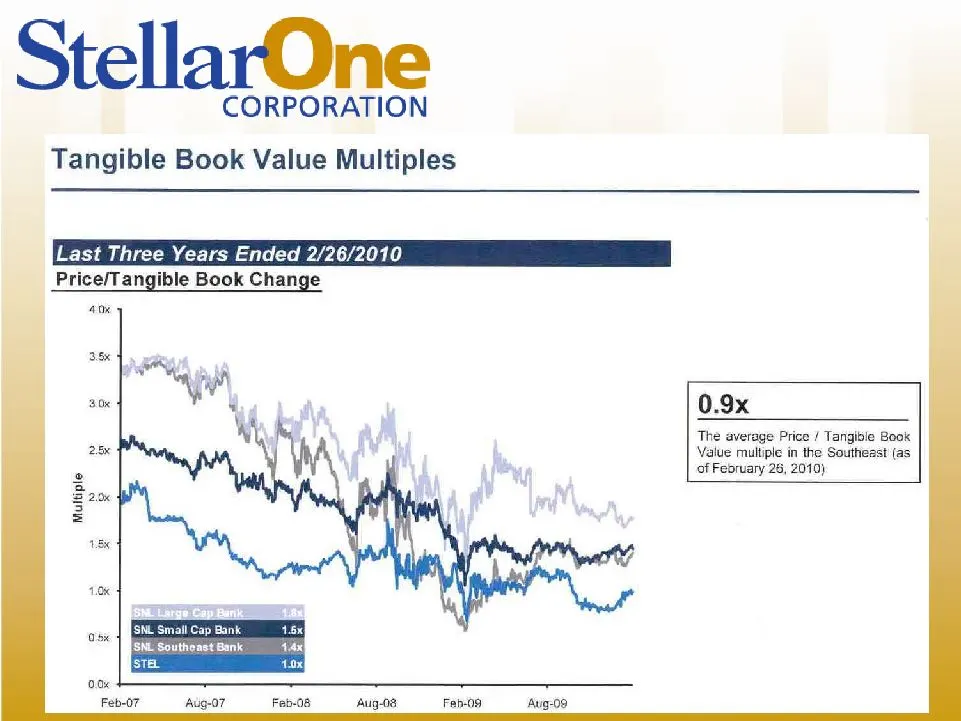
Slide 5: Tangible Book Value Multiples
StellarOne CORPORATION Tangible Book Value Multiples Last Three Years Ended 2/26/2010 40% 0.9x ‘The average Price / Tangible Book Valve multiple in the Southeast (as of February 26, 2019) Southeast Sank STEL 1.0%] tie $< — Feb-07 Auig-07 Feb.08 Aug-08 Fab-09 Aug-09
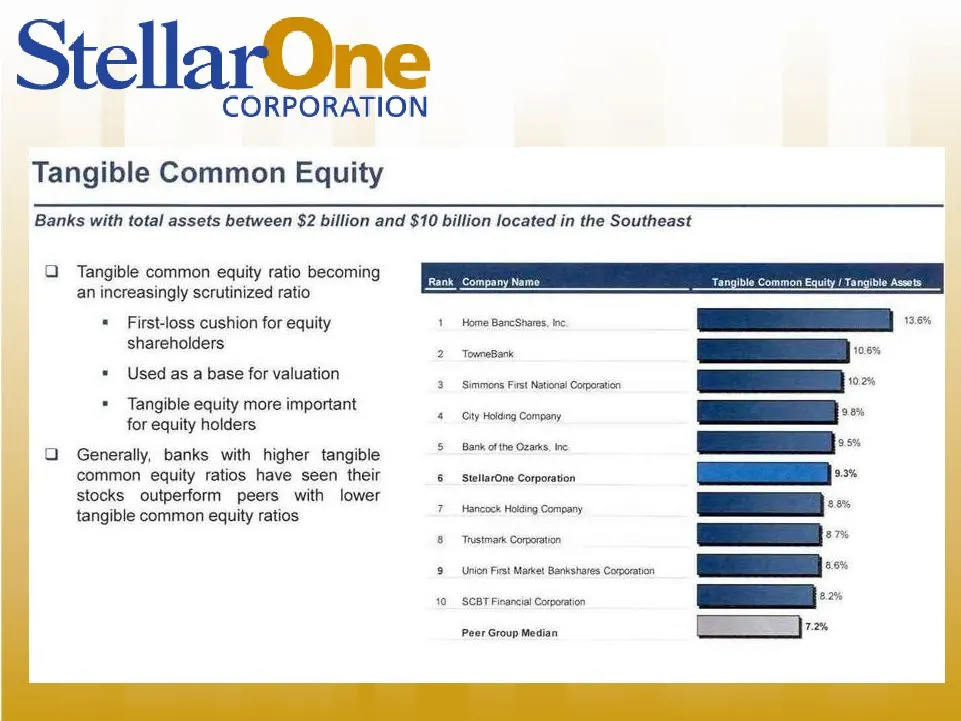
Slide 6: Tangible Common Equity
StellarOne CORPORATION Tangible Common Equity Banks with total assets between $2 billion and $10 billion located in the Southeast Q_ Tangible common equity ratio becoming an increasingly scrutinized ratio Rank Company Namo Tangible Common Equity / Tangible Assets * First-loss cushion for equity 1 Ho
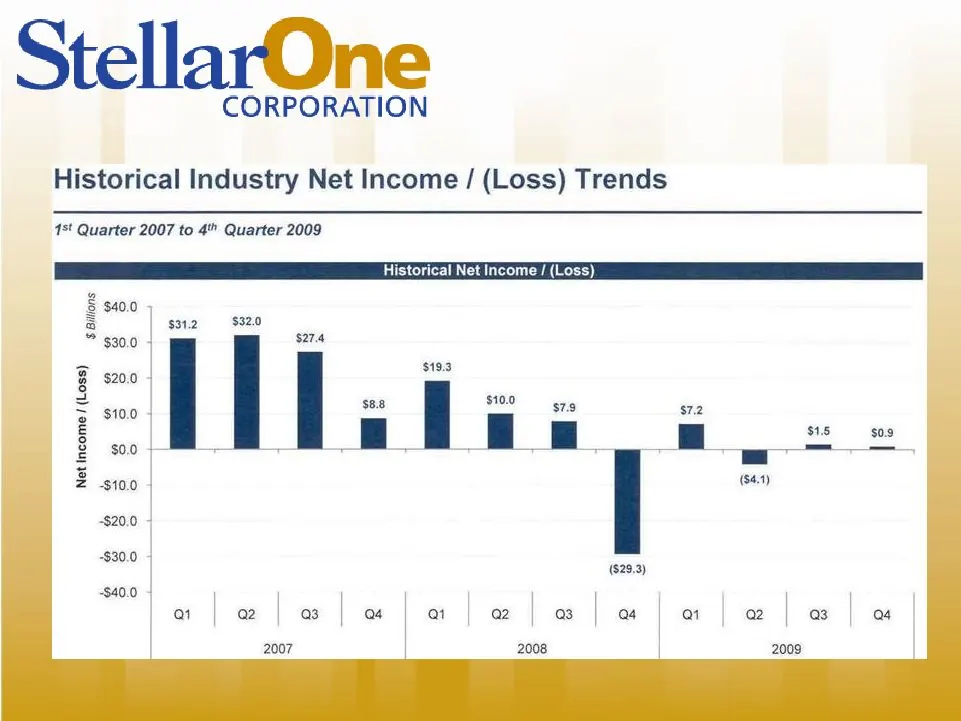
Slide 7: Historical Industry Net Income / (Loss) Trends
StellarOne CORPORATION Historical Industry Net Income / (Loss) Trends 1%" Quarter 2007 to 4" Quarter 2009 Historical Net Income / (Loss) $ Billions $31.2 $32.0 $274 $19.3 $88 We we 872 $09 Net Income / (Loss) (829.2) a | a | a | o a
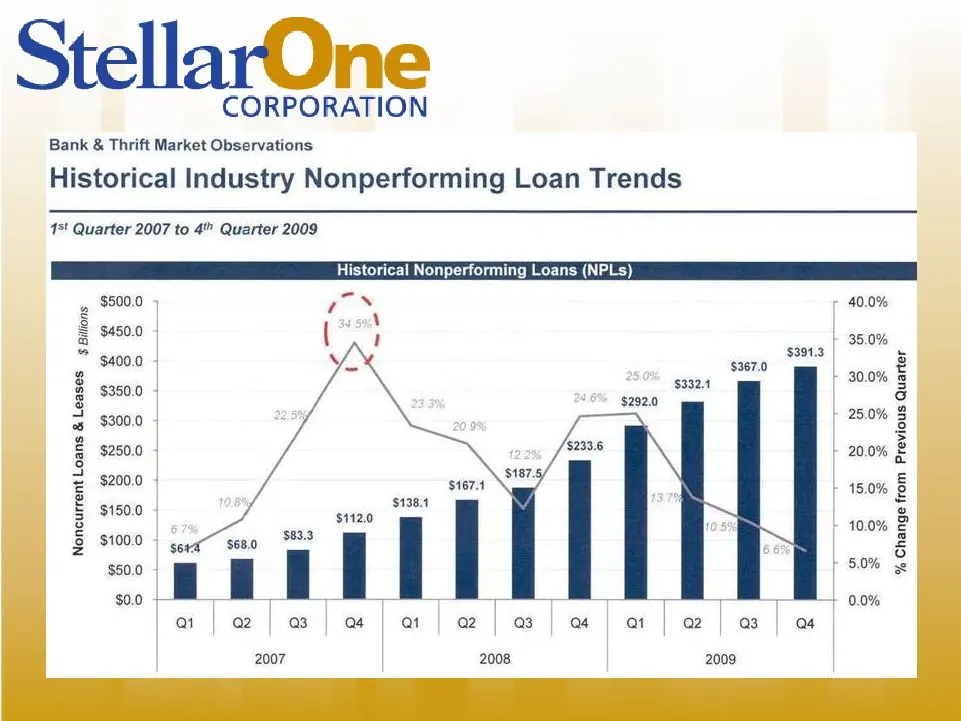
Slide 8: Bank & Thrift Market Observations: Nonperforming Loan Trends
StellarOne CORPORATION Bank & Thrift Market Observations Historical Industry Nonperforming Loan Trends 15 Quarter 2007 to 4” Quarter 2009 Historical Nonperfon ing Loans (NPLs) $500.0 res f 40.0% sad ( < : + 35.0% $400.0 $350.0 $300.0 $250.0 + 30.0% 25.0% 20.0% $200.0 + $150.0 t $138.4 . | $12.0 $100
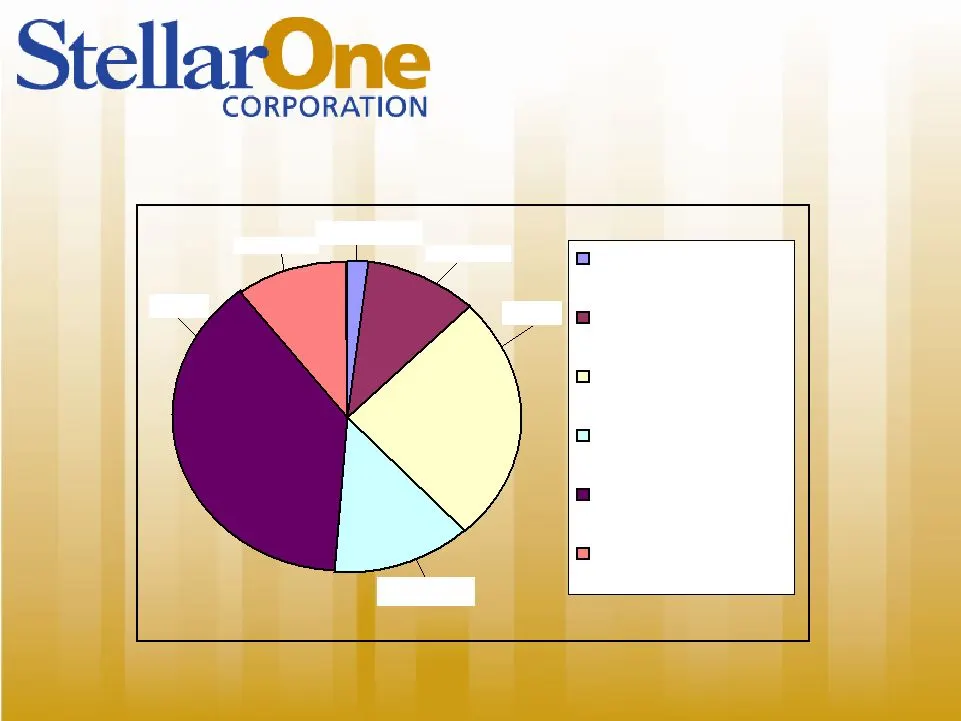
Slide 9: Loan Portfolio Composition
A&D/Construction: SML A&D/Construction (Net of SML) R/E Mortgage Consumer Commercial R/E Commercial 10.52% 10.15% 38.73% 25.78% 12.93% 1.90% Total Portfolio $2,181,196,000 As of 12/31/09
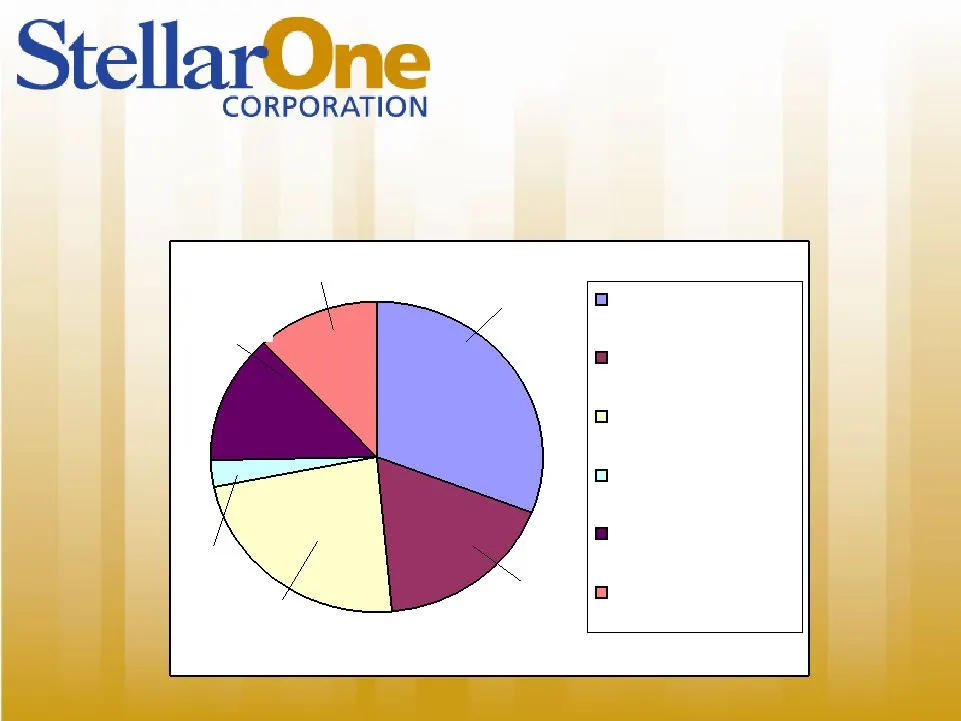
Slide 10: Total Non Performing Loans
Total Non Performing Loans = $66,254,000 Total Non Performing Loans as a Percentage of the Total Loan Portfolio = 2.79% A&D/Construction: SML A&D/Construction (Net of SML) R/E Mortgage Consumer Commercial R/E Commercial 2.85% 30.72% 17.88% 23.23% 13.47% 11.84% As of 12/31/09
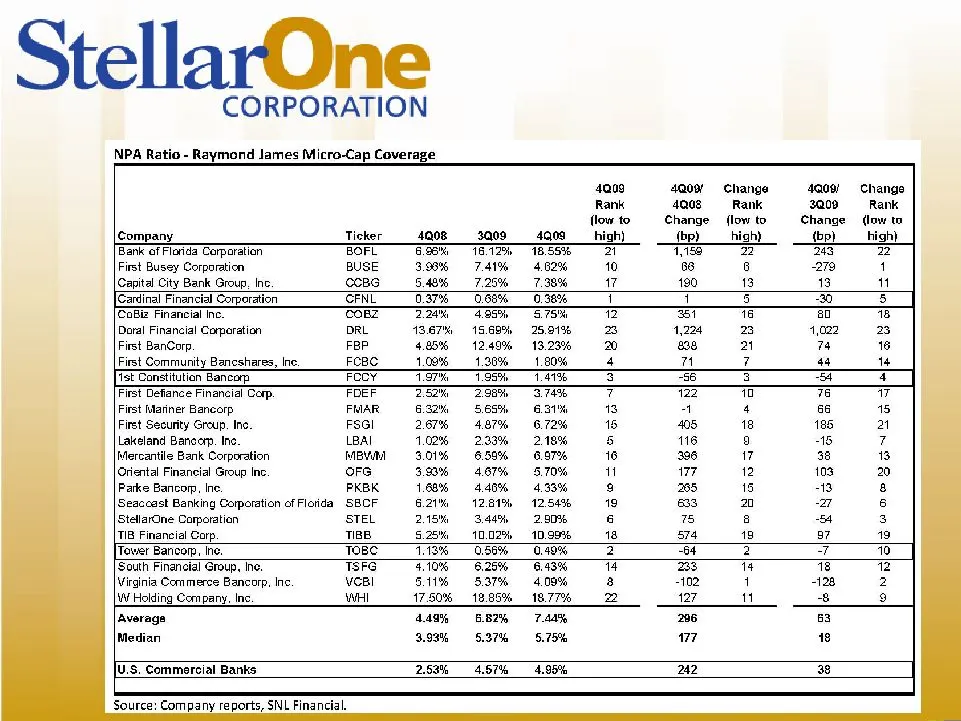
Slide 11: NPA Ratio - Raymond James Micro-Cap Coverage
StellarOne CORPORATION NPA Ratio - Raymond lames Micro-Cap Coverage 4009 40% Change «40087 Change Rank 4003 Rank 3Q09 Rank (low to Change flow to = Change (low to Company Ticker 49083009 _4g0a_high} (bp) high) (bp) high) Bank af Flarda Carparalian BOF 6.5% 18.12% Tass% 21 1s 343 22 First Busey Corpo
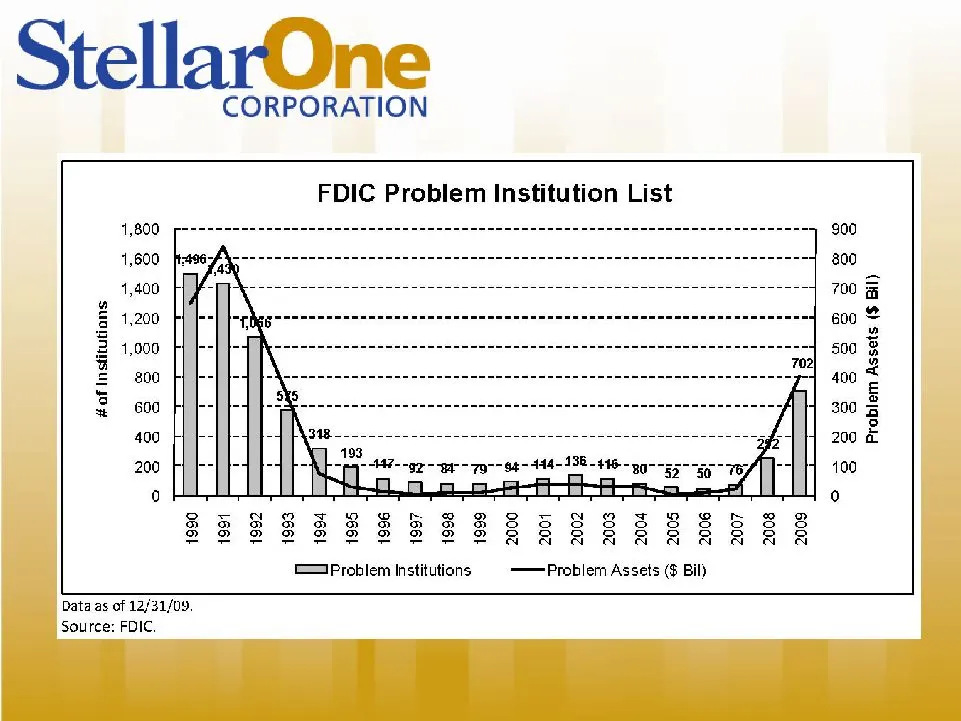
Slide 12: FDIC Problem Institution List
StellarOne CORPORATION FDIC Problem Institution List Problem Assets ($ Bil) = 797-4 - 444-138 -446-- 59: a = 1991 1996 1997 1998 1999 2000 1993 1994 C= Problem Institutions ——Problem Assets ($ Bil) Data as of 12/31/09. Source: FDIC,
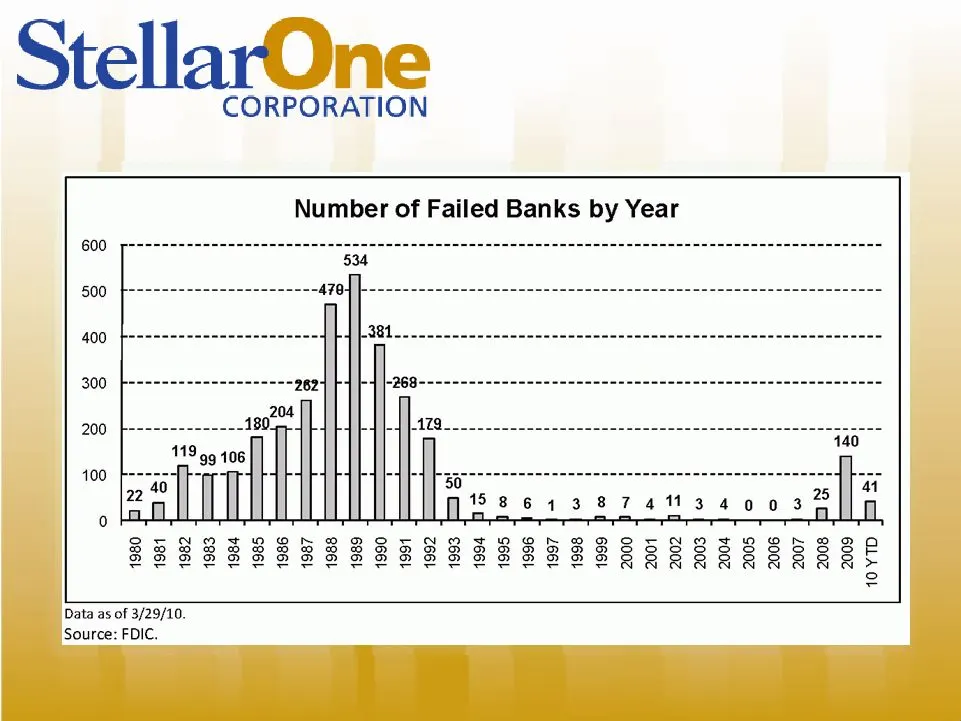
Slide 13: Number of Failed Banks by Year
StellarOne CORPORATION Number of Failed Banks by Year Data as of 3/29/10. Source: FDIC.
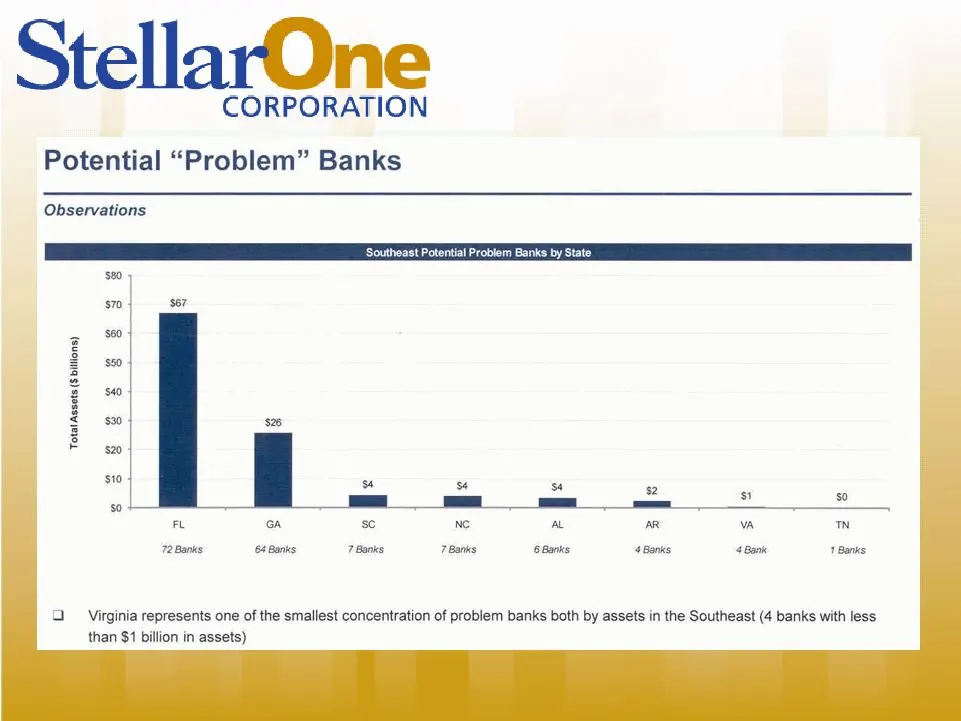
Slide 14: Potential Problem Banks
StellarOne CORPORATION Potential “Problem” Banks Observations ta i so} $67 a) 2 0 2 $40 2 s0 $28 a ‘$20 “e = s2 ca so im = —= = FL cA so AL aR vA 1 72anks e+ Banks 7 ons 7 eonks eons Banks 480 1 Bats Virginia represents one of the smallest concentration of problem banks both by assets in the Southea

Slide 15: Line of Business Overview
Line of Business Overview Mr. Greg Feldmann Bank President & CEO
Slide 16: Retail Snapshot
Retail Snapshot Households > 112,000 Deposits $2.35 billion Loans $610 million Annual Fee Income $16.1 million Financial Centers Alternative Channels CCC, Internet, Phone, Mobile Employees

Slide 17: Retail 2009 Accomplishments
Retail 2009 Accomplishments Production results ~ 2009 vs 2008 Loans: Total Consumer Loans á 10.43% Monthly Average Book Applications á 8.93 % Monthly Applications Taken á 5.47% Monthly Average Loan Applications á 1.46% Deposits: Total Interest Bearing Deposits á 5.74% Total Deposits á 3.88% Implemen

Slide 18: Retail 2009 Accomplishments
Retail 2009 Accomplishments Bonanza Deposit Campaign Total Deposits $96.3MM Accounts opened 5,431 Wealth Management referral program Retail referrals up 30% from previous year Retail revenue up nearly 20%

Slide 19: Retail 2009 Accomplishments
Retail 2009 Accomplishments Improved branch efficiency through strategic realignment Closed/Consolidated 5 Financial Centers Overall deposit retention rate 95% Sold Woodstock to 1 st Bank Annualized operating cost savings ~ $1.8 million Relocated Market St. to Franklin Plaza Opened Plank Rd. facilit

Slide 20: 2010 Key Initiatives
2010 Key Initiatives Retail Focus: Build Relationships, Revenue and Retention Refinement of Retail Executive Management Intensify focus on Sales and Service and improvement in Operations, Compliance and Project Management Grow noninterest income Example: Improve check card penetration Focus on organ

Slide 21: 2010 Key Initiatives
2010 Key Initiatives Continue to improve operating efficiency More sales per square foot Manage to staffing model Driving “store owner” mentality using MPC Relocate Seminole Trail Financial Center to new Northtowne location Lease or sell excess space

Slide 22: StellarOne Corporation
Stellar CORPORATION

Slide 23: Commercial Snapshot
Commercial Snapshot Market Segments Served Commercial: $3 to $25 million Middle Market: >$25 million Commercial Real Estate: A&D, Housing, Income producing properties, Hospitality Treasury Management Services for companies and municipalities Loans $1.3 billion Deposits $93 million non-interest $62 m

Slide 24: 2009 Highlights
2009 Highlights • Loan production - $378 million commitments closed • Treasury Management: – Sweep balances - $62 million average – Account analysis income up 36% to ~$700k annually • Established RM staffing metric - $40MM/150-200 notes • Implemented Segmentation Strategy – Core Commercial – Middle

Slide 25: 2010 Initiatives & Goals
2010 Initiatives & Goals • Grow & diversify loans in C&I – Growth goal of 5% on loans and 4% on deposits – Evaluate potential markets for LPO – Opportunity in government contracting sector – Leverage SBA – Cross sell treasury management, insurance, wealth management • Refine Commercial management st
Slide 26: Business Banking
Business Banking Market Served Business and professional groups with revenues $3 million or less Market Opportunity > 300,000 opportunities in VA Loans $235 million Deposits Drive to Retail centers to leverage investment in facilities Business Model 60% business/40% retail (bank the owners and emplo

Slide 27: 2009 Highlights
2009 Highlights • Completed “right sizing” to ensure effective coverage in prime BB markets • Successfully integrated $150MM loan portfolio and 5 RMs • Developed scorecard system to track effectiveness of RMs • Structured Specialized Lending area with a focus on SBA lending

Slide 28: 2010 Initiatives
2010 Initiatives • $67 million in new loans/$20 million in core deposits/Cross sell fee services – Rolled out “Premier Profiling Program” to expand existing relationships – Generating additional fees through investments, insurance and mortgage – Double SBA loan book – Developing a new tiered deposit
Slide 29: Mortgage Snapshot
Mortgage Snapshot Markets Served Retail: customers and prospects in or near our Virginia markets Wholesale: Smaller banks and brokers principally in VA, NC, SC 2009 Customers Served 3,422 2009 Loan Volume $618 million 2009 Revenues $5.6 million

Slide 30: 2009 Accomplishments
2009 Accomplishments • Implemented Optimal Blue system • Made process improvements for underwriting, closing, and post closing functions • Expanded into Richmond market • Wholesale developed mini-correspondent program • Website improvements

Slide 31: 2010 Initiatives
2010 Initiatives • Cross sell Bank and affiliate services (e.g., insurance) – Achieving 15% or greater cross sell penetration rate • Continue to build strong ties to our builders in order to help them close more business while increasing our “purchase” business • Better utilize Customer Contact Cent

Slide 32: Wealth Management Overview
Wealth Management Overview Securities Asset Management Total Employees Assets $212MM $462MM $674MM Accounts 4,277 5,145 2009 Revenues $1.2MM $2.96MM $4.16MM

Slide 33: 2009 Accomplishments
2009 Accomplishments • Securities Division assets grew by $39 million or 23% • Asset Management booked 79 new accounts with initial funding of $28 million • Retained 99.5% of Asset Management accounts in a volatile market year • Hired experienced Relationship Managers in Roanoke, Fredericksburg and

Slide 34: 2010 Initiatives
2010 Initiatives • Business Development / Marketing – Holding “Will Workshop” seminars – Planning seminars for centers of influence (attorneys, CPA’s, etc.) that would include continuing education credits – Expansion of number of staff members making business development calls to better cover the fo

Slide 35: Financial Report
Financial Report Mr. Jeffrey W. Farrar Executive Vice President and Chief Financial Officer

Slide 36: Discussion Topics
• Discussion Topics: – Profitability – Asset Quality – Balance Sheet, Capital and Liquidity – Overhead and Efficiency Efforts – Stock Ownership and Performance

Slide 37: First Quarter Preview
First Quarter Preview • Earnings improvement that will exceed the consensus estimate. • Decrease in total non-performing assets for the second consecutive quarter. • Higher charge-offs and related provisioning sequentially. • Continued improvement in net interest margin for second consecutive quarte

Slide 38: Peer Comparisons
Peer Comparisons • Sandy Spring Bancorp • City Holding Company • Capital City Group • Townebank • Cardinal Financial • Pinnacle Financial • SCBT Financial • S&T Bancorp • Seacoast Banking • Harleysville National • Sun Corporation • Virginia Commerce

Slide 39: Profitability
Profitability StellarOne 2009 Actual 2009 Peer Average Return on Average Assets -.28% -.18% Return on Average Equity -1.99% -3.02%
Slide 40: Revenue Growth and Composition
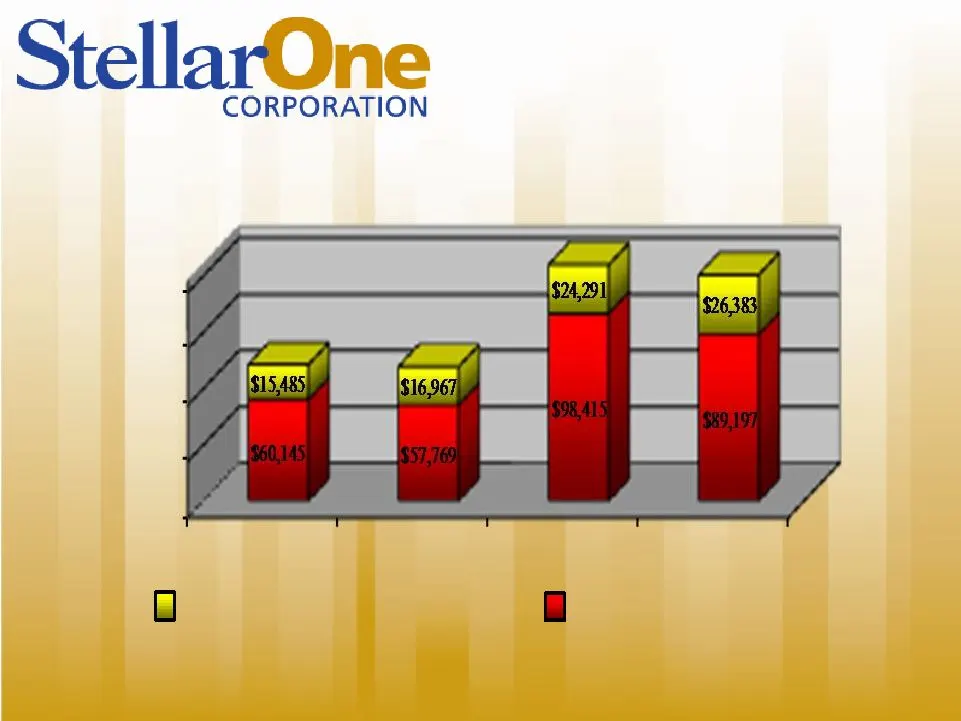
Revenue Growth and Composition $15,000 $40,000 $65,000 $90,000 $115,000 2006 2007 2008 2009 Non - interest Income Net Interest Income
Slide 41: Net Interest Margin
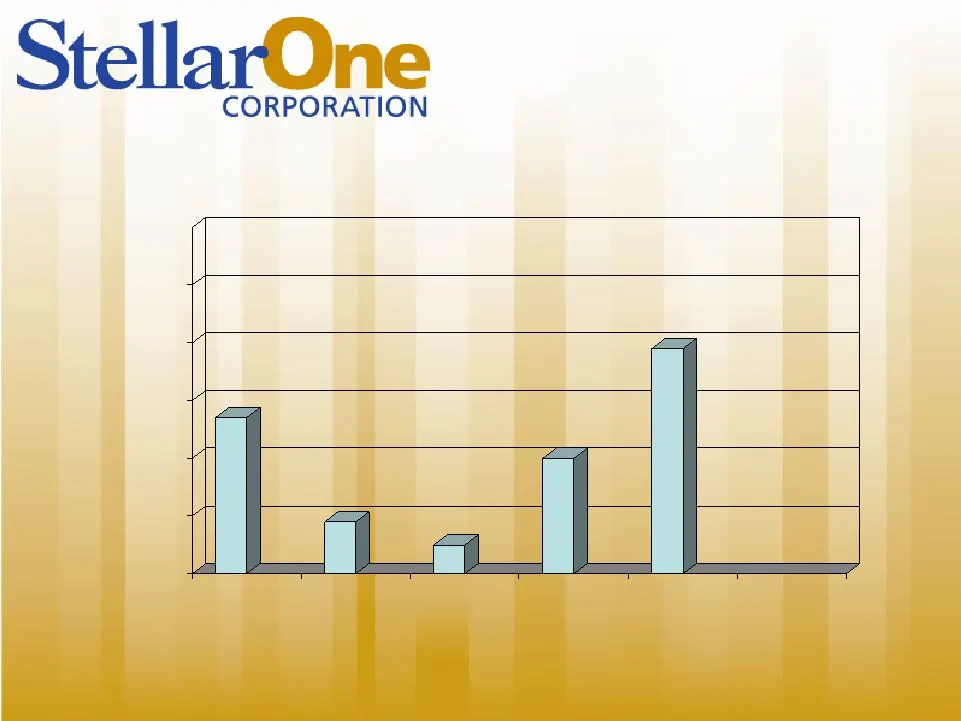
3.52% 3.34% 3.30% 3.45% 3.64% 3.25% 3.35% 3.45% 3.55% 3.65% 3.75% 3.85% 1Q 2009 2Q 2009 3Q 2009 4Q2009 Peer YE 2009 Net Interest Margin
Slide 42: Earnings and Dividends
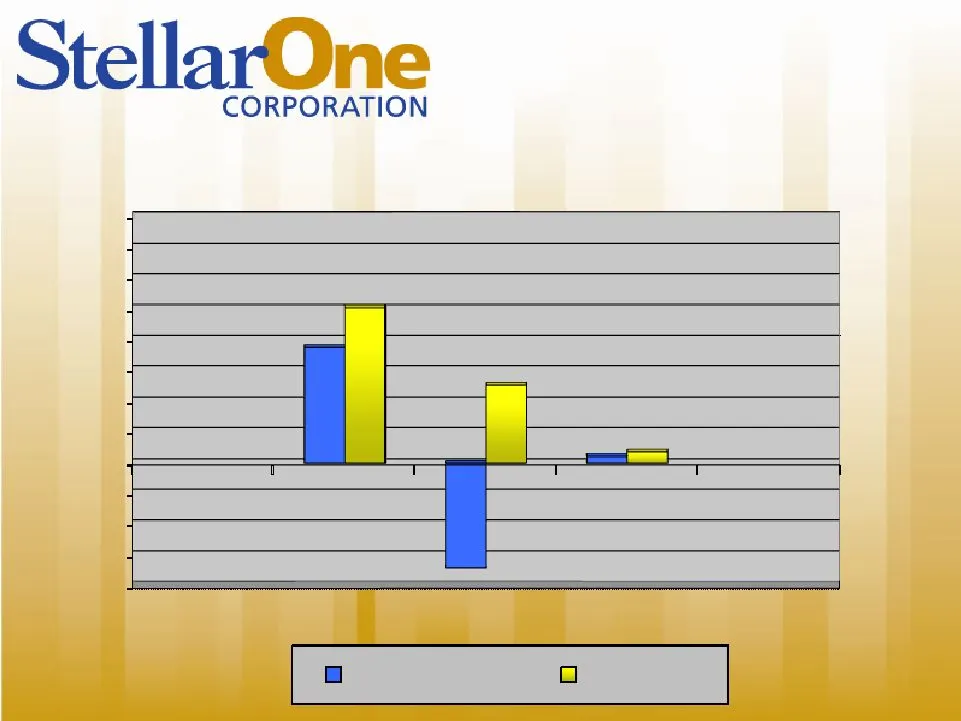
Earnings and Dividends (in thousands) -$10,000 -$7,500 -$5,000 -$2,500 $0 $2,500 $5,000 $7,500 $10,000 $12,500 $15,000 $17,500 $20,000 2008 2009 4Q - 2009 $9,411 ($8,530) $546 $12,614 $6,350 $908 Earnings (Loss) Dividends

Slide 43: Asset Quality
2006 2007 2008 2009 Peer Non-performing Assets / Total Assets 0.19% 0.44% 1.66% 2.13% 2.60% Net Charge-offs / Average Loans (0.01)% 0.12% 0.80% 1.24% 1.09% Allowance / Loans 1.19% 1.23% 1.35% 1.84% 1.69% Asset Quality
Slide 44: Balance Sheet
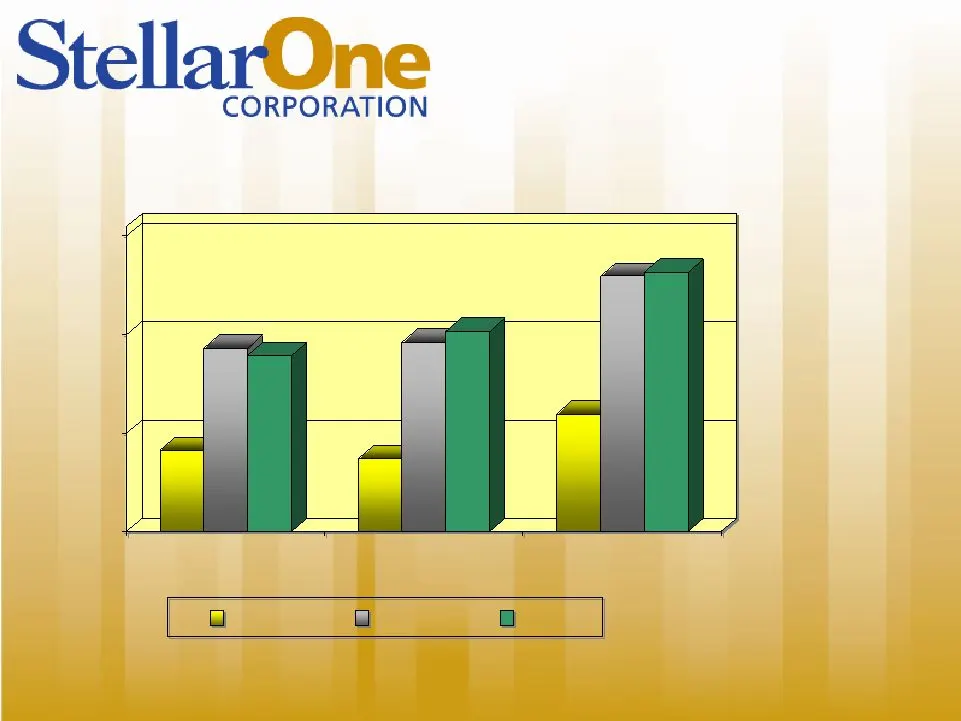
$400 $1,400 $2,400 $3,400 Loans Deposits Assets 2007 2008 2009 $400 $1,400 $2,400 $3,400 Loans Deposits Assets 2007 2008 2009 Balance Sheet 2009 vs. 2008 Loans (3.4)% Deposits 4.9% Assets 1.3%
Slide 45: Deposit Base
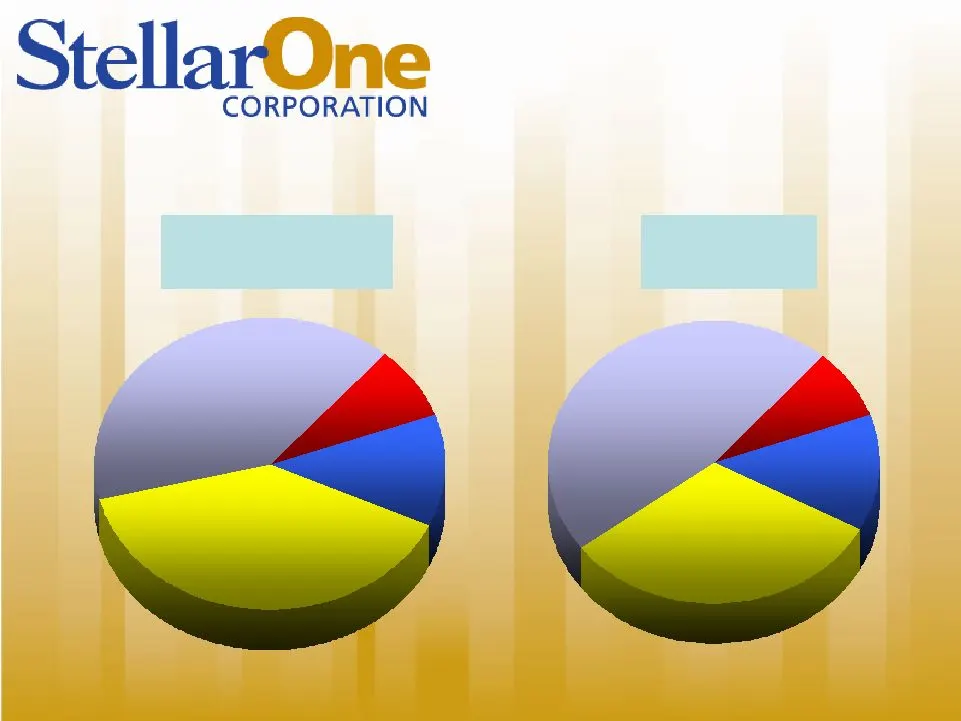
Deposit Base Time Deposits, 40% Savings deposits, 8% Demand deposits, 39% Non- interest bearing, 12% Non- interest bearing 13% Savings deposits 8% Demand deposits, 32% Time Deposits, 47% 2009 - $2.44 Billion 2008 – $2.32 Billion
Slide 46: Book Value per Common Share
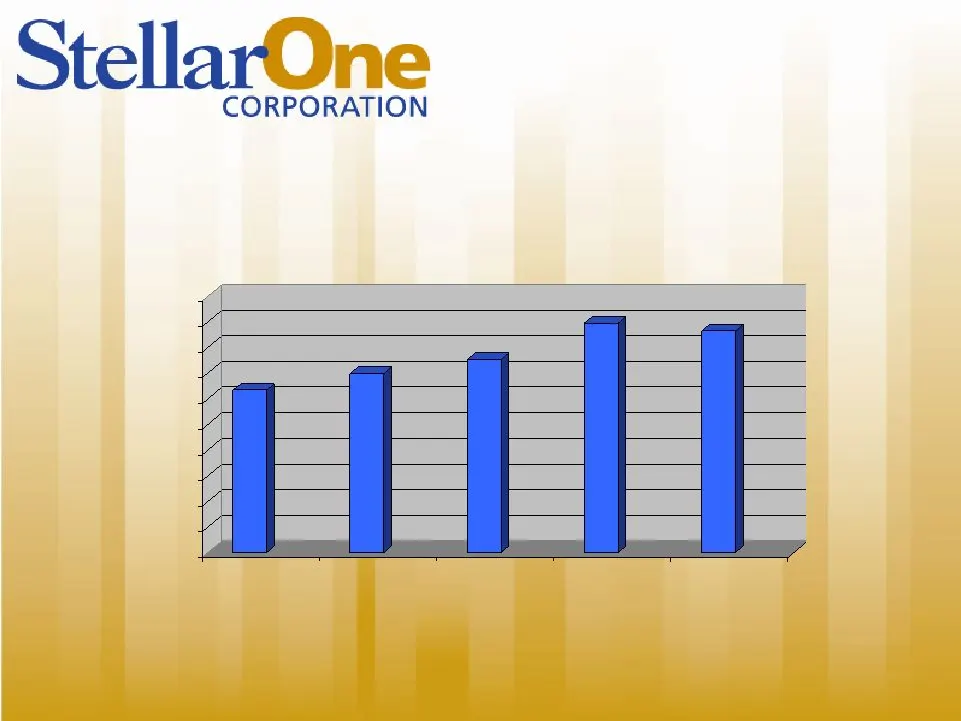
$12.66 $13.97 $15.08 $17.90 $17.30 $0.00 $2.00 $4.00 $6.00 $8.00 $10.00 $12.00 $14.00 $16.00 $18.00 $20.00 2005 2006 2007 2008 2009 Book Value per Common Share

Slide 47: Capital Ratios
Capital Ratios StellarOne 2009 Actual 2009 Peer Median Tier 1 Capital to Risk Adjusted Assets 13.21% 12.35% Tangible Equity to Tangible Assets 10.26% 8.84% Total Equity to Total Assets 14.46% 14.48%

Slide 48: Liquidity
• Liquid assets (cash and securities) of $551 million or 18% of balance sheet. • Securities portfolio is of a high quality with no embedded credit risk and short duration. • Untapped lines of credit exceed $85 million which are available if the need warrants for use as standby sources of liquidity.
Slide 49: Overhead by Quarter
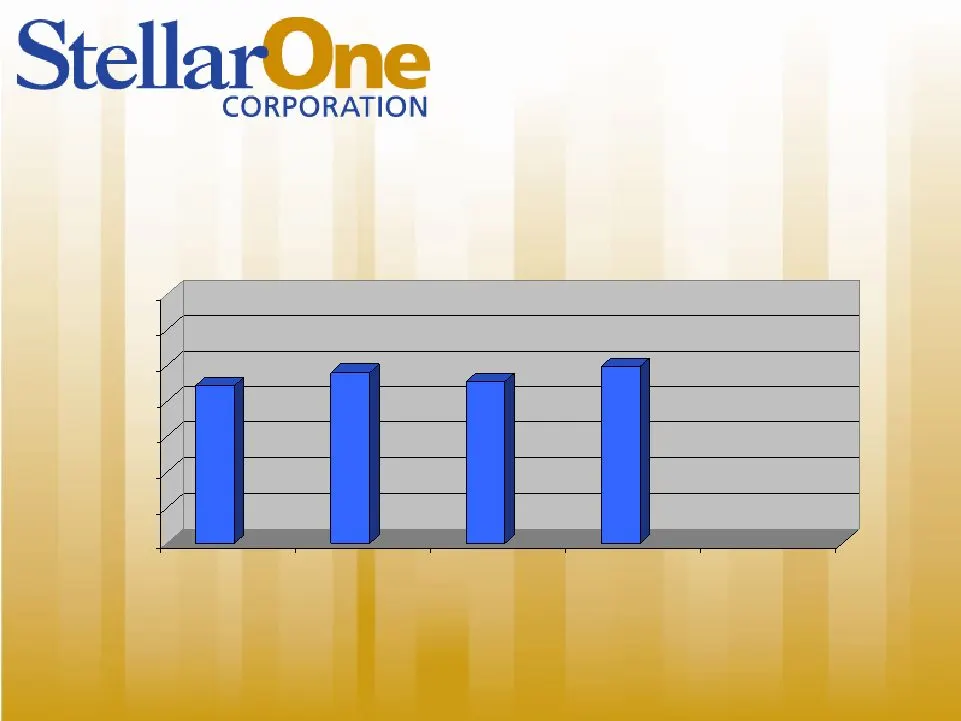
$22,224 $24,057 $22,748 $24,875 $0 $5,000 $10,000 $15,000 $20,000 $25,000 $30,000 $35,000 1Q - 2009 2Q - 2009 3Q - 2009 4Q - 2009 Overhead by Quarter (Dollars in thousands)
Slide 50: FTE History
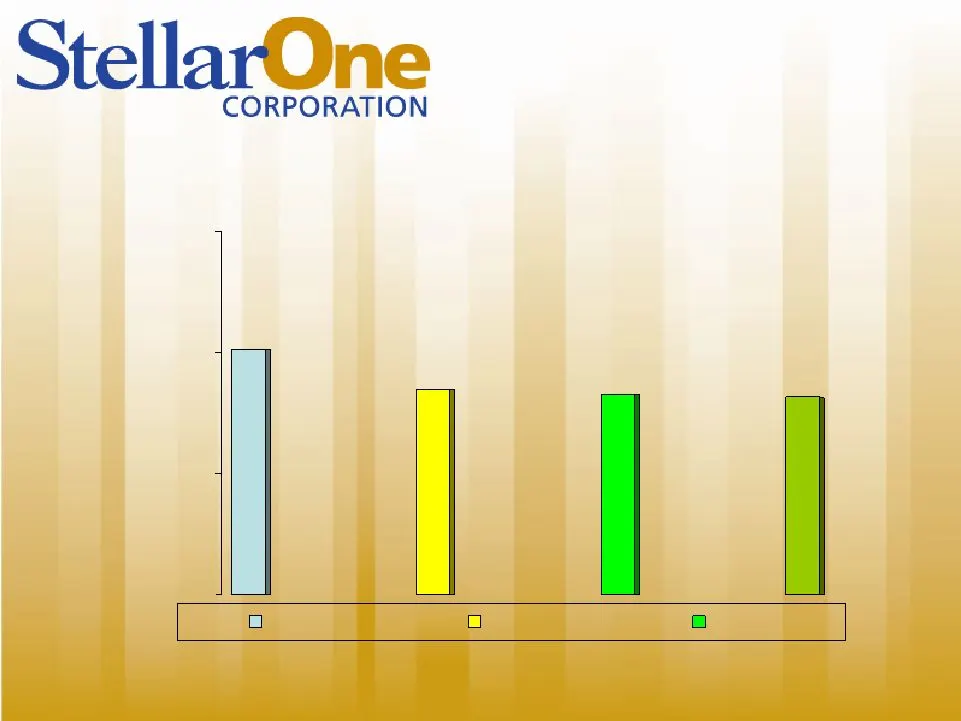
1,013 1,000 1,500 Jul-07 Dec-08 Dec-09 FTE History

Slide 51: Valuation
Valuation StellarOne 2009 Actual 2009 Peer Average YTD Stock Performance 44.6% 17.5% Percentage of Book Value 85% 118% Market Capitalization $343 M $372 M

Slide 52: Total Return Performance
YTD % 1yr. % 5yr. % StellarOne (STEL) 46.62% 5.73% (24.30)% Peers 32.70% 3.47% (22.50)% Total Return Performance

Slide 53: Coverage and Ownership
Coverage and Ownership • StellarOne now covered by ten buy side analysts. • Institutional ownership is now almost 30% of total ownership. • Top four holders: – BlackRock Global 4.88% – Vanguard Group 3.99% – Dimensional Fund 3.74% – Heartland Advisors 2.74%

Slide 54: Questions and Discussion
Questions and Discussion Thank You!
Source: SEC EDGAR · 8-K filed Apr 27, 2010
More decks from Stellarone Corp
 Merger or Acquisition (June 2013)17 slides · Jun 12, 2013
 Merger or Acquisition (June 2013)17 slides · Jun 10, 2013
 Q1 2010 Earnings Presentation23 slides · May 21, 2010
 Keefe, Bruyette & Woods Community Bank Investor Conference (July 2009)32 slides · Jul 29, 2009
 FNB Corp (VA) — Merger or Acquisition (October 2007)5 slides · Oct 2, 2007
 FNB Corp \va\ — Merger or Acquisition (August 2007)23 slides · Aug 14, 2007