Whitney — KBW's Regional Bank Conference 2006
31 slides from Whitney's conference presentation, Mar 1, 2006
Slide 1: Whitney – KBW's Regional Bank Conference
WHITNEY KBW’s Regional Bank Conference March 2, 2006

Slide 2: Forward-Looking Statements
This presentation may include forward-looking statements containing expectations about future conditions and descriptions of future plans and strategies. Whitney's ability to accurately predict the effects of future plans or strategies is inherently limited such that actual results and performance c
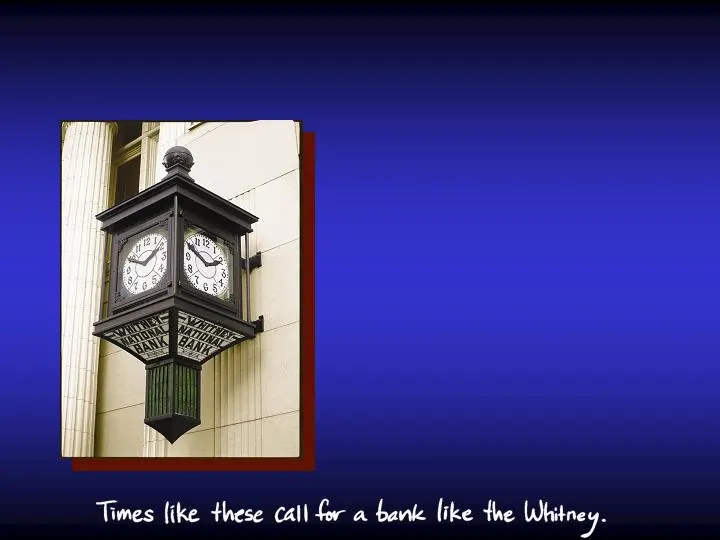
Slide 3: History
Whitney National Bank - Since 1883 - Oldest Continually Chartered Bank in New Orleans 2 History
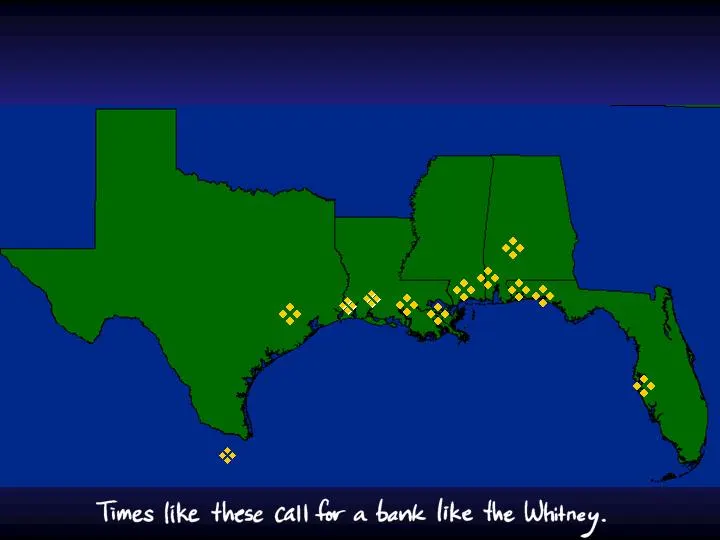
Slide 4: Geographic Footprint
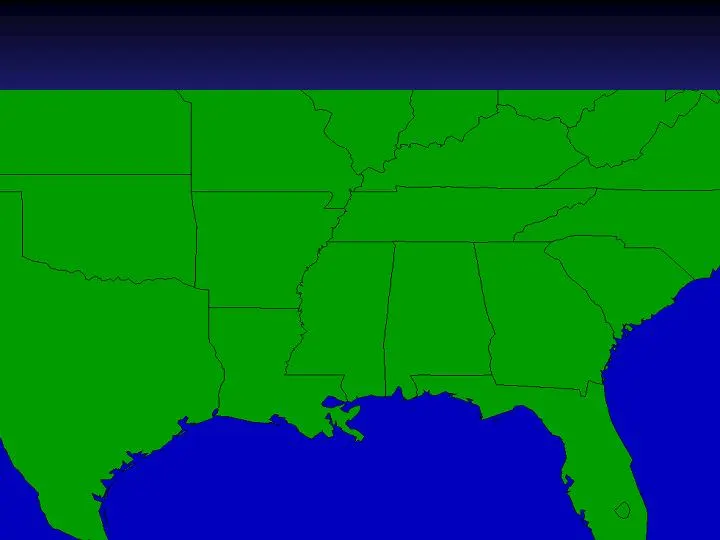
Whitney Locations Texas Louisiana Mississippi Alabama Florida 3 Geographic Footprint
Slide 5: Whitney's Corporate Philosophy
Soundness Profitability Growth In that order of priority 4 Whitney’s Corporate Philosophy
Slide 6: Impact of Recent Storms
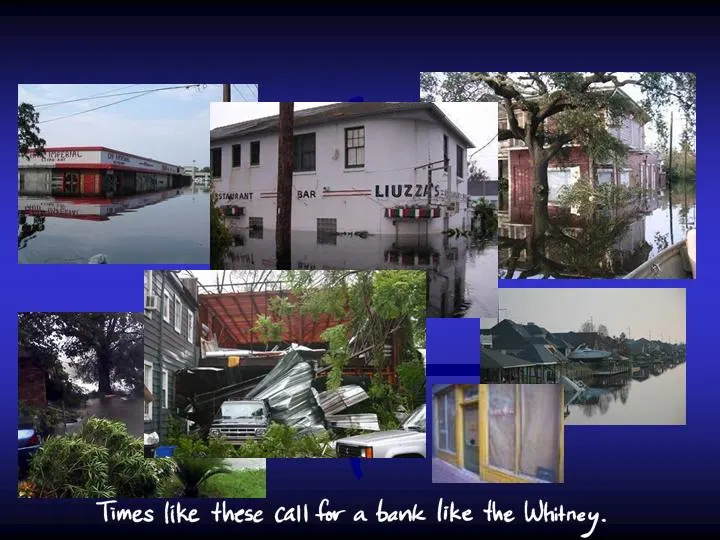
Katrina Greater New Orleans Mississippi Gulf Coast Coastal Alabama Western Panhandle of Florida Rita Southwest Coastal Louisiana Principally Lake Charles 5 Impact of Recent Storms
Slide 7: Impacted Market Areas
67 Branches – 47% 9 remain closed 1,600 FTEs - 65% over 600 temporarily relocated $2.8 billion loans – 43% $3.6 billion deposits – 49% 6 Impacted Market Areas
Slide 8: Disaster Recovery and Casualty Losses
Relocation Costs Insurance coverage up to $25 million Property Damage Insurance coverage at least $150 million Contingent Gains on Casualty Losses 7 Disaster Recovery and Casualty Losses
Slide 9: Times like these call for a bank like the Whitney
Times like these call for a bane like the Whitney.
Slide 10: Impact of Storms on Loan Portfolio
$2.8 billion Loans in Impacted Areas 83% Comm’l & Comm’l Real Estate Approximately 75% over $1 million Contractors, oil & gas and certain other customers little to positively impacted 25% middle market and small business customers more susceptible to prolonged recovery period and market shrinkage 17
Slide 11: Impact of Storms on Credit Quality
$31 million Additional to Allowance Assessment Process Reviewed all significant criticized loans and $1.1 billion sample of commercial loans over $1 million Overlayed results of sample on remaining impacted portfolio, similar to acquisition due diligence process Differentiate commercial loans over a
Slide 12: Impact of Storms on Credit Quality
Assessment Process Continued in 4 th Qtr Reviewed all criticized loans and all commercial loans over $250,000 plus some other smaller loans Overlayed results of reviewed loans on remaining impacted portfolio Consumer loans segmented by credit scores and collateral as in 3 rd Qtr 11 Impact of Storms
Slide 13: Impact of Storms on Credit Quality
Assessment Process Will Continue Indefinitely All criticized loans and larger loans will continue to be reviewed each quarter As this process continues, there will be fewer and fewer unreviewed loans and less need for an overlay process Impact of storms on Whitney’s small portfolio of consumer loans
Slide 14: Portfolio Risks and Uncertainties
Property damage and insurance coverage for customers Length of recovery period Long-term economic impact Rebuilding of public infrastructure Government, private or philanthropic investment Population and economic contraction 13 Portfolio Risks and Uncertainties
Slide 15: Allowance for Loan Losses
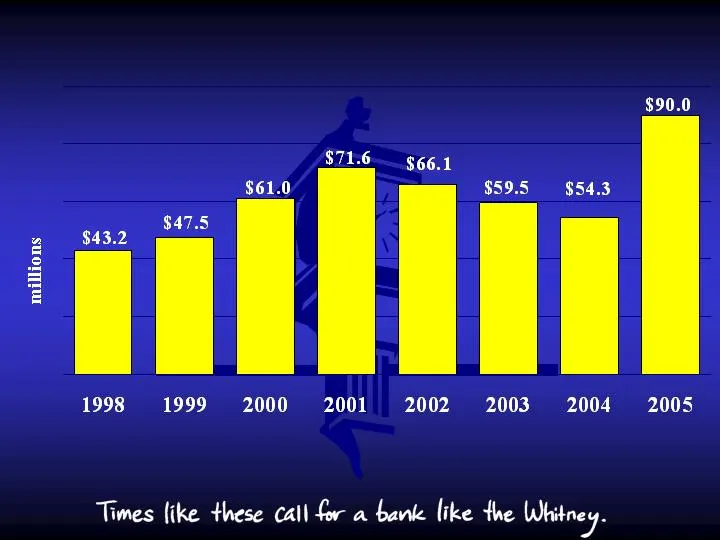
1.24% 1.21% 1.33% 1.59% 1.48% 1.22% .97% 1.37% % Loans 14 Allowance for Loan Losses
Slide 16: Loans Internally Classified As Having Above Normal Credit Risks
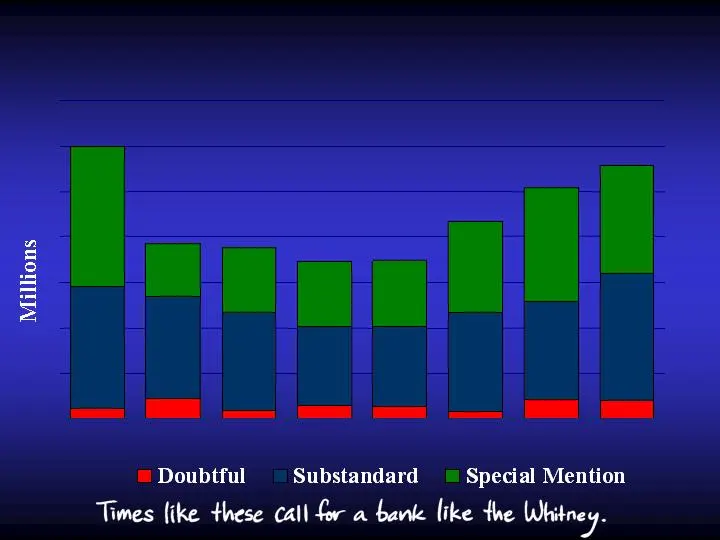
$299 $193 $187 $173 $174 $217 Dec-01 Dec-02 Dec-03 Dec-04 Mar-05 Jun-05 $279 Sep-05 $255 Dec-05 15 Loans Internally Classified As Having Above Normal Credit Risks
Slide 17: Nonperforming Assets
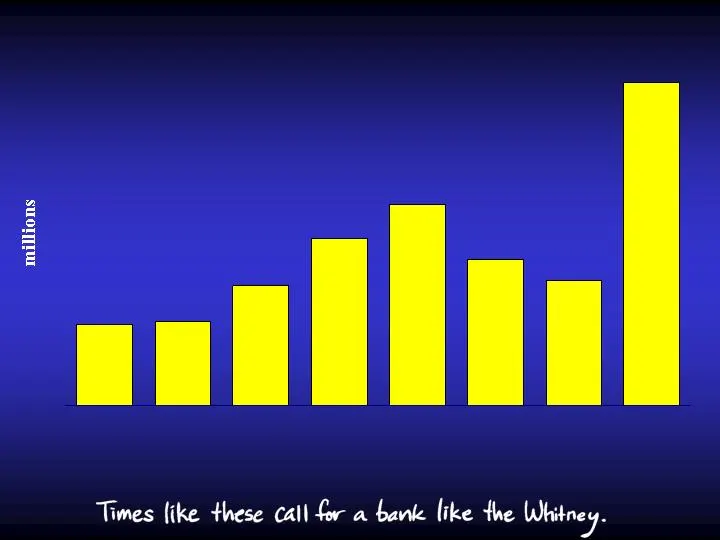
$67.3 $16.8 $17.5 $25.0 $34.8 $42.1 $30.4 $26.1 1998 1999 2000 2001 2002 2003 2004 2005 16 % Loans: .48% .45% .55% .77% .95% .62% ..46% 1.03% Nonperforming Assets
Slide 18: Net Charge-Offs
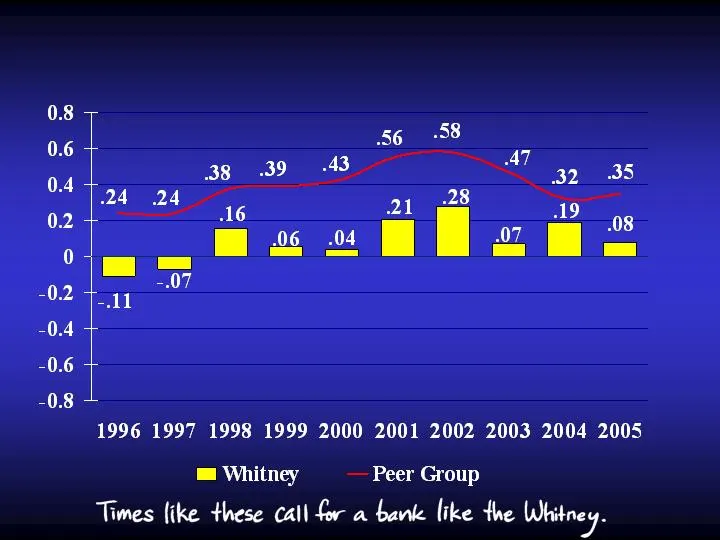
17 Net Charge-Offs Percent Net Charge-offs to Average Loans
Slide 19: History Review 2003 – 2005: Soundness Measures
18 History Review 2003 – 2005 137% 230% 221% Allowance/ Nonperforming Loans 1.37% .97% 1.22% Allowance/Loans 1.00% .42% .55% Nonperforming Loans/Total Loans .08% .19% .07% Net Charge Offs/Total Loans 2005 2004 2003 Soundness Measures 9.51% 11.00% 10.84% Shareholders’ Equity/ Total Assets
Slide 20: Disaster Deployment and Recovery
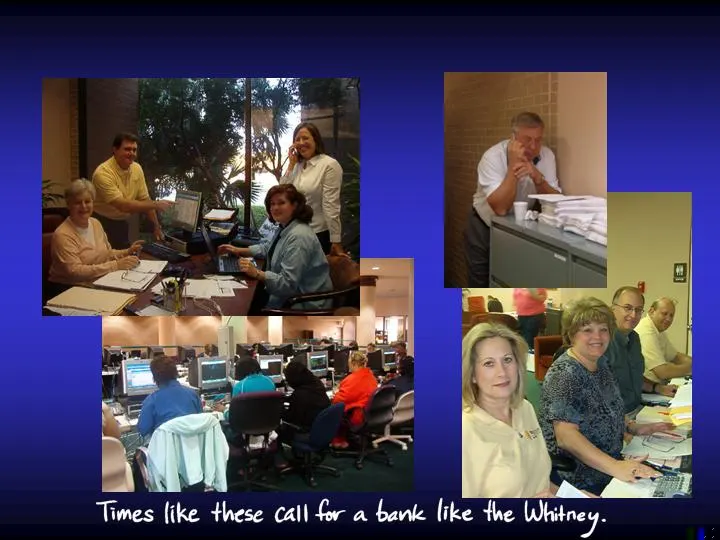
19 Disaster Deployment and Recovery
Slide 21: Disaster Deployment and Recovery
Over 600 Employees temporarily relocated Recovery sites in Houston, Chicago, Atlanta, Baton Rouge and Mobile Contact with customers and importance of the Whitney Banker Future plans and arrangements 20 Disaster Deployment and Recovery
Slide 22: Historic Earnings for 2005
21 Historic Earnings For 2005
Slide 23: Condensed Income Statement 2005
22 Year Ended Dec. 31 2005 2004 Growth Net interest income (TE) $ 393.0 $ 326.3 20 % Noninterest income 82.2 82.5 - Total revenue (TE) 475.2 408.8 16 Noninterest expense 287.0 260.3 10 Provision for loan losses 37.0 2.0 N.M. Net income $ 102.3 $ 97.1 5 % Basic EPS $ 1.65 $ 1.59 4 % Diluted EPS $ 1.6
Slide 24: History Review 2003 - 2005: Profitability Measures
23 History Review 2003 - 2005 3.77% 11.96% 1.36% 62.49% 22.97% 4.47% 2003 3.77% (3.64)% EPS Growth 10.94% 11.02% Return on Equity 1.15% 1.23% Return on Assets 60.40% 63.69% Efficiency Ratio 17.30% 20.19% Noninterest Income/Total Revenue 4.85% 4.45% Net Interest Margin 2005 2004 Profitability Measure
Slide 25: History Review 2003 – 2005: Growth Measures
24 History Review 2003 – 2005 12.84% 9.01% 3.15% Assets 6.11% 7.01% 8.28% Equity Growth 13.82% 7.34% 2.84% Total Deposits 11.82% 8.48% 7.43% Low Cost Deposits 18.49% 12.70% 5.12% Loans 2005 2004 2003 Growth Measures
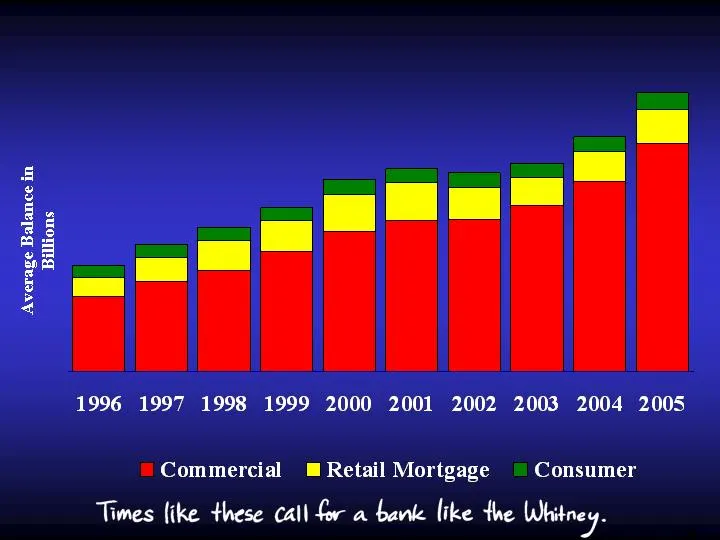
Slide 26: Loan Growth
$2.3 $2.8 $3.2 $3.6 $4.2 $4.5 Growth: 23% 20% 14% 13% 18% 6% (2)% 5% 13% 18% $4.4 $4.6 $5.2 $6.1 25 Loan Growth
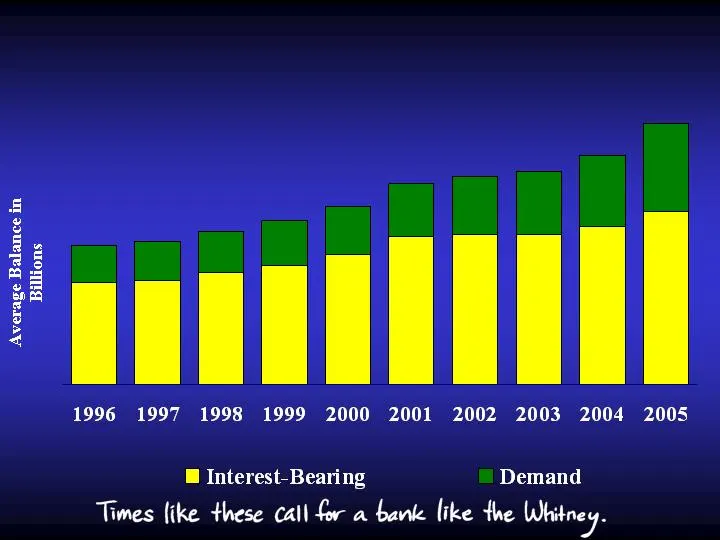
Slide 27: Deposit Growth
$3.8 $4.0 $4.2 $4.5 $4.9 $5.5 Growth: 4% 3% 7% 7% 9% 13% 4% 3% 7% 14% $5.8 $5.9 $6.3 $7.2 26 Deposit Growth
Slide 28: Acquisition Activity
Destin Bancshares, Inc., Destin, Florida, April 2005 First National Bancshares, Inc., Bradenton, Florida, expected 2 nd Qtr 2006 27 Acquisition Activity
Slide 29: New Business Opportunities
28 New Business Opportunities In-Market Opportunities New Market Opportunities Sarasota Naples Jacksonville Tallahassee Birmingham Huntsville Memphis St. Louis Tampa Houston Baton Rouge Montgomery Northshore
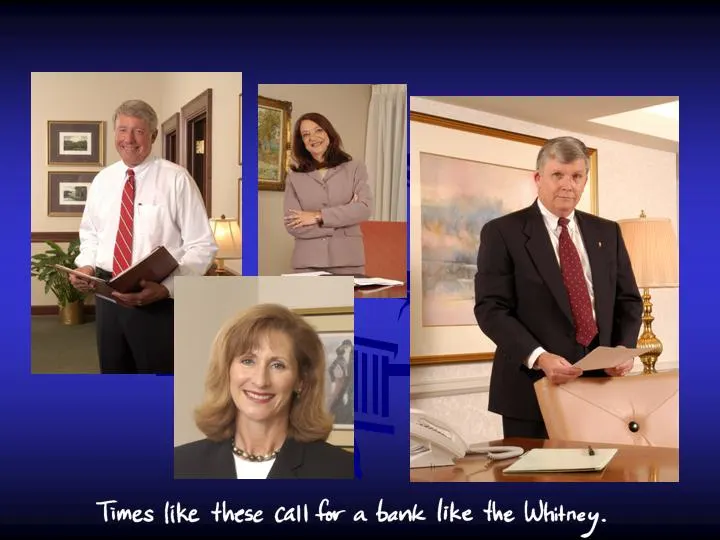
Slide 30: Focus on the Whitney Banker
29 Focus on the Whitney Banker
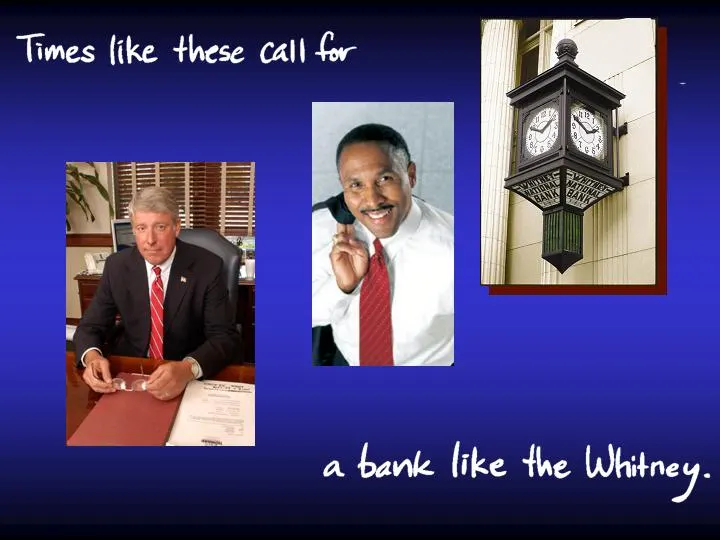
Slide 31: Times like these call for a bank like the Whitney
Times like these call fv a bane like the Whitney.
Source: SEC EDGAR · 8-K filed Mar 1, 2006
More decks from Whitney Holding Corp
 Q4 2010 Earnings Presentation15 slides · Jan 27, 2011
 Merger or Acquisition (December 2010)18 slides · Dec 23, 2010
 Merger or Acquisition (December 2010)18 slides · Dec 22, 2010
 Stifel Nicolaus Bank & Thrift Conference 201030 slides · Nov 2, 2010
 Q3 2010 Earnings Presentation16 slides · Oct 26, 2010
 Q2 2010 Earnings Presentation18 slides · Jul 27, 2010