Fauquier Bankshares — Shareholder Meeting (May 2018)
33 slides from Fauquier Bankshares's shareholder meeting presentation, May 15, 2018
Slide 1: Annual Shareholders' Meeting May 15, 2018
_____________________ FAUQUIER BANKSHARES, INC. ANNUAL SHAREHOLDERS’ MEETING May 15, 2018
Slide 2: Safe Harbor Statement
Today’s presentation may include forward-looking statements. These statements represent the Company's beliefs regarding future events that, by their nature, are uncertain and outside of the Company’s control. The Company’s actual results and financial condition may differ, possibly materially, from
Slide 3: Board of Directors
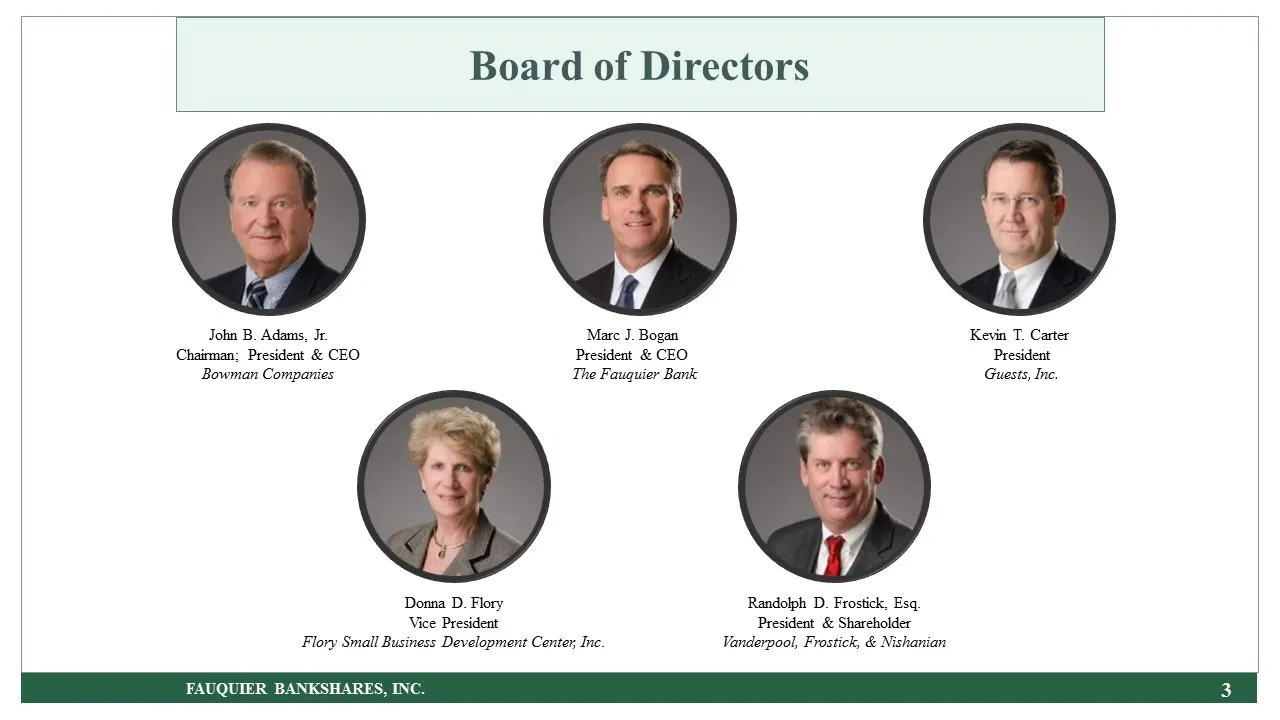
FAUQUIER BANKSHARES, INC. Board of Directors John B. Adams, Jr. Chairman; President & CEO Bowman Companies Marc J. Bogan President & CEO The Fauquier Bank Kevin T. Carter President Guests, Inc. Donna D. Flory Vice President Flory Small Business Development Center, Inc. Randolph D. Frostick, Esq. Pre
Slide 4: Board of Directors
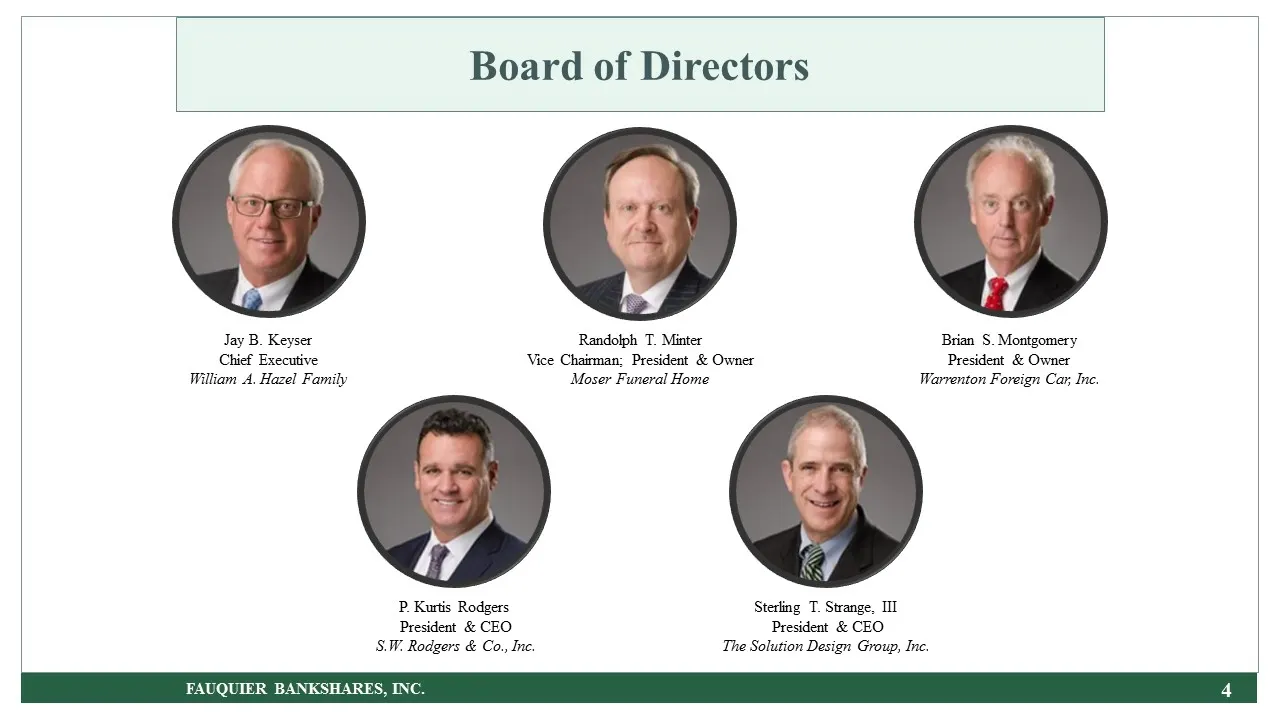
Board of Directors Jay B. Keyser Chief Executive William A. Hazel Family Randolph T. Minter Vice Chairman; President & Owner Moser Funeral Home Brian S. Montgomery President & Owner Warrenton Foreign Car, Inc. P. Kurtis Rodgers President & CEO S.W. Rodgers & Co., Inc. Sterling T. Strange, III Presid
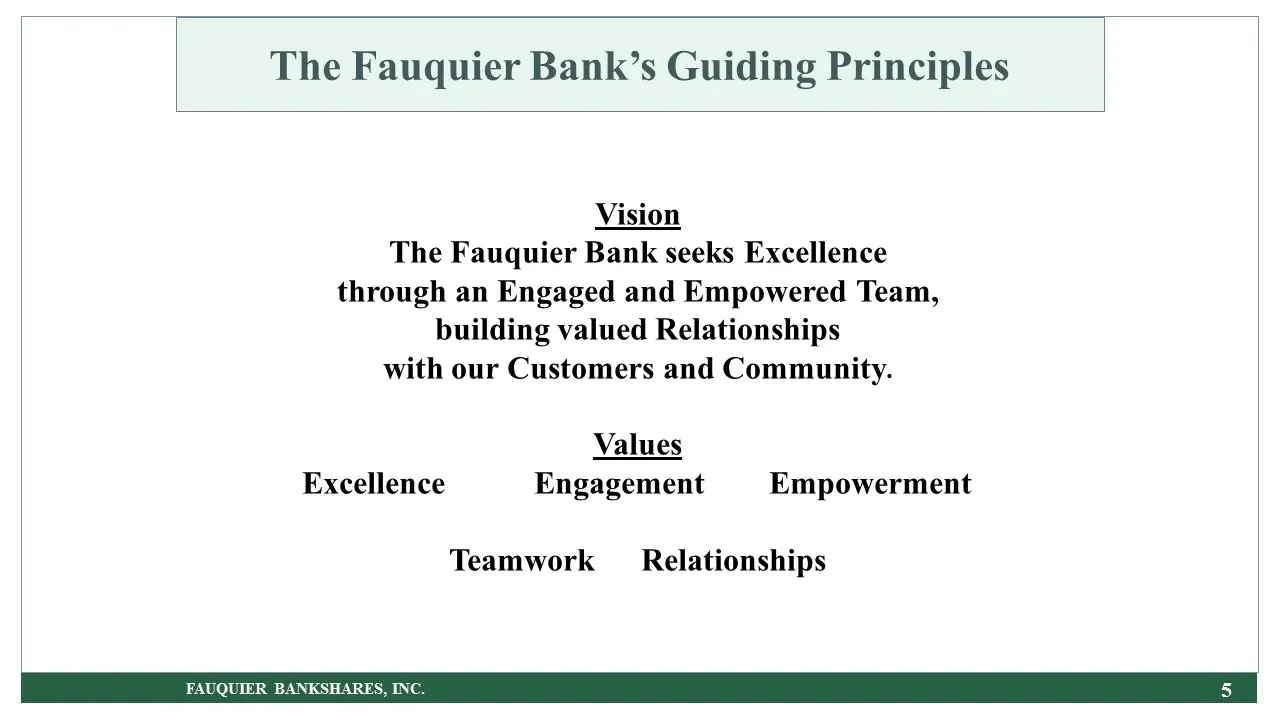
Slide 5: The Fauquier Bank's Guiding Principles
The Fauquier Bank’s Guiding Principles FAUQUIER BANKSHARES, INC. Vision The Fauquier Bank seeks Excellence through an Engaged and Empowered Team, building valued Relationships with our Customers and Community. Values Excellence Engagement Empowerment Teamwork Relationships
Slide 6: Aligning Values with Strategic Initiatives to Increase Shareholder Value
FAUQUIER BANKSHARES, INC. Aligning Values with Strategic Initiatives to Increase Shareholder Value
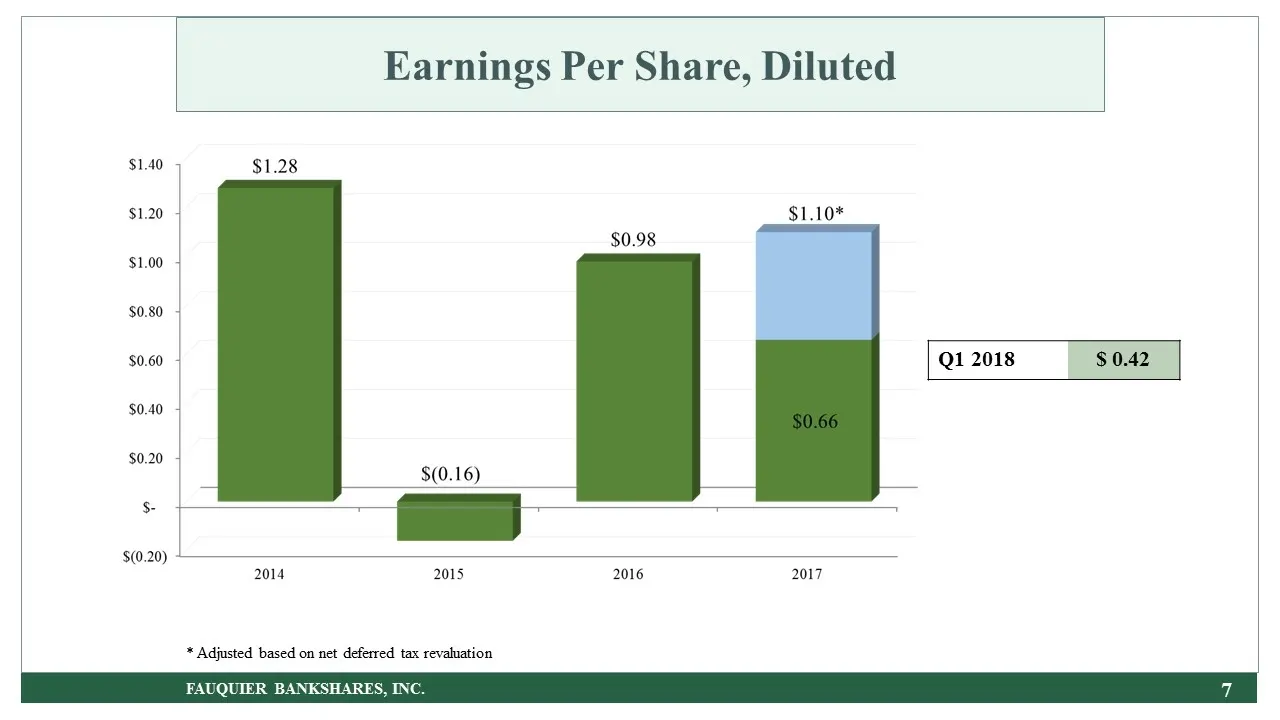
Slide 7: Earnings Per Share, Diluted
Earnings Per Share, Diluted FAUQUIER BANKSHARES, INC. Q1 2018 $ 0.42 * Adjusted based on net deferred tax revaluation
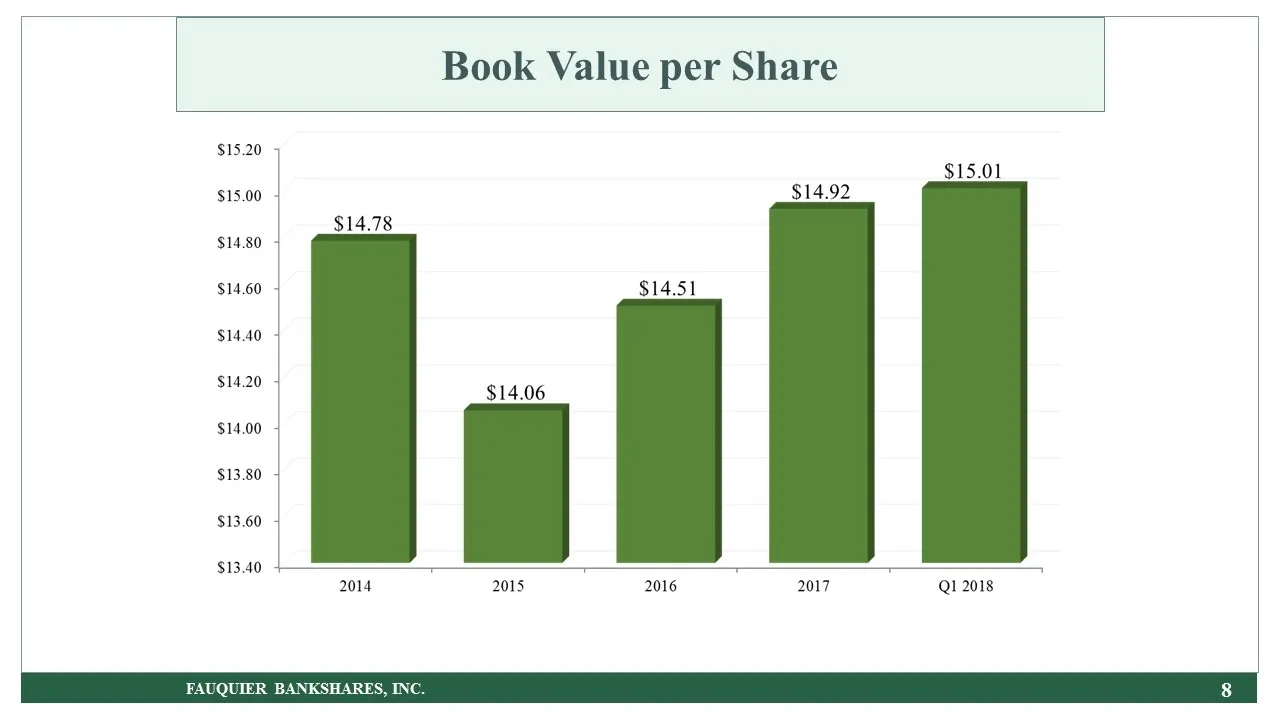
Slide 8: Book Value per Share
Book Value per Share FAUQUIER BANKSHARES, INC.
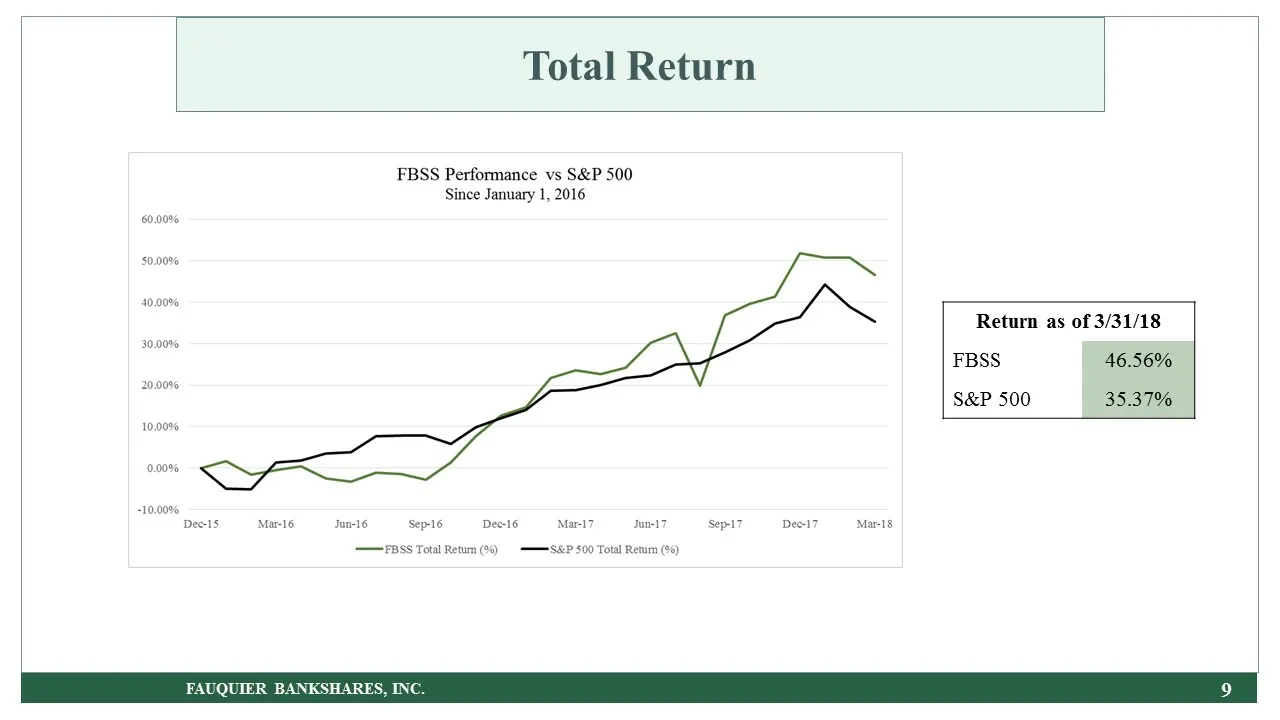
Slide 9: Total Return
Total Return FAUQUIER BANKSHARES, INC. Return as of 3/31/18 FBSS 46.56% S&P 500 35.37%
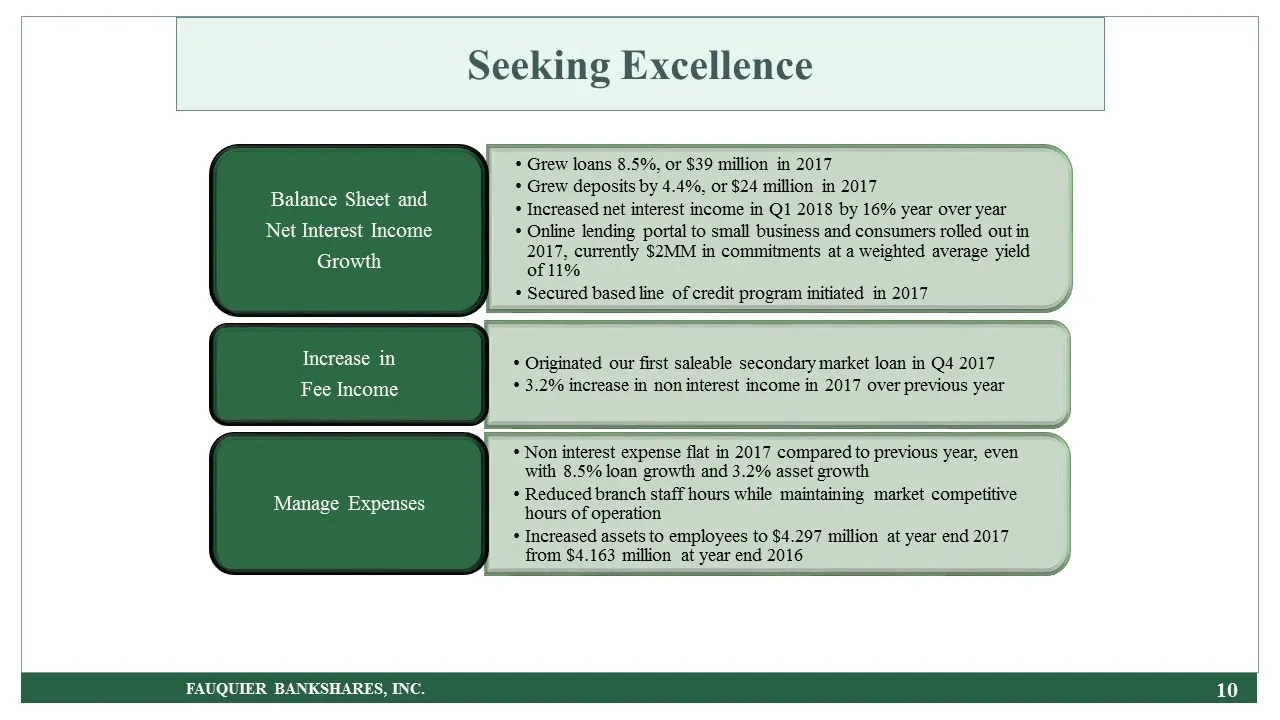
Slide 10: Seeking Excellence
FAUQUIER BANKSHARES, INC. Seeking Excellence Balance Sheet and Net Interest Income Growth Increase in Fee Income Manage Expenses Grew loans 8.5%, or $39 million in 2017 Grew deposits by 4.4%, or $24 million in 2017 Increased net interest income in Q1 2018 by 16% year over year Online lending portal
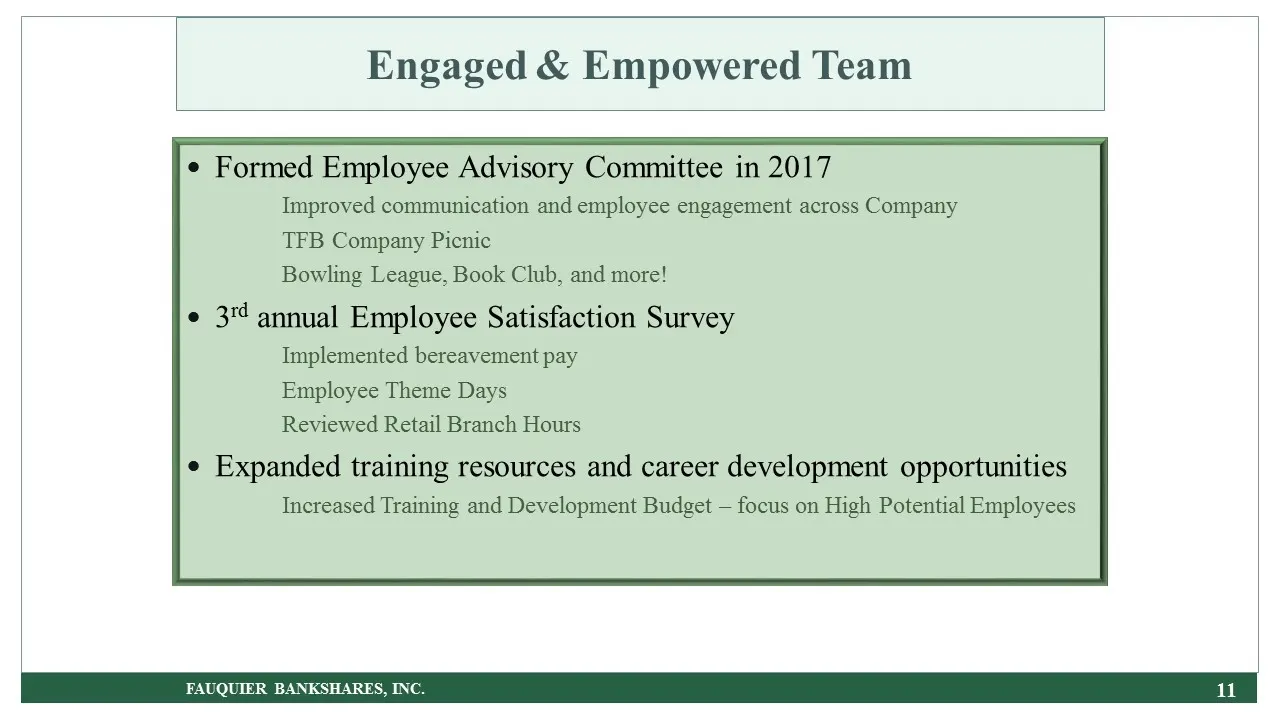
Slide 11: Engaged & Empowered Team
Formed Employee Advisory Committee in 2017 Improved communication and employee engagement across Company TFB Company Picnic Bowling League, Book Club, and more! 3rd annual Employee Satisfaction Survey Implemented bereavement pay Employee Theme Days Reviewed Retail Branch Hours Expanded training reso
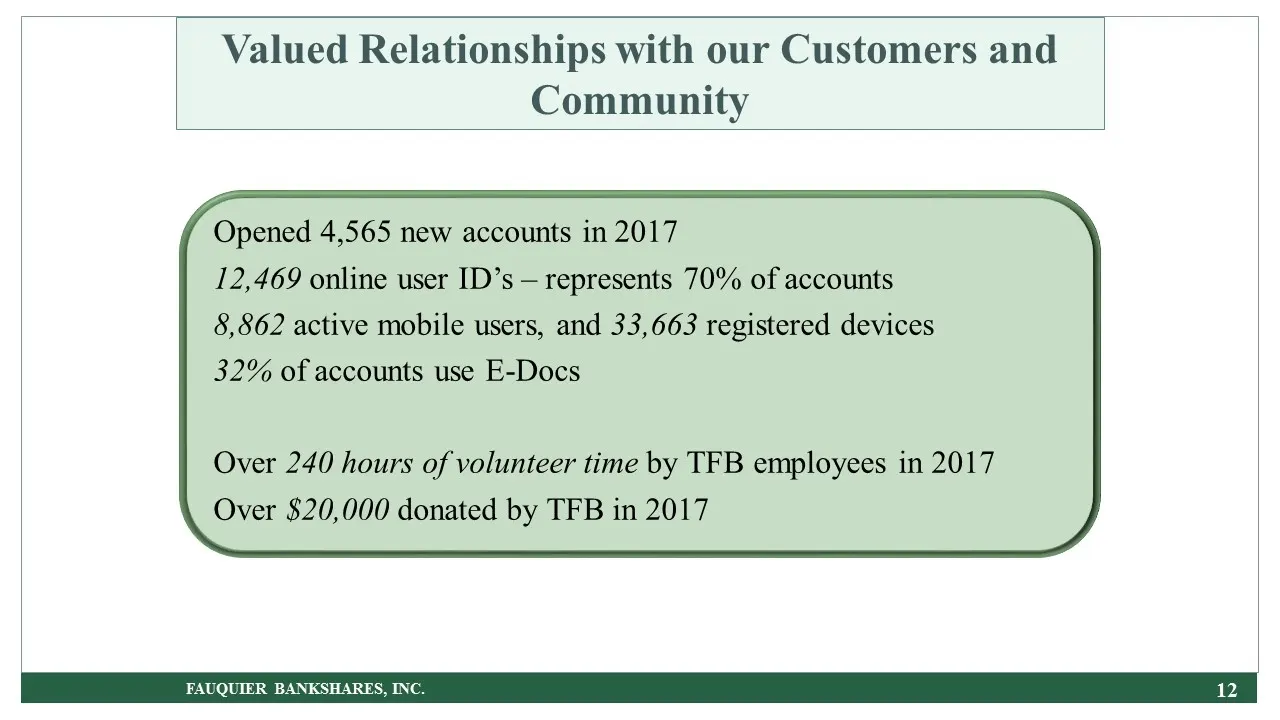
Slide 12: Valued Relationships with our Customers and Community
Opened 4,565 new accounts in 2017 12,469 online user ID’s – represents 70% of accounts 8,862 active mobile users, and 33,663 registered devices 32% of accounts use E-Docs Over 240 hours of volunteer time by TFB employees in 2017 Over $20,000 donated by TFB in 2017 Valued Relationships with our Custo
Slide 13: FAUQUIER BANKSHARES, INC. 13
FAUQUIER BANKSHARES, INC. 13
Slide 14: Net Income
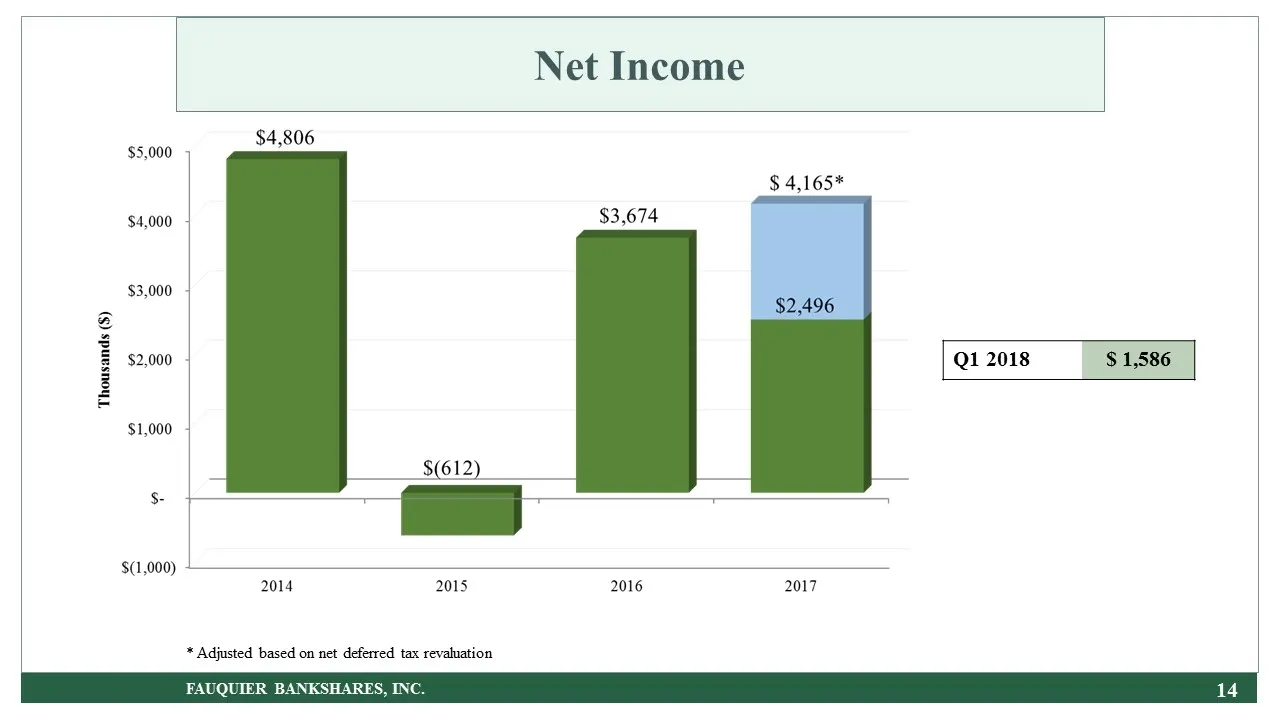
14 FAUQUIER BANKSHARES, INC. Net Income Q1 2018 $ 1,586 * Adjusted based on net deferred tax revaluation
Slide 15: Return on Average Assets (ROA)
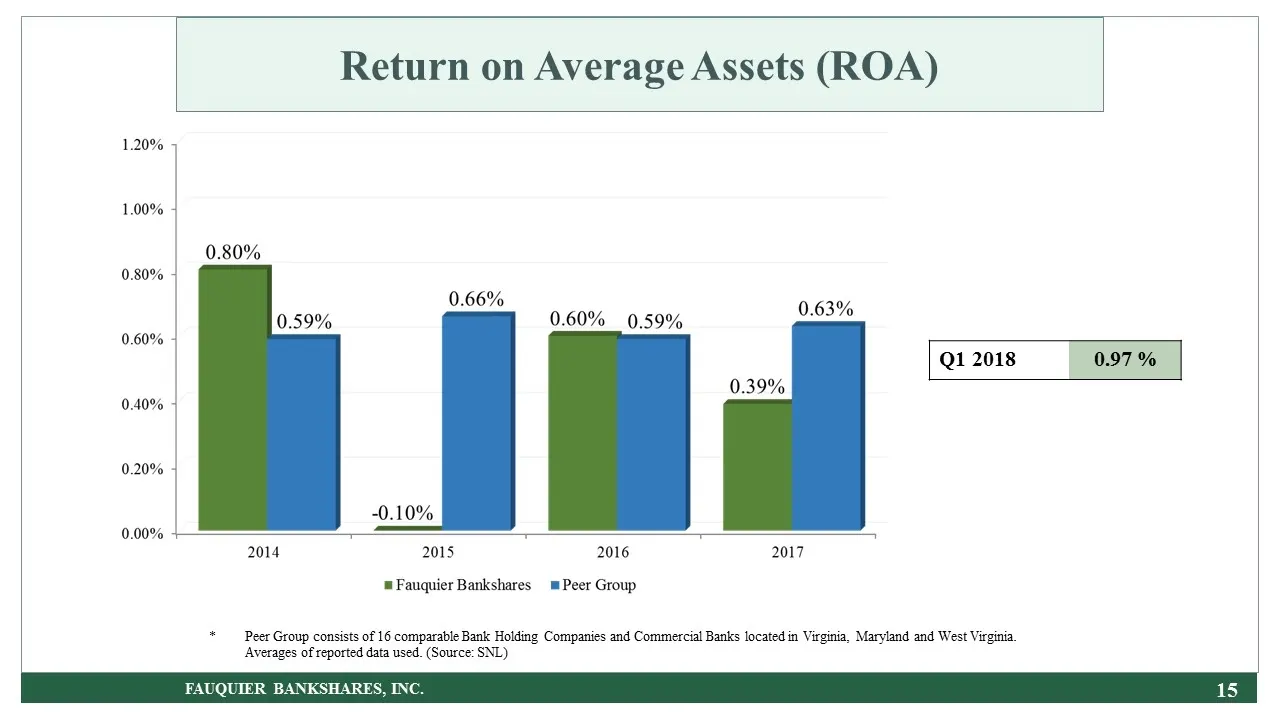
Return on Average Assets (ROA) FAUQUIER BANKSHARES, INC. *Peer Group consists of 16 comparable Bank Holding Companies and Commercial Banks located in Virginia, Maryland and West Virginia. Averages of reported data used. (Source: SNL) Q1 2018 0.97 %
Slide 16: Return on Average Equity (ROE)
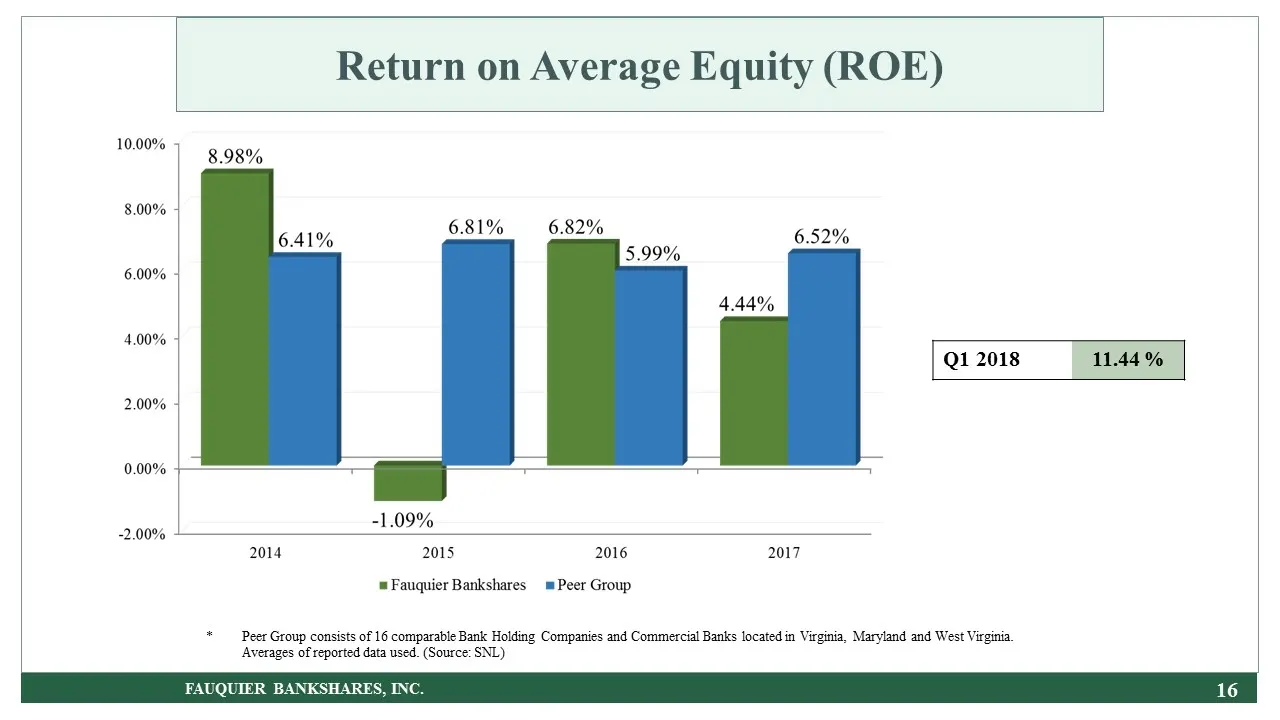
16 FAUQUIER BANKSHARES, INC. *Peer Group consists of 16 comparable Bank Holding Companies and Commercial Banks located in Virginia, Maryland and West Virginia. Averages of reported data used. (Source: SNL) Return on Average Equity (ROE) Q1 2018 11.44 %
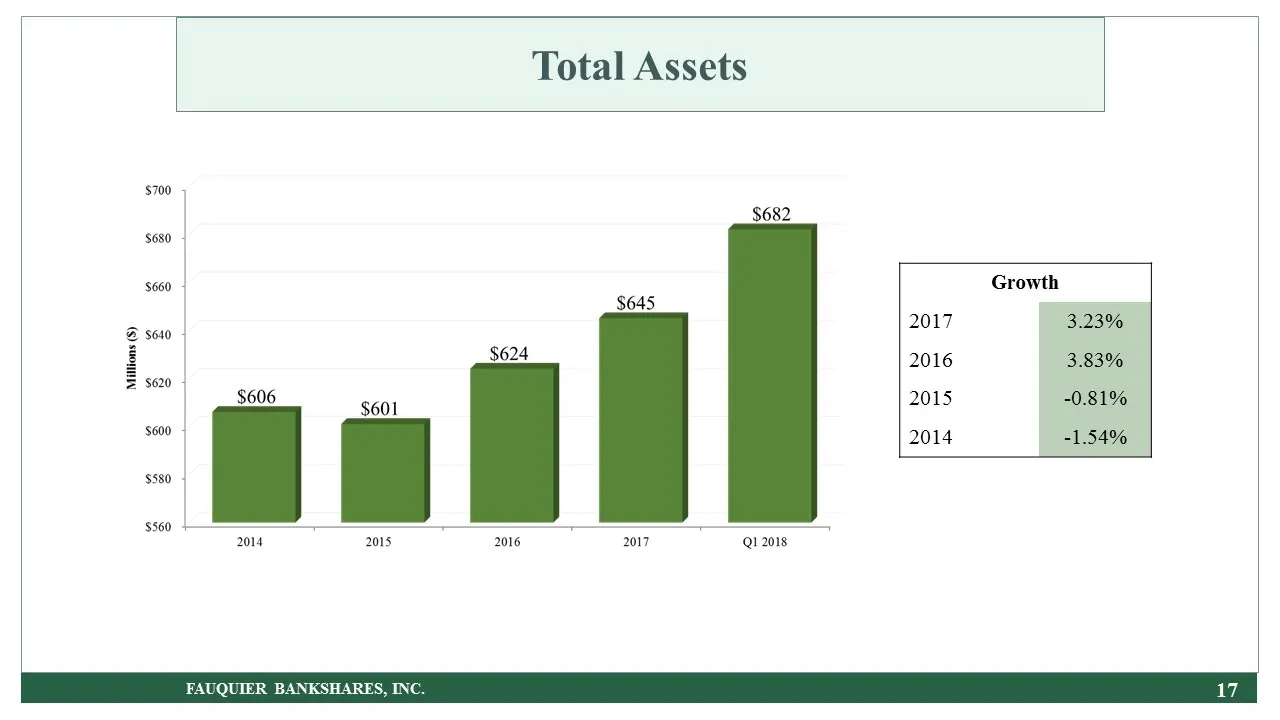
Slide 17: Total Assets Growth
Total Assets FAUQUIER BANKSHARES, INC. Growth 2017 3.23% 2016 3.83% 2015 -0.81% 2014 -1.54%
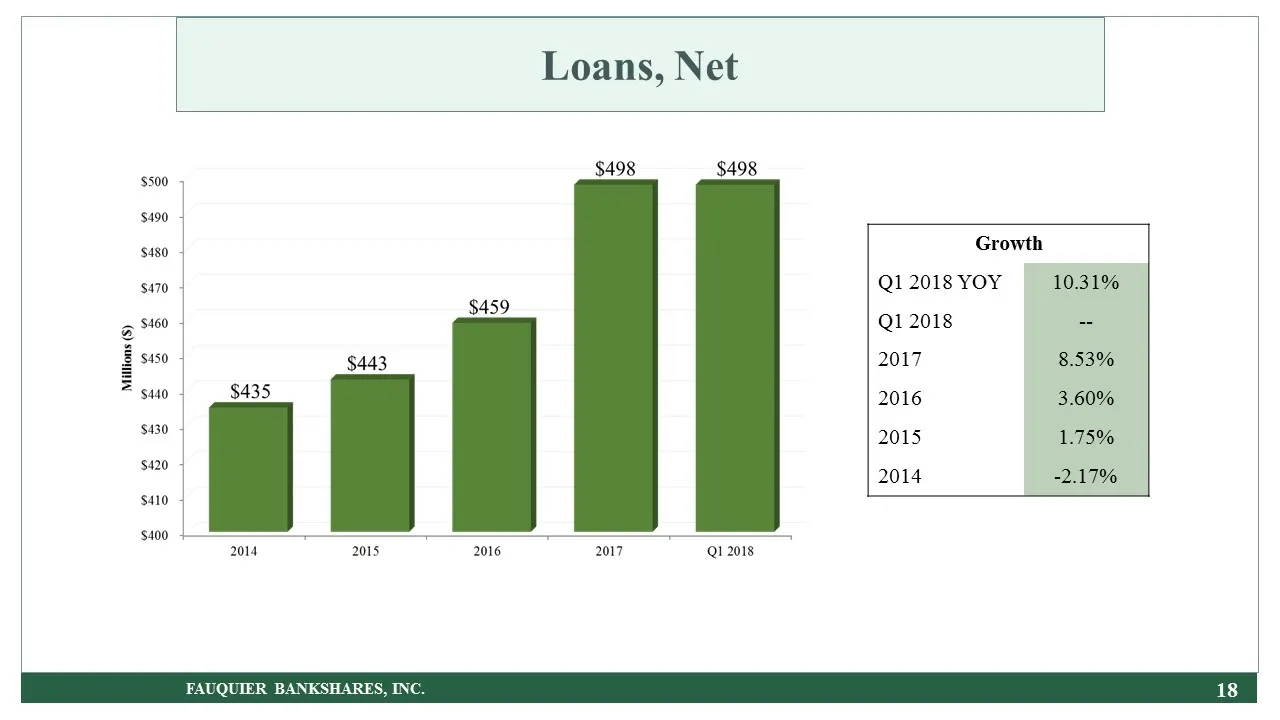
Slide 18: Loans, Net Growth
Loans, Net FAUQUIER BANKSHARES, INC. Growth Q1 2018 YOY 10.31% Q1 2018 -- 2017 8.53% 2016 3.60% 2015 1.75% 2014 -2.17%
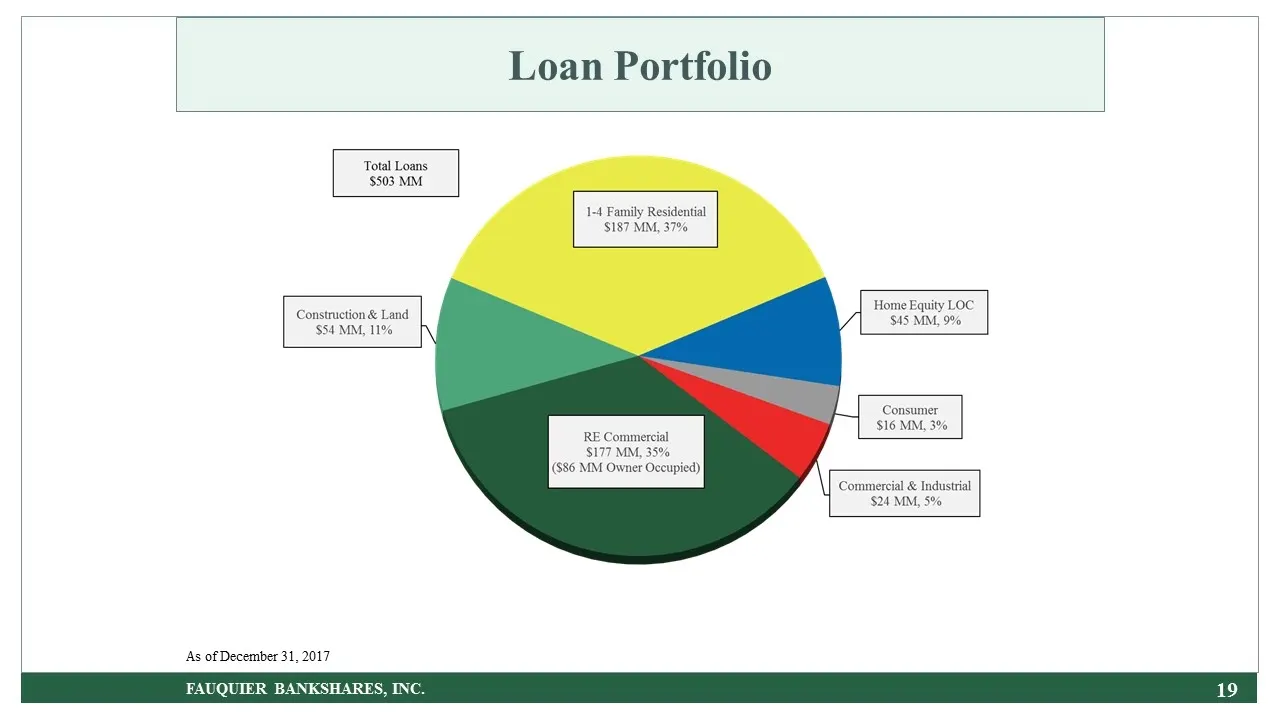
Slide 19: Loan Portfolio
Loan Portfolio FAUQUIER BANKSHARES, INC. As of December 31, 2017
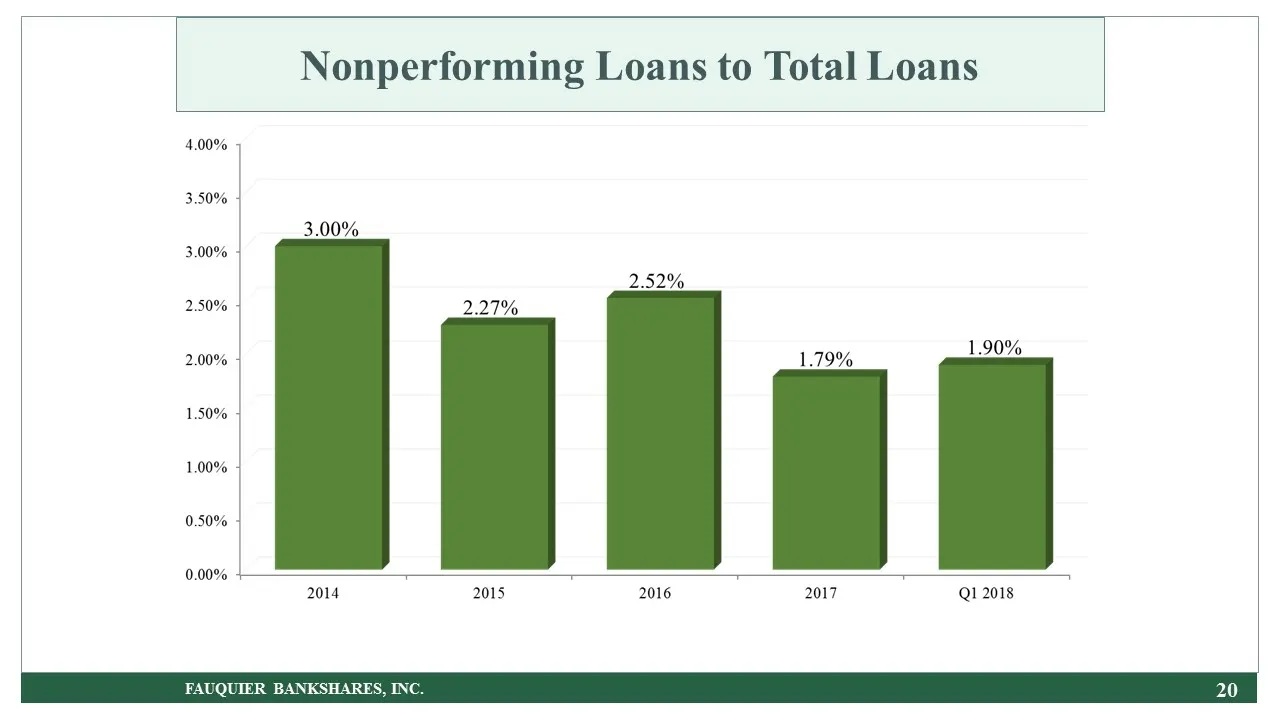
Slide 20: Nonperforming Loans to Total Loans
Nonperforming Loans to Total Loans 20 FAUQUIER BANKSHARES, INC.
Slide 21: Total Deposits Growth
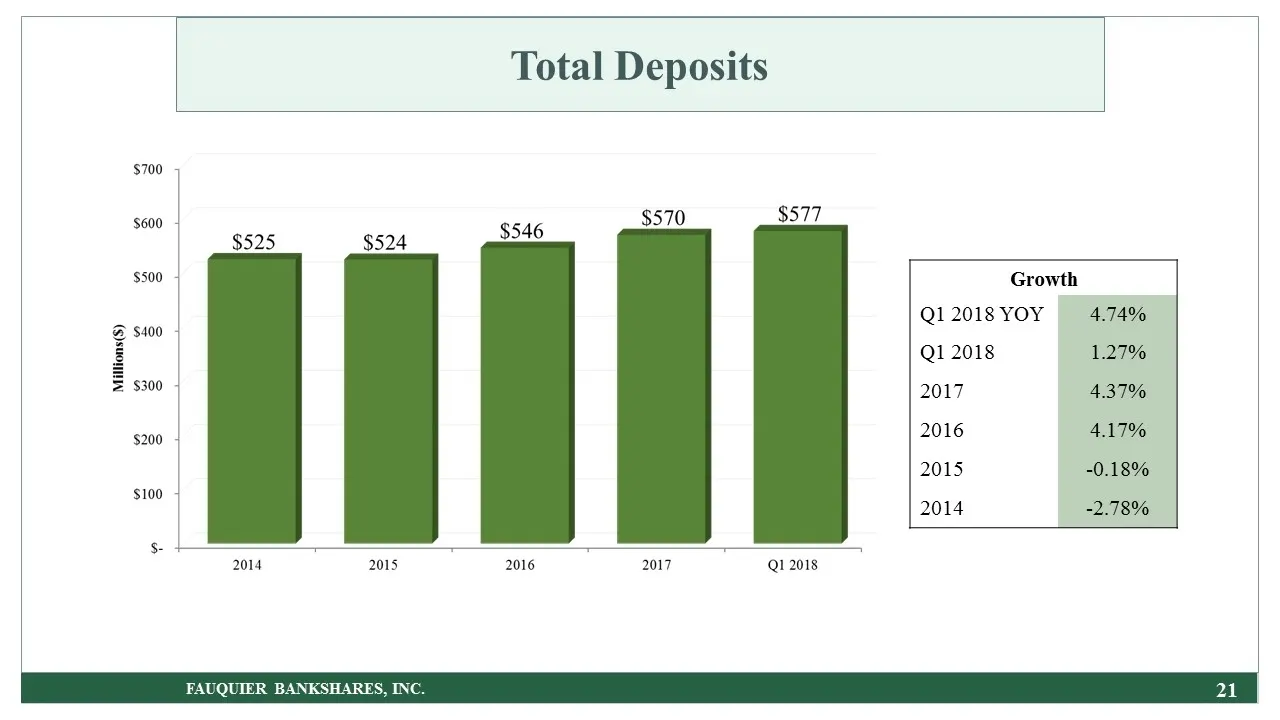
Total Deposits FAUQUIER BANKSHARES, INC. Growth Q1 2018 YOY 4.74% Q1 2018 1.27% 2017 4.37% 2016 4.17% 2015 -0.18% 2014 -2.78%
Slide 22: Deposit Portfolio
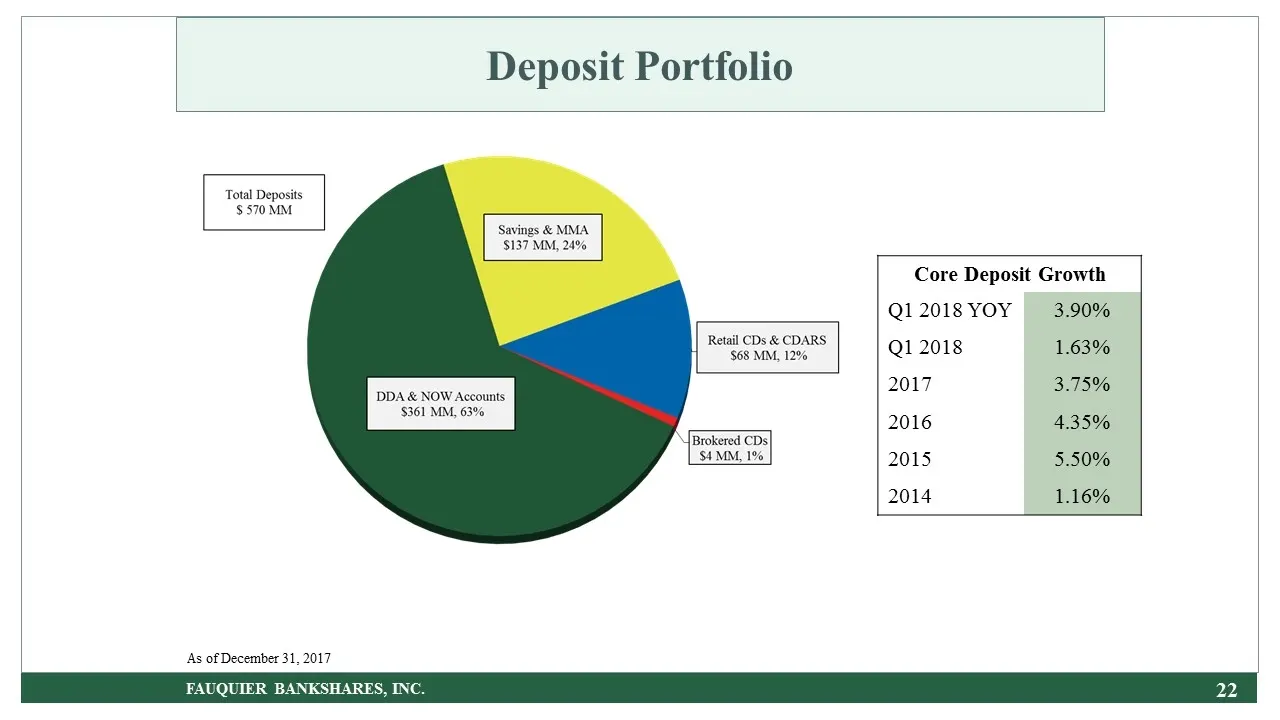
As of December 31, 2017 Deposit Portfolio FAUQUIER BANKSHARES, INC. Core Deposit Growth Q1 2018 YOY 3.90% Q1 2018 1.63% 2017 3.75% 2016 4.35% 2015 5.50% 2014 1.16%
Slide 23: Net Interest Margin
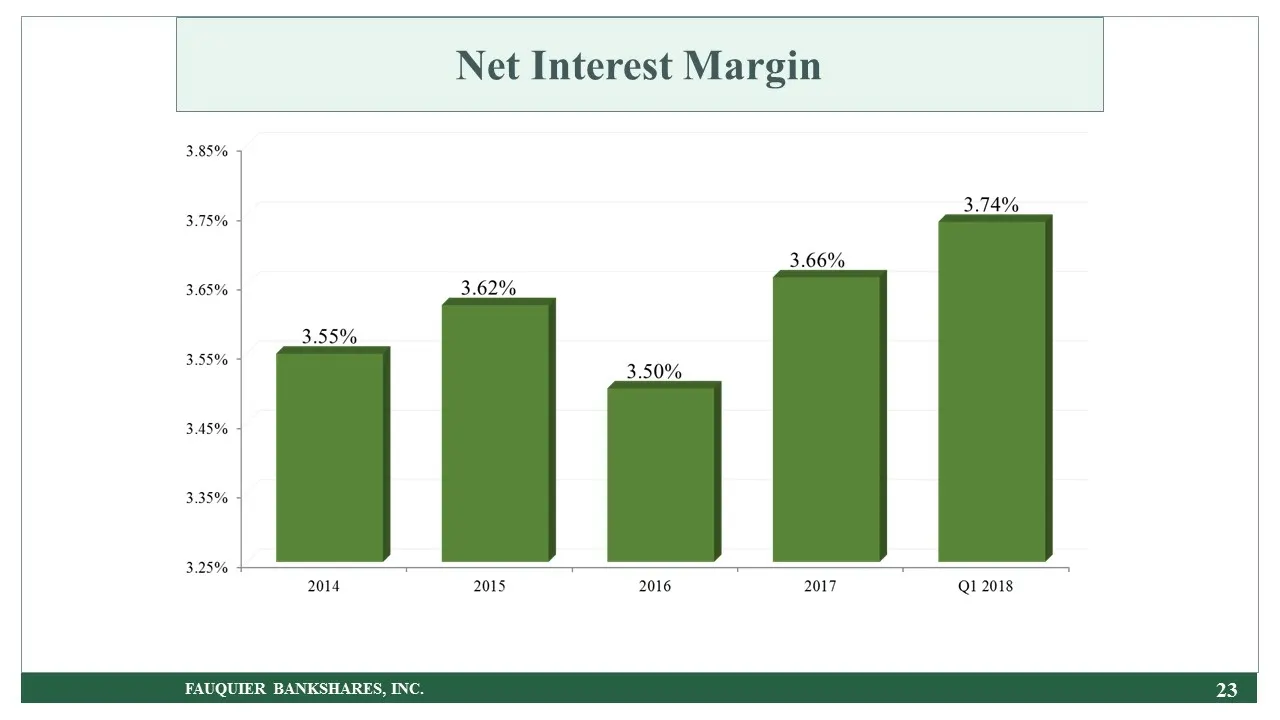
Net Interest Margin 23 FAUQUIER BANKSHARES, INC.
Slide 24: Net Interest Income
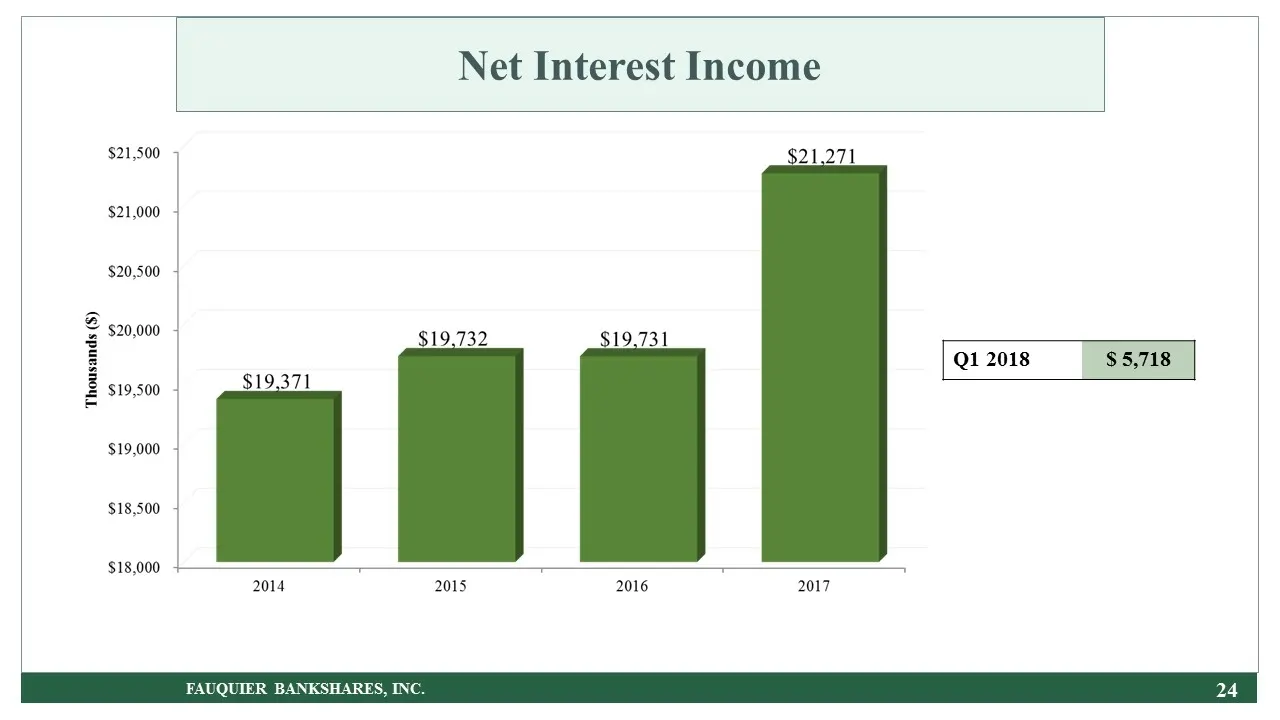
FAUQUIER BANKSHARES, INC. Net Interest Income Q1 2018 $ 5,718
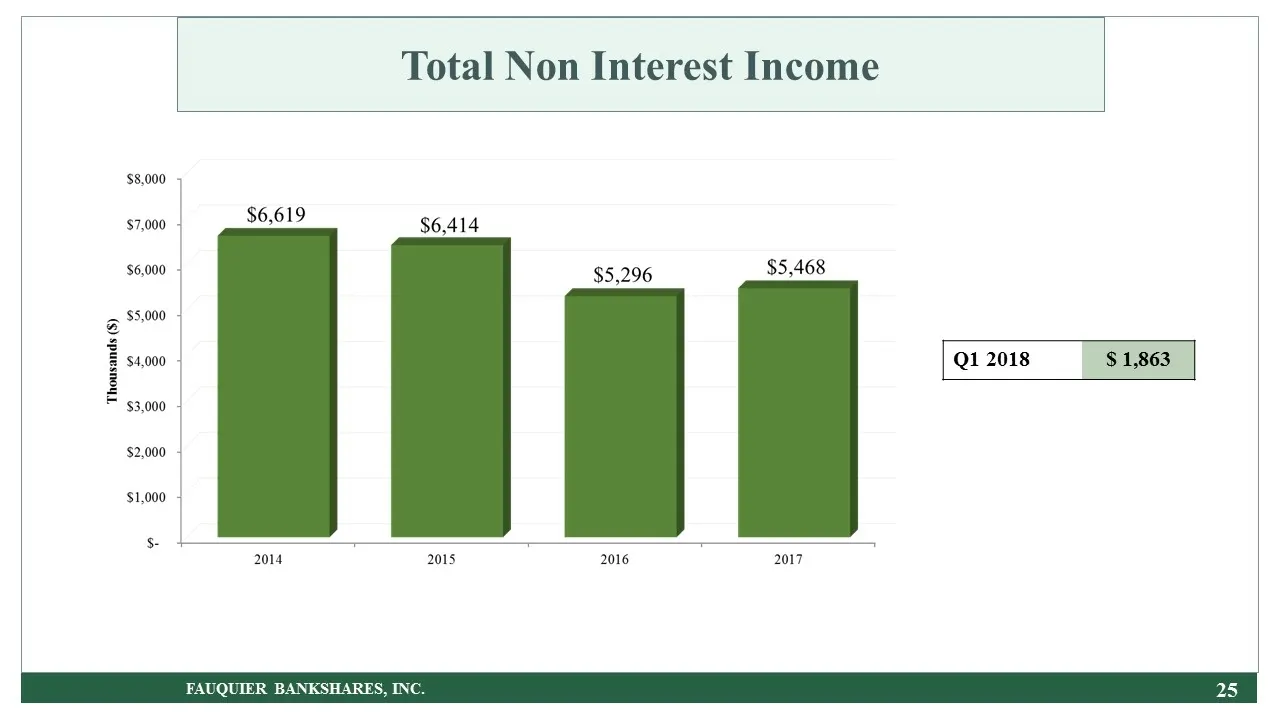
Slide 25: Total Non Interest Income
Total Non Interest Income 25 FAUQUIER BANKSHARES, INC. Q1 2018 $ 1,863
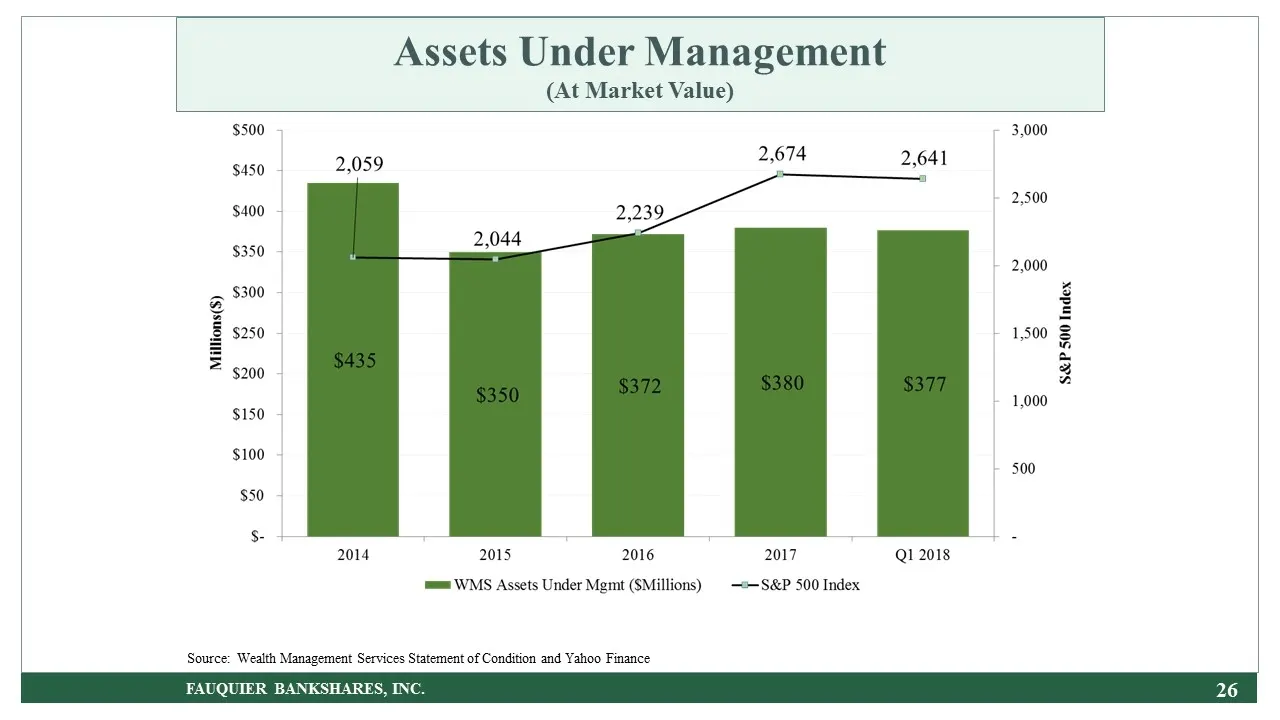
Slide 26: Assets Under Management (At Market Value)
Assets Under Management (At Market Value) 26 FAUQUIER BANKSHARES, INC. Source: Wealth Management Services Statement of Condition and Yahoo Finance
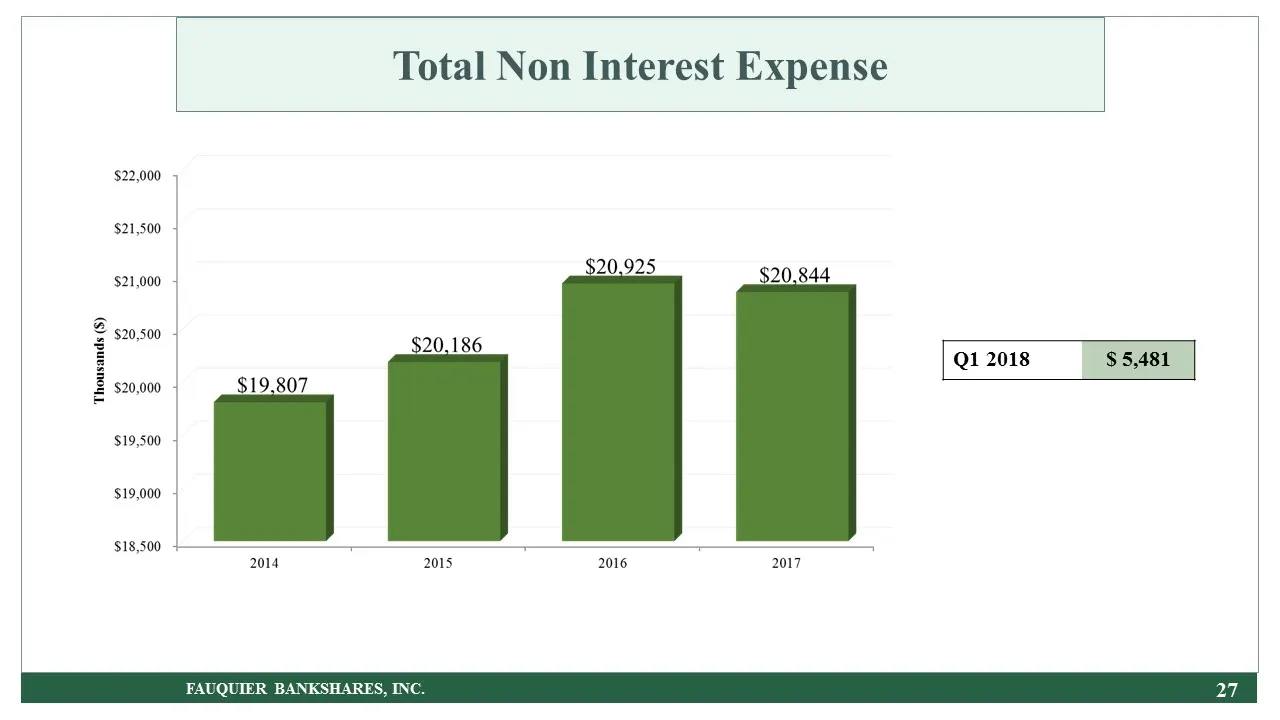
Slide 27: Total Non Interest Expense
Total Non Interest Expense 27 FAUQUIER BANKSHARES, INC. Q1 2018 $ 5,481
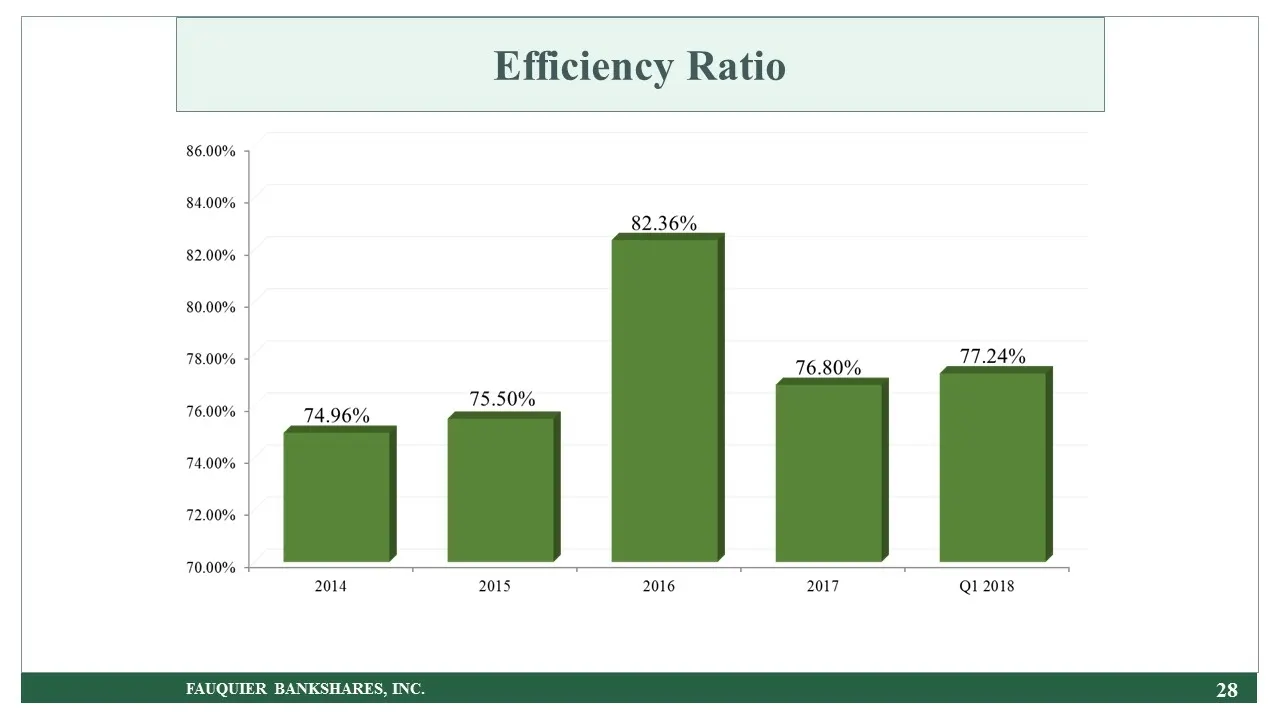
Slide 28: Efficiency Ratio
Efficiency Ratio FAUQUIER BANKSHARES, INC.
Slide 29: Capital Ratios
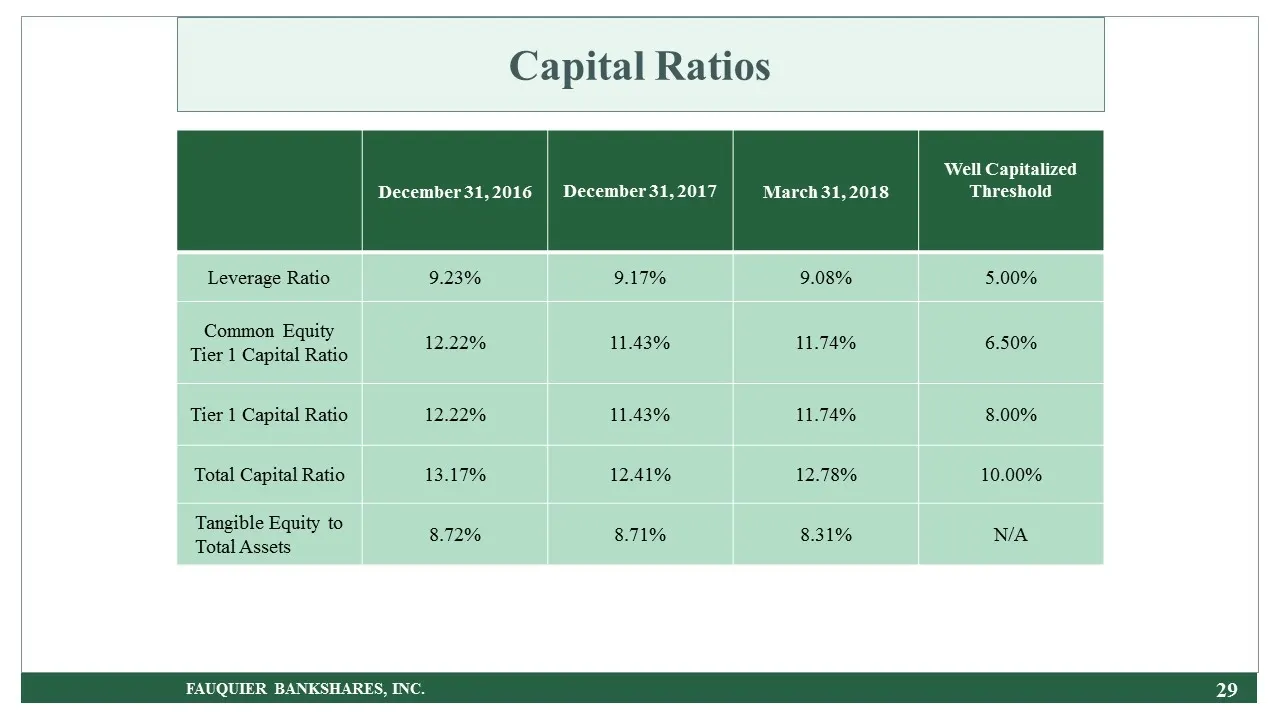
Capital Ratios FAUQUIER BANKSHARES, INC. December 31, 2016 December 31, 2017 March 31, 2018 Well Capitalized Threshold Leverage Ratio 9.23% 9.17% 9.08% 5.00% Common Equity Tier 1 Capital Ratio 12.22% 11.43% 11.74% 6.50% Tier 1 Capital Ratio 12.22% 11.43% 11.74% 8.00% Total Capital Ratio 13.17% 12.41
Slide 30: FAUQUIER BANKSHARES, INC. 30
FAUQUIER BANKSHARES, INC. 30
Slide 31: Outlook Strategic Focus
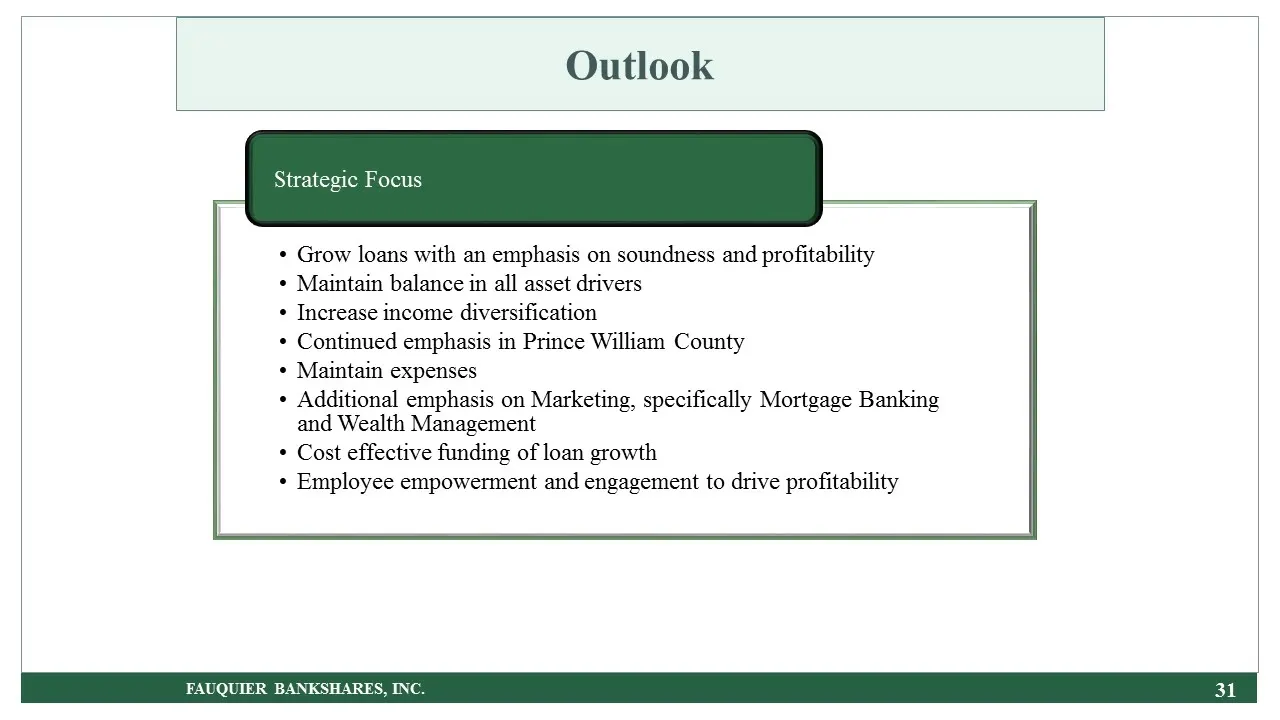
Outlook FAUQUIER BANKSHARES, INC. Strategic Focus Grow loans with an emphasis on soundness and profitability Maintain balance in all asset drivers Increase income diversification Continued emphasis in Prince William County Maintain expenses Additional emphasis on Marketing, specifically Mortgage Ban
Slide 32: Peer Group Details
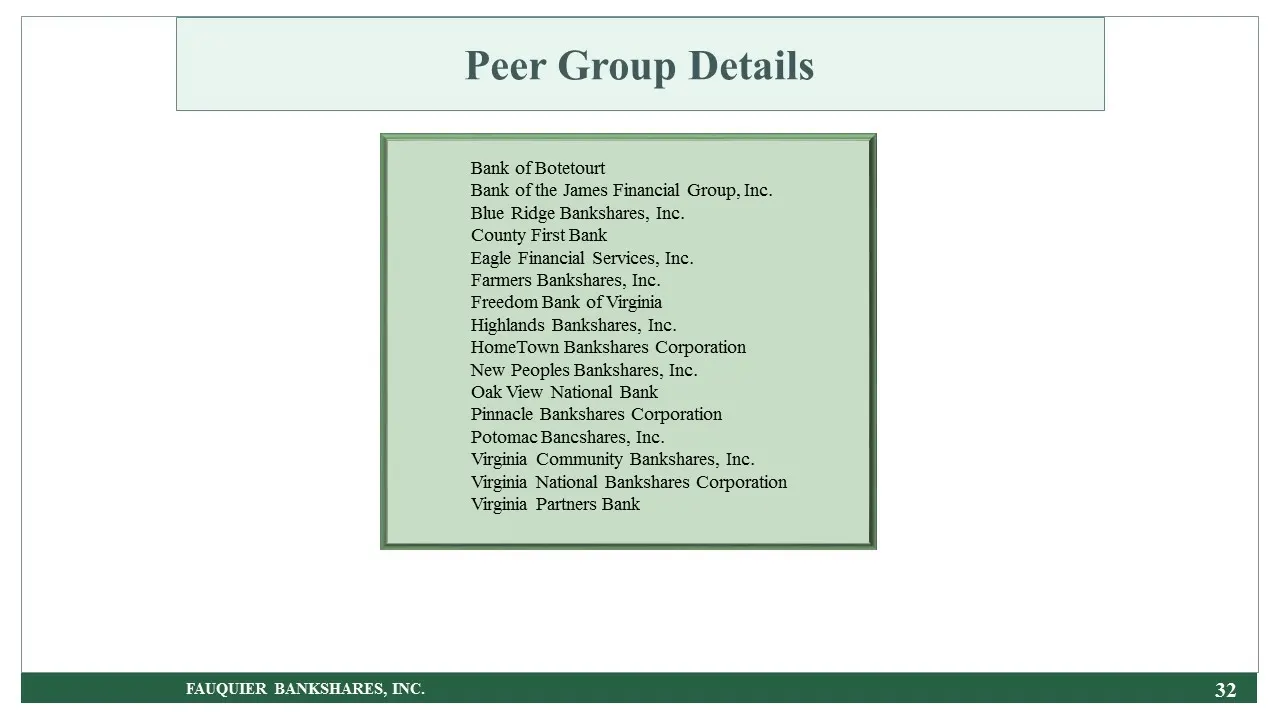
Peer Group Details FAUQUIER BANKSHARES, INC. Bank of Botetourt Bank of the James Financial Group, Inc. Blue Ridge Bankshares, Inc. County First Bank Eagle Financial Services, Inc. Farmers Bankshares, Inc. Freedom Bank of Virginia Highlands Bankshares, Inc. HomeTown Bankshares Corporation New Peoples
Slide 33: Investor Relations Contacts
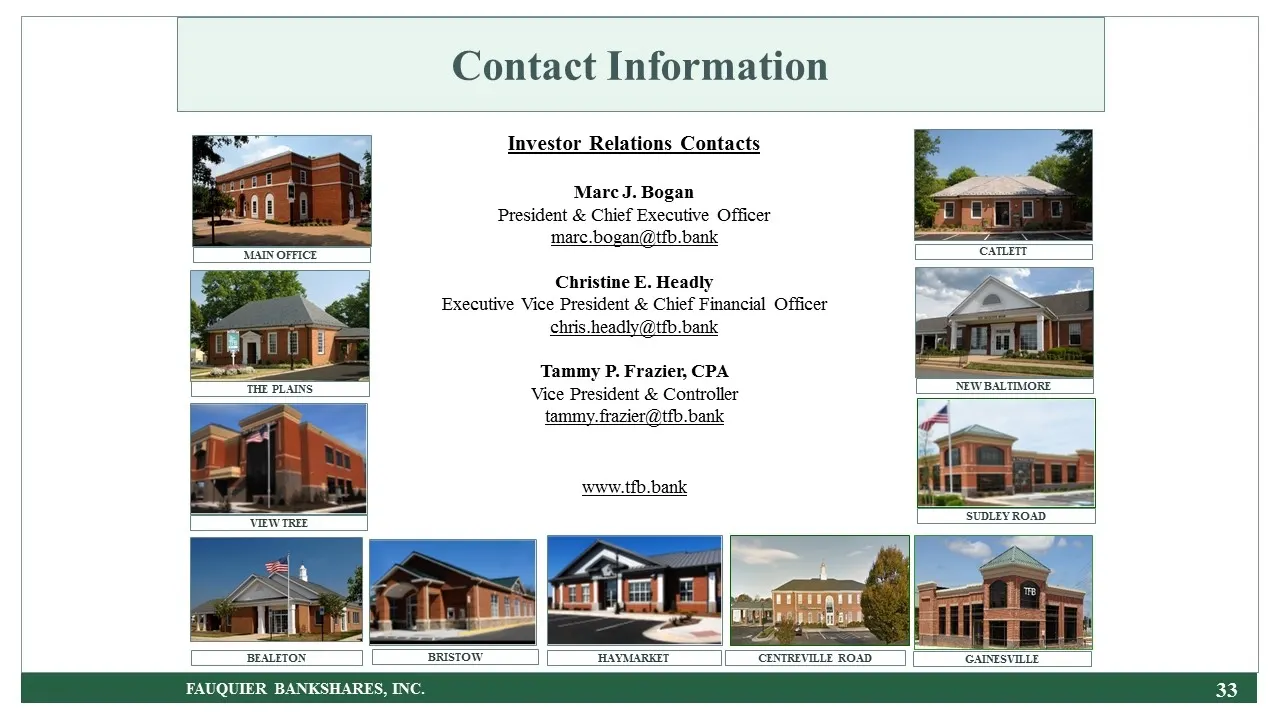
Investor Relations Contacts Marc J. Bogan President & Chief Executive Officer [email protected] Christine E. Headly Executive Vice President & Chief Financial Officer [email protected] Tammy P. Frazier, CPA Vice President & Controller [email protected] www.tfb.bank MAIN OFFICE THE PLAINS
Source: SEC EDGAR · 8-K filed May 15, 2018
More decks from Fauquier Bankshares Inc
 Merger or Acquisition (October 2020)20 slides · Oct 1, 2020
 Shareholder Meeting (May 2020)30 slides · May 19, 2020
 Investor Presentation (August 2019)20 slides · Aug 7, 2019
 Shareholder Meeting (May 2019)31 slides · May 21, 2019
 Investor Presentation (October 2018)18 slides · Oct 22, 2018
 Investor Presentation (December 2017)33 slides · Dec 20, 2017