Fauquier Bankshares — Investor Presentation (December 2017)
33 slides from Fauquier Bankshares's investor presentation, Dec 20, 2017
Slide 1: Fauquier Bankshares, Inc. – December 20, 2017
_____________________FAUQUIER BANKSHARES, INC. December 20, 2017NASDAQ: FBSS
Slide 2: The Fauquier Bank's Guiding Principles
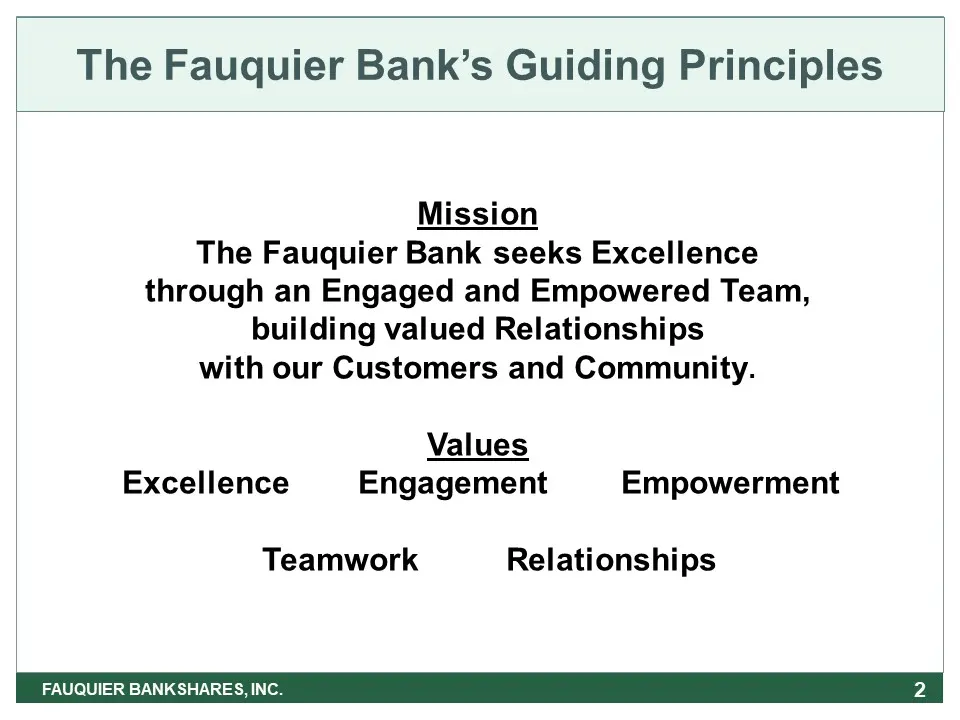
2 The Fauquier Bank’s Guiding Principles FAUQUIER BANKSHARES, INC. MissionThe Fauquier Bank seeks Excellence through an Engaged and Empowered Team, building valued Relationshipswith our Customers and Community.Values Excellence Engagement Empowerment Teamwork Relationships
Slide 3: Summary Statistics
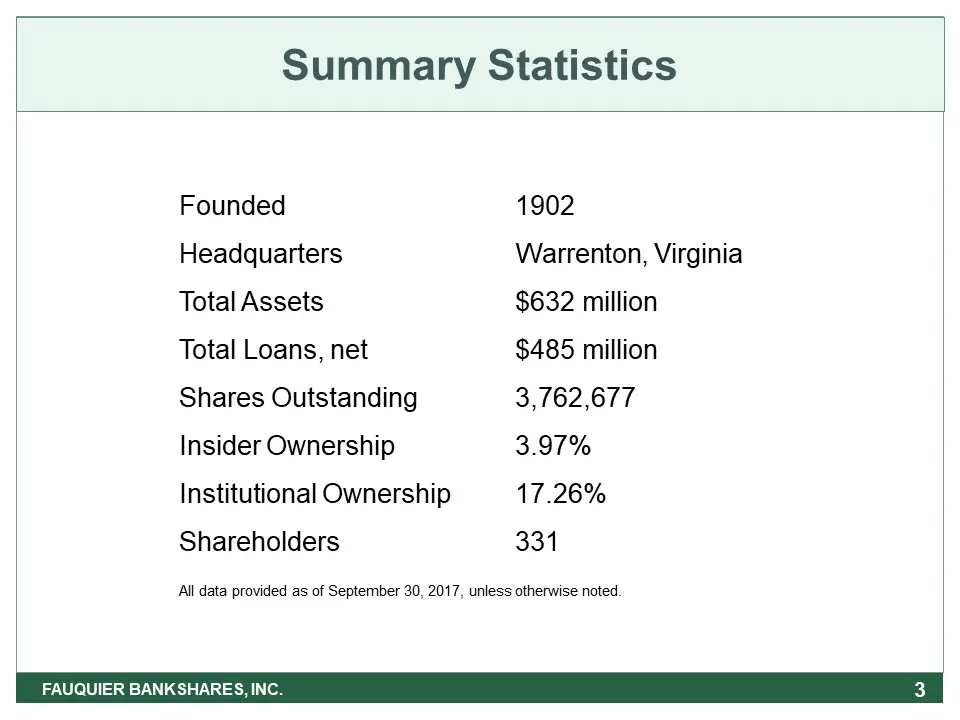
3 Summary Statistics FAUQUIER BANKSHARES, INC. Founded 1902Headquarters Warrenton, VirginiaTotal Assets $632 millionTotal Loans, net $485 millionShares Outstanding 3,762,677Insider Ownership 3.97%Institutional Ownership 17.26% Shareholders 331All data provided as of September 30, 2017, unless otherw
Slide 4: Aligning Values with Results and Strategic Initiatives
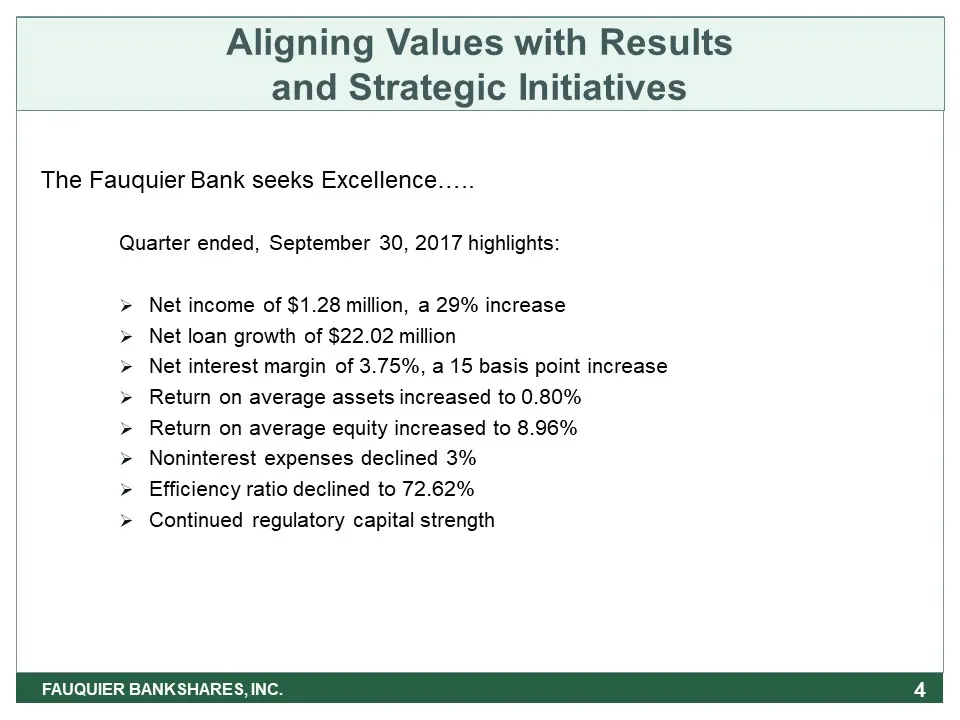
The Fauquier Bank seeks Excellence…..Quarter ended, September 30, 2017 highlights:Net income of $1.28 million, a 29% increaseNet loan growth of $22.02 millionNet interest margin of 3.75%, a 15 basis point increaseReturn on average assets increased to 0.80%Return on average equity increased to 8.96%N
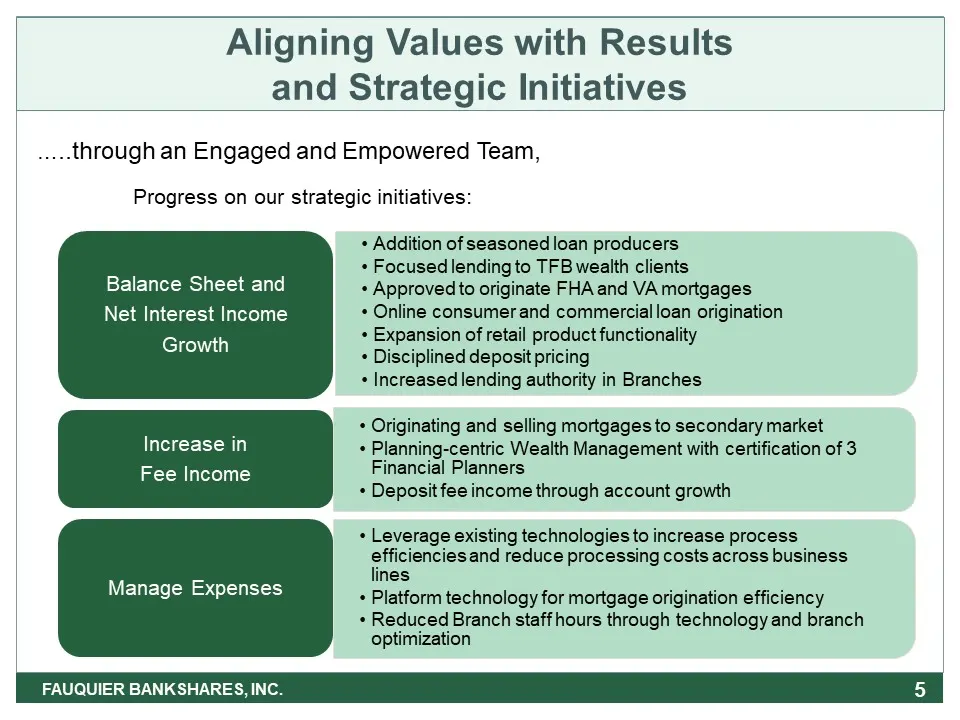
Slide 5: Progress on our strategic initiatives
…..through an Engaged and Empowered Team, Progress on our strategic initiatives: 5 FAUQUIER BANKSHARES, INC. Aligning Values with Results and Strategic Initiatives
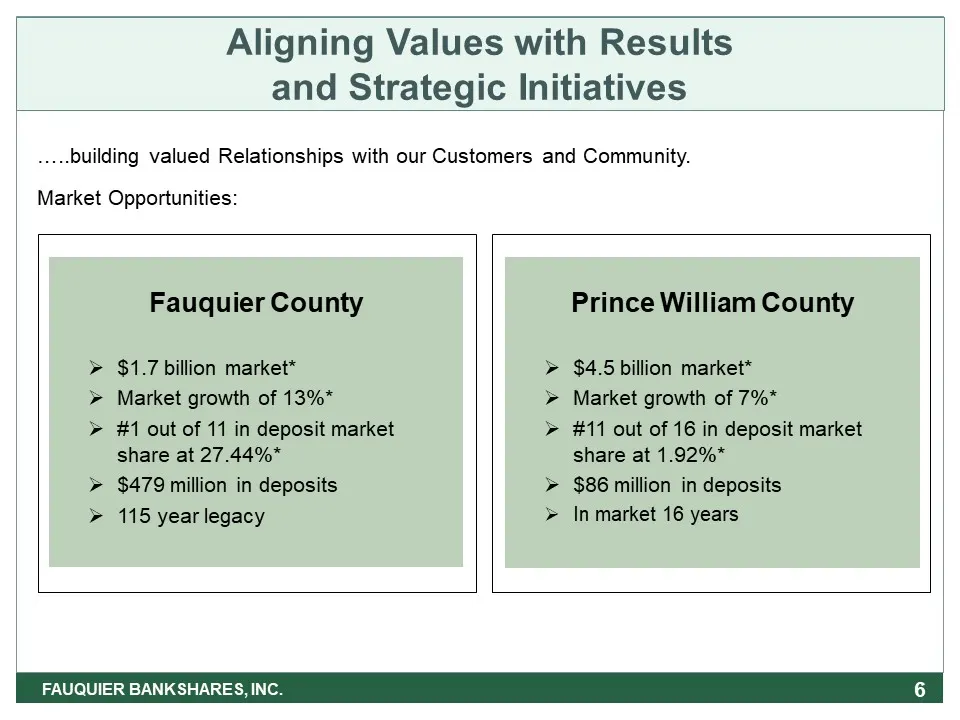
Slide 6: Market Opportunities
…..building valued Relationships with our Customers and Community.Market Opportunities: 6 Fauquier County$1.7 billion market*Market growth of 13%*#1 out of 11 in deposit market share at 27.44%*$479 million in deposits115 year legacy Prince William County$4.5 billion market*Market growth of 7%*#11 ou
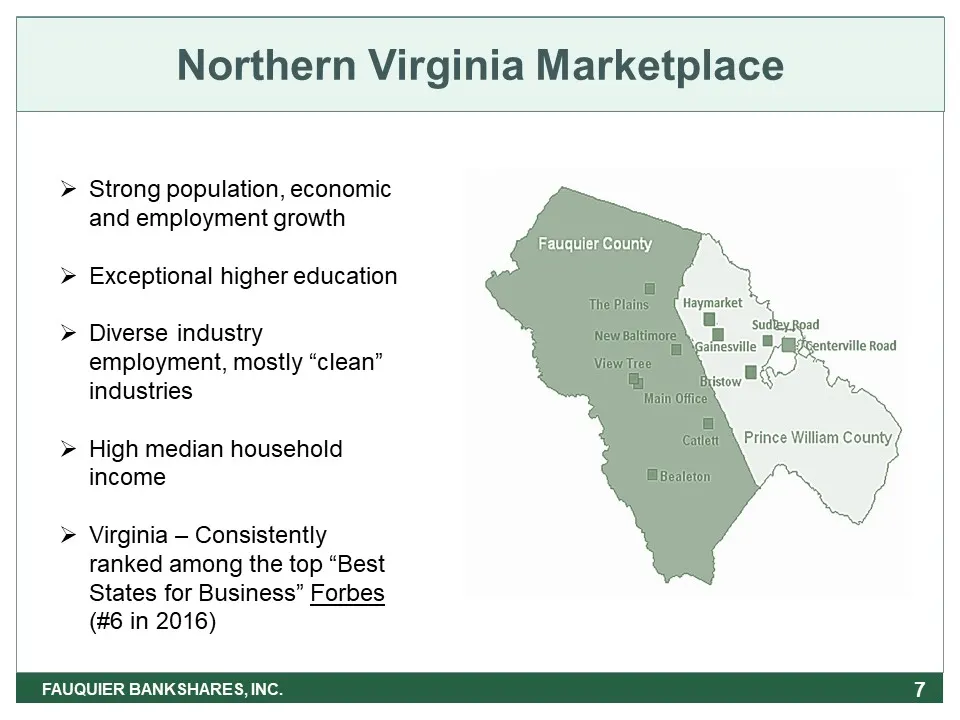
Slide 7: Northern Virginia Marketplace
7 Northern Virginia Marketplace FAUQUIER BANKSHARES, INC. Strong population, economic and employment growthExceptional higher educationDiverse industry employment, mostly “clean” industriesHigh median household incomeVirginia – Consistently ranked among the top “Best States for Business” Forbes (#6
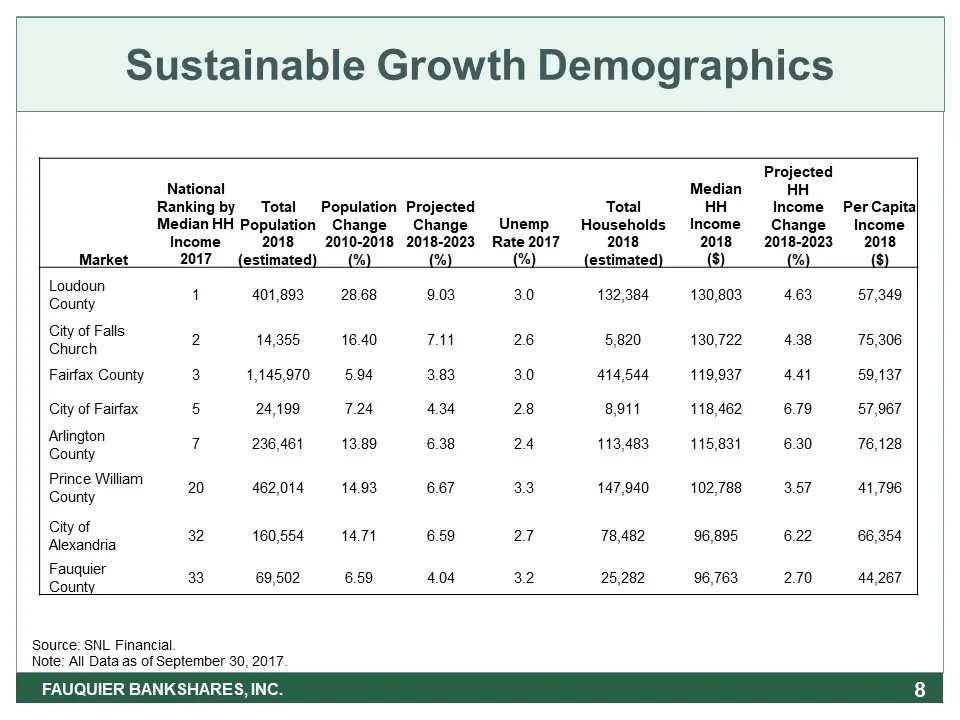
Slide 8: Sustainable Growth Demographics
8 Sustainable Growth Demographics FAUQUIER BANKSHARES, INC. Market National Ranking by Median HH Income 2017 TotalPopulation2018(estimated) PopulationChange2010-2018(%) ProjectedChange2018-2023(%) Unemp Rate 2017(%) TotalHouseholds2018(estimated) MedianHH Income2018($) Projected HHIncome Change2018-
Slide 9: Financial Trends
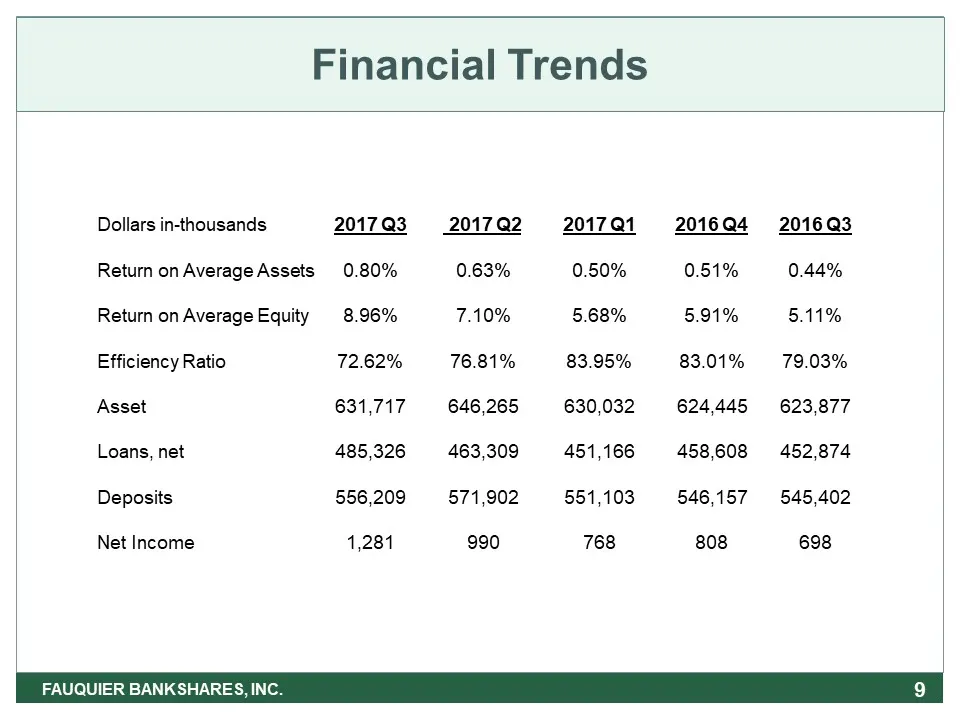
9 Financial Trends FAUQUIER BANKSHARES, INC. Dollars in-thousands 2017 Q3 2017 Q2 2017 Q1 2016 Q4 2016 Q3 Return on Average Assets 0.80% 0.63% 0.50% 0.51% 0.44% Return on Average Equity 8.96% 7.10% 5.68% 5.91% 5.11% Efficiency Ratio 72.62% 76.81% 83.95% 83.01% 79.03% Asset 631,717 646,265 630,032 62
Slide 10: Return on Average Assets (ROA)
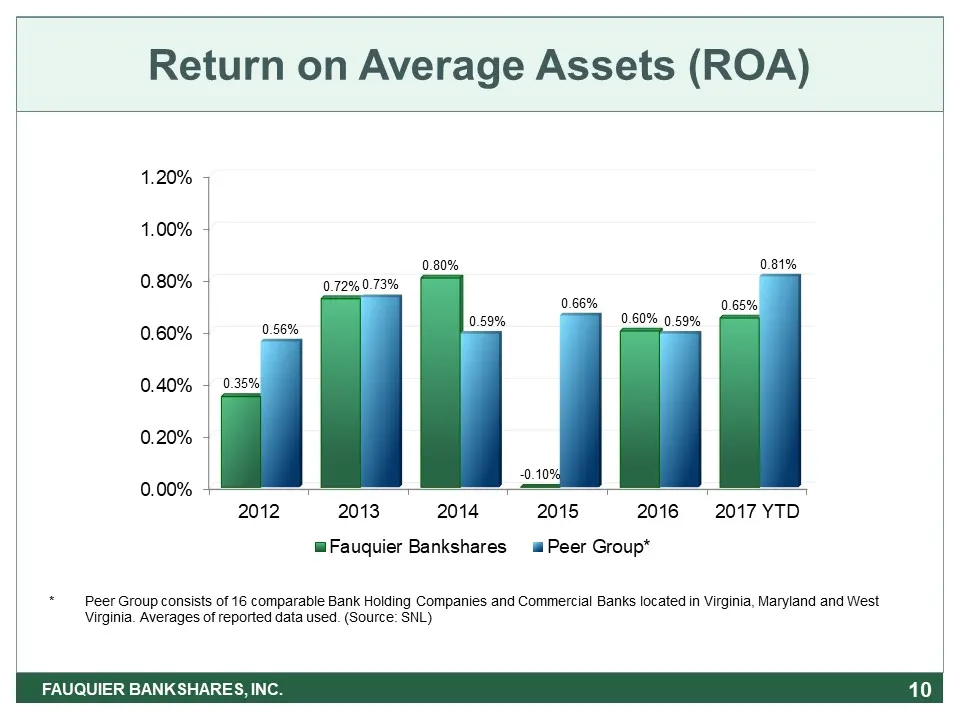
Return on Average Assets (ROA) 10 FAUQUIER BANKSHARES, INC. * Peer Group consists of 16 comparable Bank Holding Companies and Commercial Banks located in Virginia, Maryland and West Virginia. Averages of reported data used. (Source: SNL)
Slide 11: Return on Average Equity (ROE)
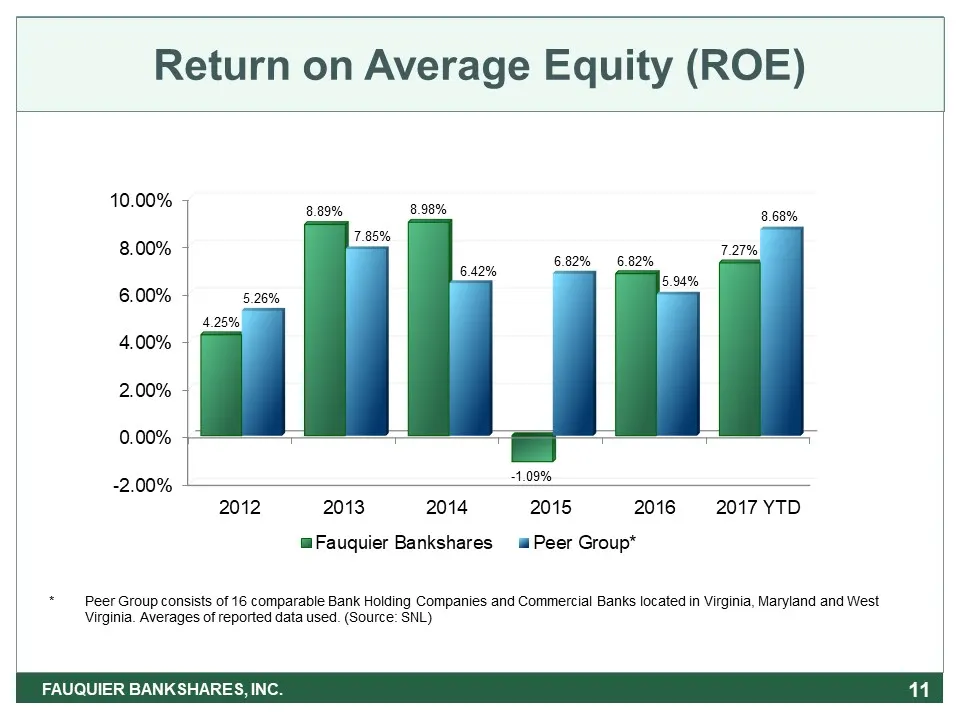
Return on Average Equity (ROE) 11 FAUQUIER BANKSHARES, INC. FAUQUIER BANKSHARES, INC. * Peer Group consists of 16 comparable Bank Holding Companies and Commercial Banks located in Virginia, Maryland and West Virginia. Averages of reported data used. (Source: SNL)
Slide 12: Total Assets
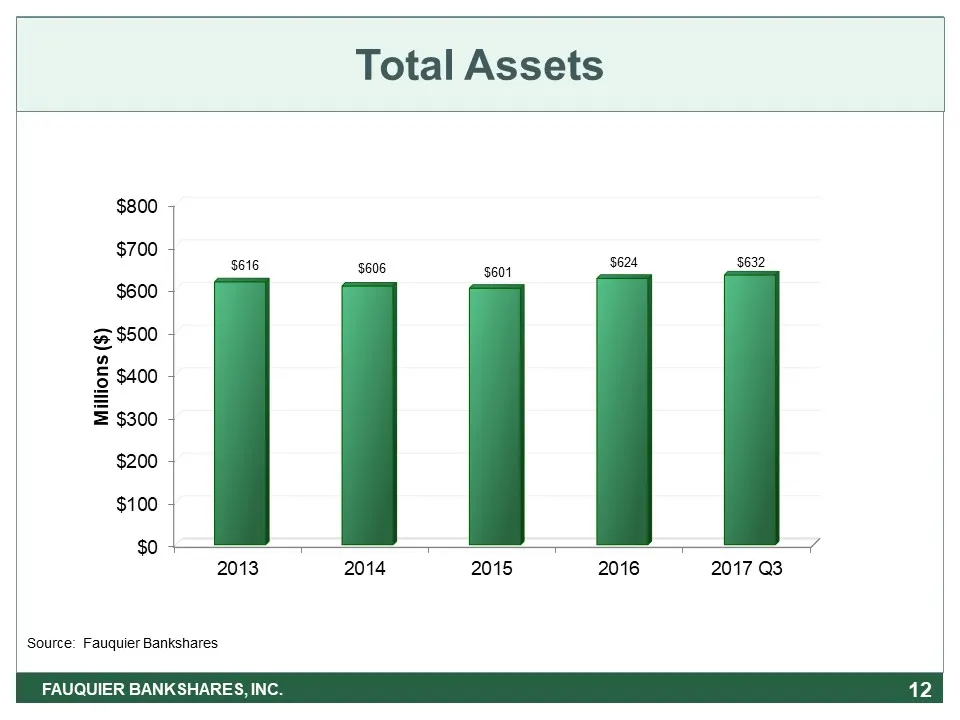
12 Source: Fauquier Bankshares Total Assets FAUQUIER BANKSHARES, INC.
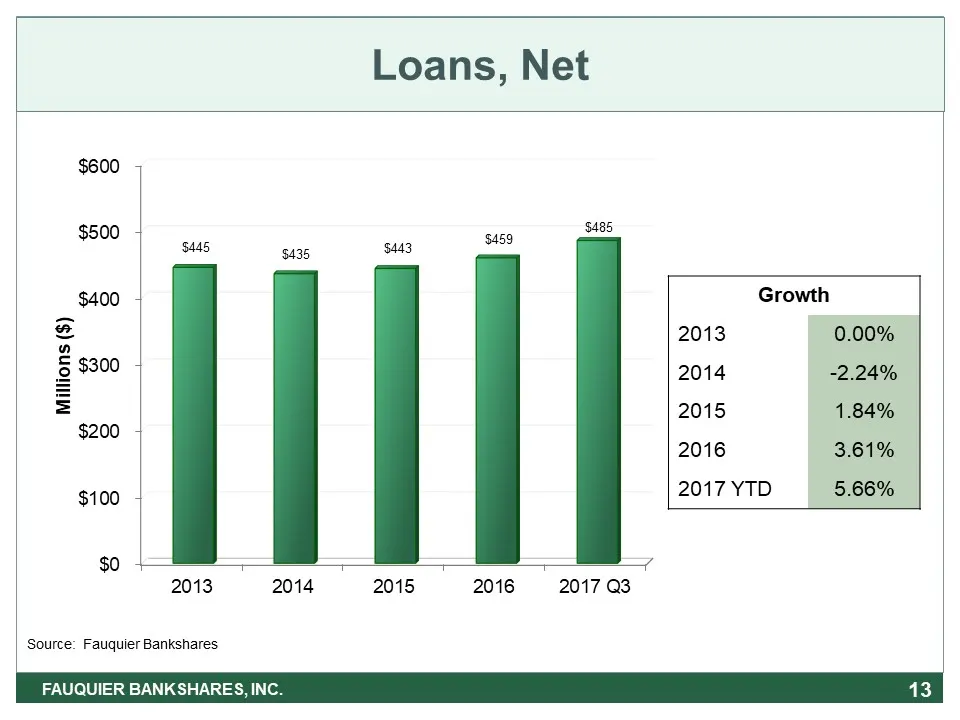
Slide 13: Loans, Net Growth
13 Source: Fauquier Bankshares Loans, Net FAUQUIER BANKSHARES, INC. Growth 2013 0.00% 2014 -2.24% 2015 1.84% 2016 3.61% 2017 YTD 5.66%
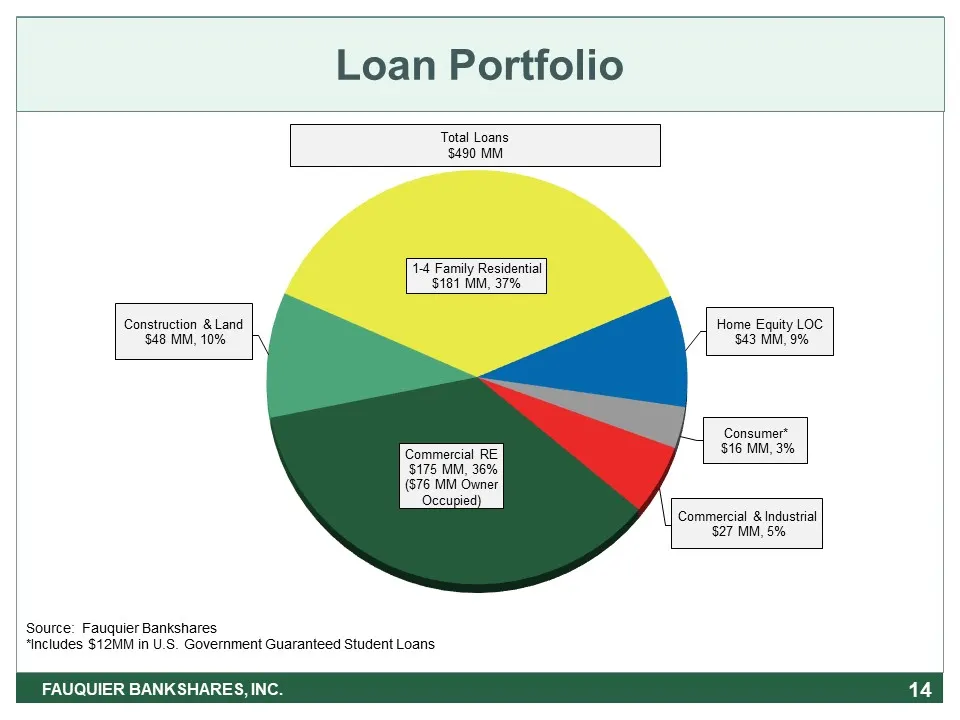
Slide 14: Loan Portfolio
14 Source: Fauquier Bankshares*Includes $12MM in U.S. Government Guaranteed Student Loans Loan Portfolio FAUQUIER BANKSHARES, INC.
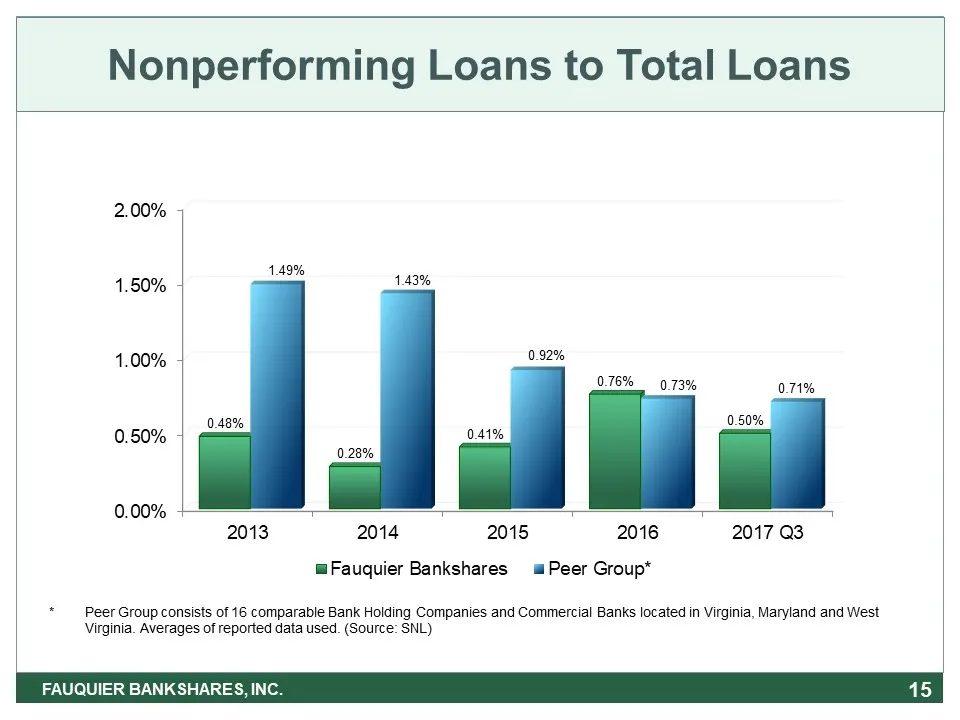
Slide 15: Nonperforming Loans to Total Loans
Nonperforming Loans to Total Loans 15 FAUQUIER BANKSHARES, INC. * Peer Group consists of 16 comparable Bank Holding Companies and Commercial Banks located in Virginia, Maryland and West Virginia. Averages of reported data used. (Source: SNL)
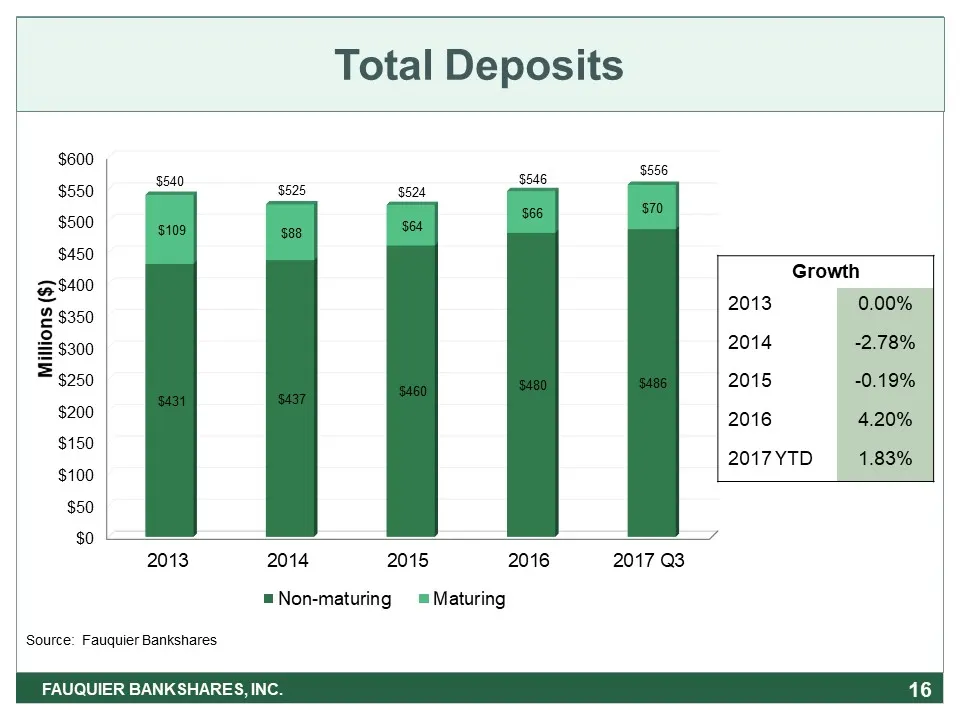
Slide 16: Total Deposits
Source: Fauquier Bankshares 16 Total Deposits FAUQUIER BANKSHARES, INC. $540 $525 $524 $556 $546 Growth 2013 0.00% 2014 -2.78% 2015 -0.19% 2016 4.20% 2017 YTD 1.83%
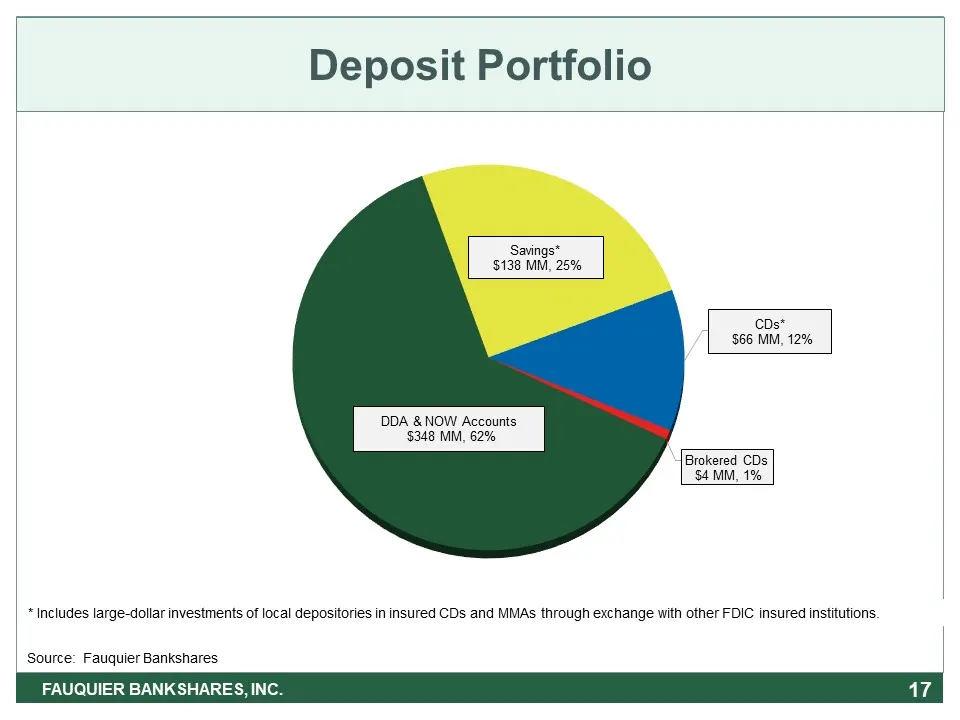
Slide 17: Deposit Portfolio
17 Source: Fauquier Bankshares Deposit Portfolio FAUQUIER BANKSHARES, INC. * Includes large-dollar investments of local depositories in insured CDs and MMAs through exchange with other FDIC insured institutions.
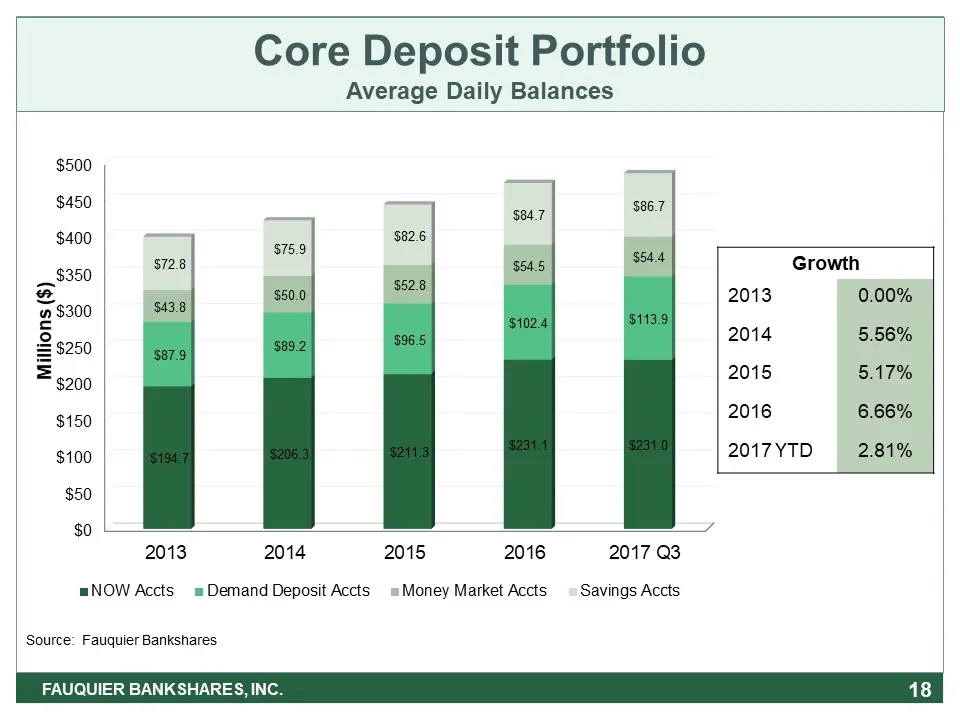
Slide 18: Core Deposit Portfolio
Source: Fauquier Bankshares 18 Core Deposit PortfolioAverage Daily Balances FAUQUIER BANKSHARES, INC. Growth 2013 0.00% 2014 5.56% 2015 5.17% 2016 6.66% 2017 YTD 2.81%
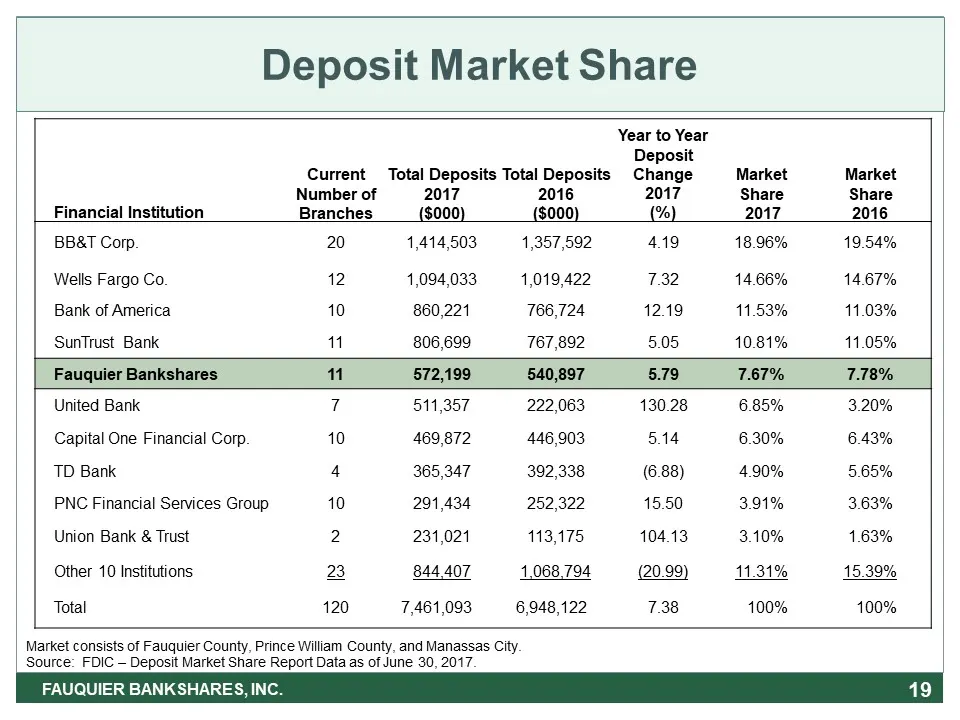
Slide 19: Deposit Market Share
19 Deposit Market Share FAUQUIER BANKSHARES, INC. Financial Institution Current Number ofBranches Total Deposits 2017($000) Total Deposits 2016($000) Year to Year Deposit Change 2017(%) MarketShare 2017 MarketShare2016 BB&T Corp. 20 1,414,503 1,357,592 4.19 18.96% 19.54% Wells Fargo Co. 12 1,094,033
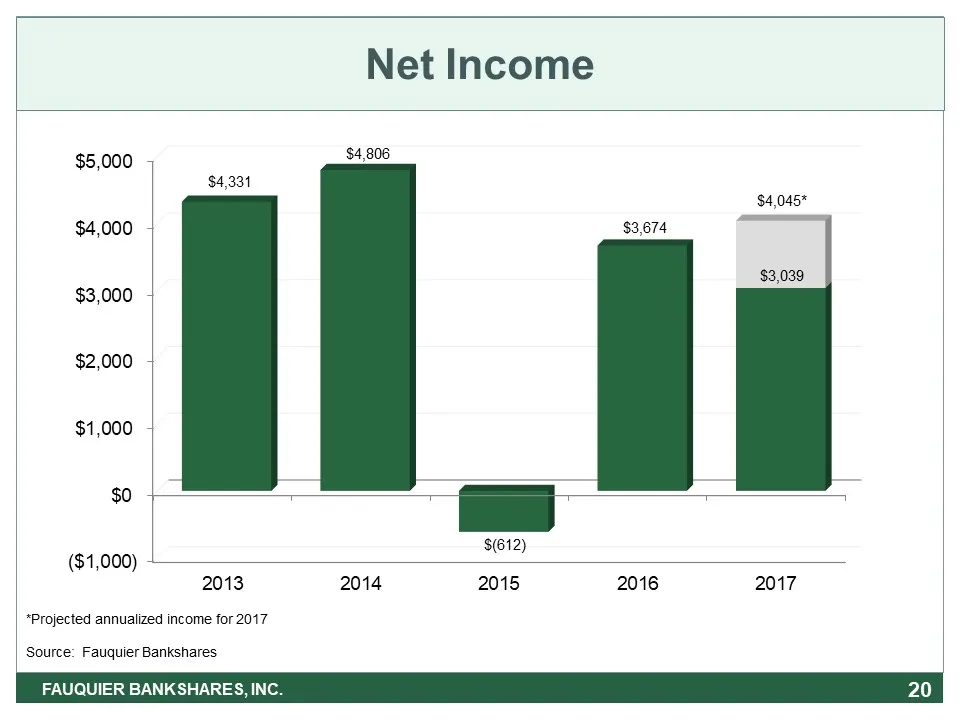
Slide 20: Net Income
20 *Projected annualized income for 2017Source: Fauquier Bankshares FAUQUIER BANKSHARES, INC. Net Income
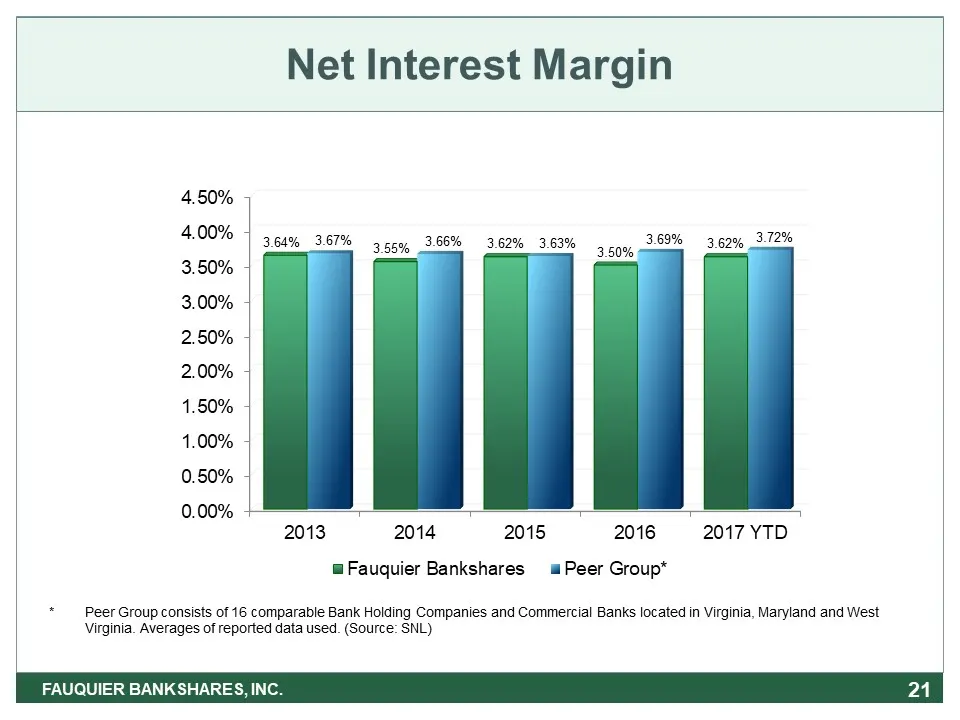
Slide 21: Net Interest Margin
Net Interest Margin 21 FAUQUIER BANKSHARES, INC. * Peer Group consists of 16 comparable Bank Holding Companies and Commercial Banks located in Virginia, Maryland and West Virginia. Averages of reported data used. (Source: SNL)
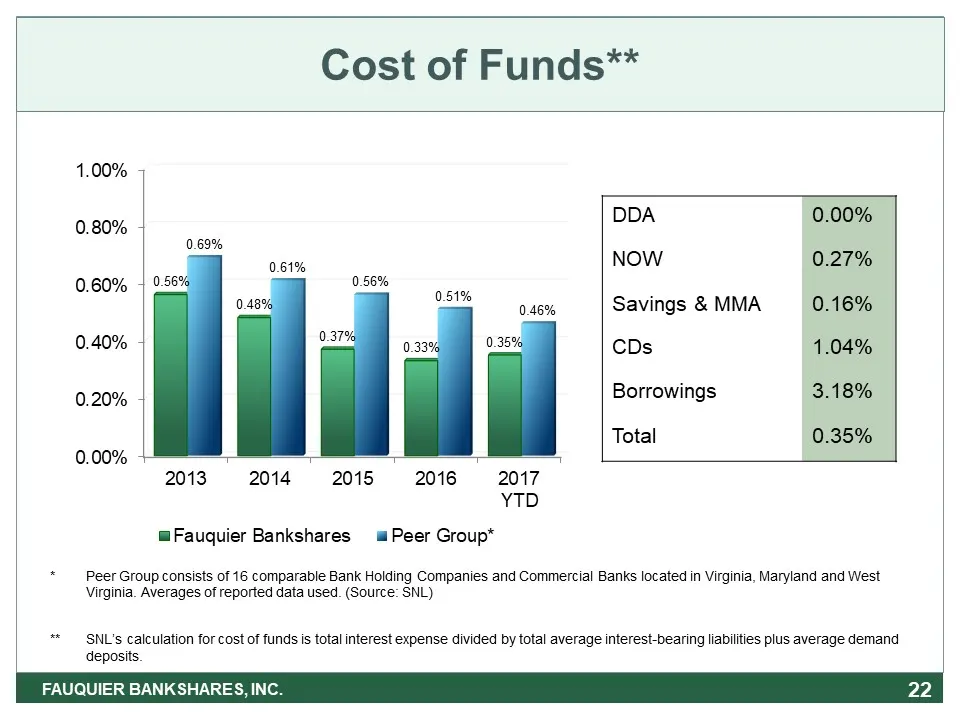
Slide 22: Cost of Funds
Cost of Funds** 22 FAUQUIER BANKSHARES, INC. DDA 0.00% NOW 0.27% Savings & MMA 0.16% CDs 1.04% Borrowings 3.18% Total 0.35% * Peer Group consists of 16 comparable Bank Holding Companies and Commercial Banks located in Virginia, Maryland and West Virginia. Averages of reported data used. (Source: SNL
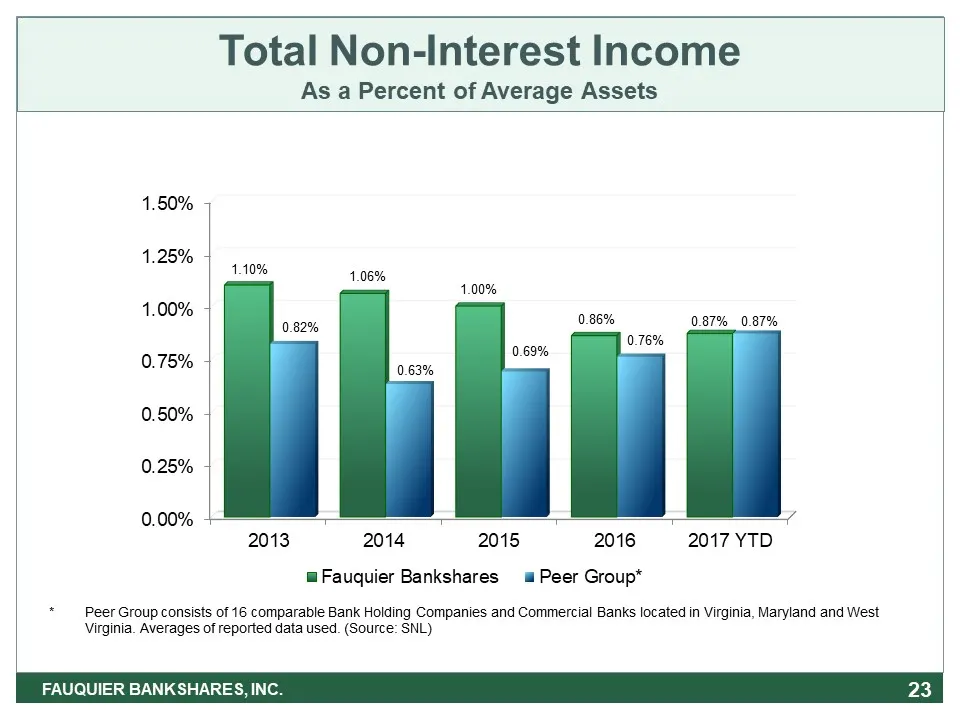
Slide 23: Total Non-Interest Income as a Percent of Average Assets
Total Non-Interest IncomeAs a Percent of Average Assets 23 FAUQUIER BANKSHARES, INC. * Peer Group consists of 16 comparable Bank Holding Companies and Commercial Banks located in Virginia, Maryland and West Virginia. Averages of reported data used. (Source: SNL)
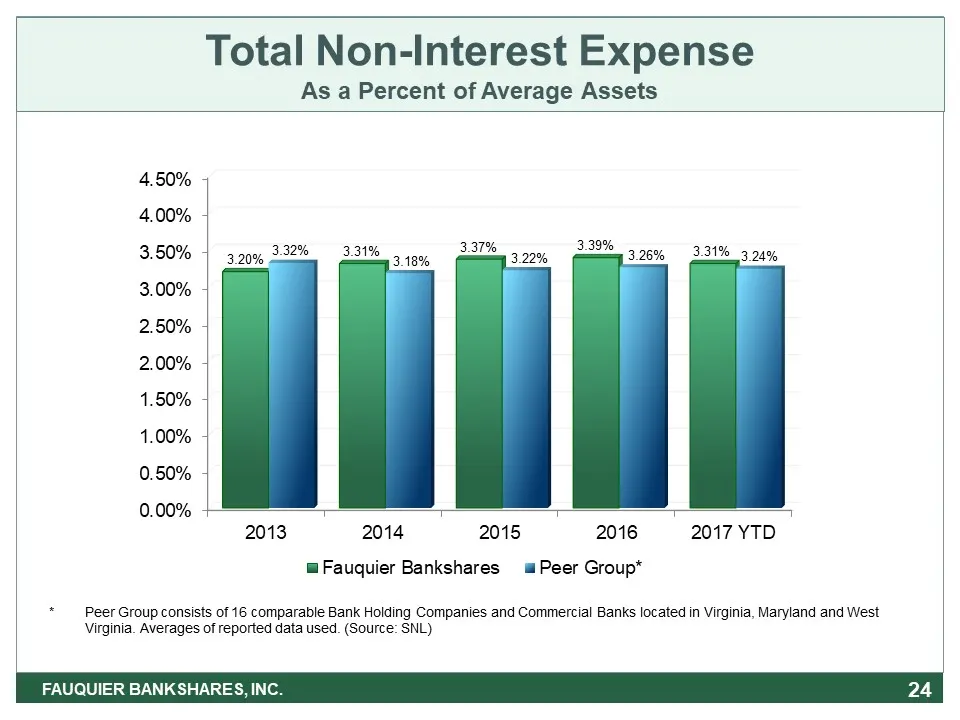
Slide 24: Total Non-Interest Expense as a Percent of Average Assets
Total Non-Interest ExpenseAs a Percent of Average Assets 24 FAUQUIER BANKSHARES, INC. * Peer Group consists of 16 comparable Bank Holding Companies and Commercial Banks located in Virginia, Maryland and West Virginia. Averages of reported data used. (Source: SNL)
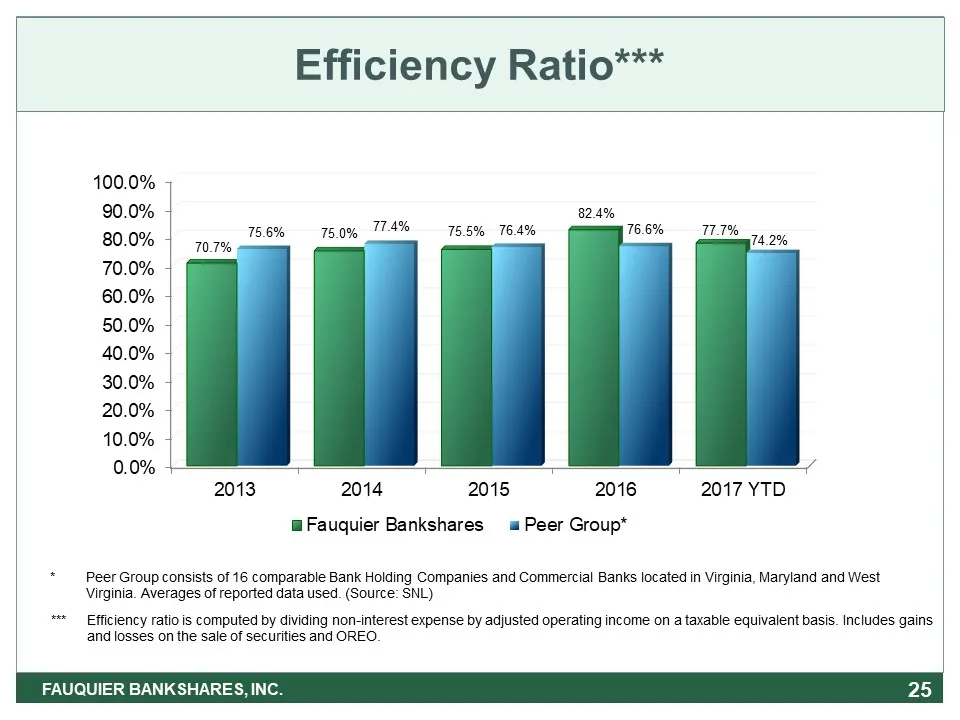
Slide 25: Efficiency Ratio
Efficiency Ratio*** 25 *** Efficiency ratio is computed by dividing non-interest expense by adjusted operating income on a taxable equivalent basis. Includes gains and losses on the sale of securities and OREO. FAUQUIER BANKSHARES, INC. * Peer Group consists of 16 comparable Bank Holding Companies a
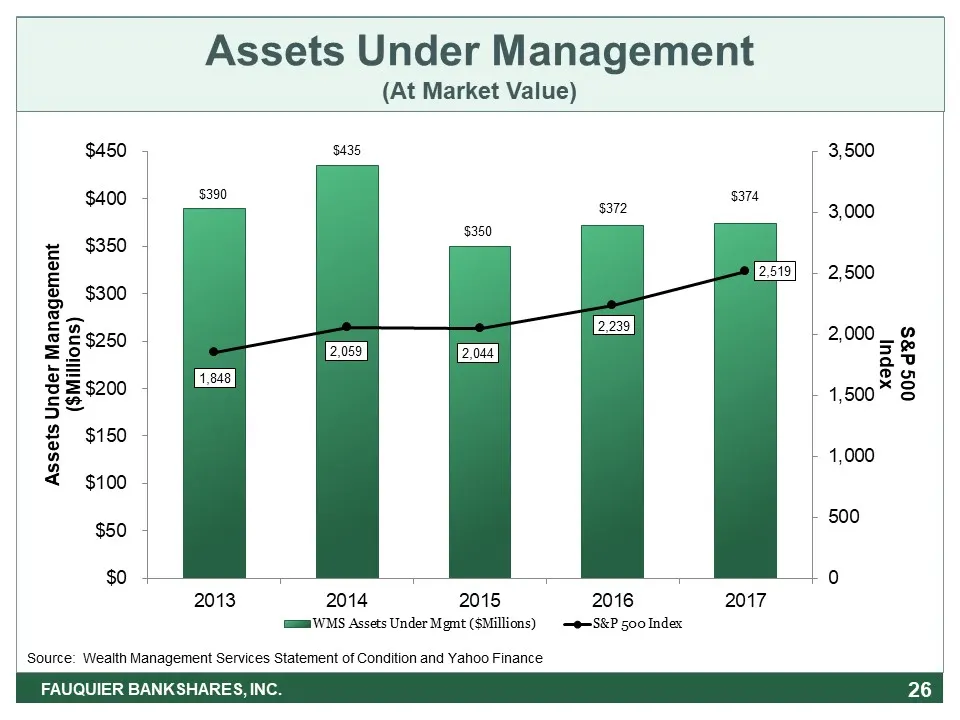
Slide 26: Assets Under Management
Assets Under Management(At Market Value) 26 FAUQUIER BANKSHARES, INC. Source: Wealth Management Services Statement of Condition and Yahoo Finance
Slide 27: Capital Ratios
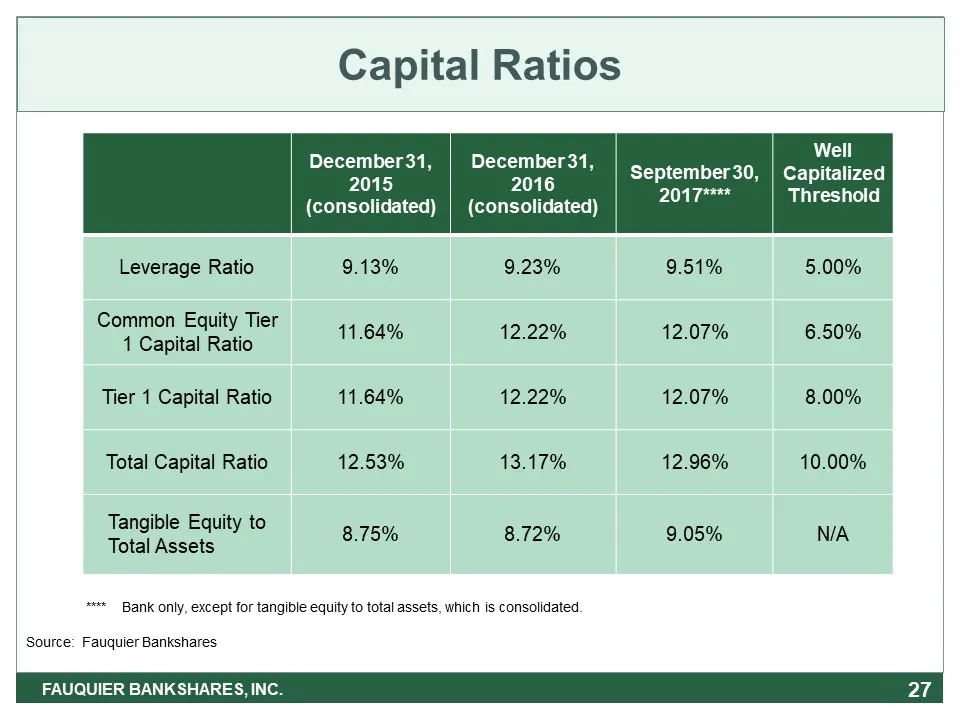
27 Capital Ratios FAUQUIER BANKSHARES, INC. December 31, 2015(consolidated) December 31, 2016(consolidated) September 30, 2017**** Well Capitalized Threshold Leverage Ratio 9.13% 9.23% 9.51% 5.00% Common Equity Tier 1 Capital Ratio 11.64% 12.22% 12.07% 6.50% Tier 1 Capital Ratio 11.64% 12.22% 12.07%
Slide 28: Tangible Book Value Improvement
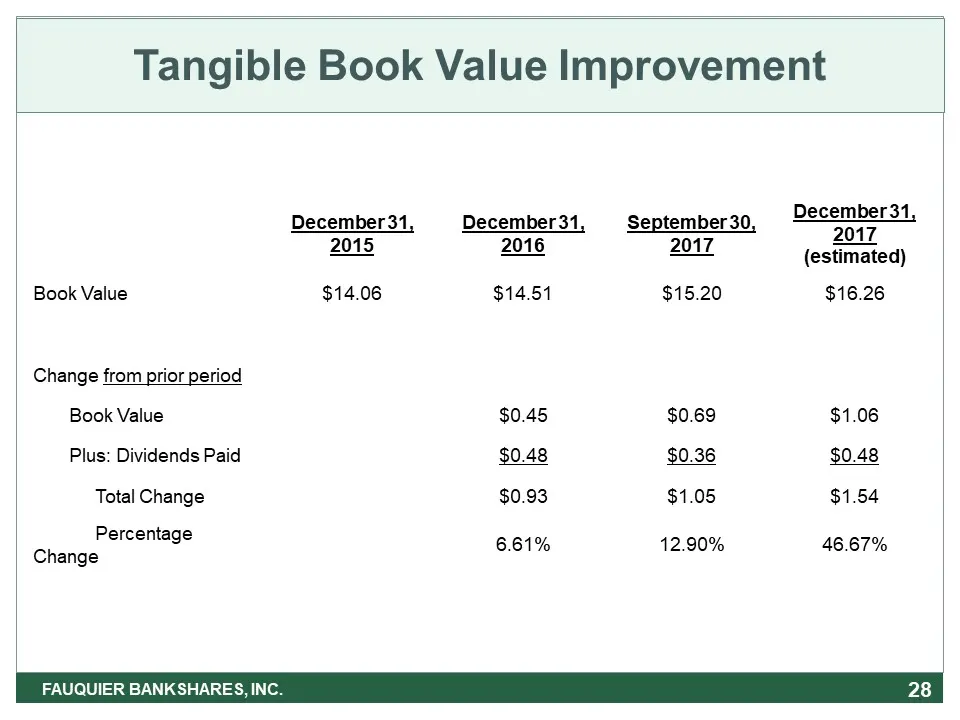
28 Tangible Book Value Improvement FAUQUIER BANKSHARES, INC. December 31, 2015 December 31, 2016 September 30, 2017 December 31, 2017 (estimated) Book Value $14.06 $14.51 $15.20 $16.26 Change from prior period Book Value $0.45 $0.69 $1.06 Plus: Dividends Paid $0.48 $0.36 $0.48 Total Change $0.93 $1.
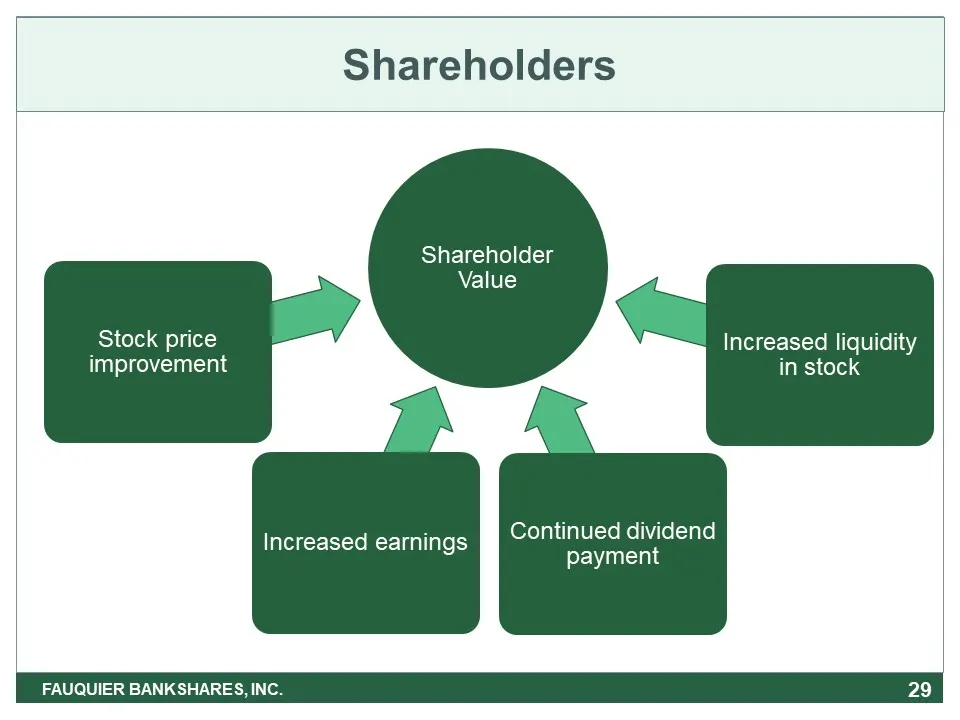
Slide 29: Shareholders
29 Shareholders FAUQUIER BANKSHARES, INC.
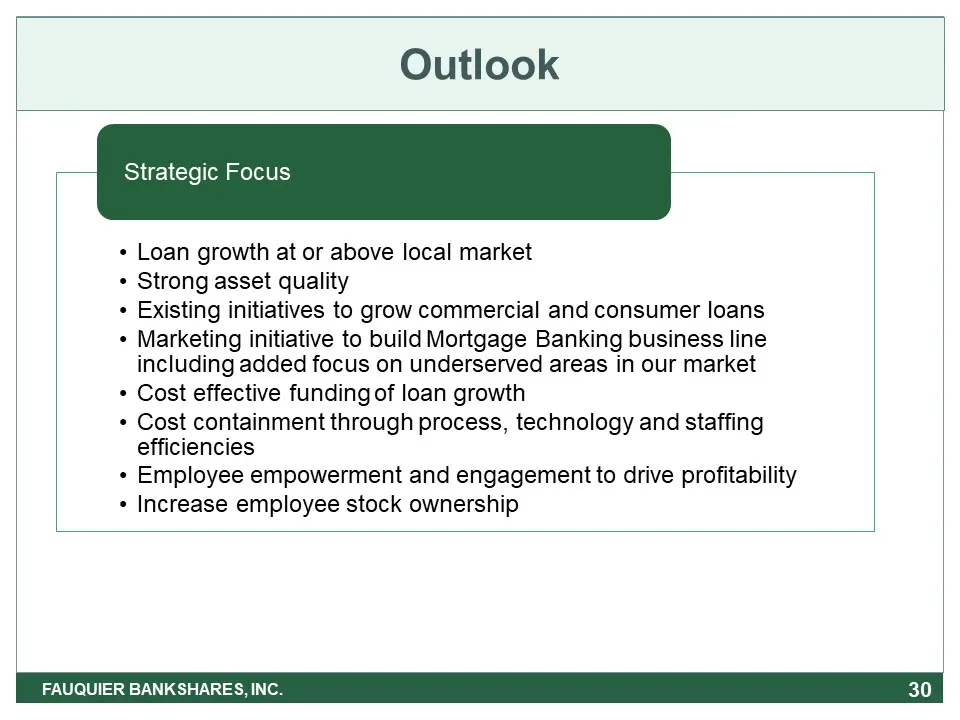
Slide 30: Outlook
30 Outlook FAUQUIER BANKSHARES, INC.
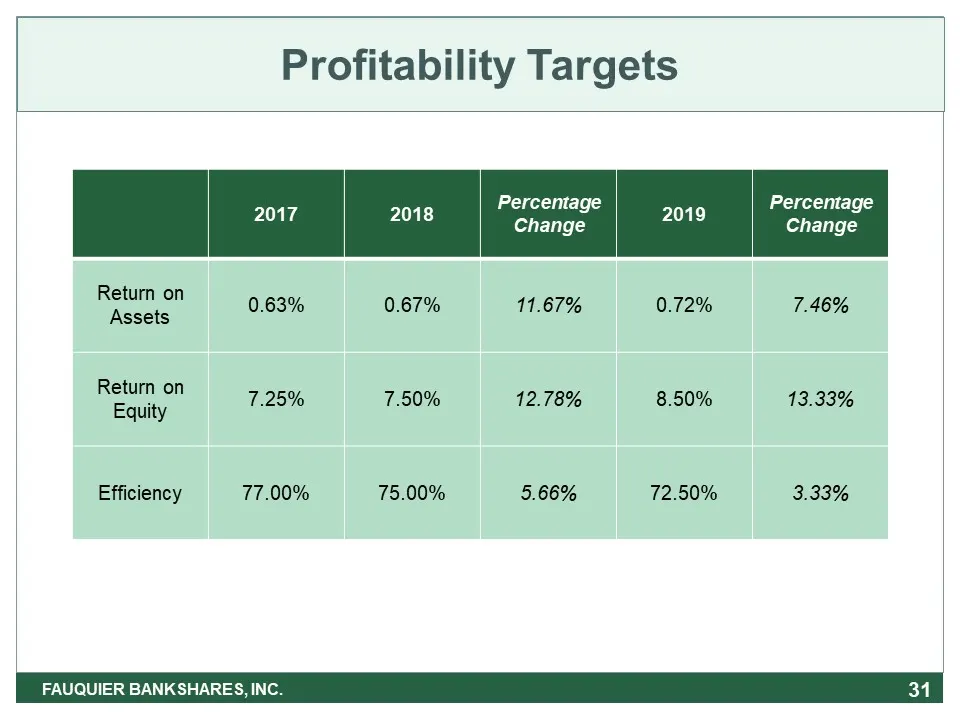
Slide 31: Profitability Targets
31 Profitability Targets FAUQUIER BANKSHARES, INC. 2017 2018 Percentage Change 2019 Percentage Change Return on Assets 0.63% 0.67% 11.67% 0.72% 7.46% Return on Equity 7.25% 7.50% 12.78% 8.50% 13.33% Efficiency 77.00% 75.00% 5.66% 72.50% 3.33%
Slide 32: Safe Harbor Statement
Safe Harbor Statement This presentation may include forward-looking statements. These statements represent the Company's beliefs regarding future events that, by their nature, are uncertain and outside of the Company’s control. The Company’s actual results and financial condition may differ, possibl
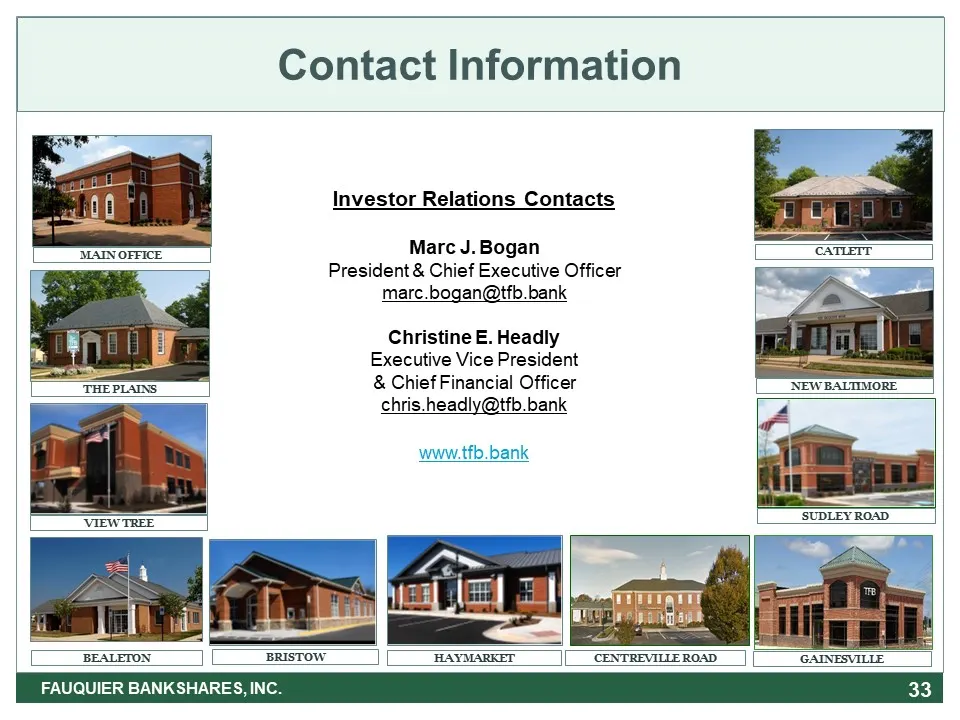
Slide 33: Investor Relations Contacts
Investor Relations ContactsMarc J. BoganPresident & Chief Executive Officer [email protected] E. HeadlyExecutive Vice President& Chief Financial [email protected] MAIN OFFICE THE PLAINS VIEW TREE BEALETON GAINESVILLE SUDLEY ROAD NEW BALTIMORE CATLETT BRISTOW HAYMARK
Source: SEC EDGAR · 8-K filed Dec 20, 2017
More decks from Fauquier Bankshares Inc
 Merger or Acquisition (October 2020)20 slides · Oct 1, 2020
 Shareholder Meeting (May 2020)30 slides · May 19, 2020
 Investor Presentation (August 2019)20 slides · Aug 7, 2019
 Shareholder Meeting (May 2019)31 slides · May 21, 2019
 Investor Presentation (October 2018)18 slides · Oct 22, 2018
 Shareholder Meeting (May 2018)33 slides · May 15, 2018