INX — Investor Presentation (March 2009)
27 slides from INX's investor presentation, Mar 18, 2009
Slide 1: Investor Overview
Investor Overview Jim Long, Chairman & CEO INX Inc. March 17, 2009 Nasdaq: INXI www.INXI.com
Slide 2: GAAP Reconciliation and Forward-Looking Statements
GAAP Reconciliation and 2 Forward-Looking Statements GAAP Reconciliation During this presentation references to financial measures of INX will include references to non -GAAP financial measures. INX provides a reconciliation between GAAP and non-GAAP financial information within this presentation an
Slide 3: Overview of INX Inc.
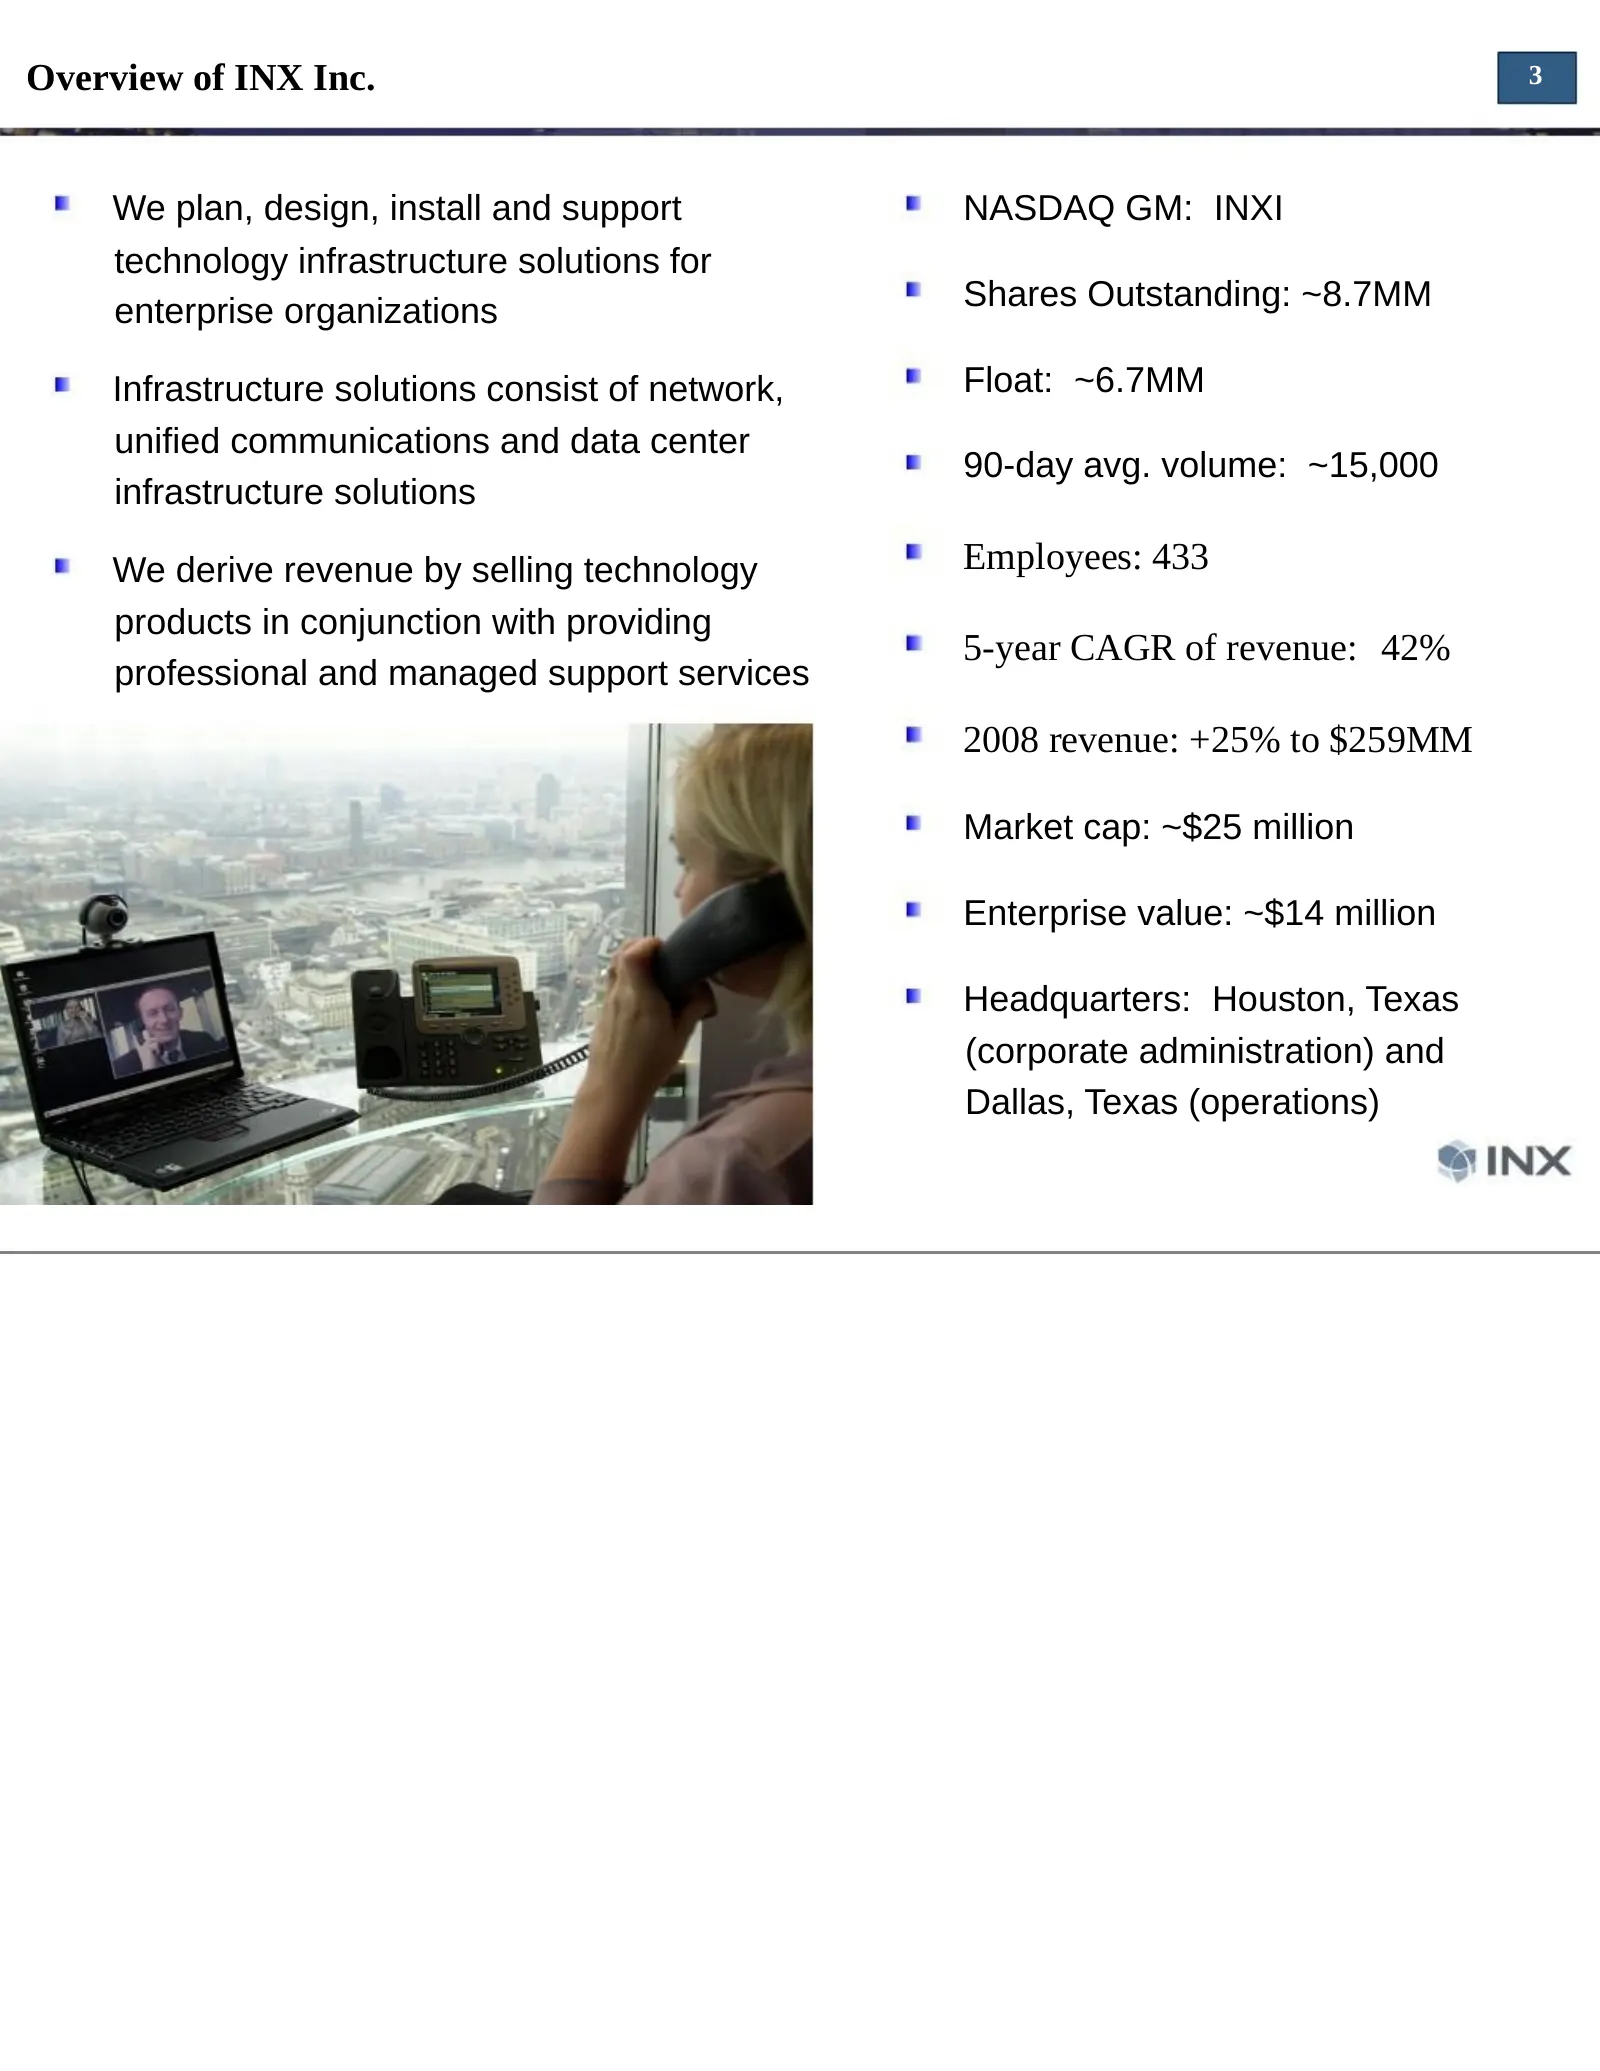
Overview of INX Inc. 3 We plan, design, install and support NASDAQ GM: INXI technology infrastructure solutions for enterprise organizations Shares Outstanding: ~8.7MM Infrastructure solutions consist of network, Float: ~6.7MM unified communications and data center 90-day avg. volume: ~15,000 infras
Slide 4: Customers Are Enterprise Organizations
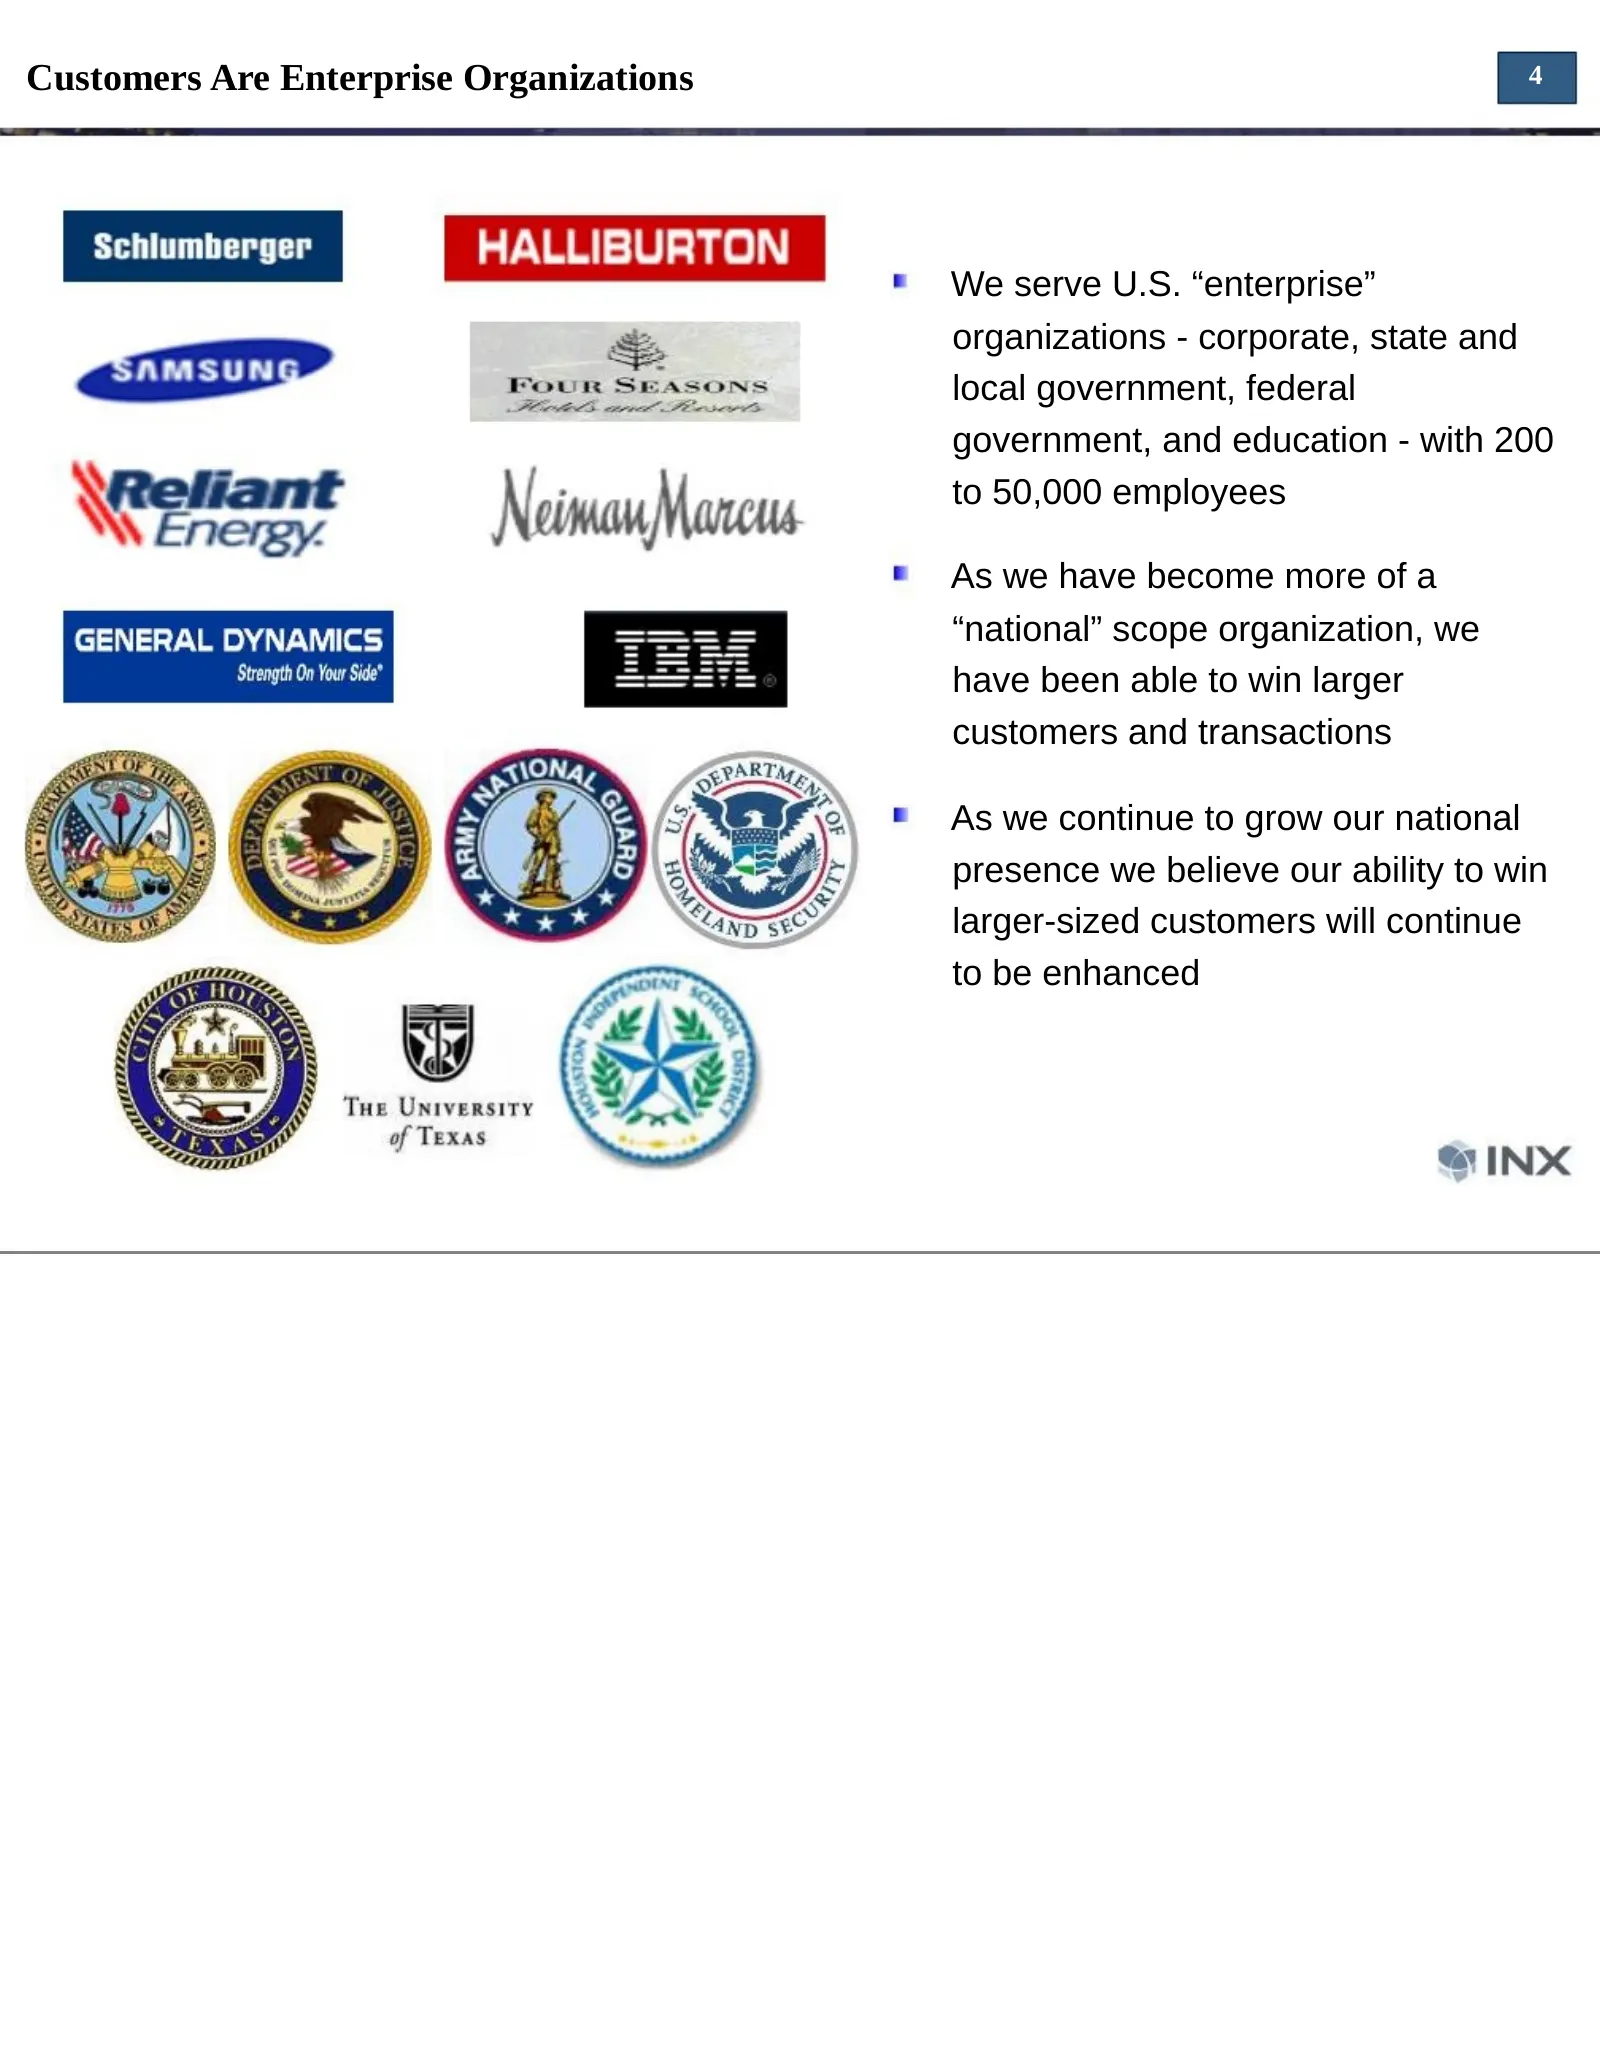
Customers Are Enterprise Organizations 4 We serve U.S. “enterprise” organizations - corporate, state and local government, federal government, and education - with 200 to 50,000 employees As we have become more of a “national” scope organization, we have been able to win larger customers and transac
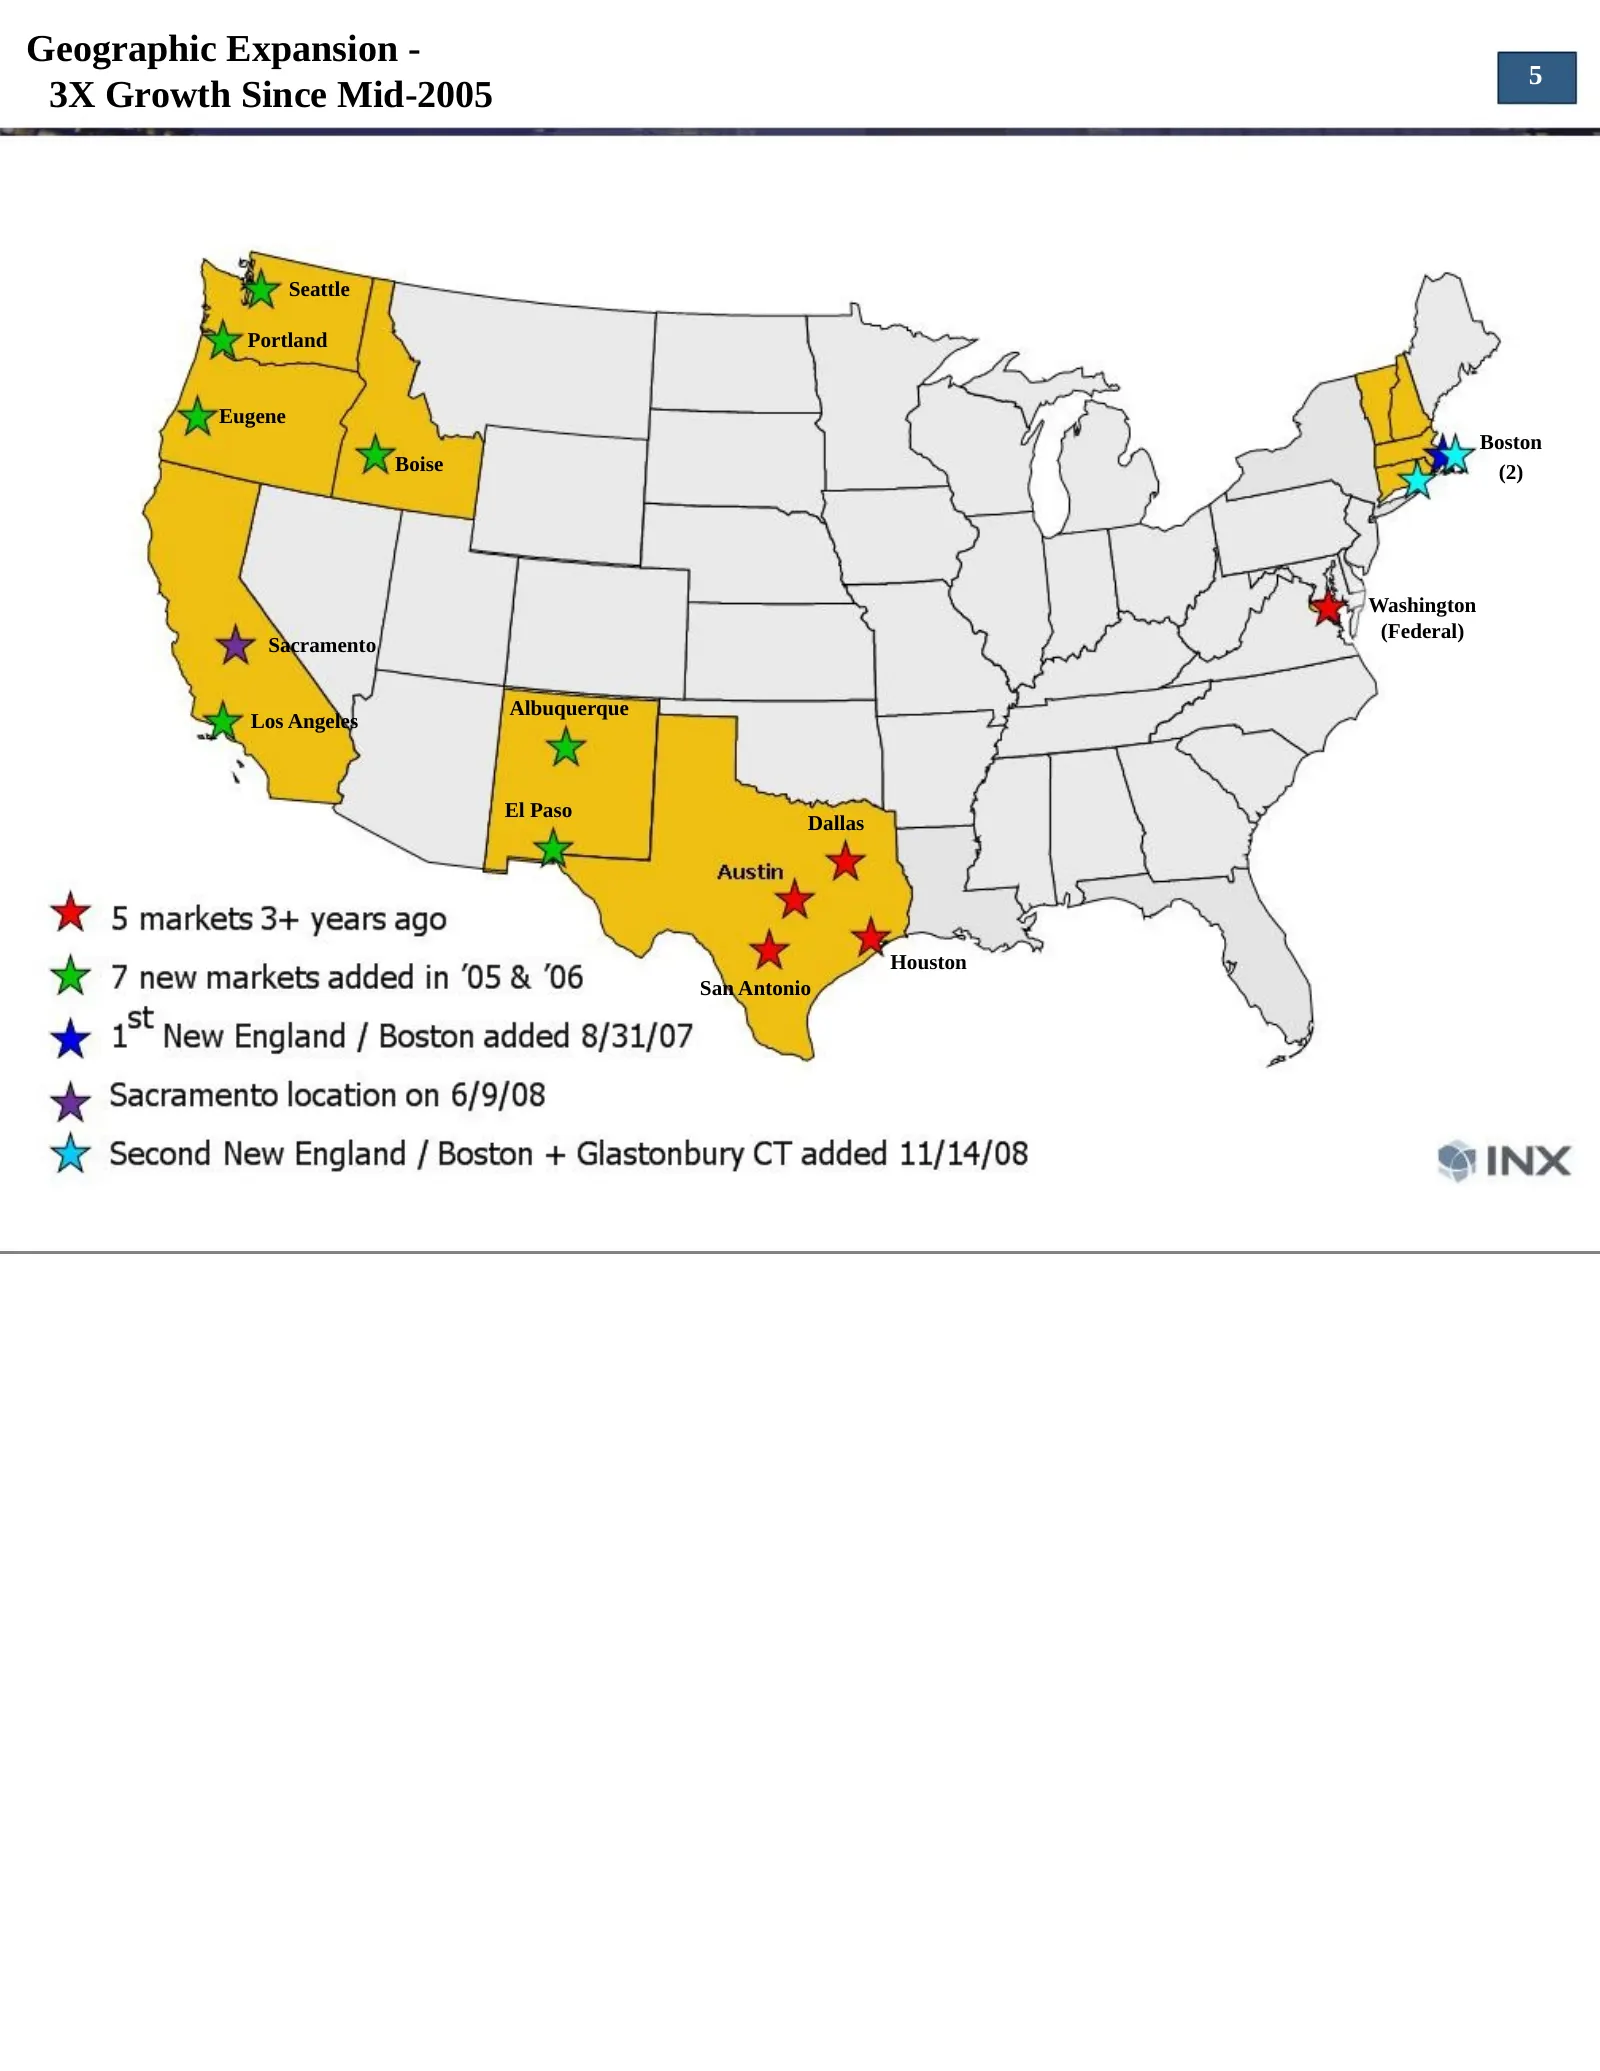
Slide 5: Geographic Expansion - 3X Growth Since Mid-2005
Geographic Expansion - 5 3X Growth Since Mid-2005 Seattle Portland Eugene Boston Boise (2) Washington (Federal) Sacramento Albuquerque Los Angeles El Paso Dallas Houston San Antonio
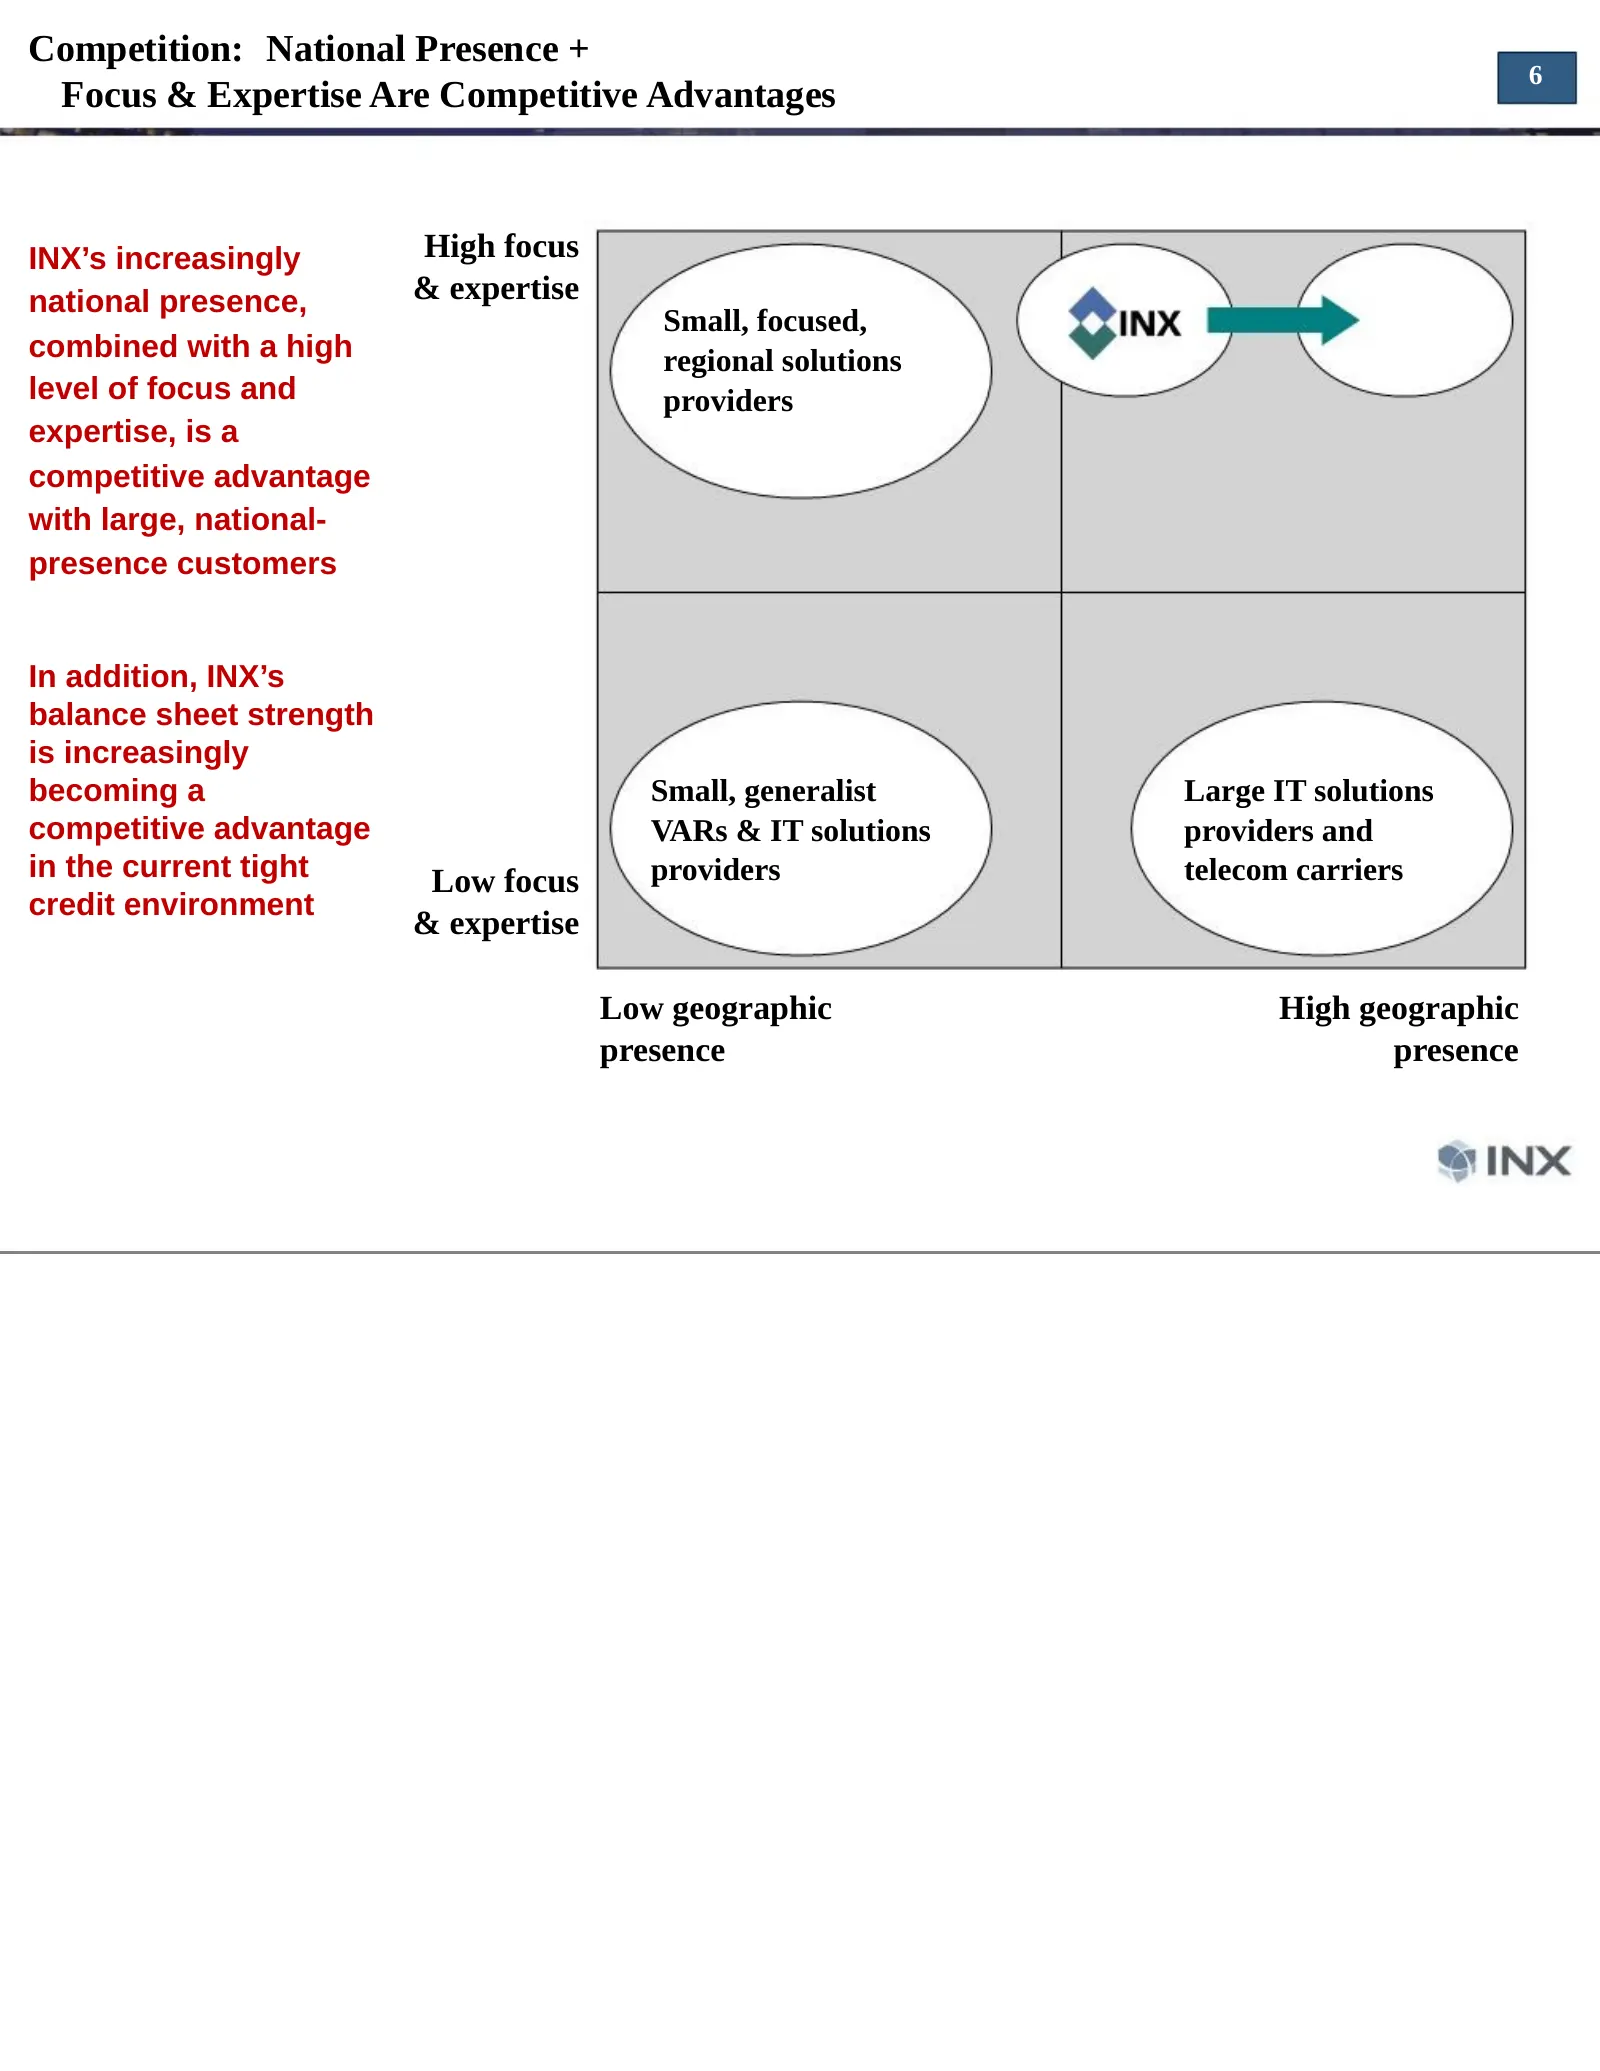
Slide 6: Competition: National Presence + Focus & Expertise Are Competitive Advantages
Competition: National Presence + 6 Focus & Expertise Are Competitive Advantages INX’s increasingly High focus national presence, & expertise Small, focused, combined with a high regional solutions level of focus and providers expertise, is a competitive advantage with large, national- presence custo
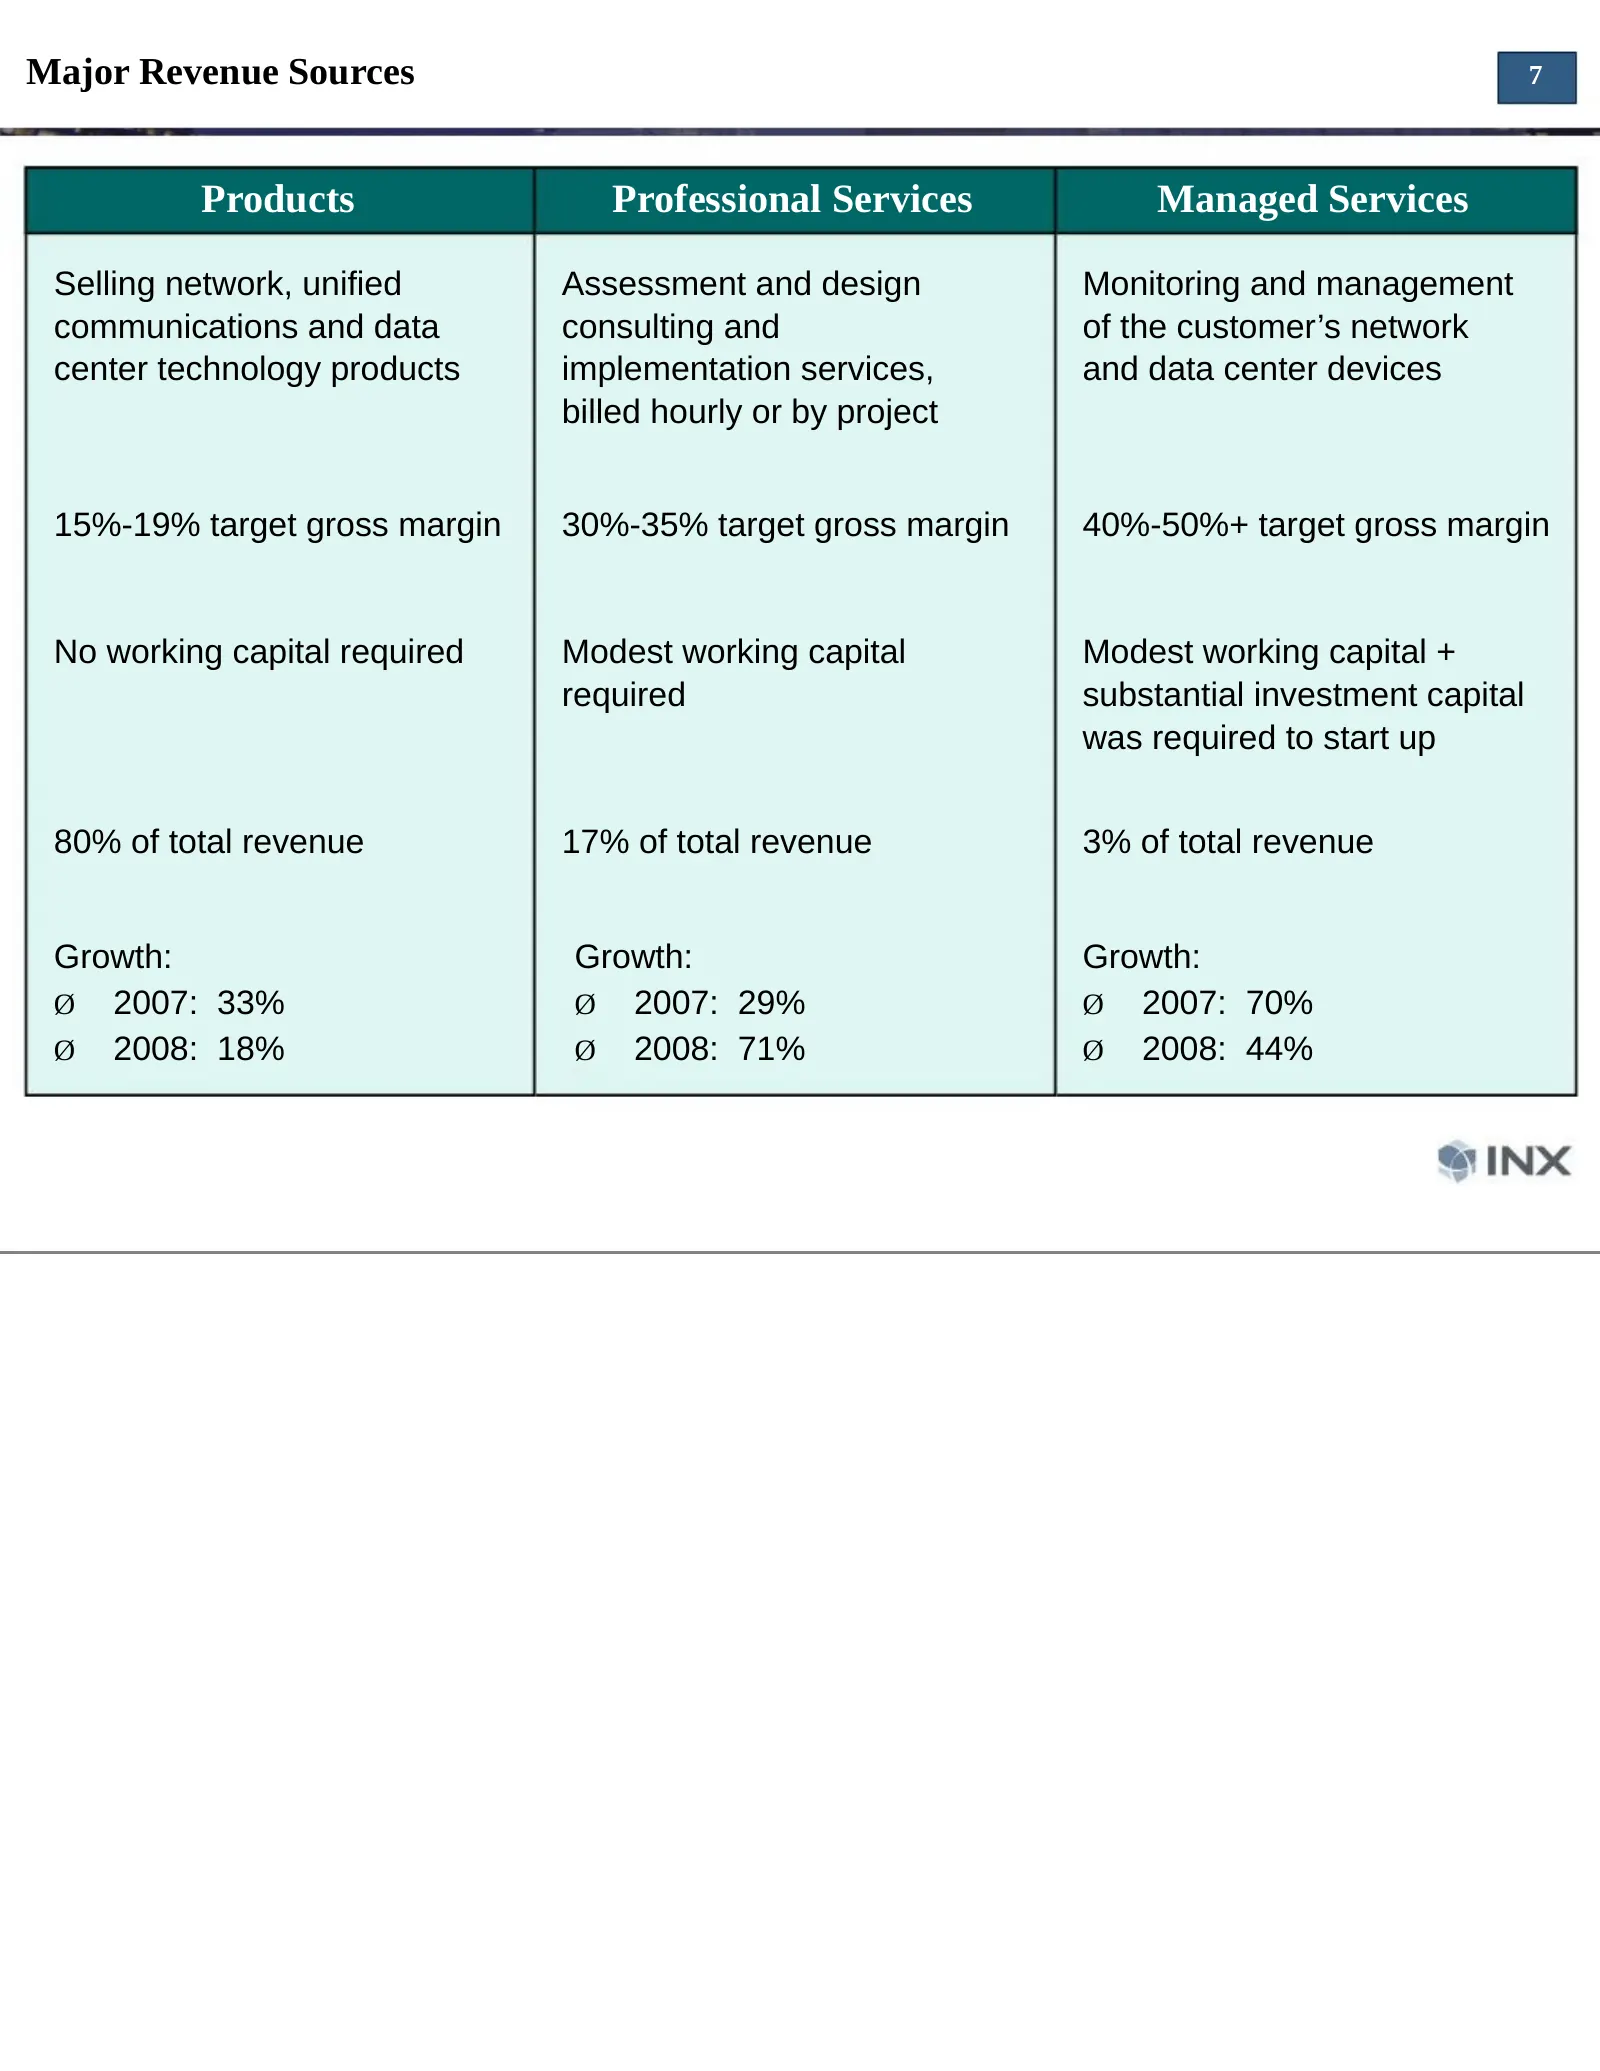
Slide 7: Major Revenue Sources
Major Revenue Sources 7 Products Professional Services Managed Services Selling network, unified Assessment and design Monitoring and management communications and data consulting and of the customer’s network center technology products implementation services, and data center devices billed hourly
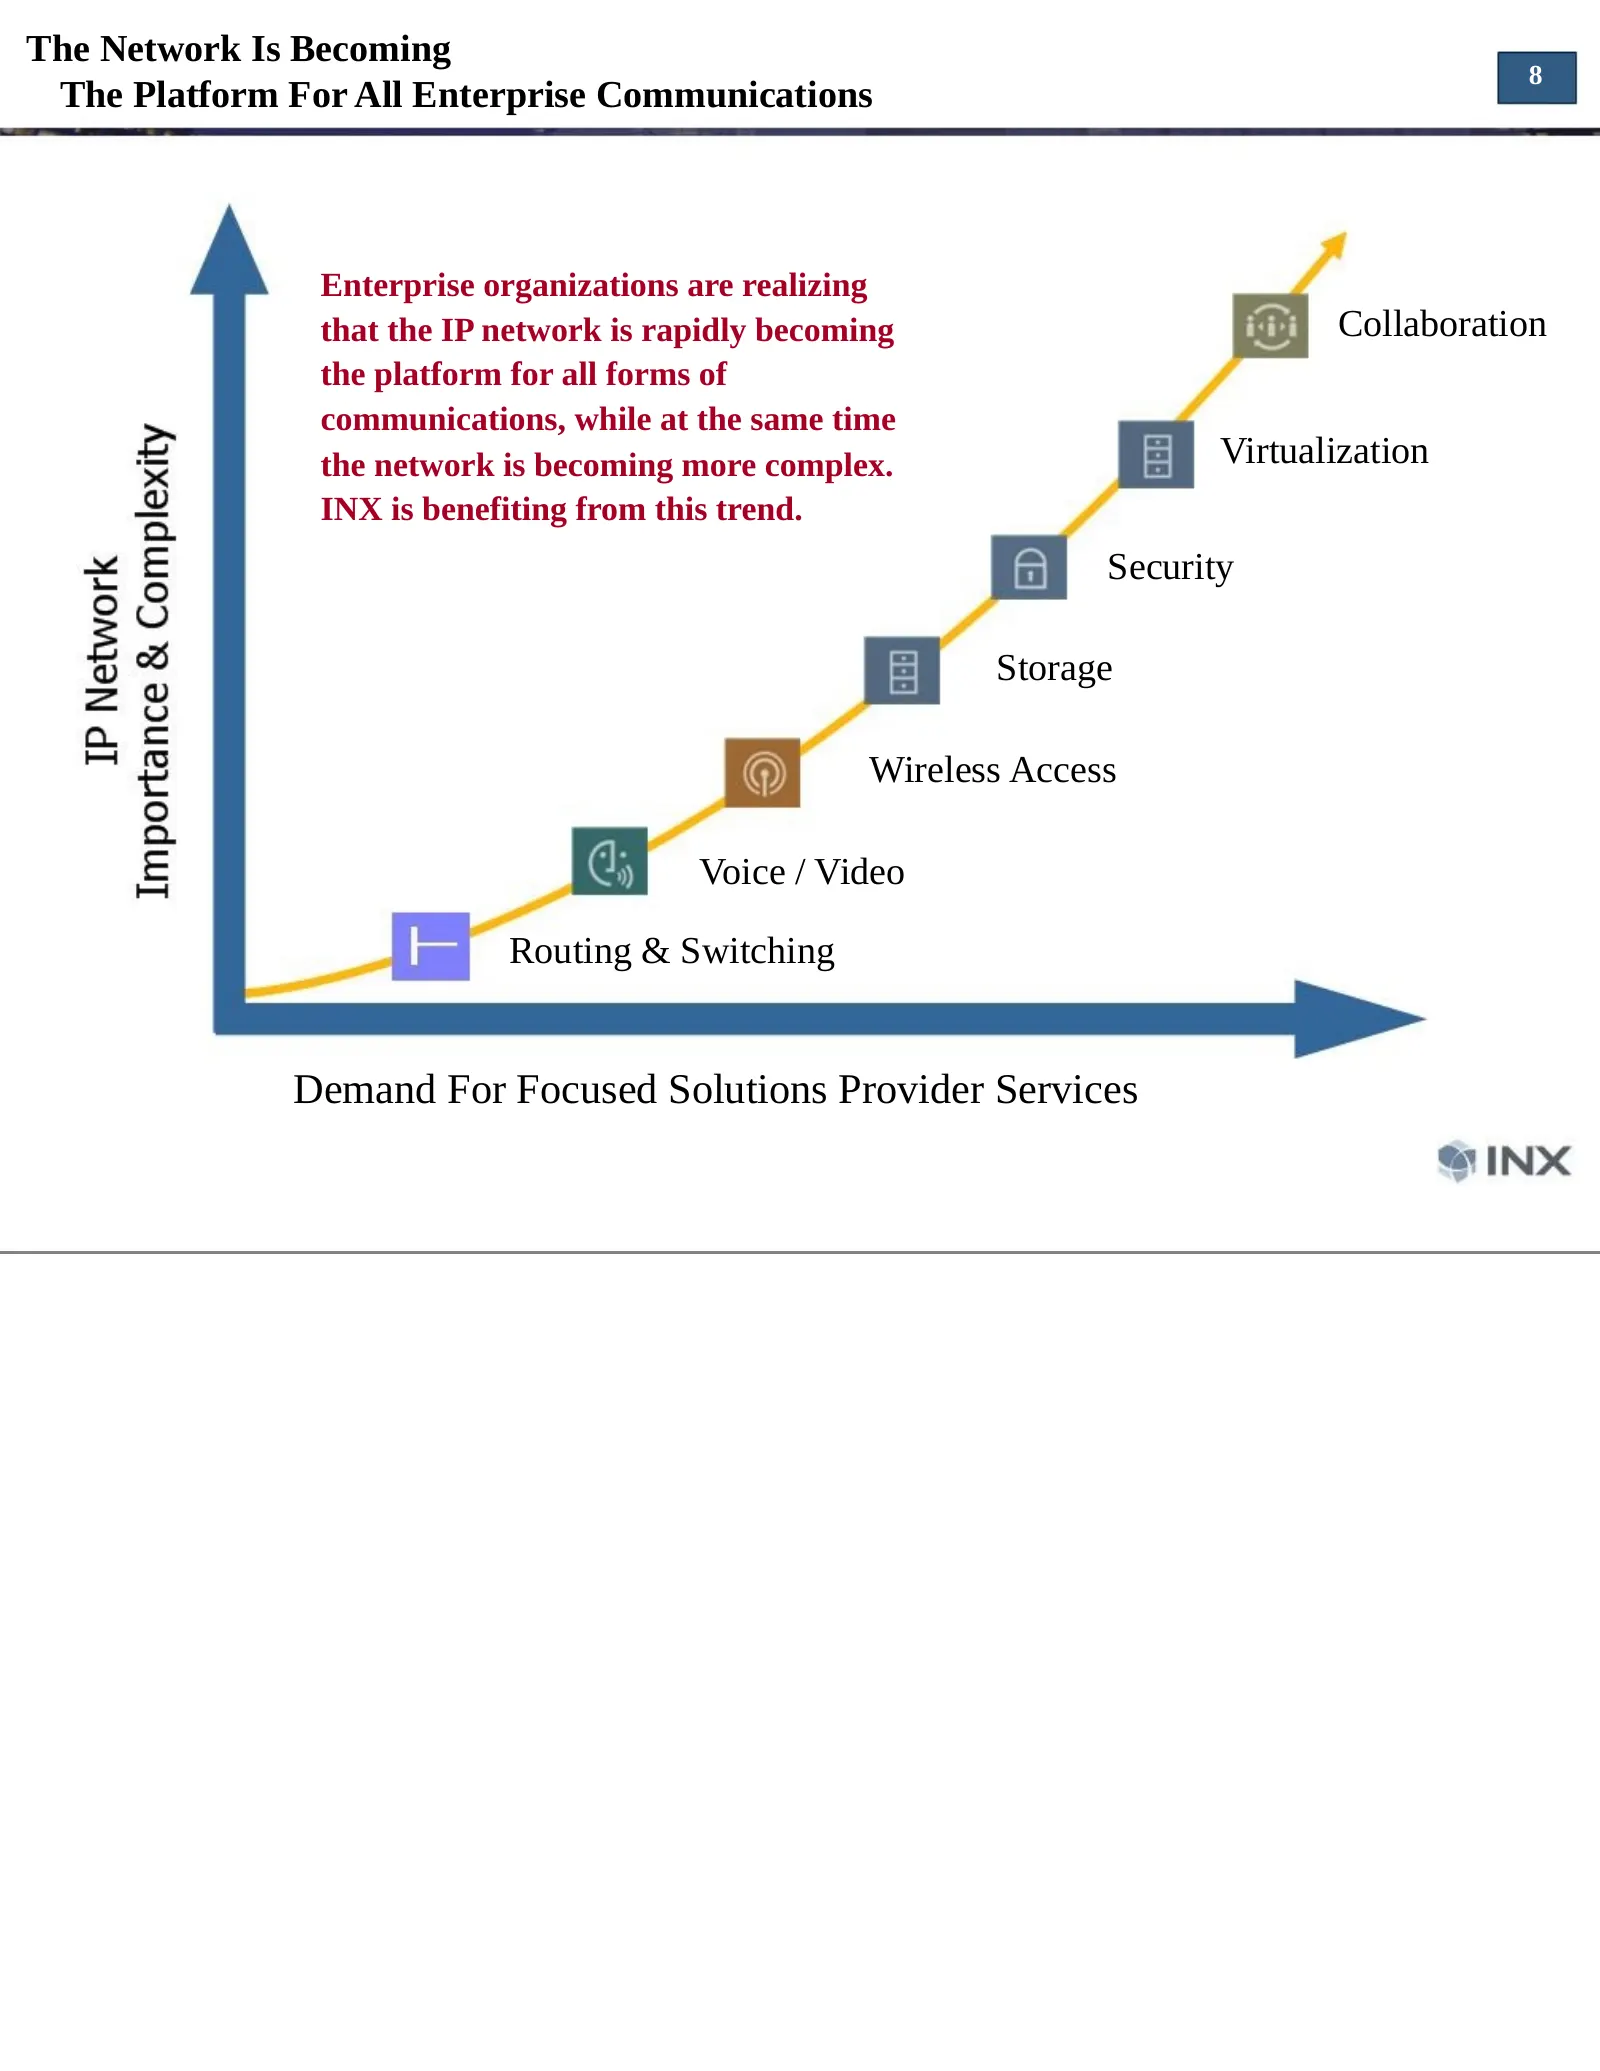
Slide 8: The Network Is Becoming The Platform For All Enterprise Communications
The Network Is Becoming 8 The Platform For All Enterprise Communications Enterprise organizations are realizing that the IP network is rapidly becoming Collaboration the platform for all forms of communications, while at the same time the network is becoming more complex. Virtualization INX is benef
Slide 9: 3 Key Areas Of Enterprise Technology
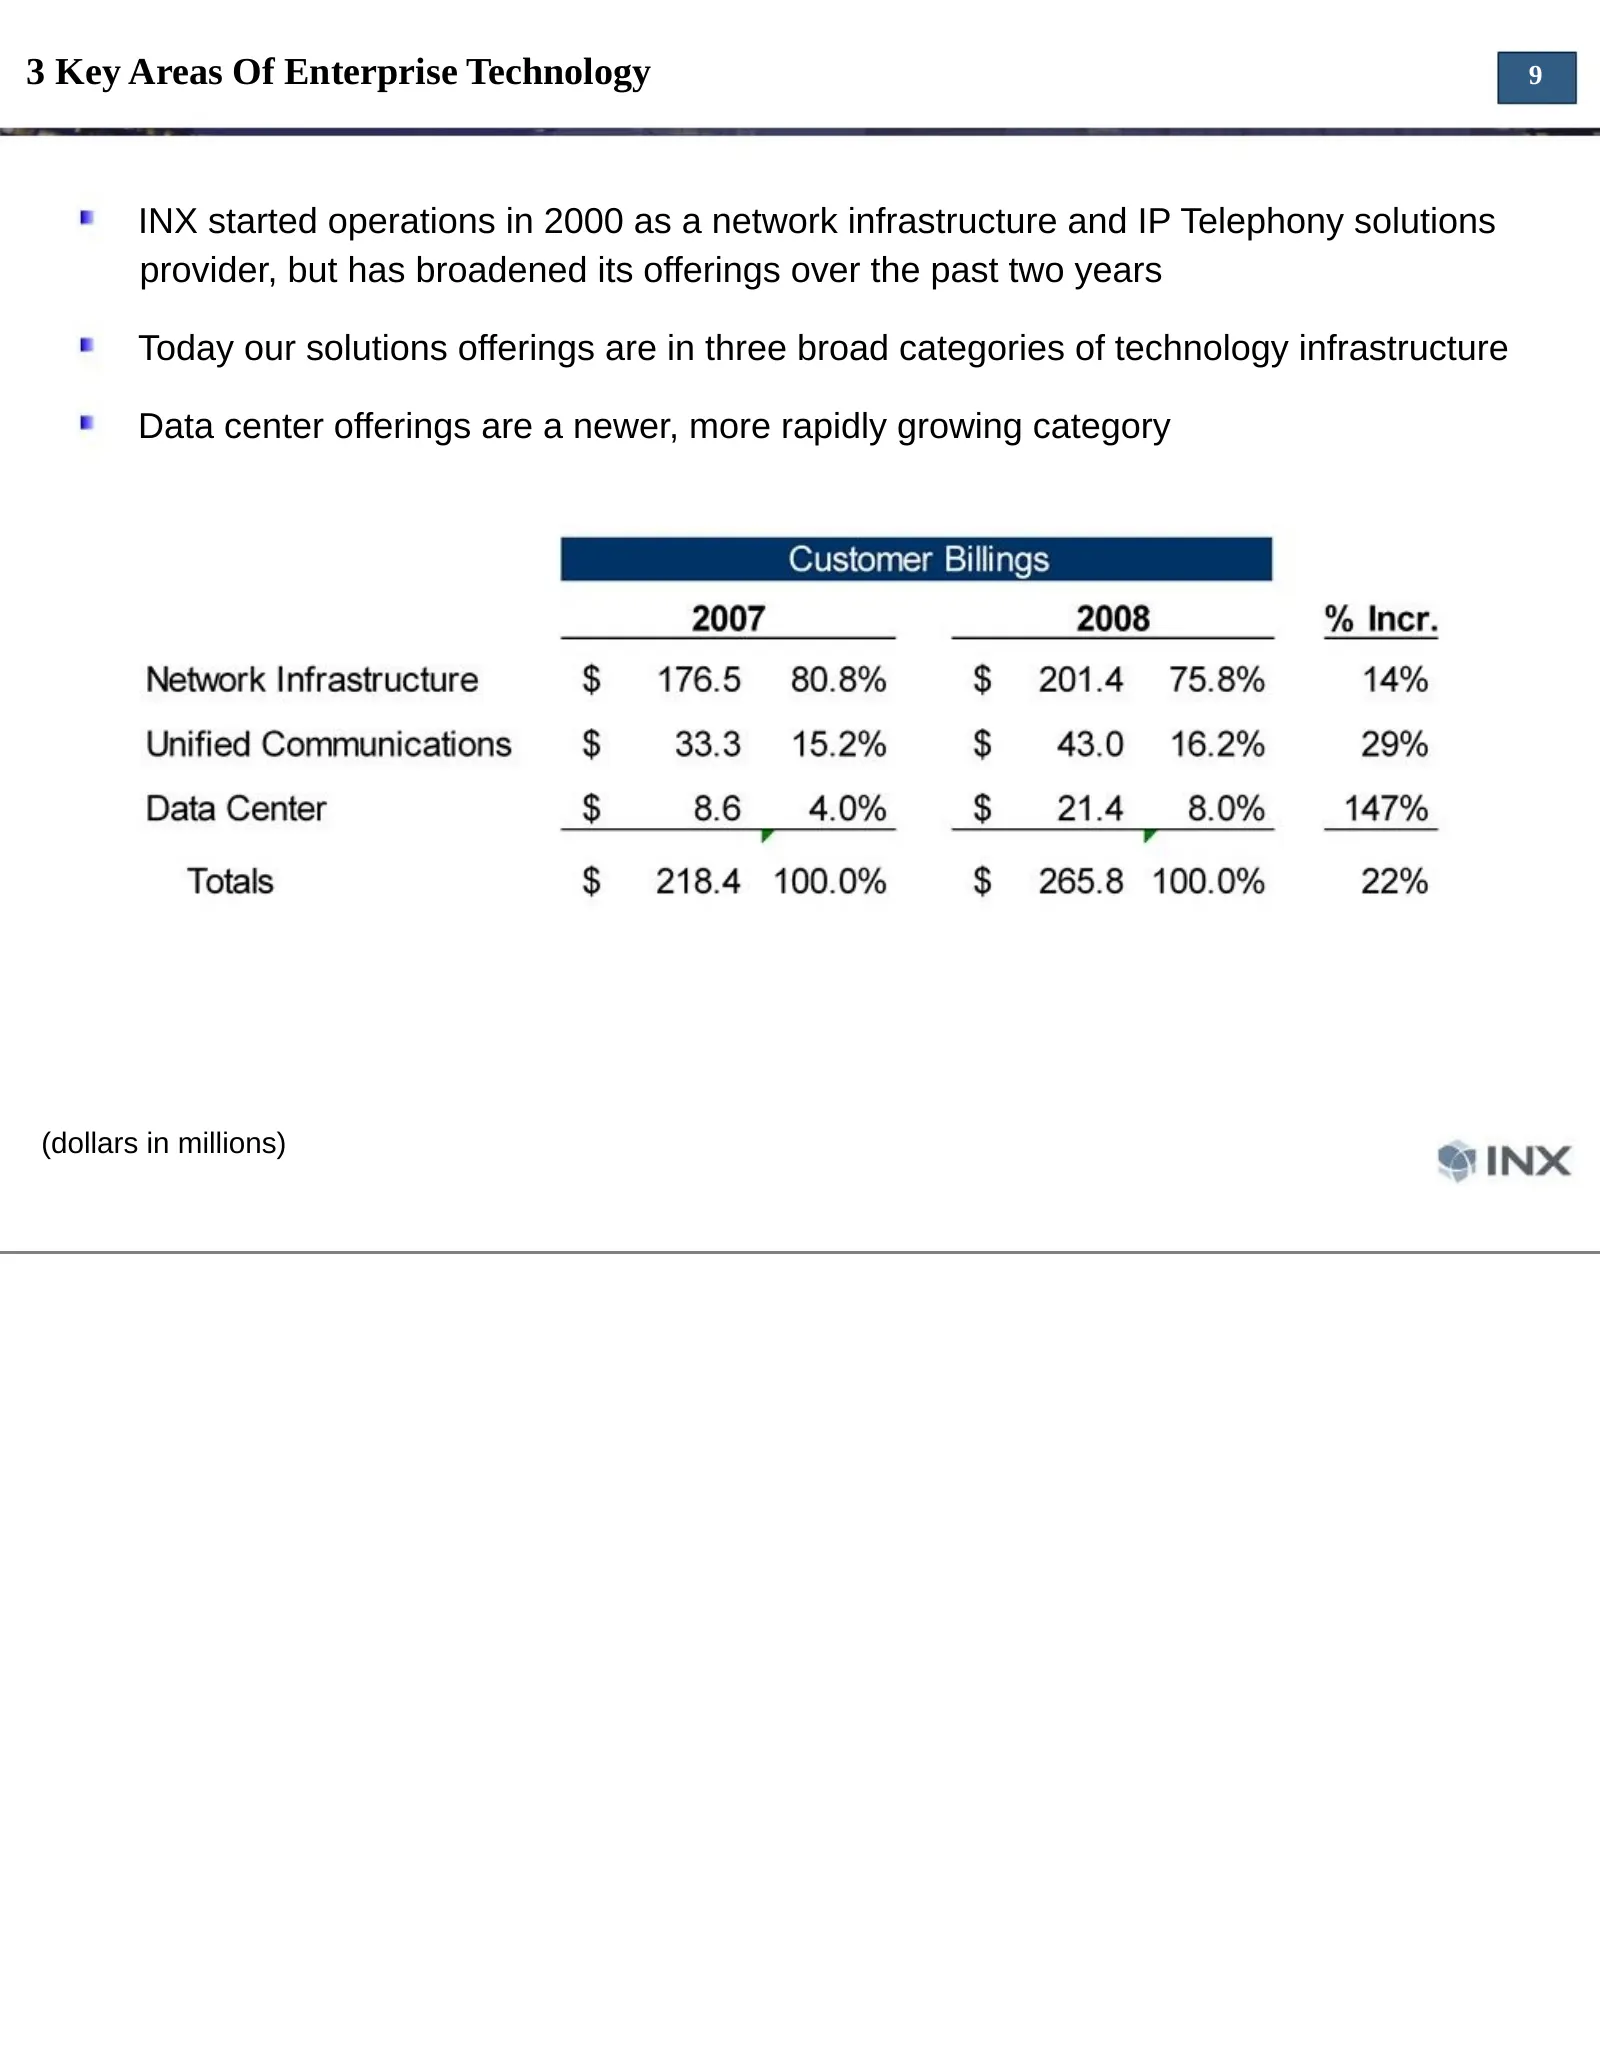
3 Key Areas Of Enterprise Technology 9 INX started operations in 2000 as a network infrastructure and IP Telephony solutions provider, but has broadened its offerings over the past two years Today our solutions offerings are in three broad categories of technology infrastructure Data center offering
Slide 10: Capacity To Grow Newer Practice Areas
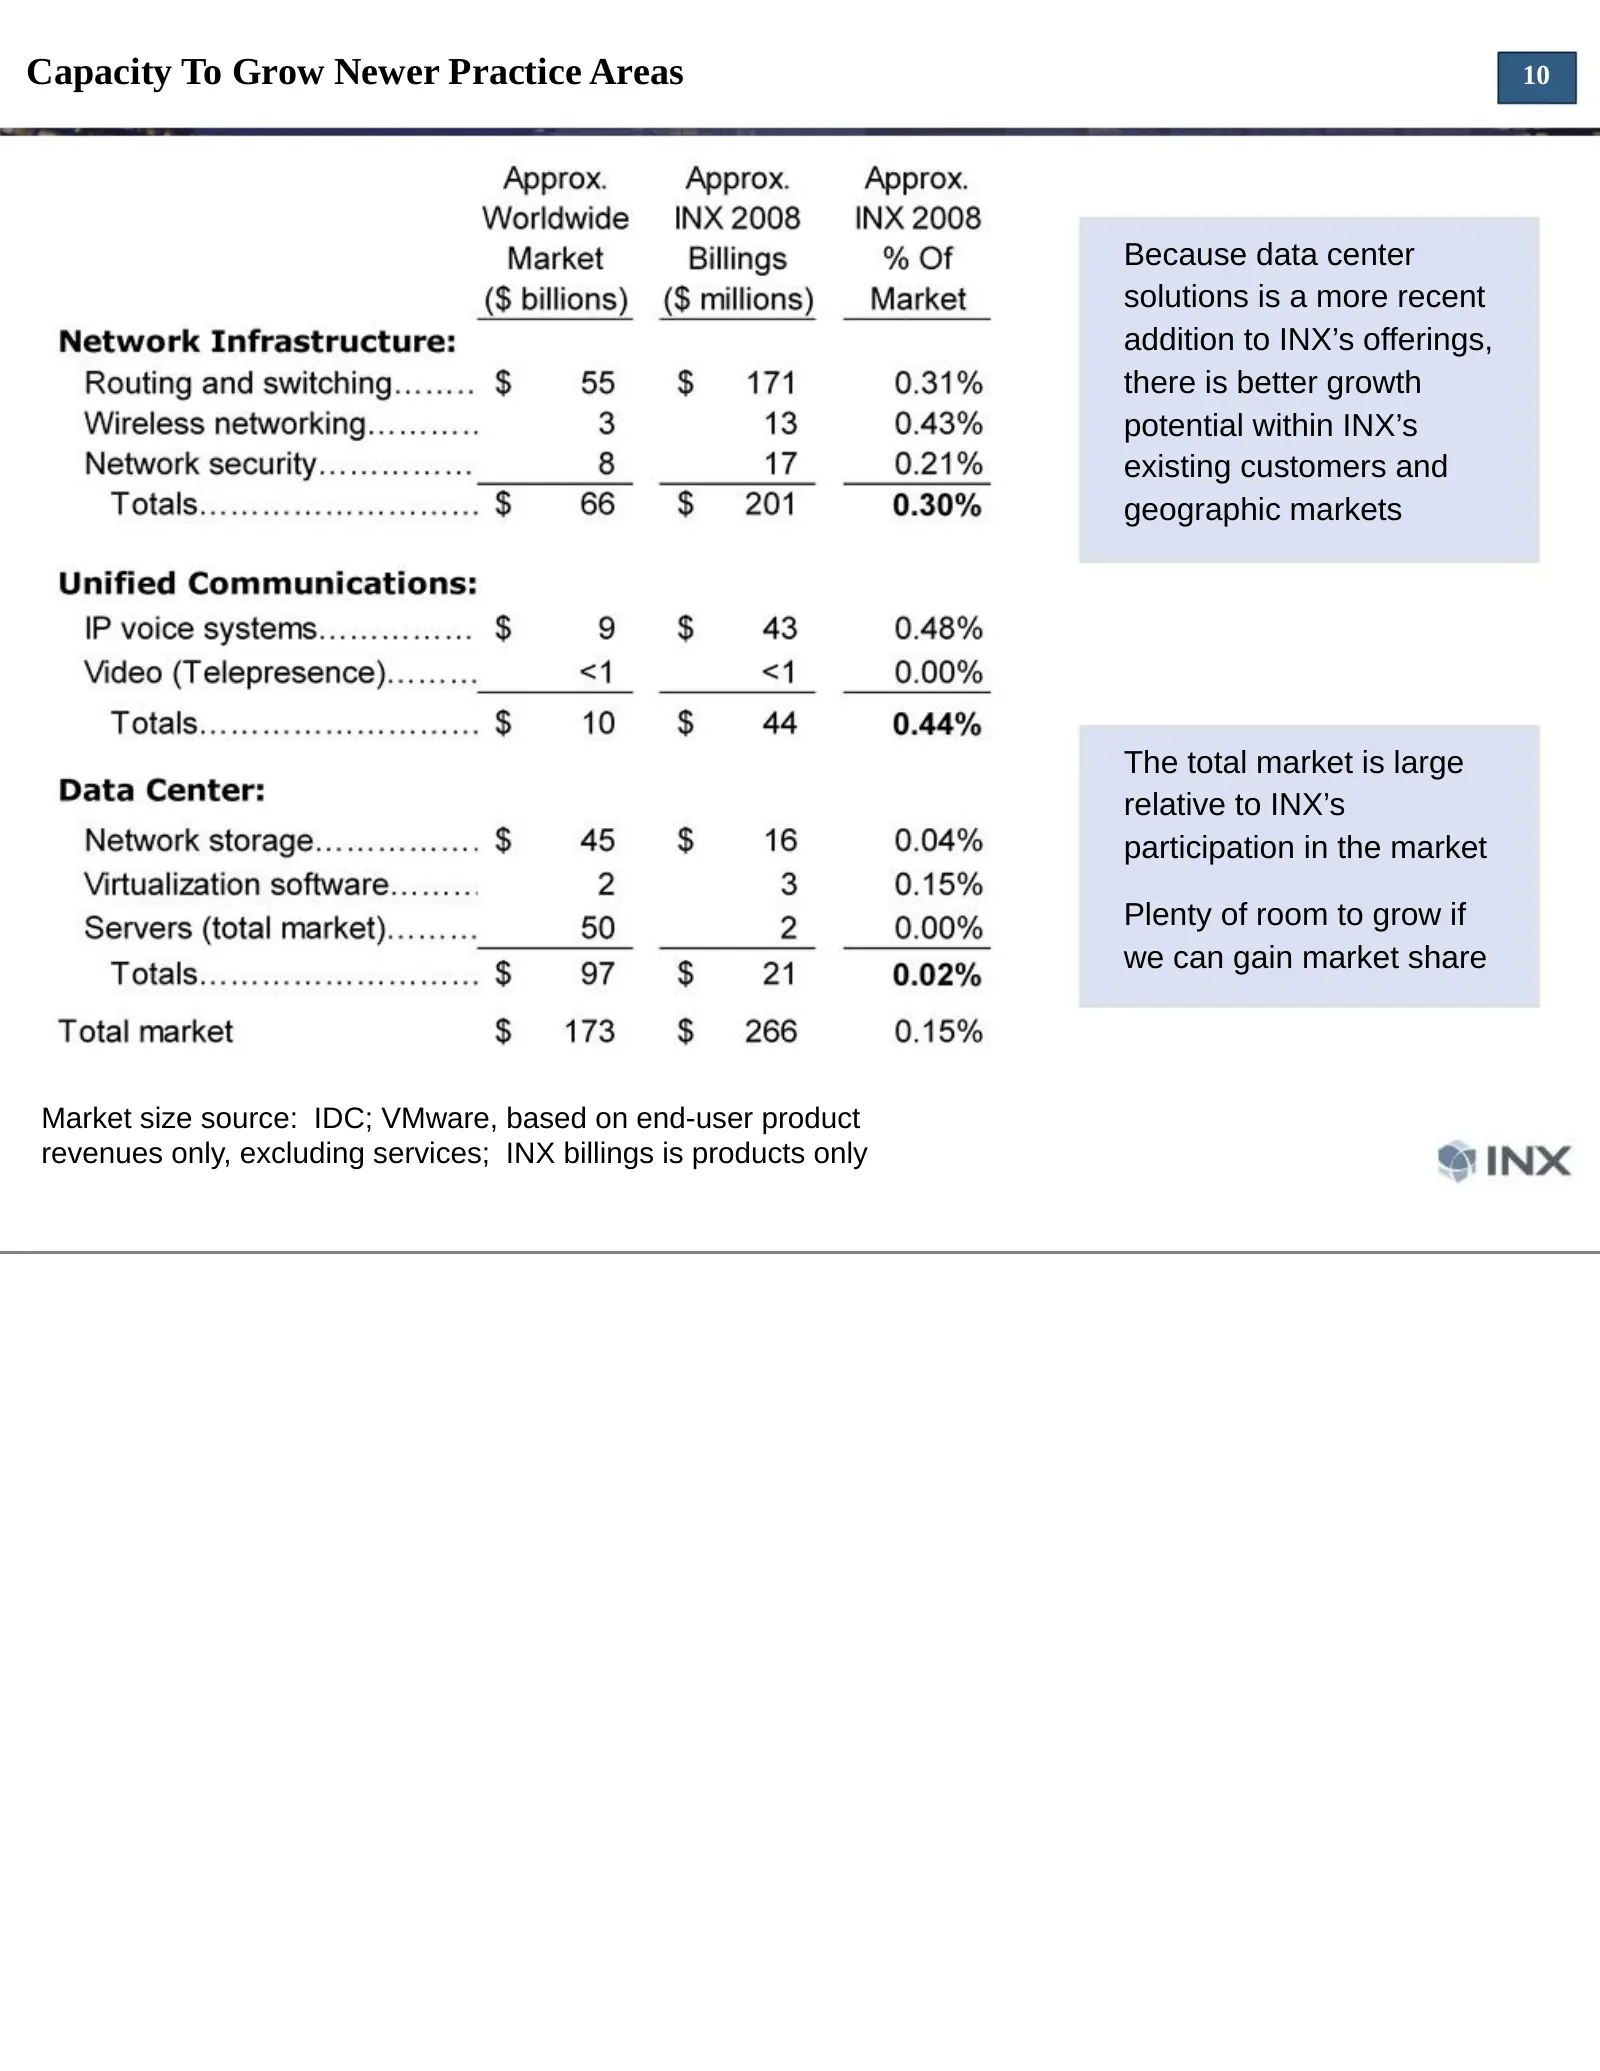
Capacity To Grow Newer Practice Areas 10 Because data center solutions is a more recent addition to INX’s offerings, there is better growth potential within INX’s existing customers and geographic markets The total market is large relative to INX’s participation in the market Plenty of room to grow
Slide 11: The Server Market Represents A Major Opportunity
The Server Market Represents A Major Opportunity 11 INX entered the server virtualization market in 2008. We have been awaiting Cisco’s release of a server product to “officially” enter the server market. The server worldwide market for servers, according to IDC, is $50 billion Cisco to unveil data
Slide 12: Balance Sheet Data
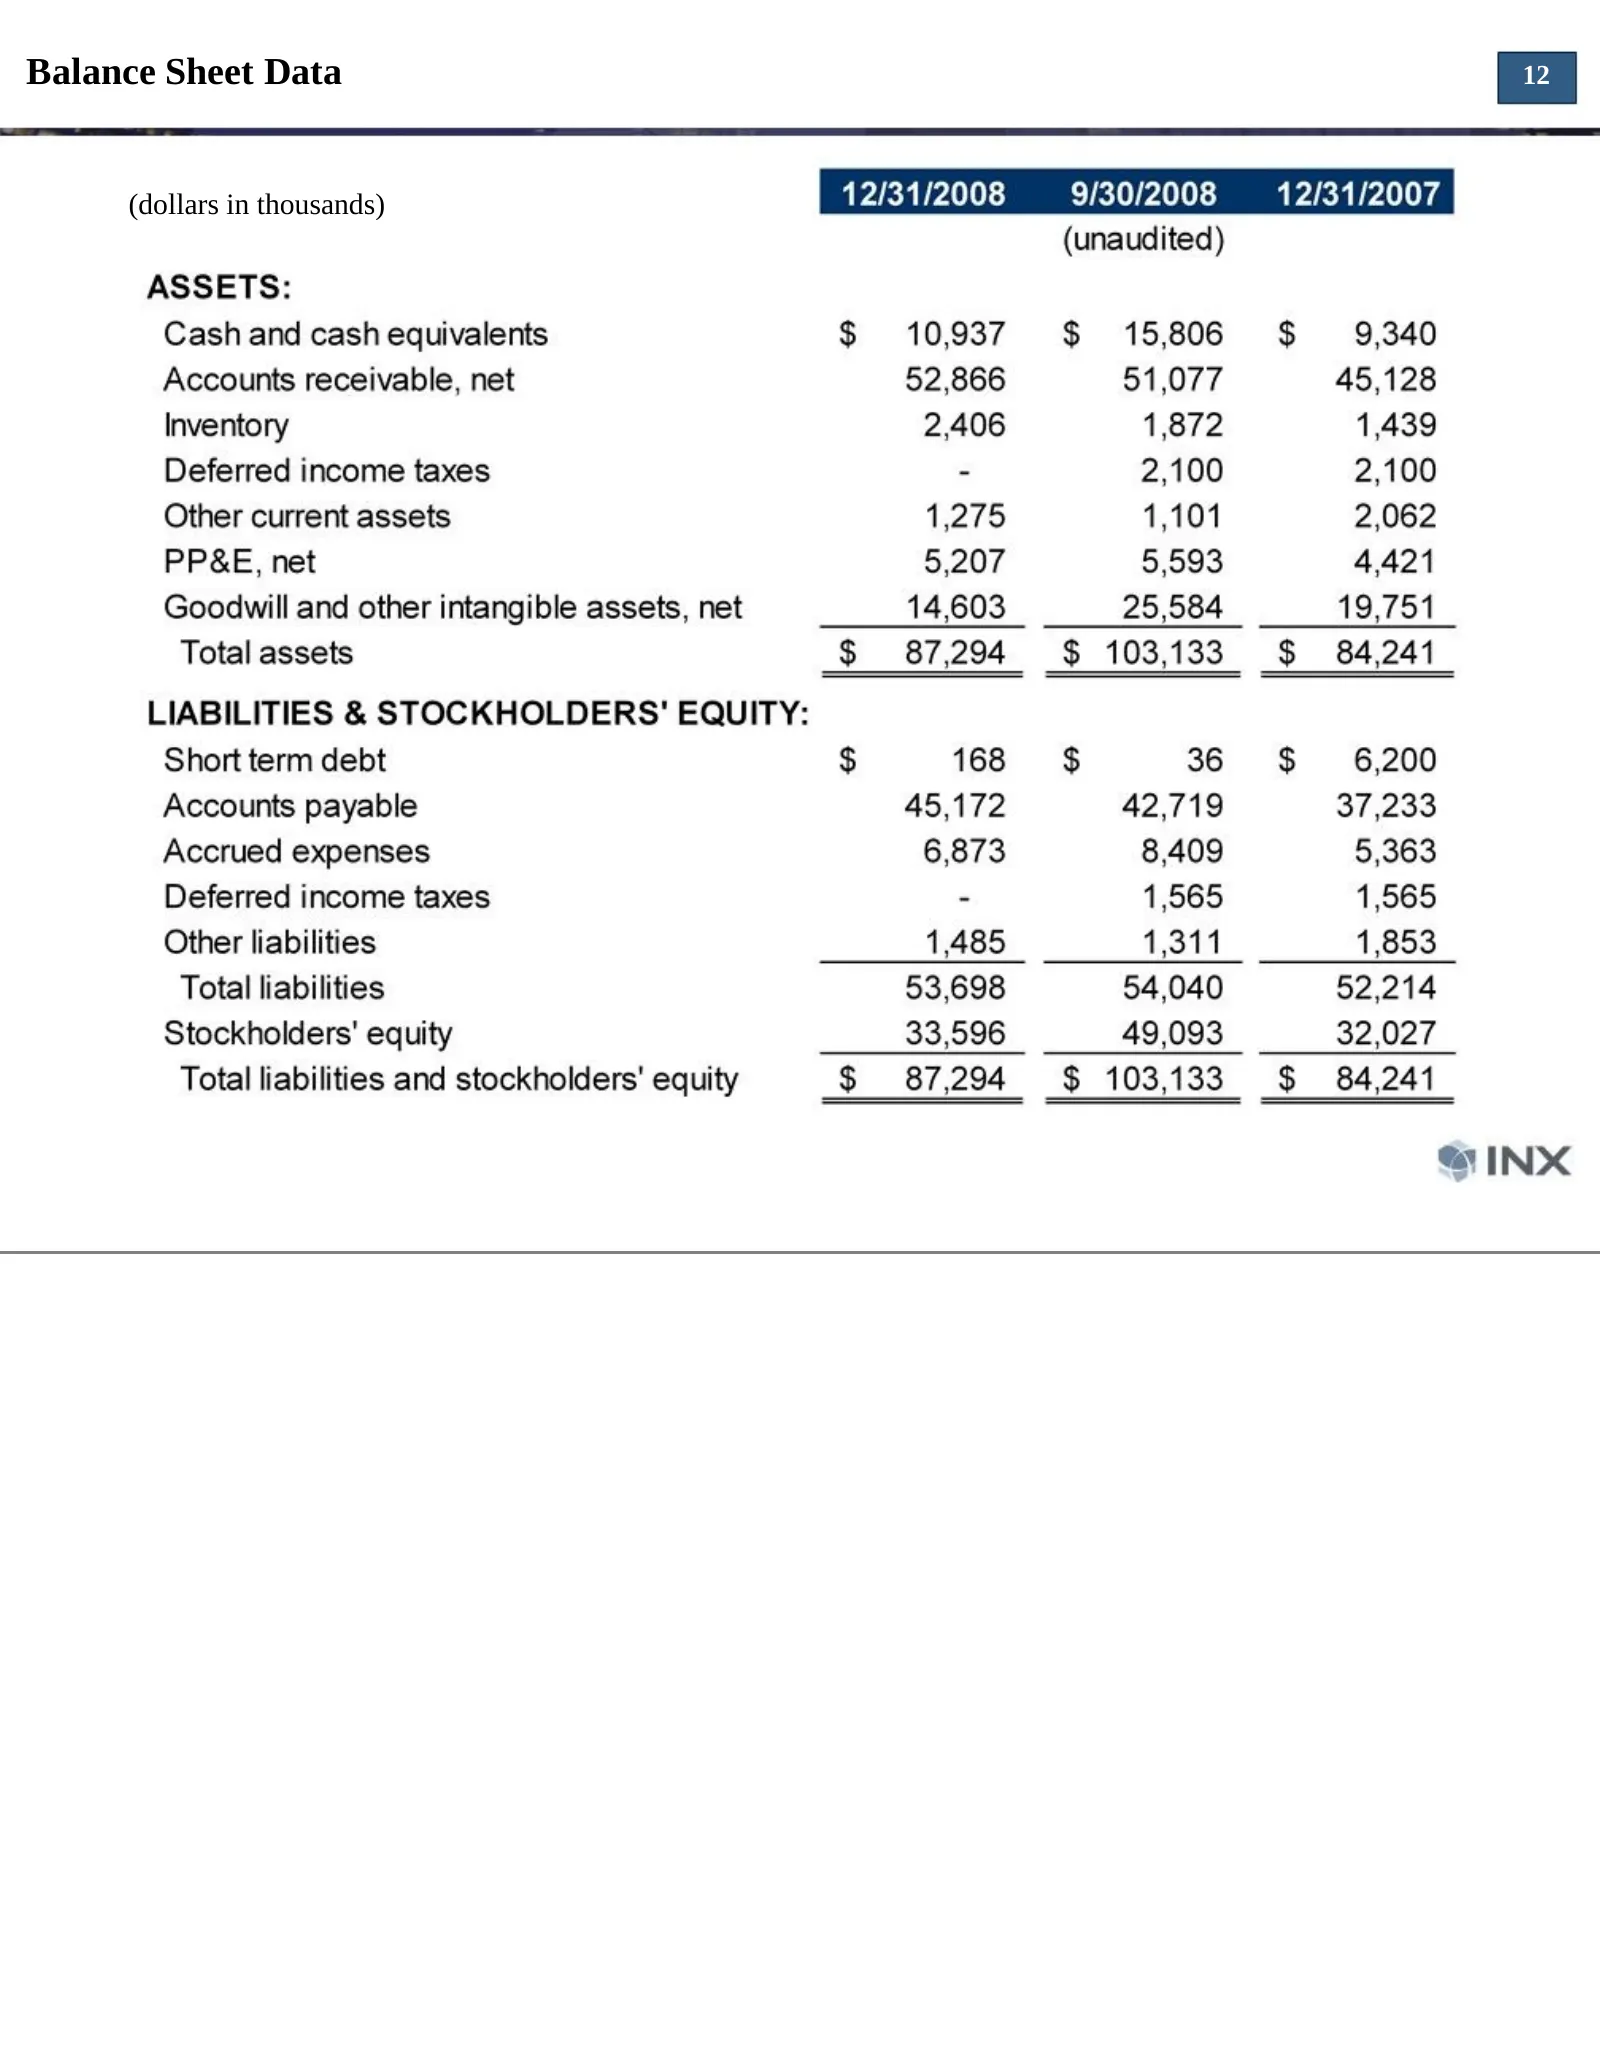
Balance Sheet Data 12 (dollars in thousands)
Slide 13: Accounts Receivable
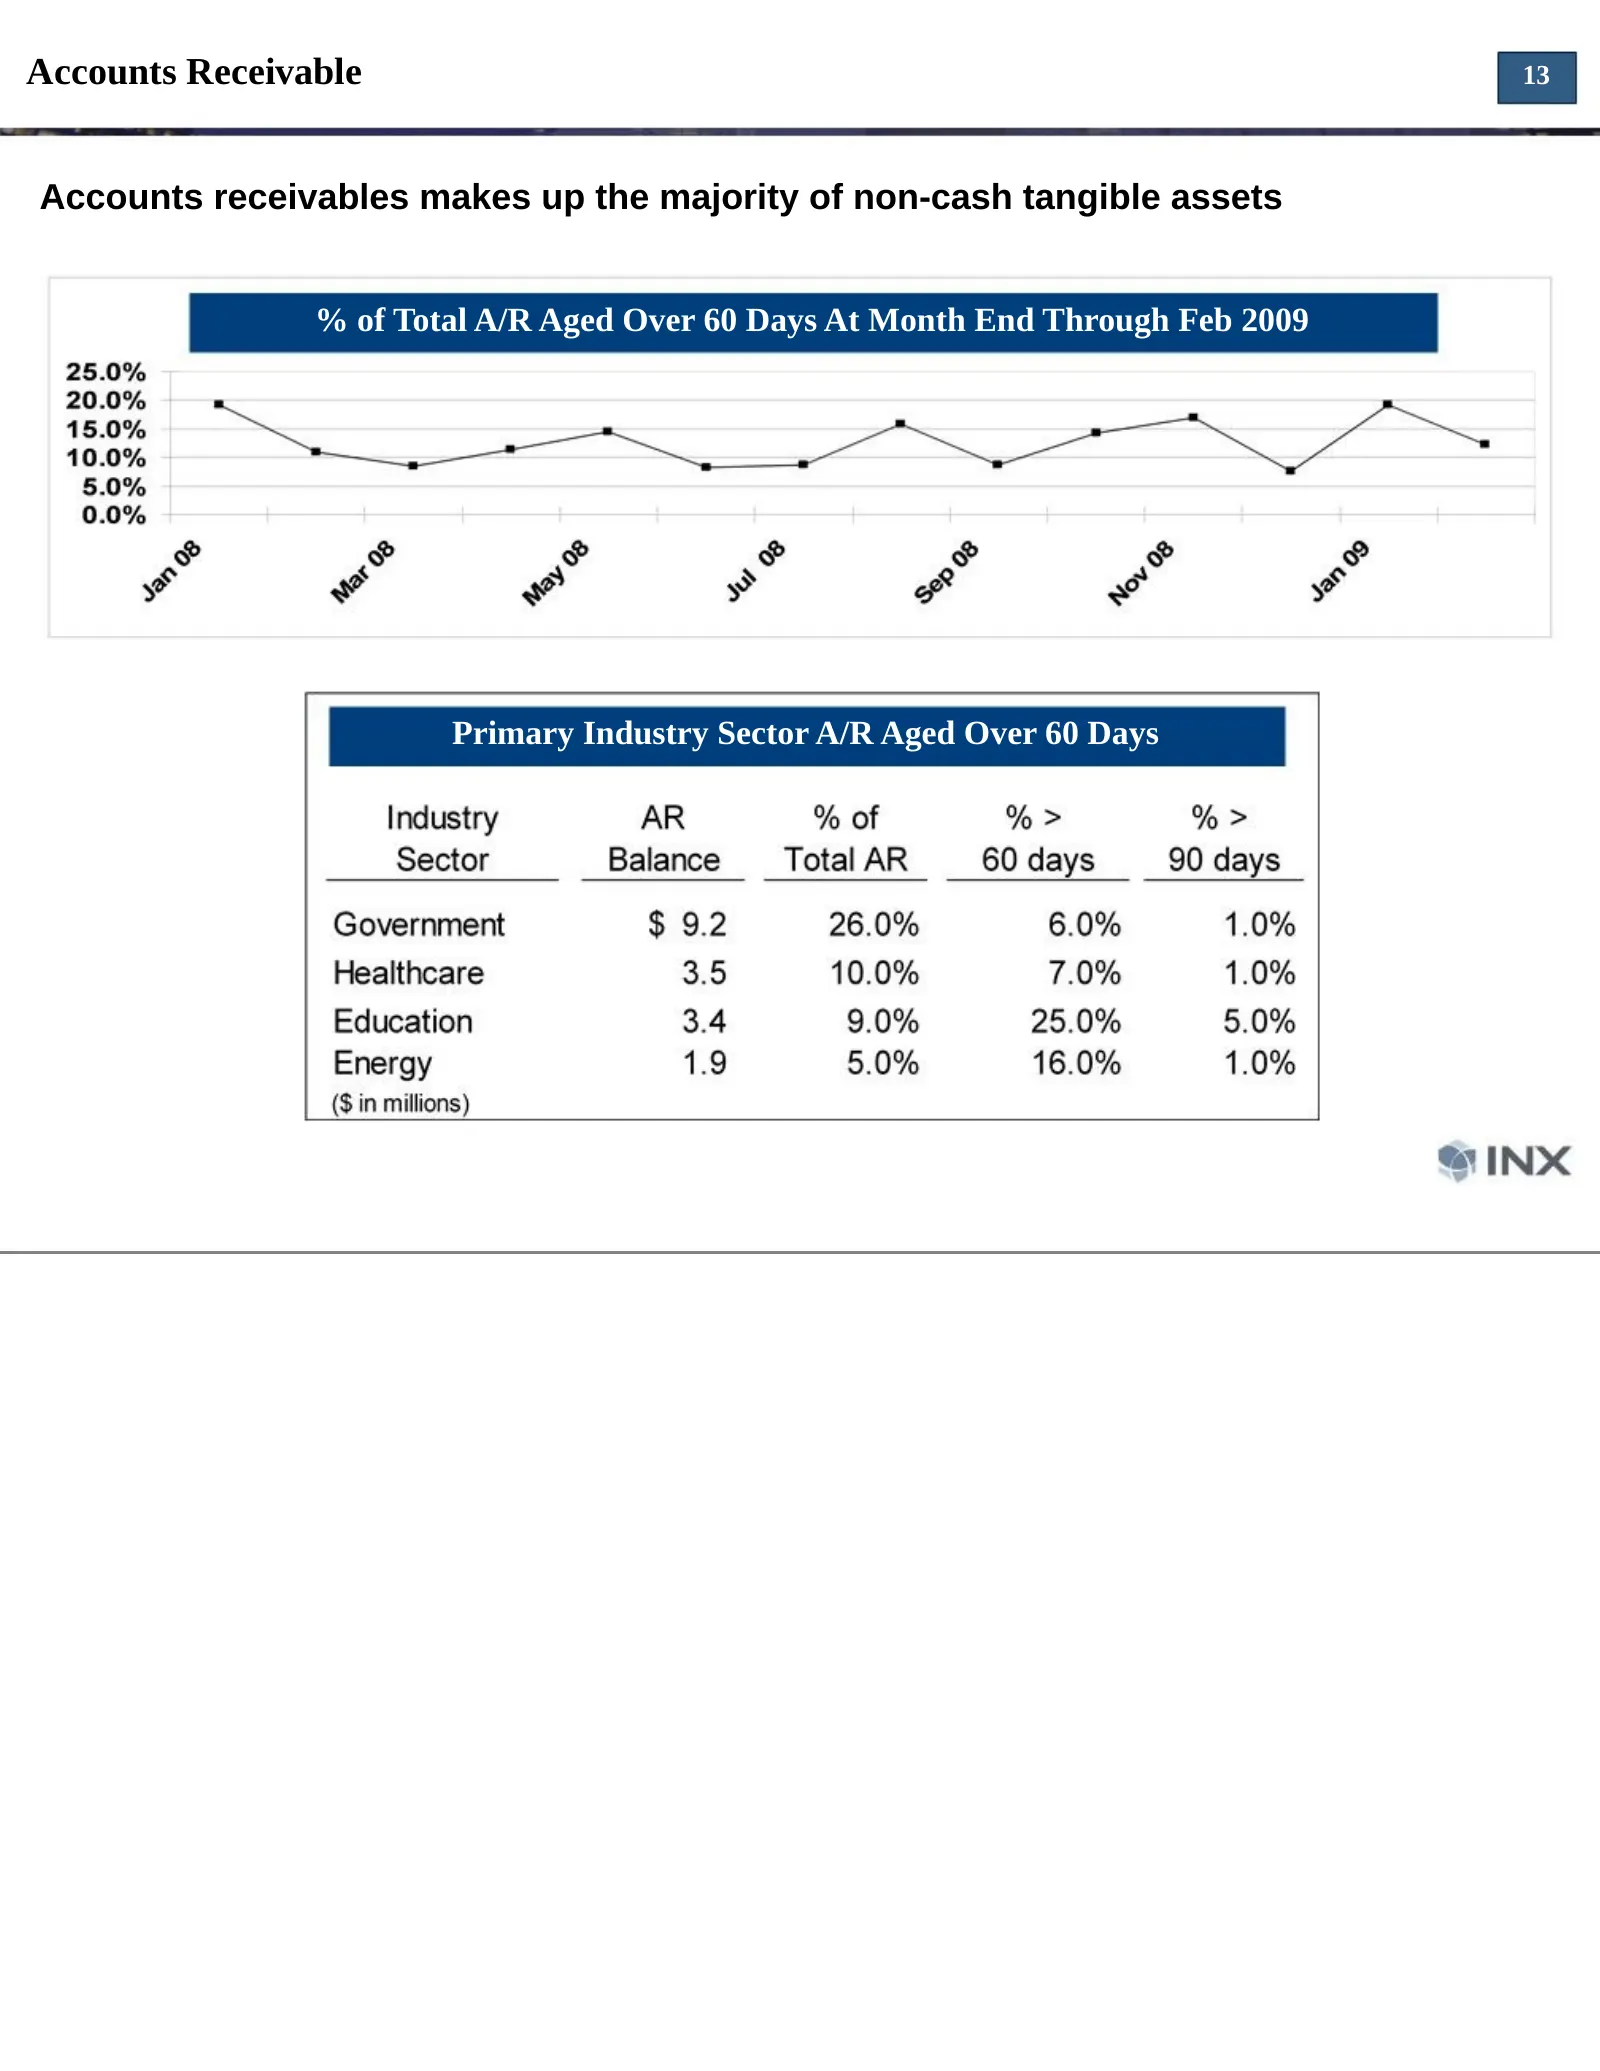
Accounts Receivable 13 Accounts receivables makes up the majority of non-cash tangible assets % of Total A/R Aged Over 60 Days At Month End Through Feb 2009 Primary Industry Sector A/R Aged Over 60 Days
Slide 14: Credit Availability and Liquidity
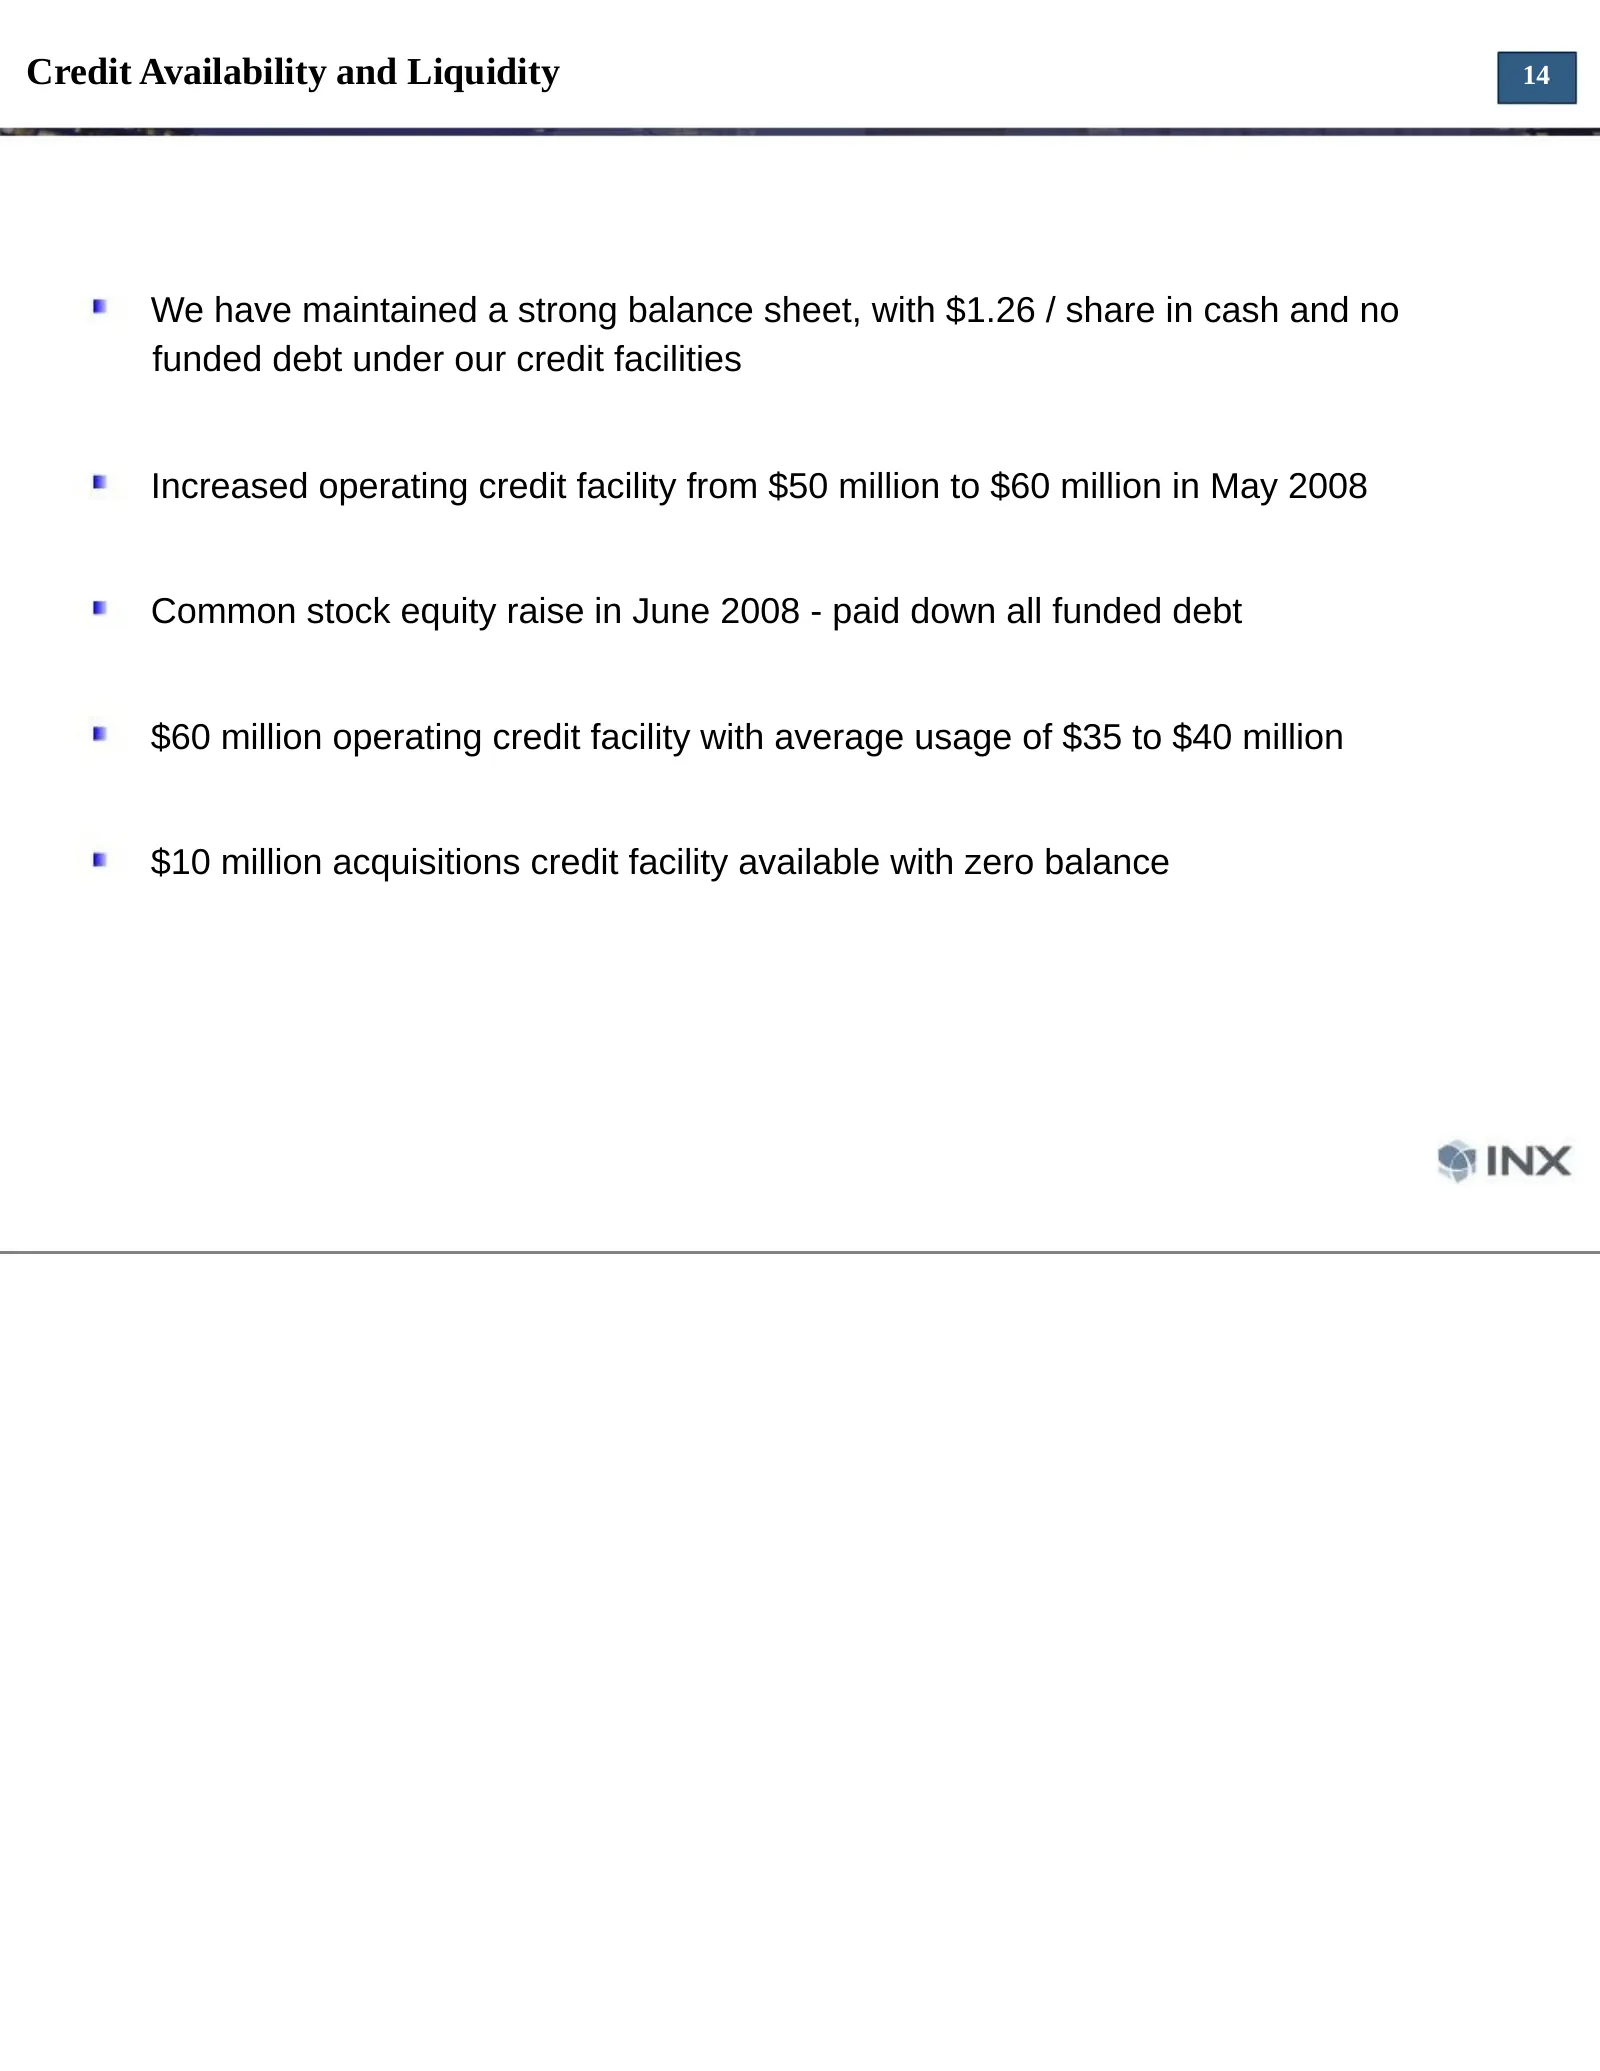
Credit Availability and Liquidity 14 We have maintained a strong balance sheet, with $1.26 / share in cash and no funded debt under our credit facilities Increased operating credit facility from $50 million to $60 million in May 2008 Common stock equity raise in June 2008 - paid down all funded debt
Slide 15: Current Market Conditions - Some Benchmarks
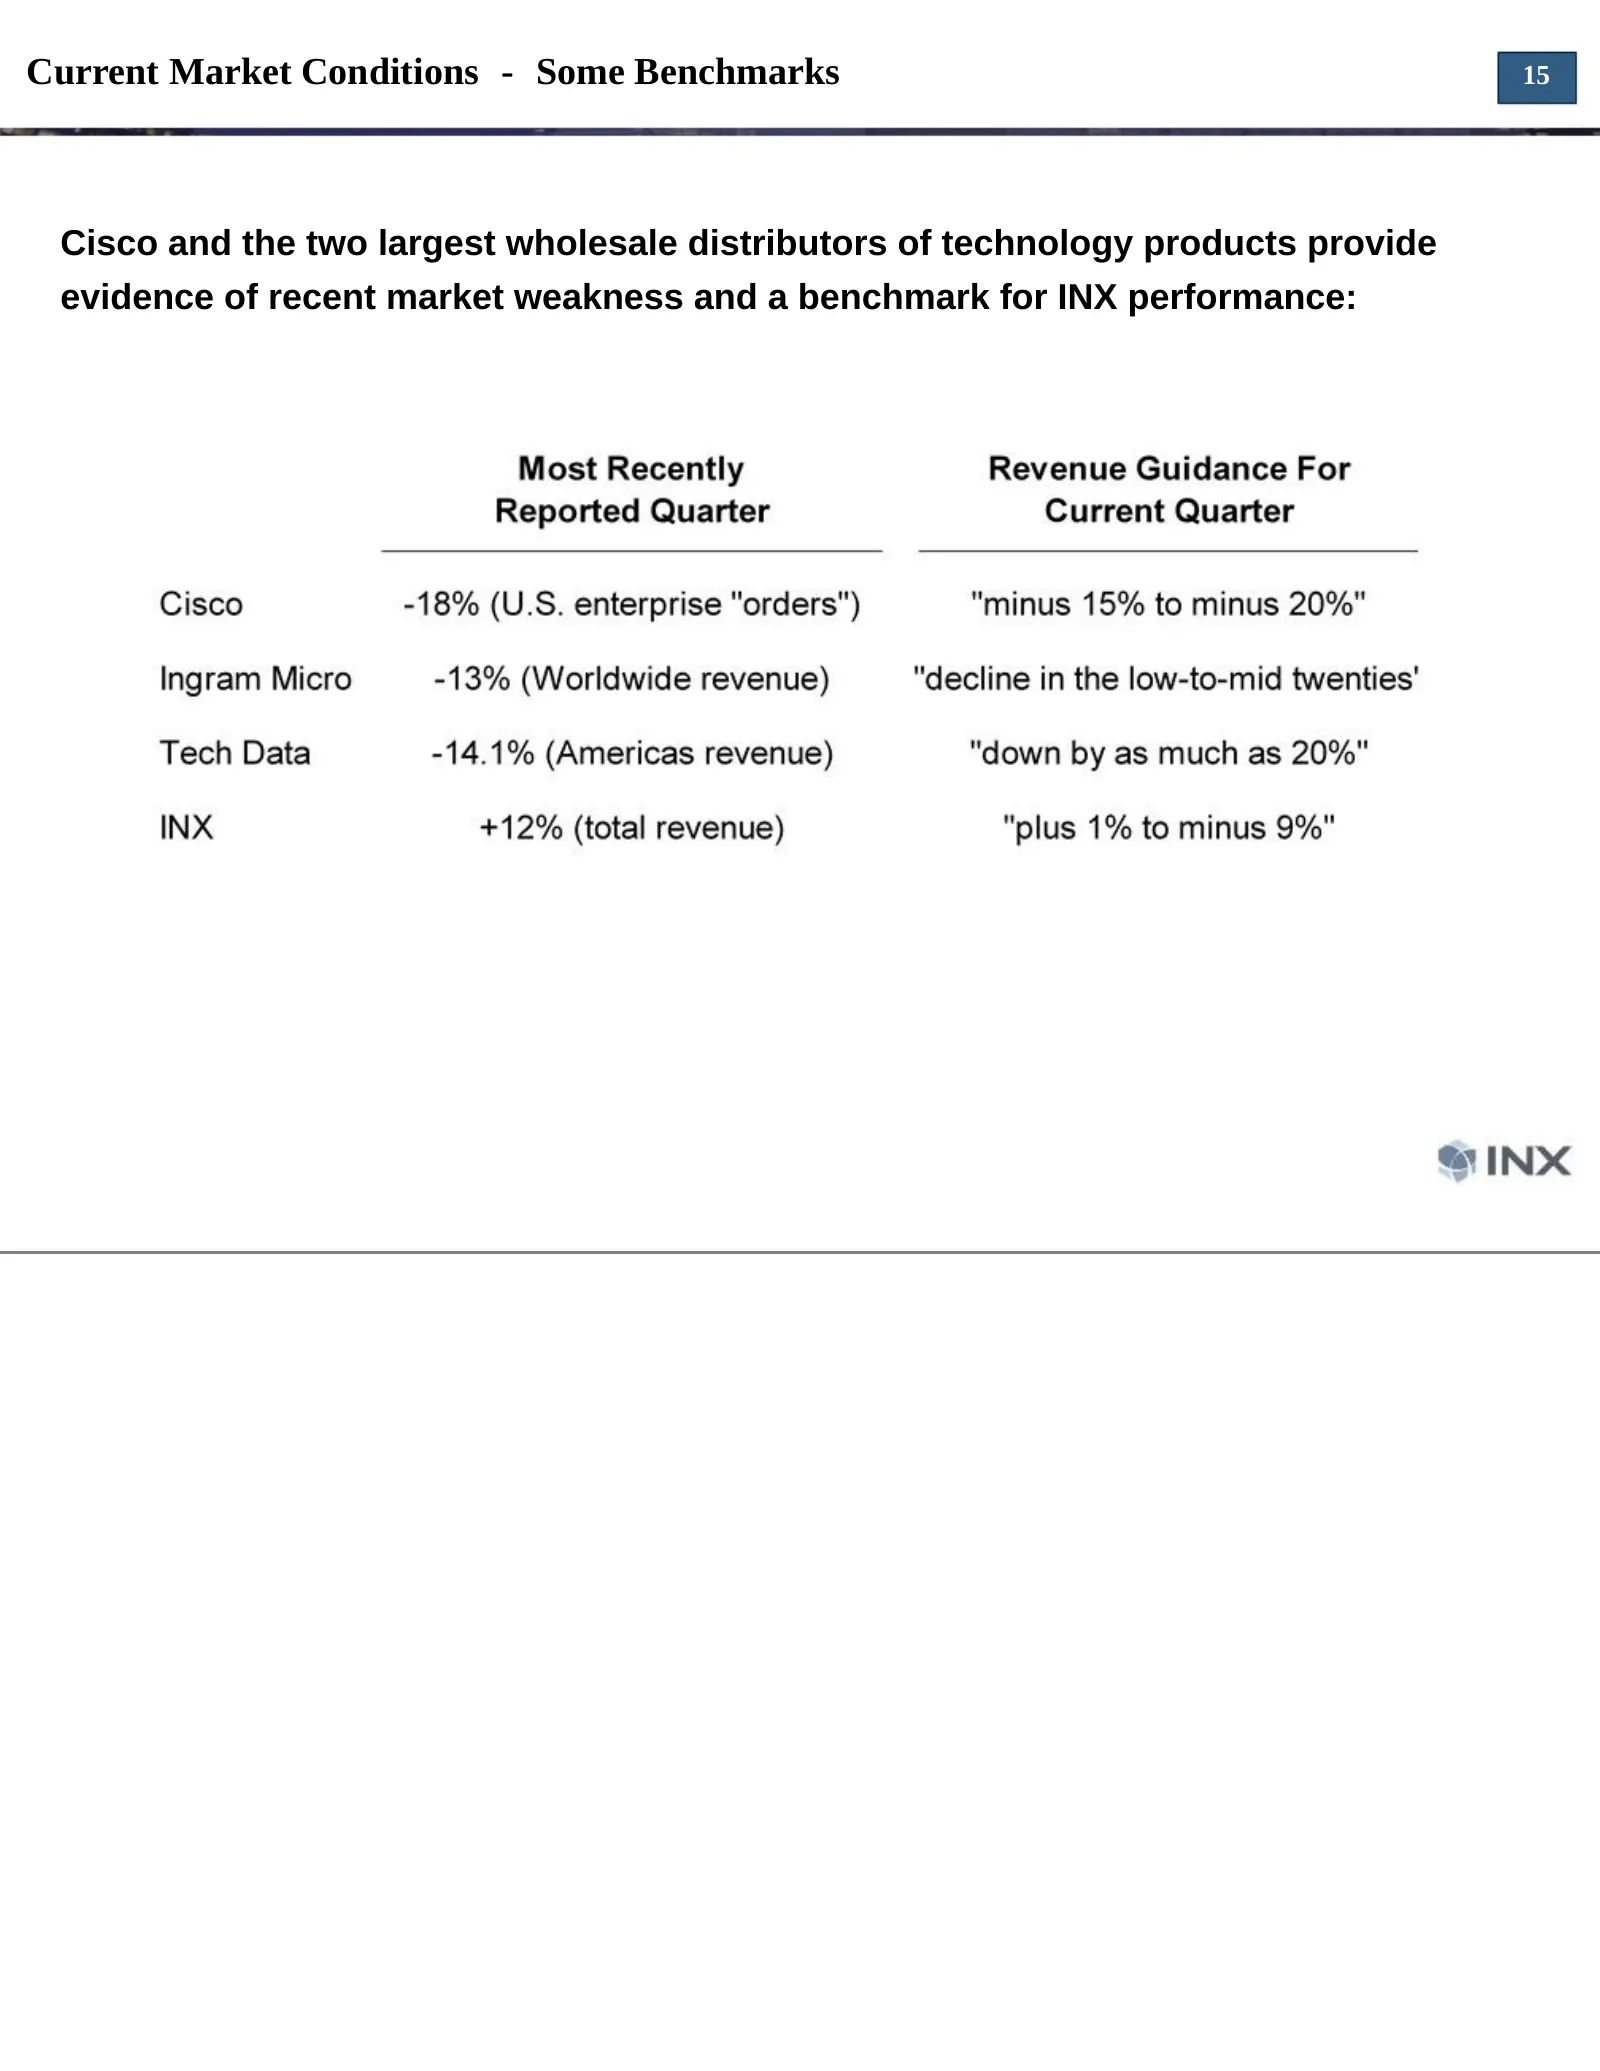
Current Market Conditions - Some Benchmarks 15 Cisco and the two largest wholesale distributors of technology products provide evidence of recent market weakness and a benchmark for INX performance:
Slide 16: Monthly Product Order/Contract Bookings
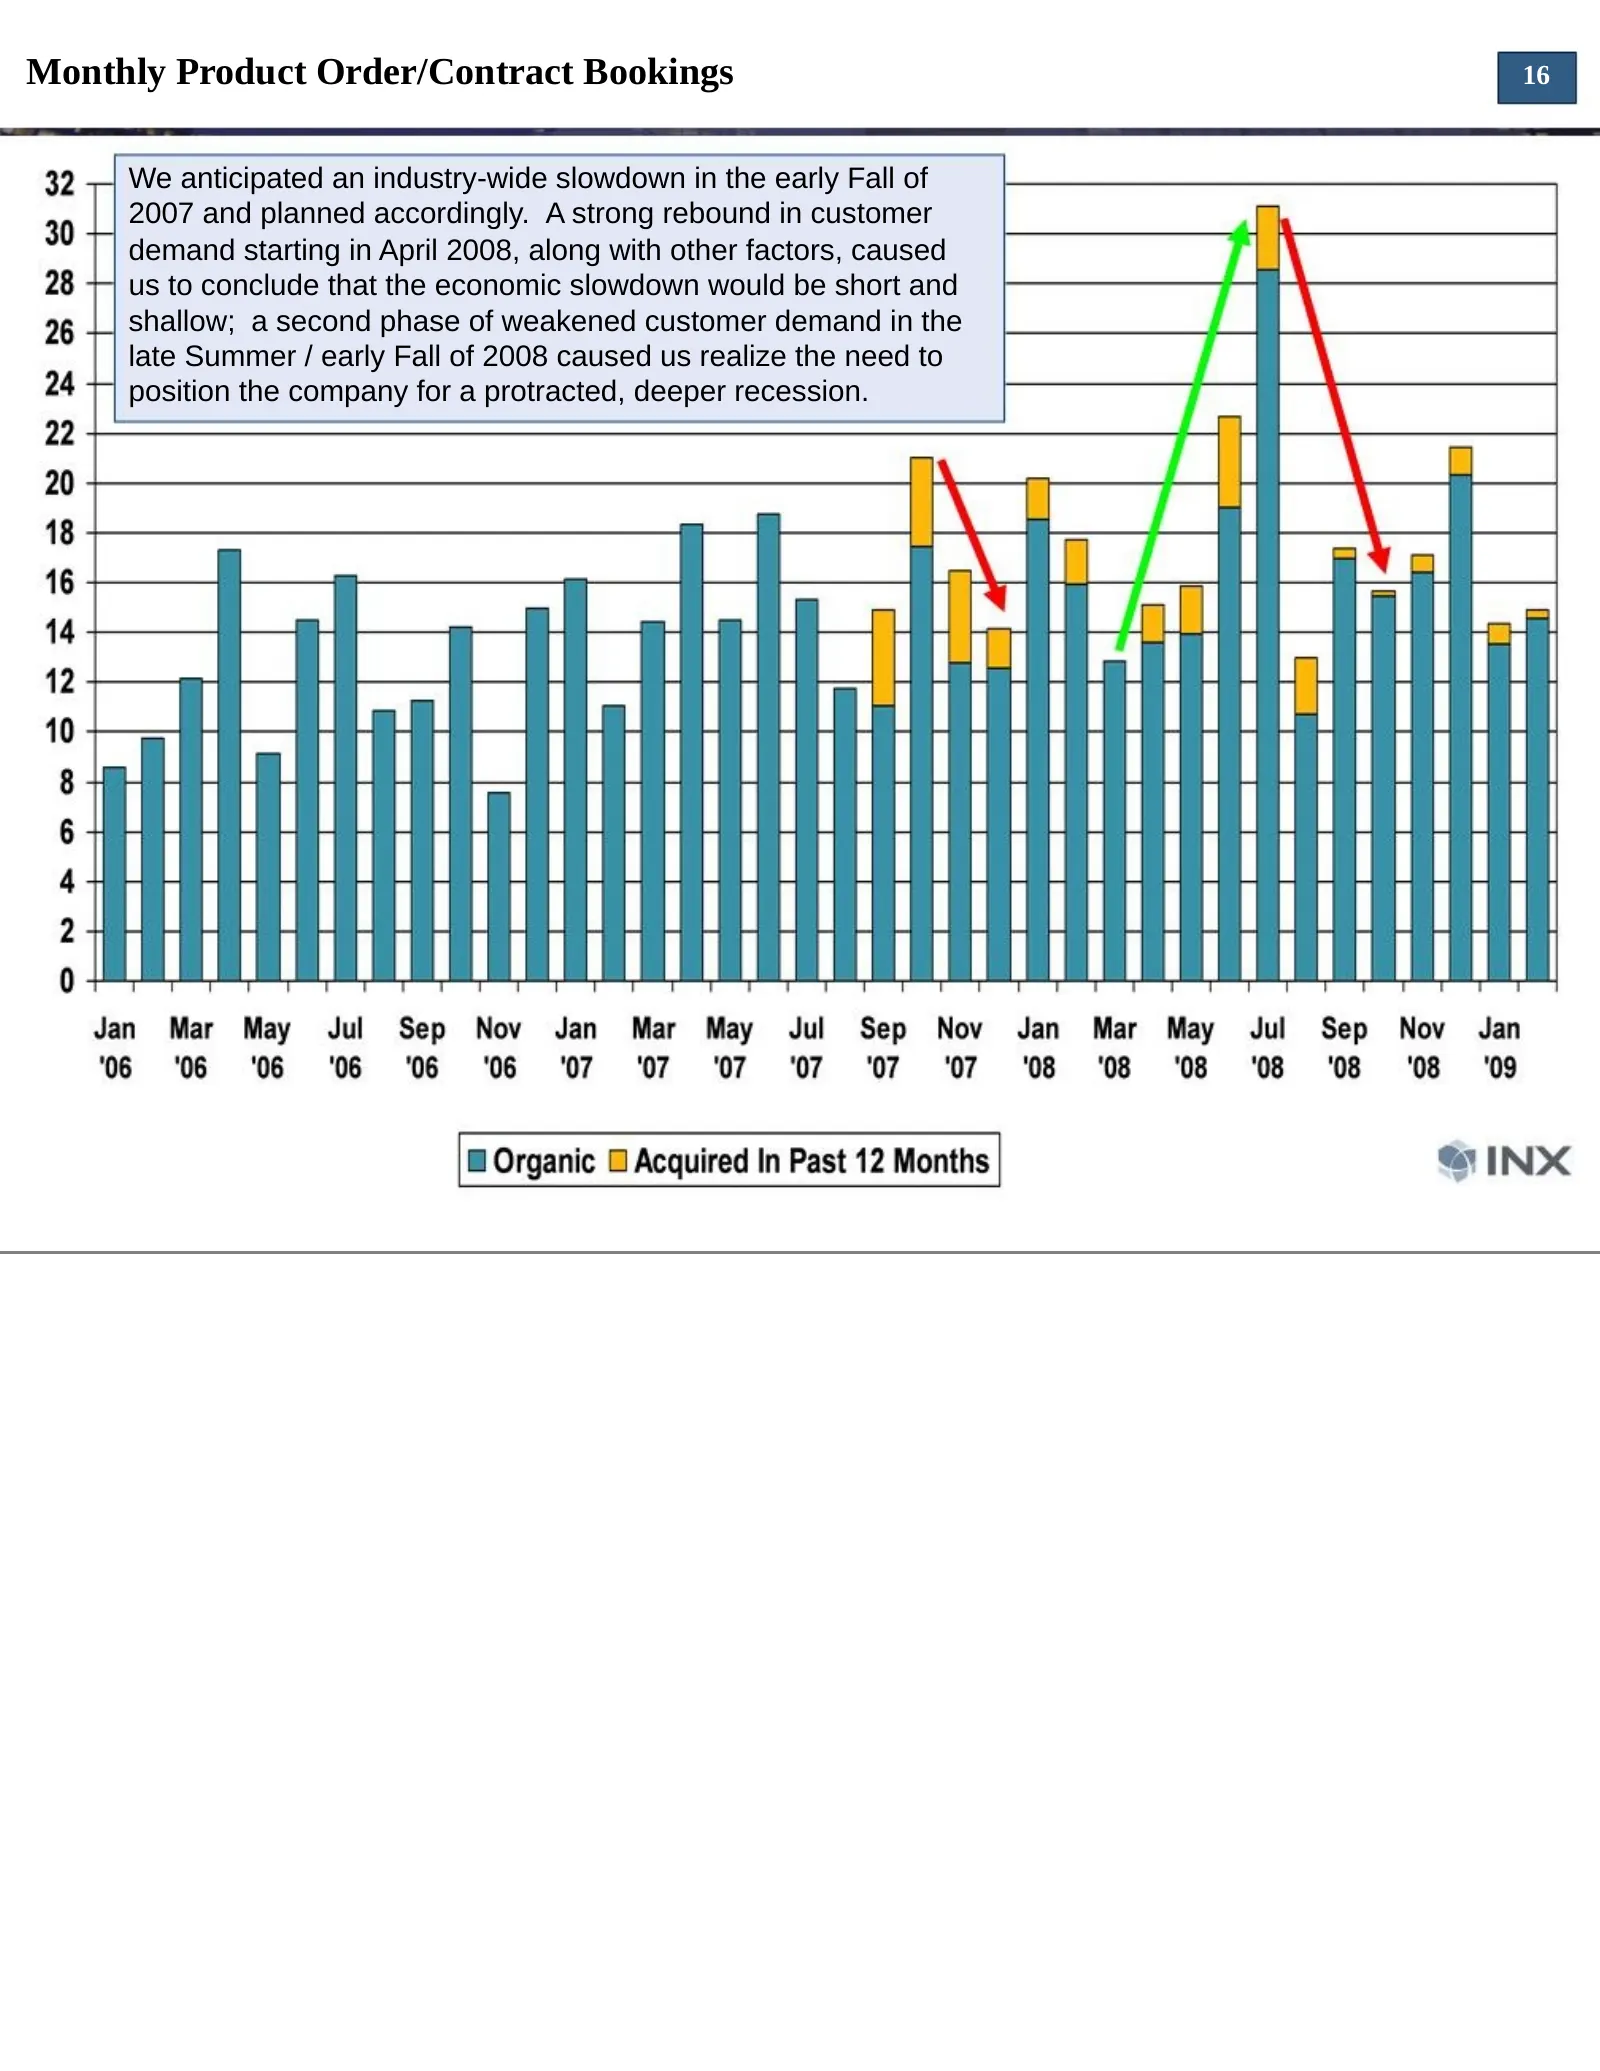
Monthly Product Order/Contract Bookings 16 We anticipated an industry-wide slowdown in the early Fall of 2007 and planned accordingly. A strong rebound in customer demand starting in April 2008, along with other factors, caused us to conclude that the economic slowdown would be short and shallow; a
Slide 17: Unusual Items In 4th Quarter Results
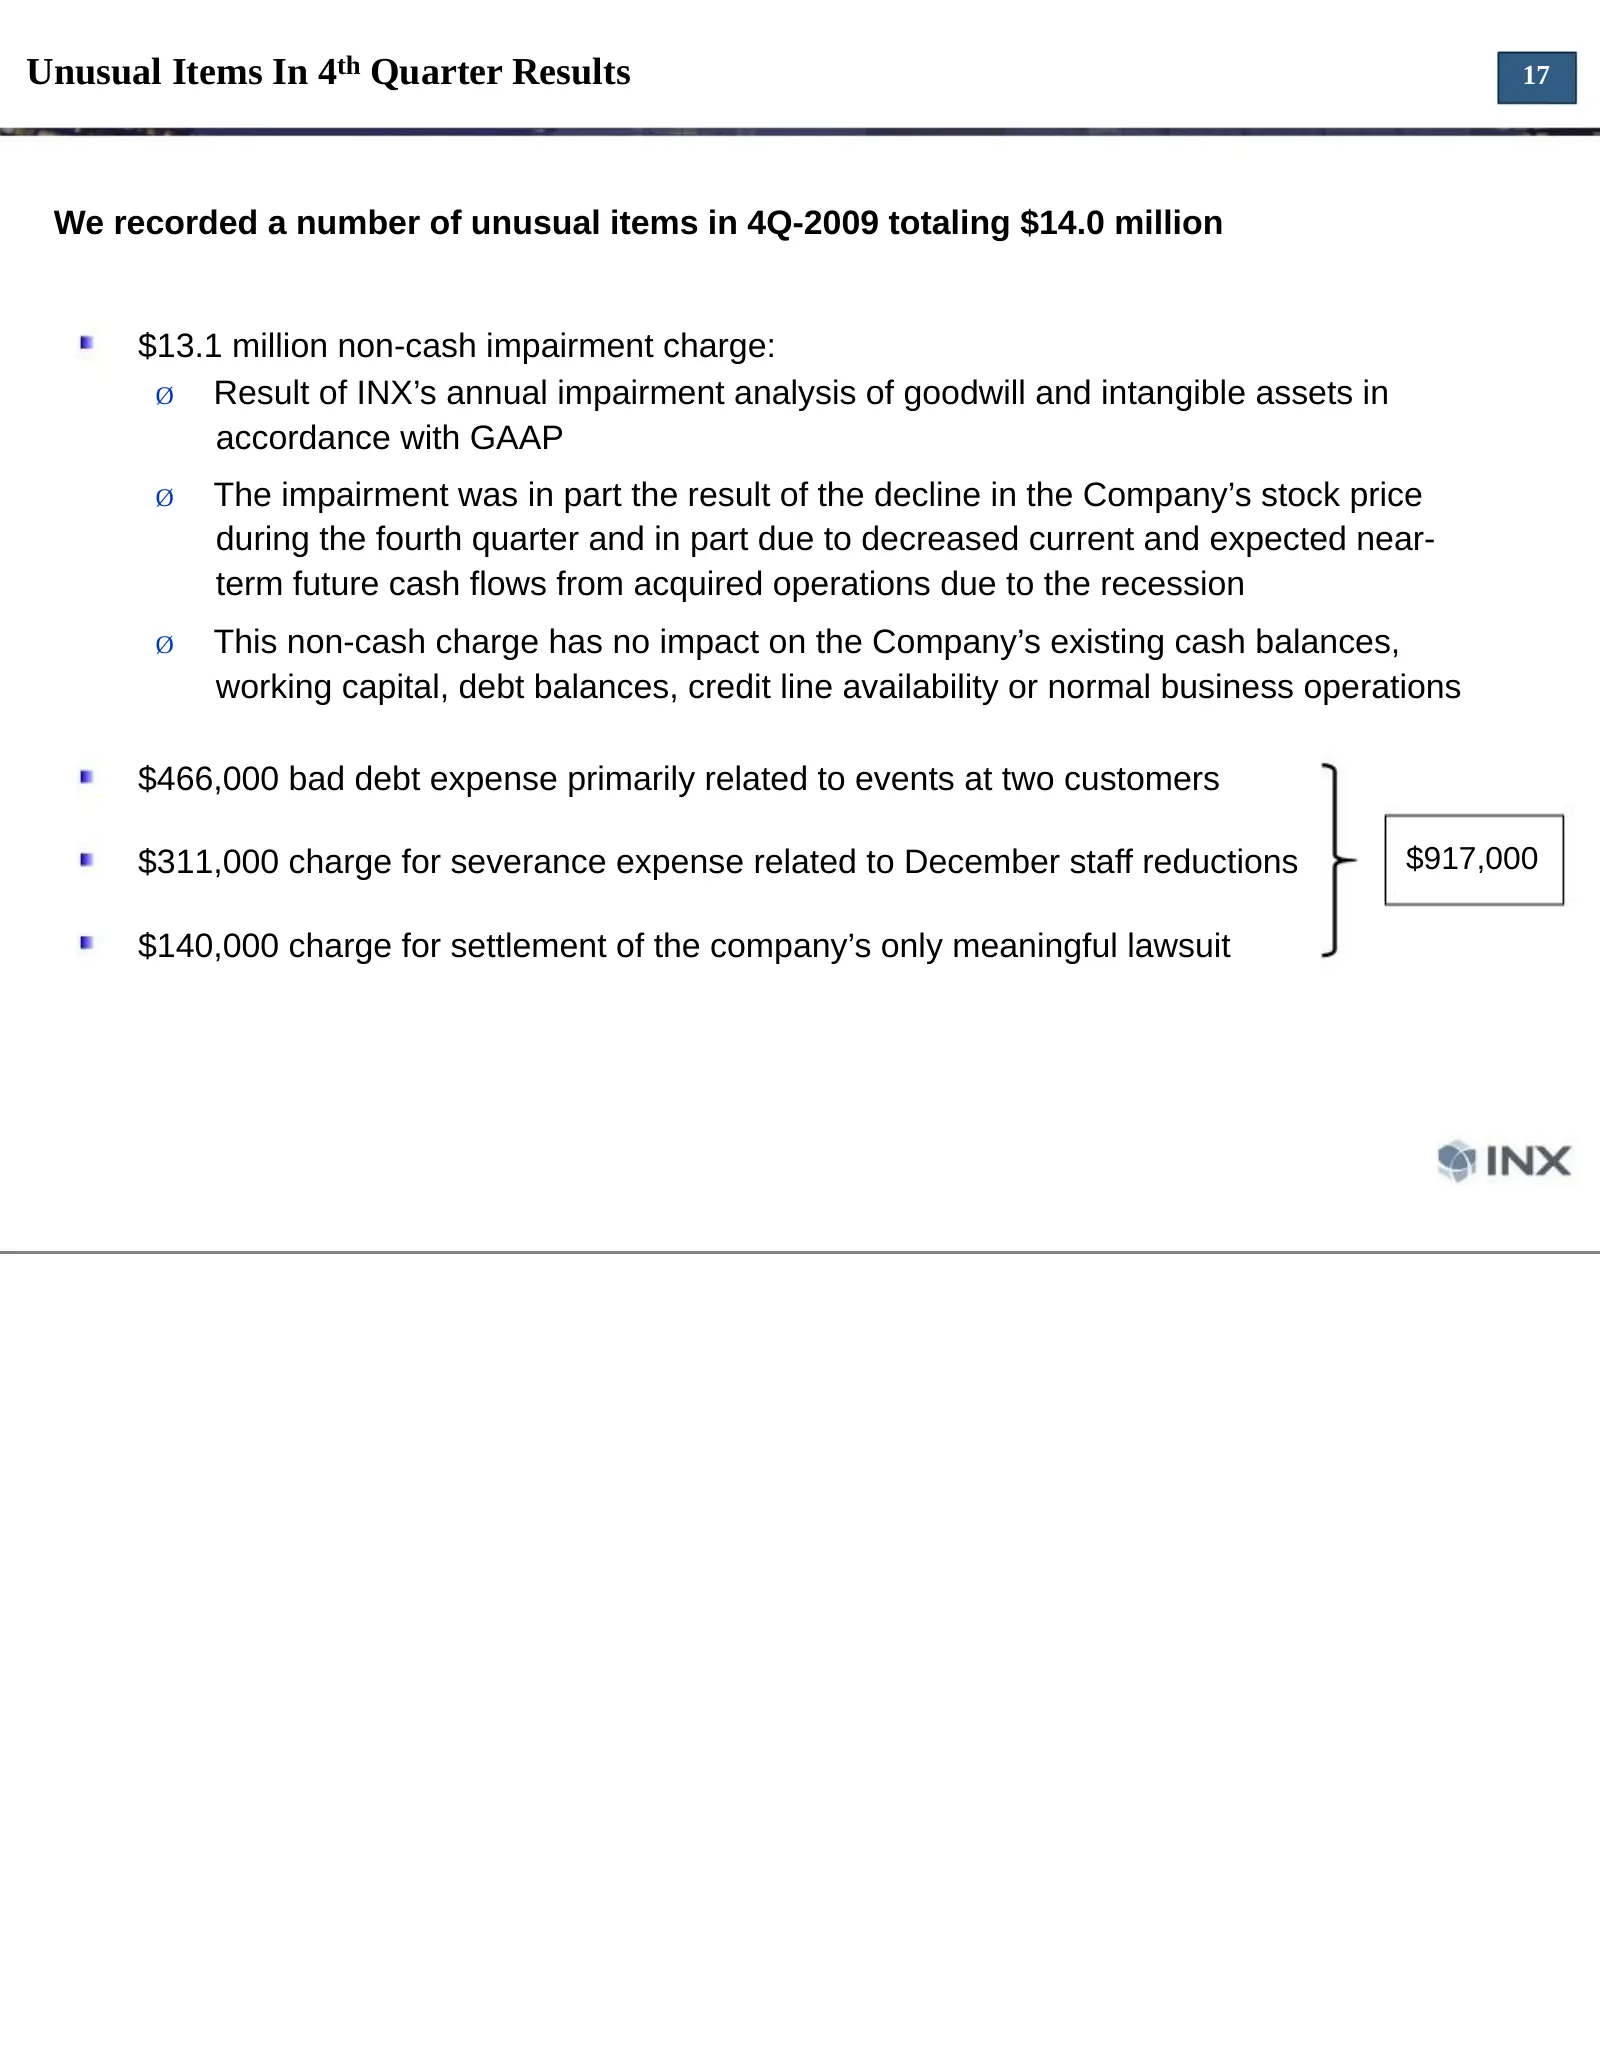
Unusual Items In 4th Quarter Results 17 We recorded a number of unusual items in 4Q-2009 totaling $14.0 million $13.1 million non-cash impairment charge: Ø Result of INX’s annual impairment analysis of goodwill and intangible assets in accordance with GAAP Ø The impairment was in part the result of
Slide 18: Non-GAAP Earnings Reconciliation
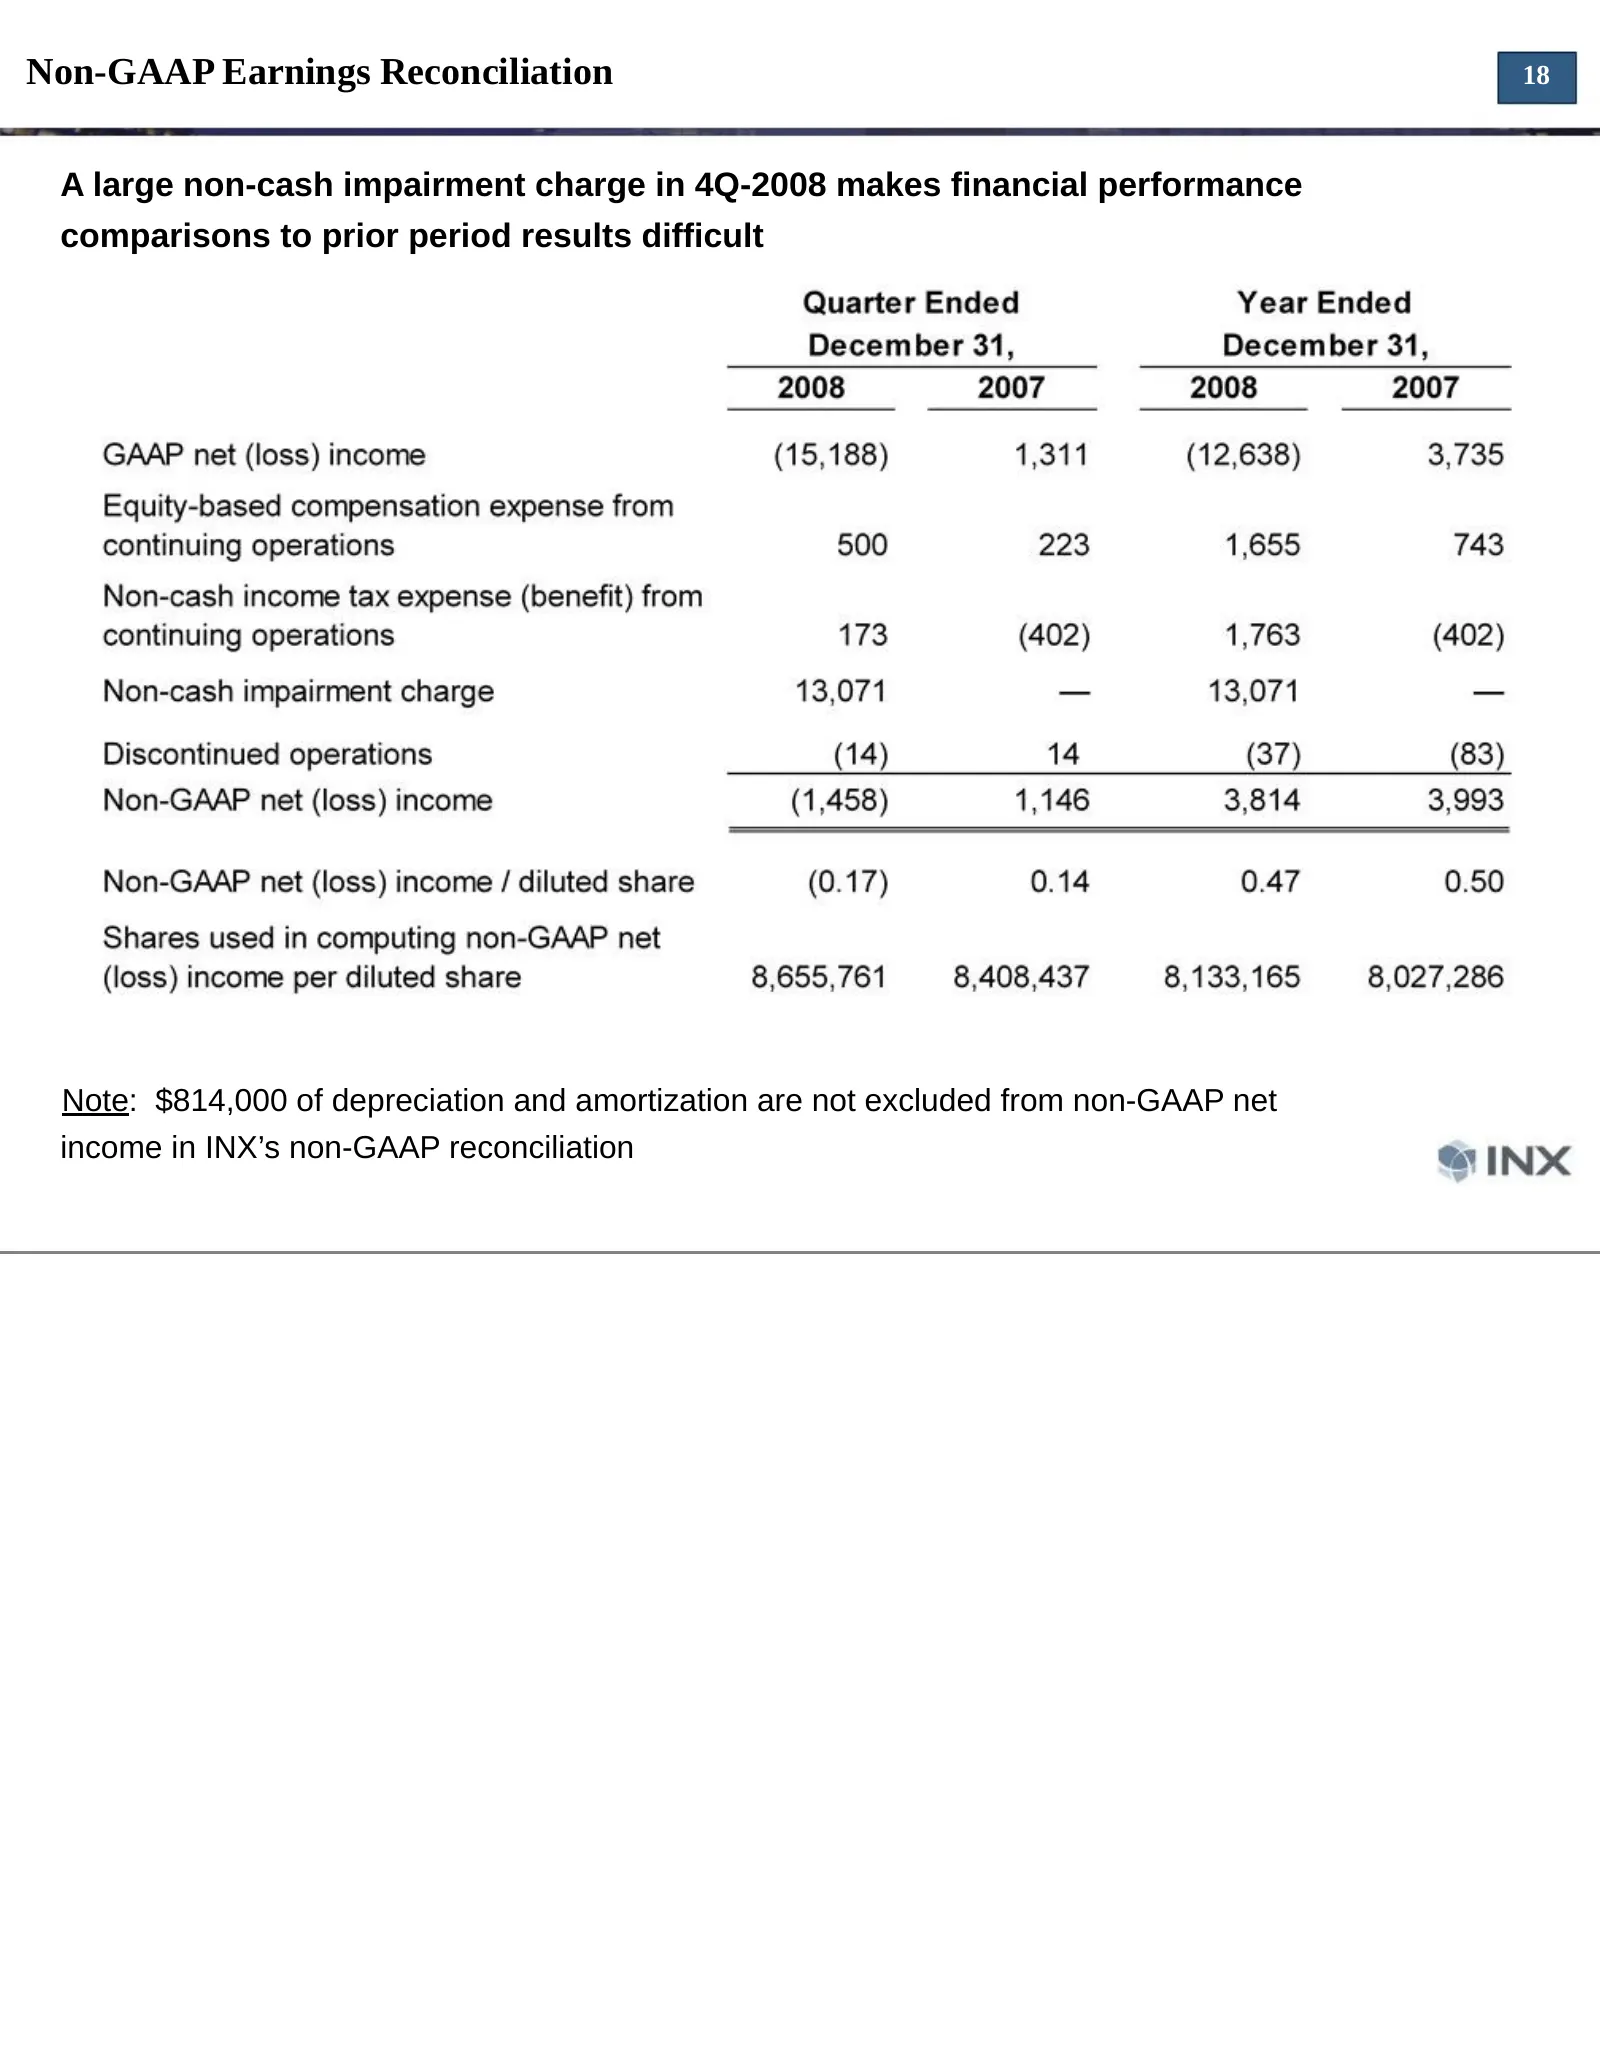
Non-GAAP Earnings Reconciliation 18 A large non-cash impairment charge in 4Q-2008 makes financial performance comparisons to prior period results difficult Note: $814,000 of depreciation and amortization are not excluded from non-GAAP net income in INX’s non-GAAP reconciliation
Slide 19: Fourth Quarter Results
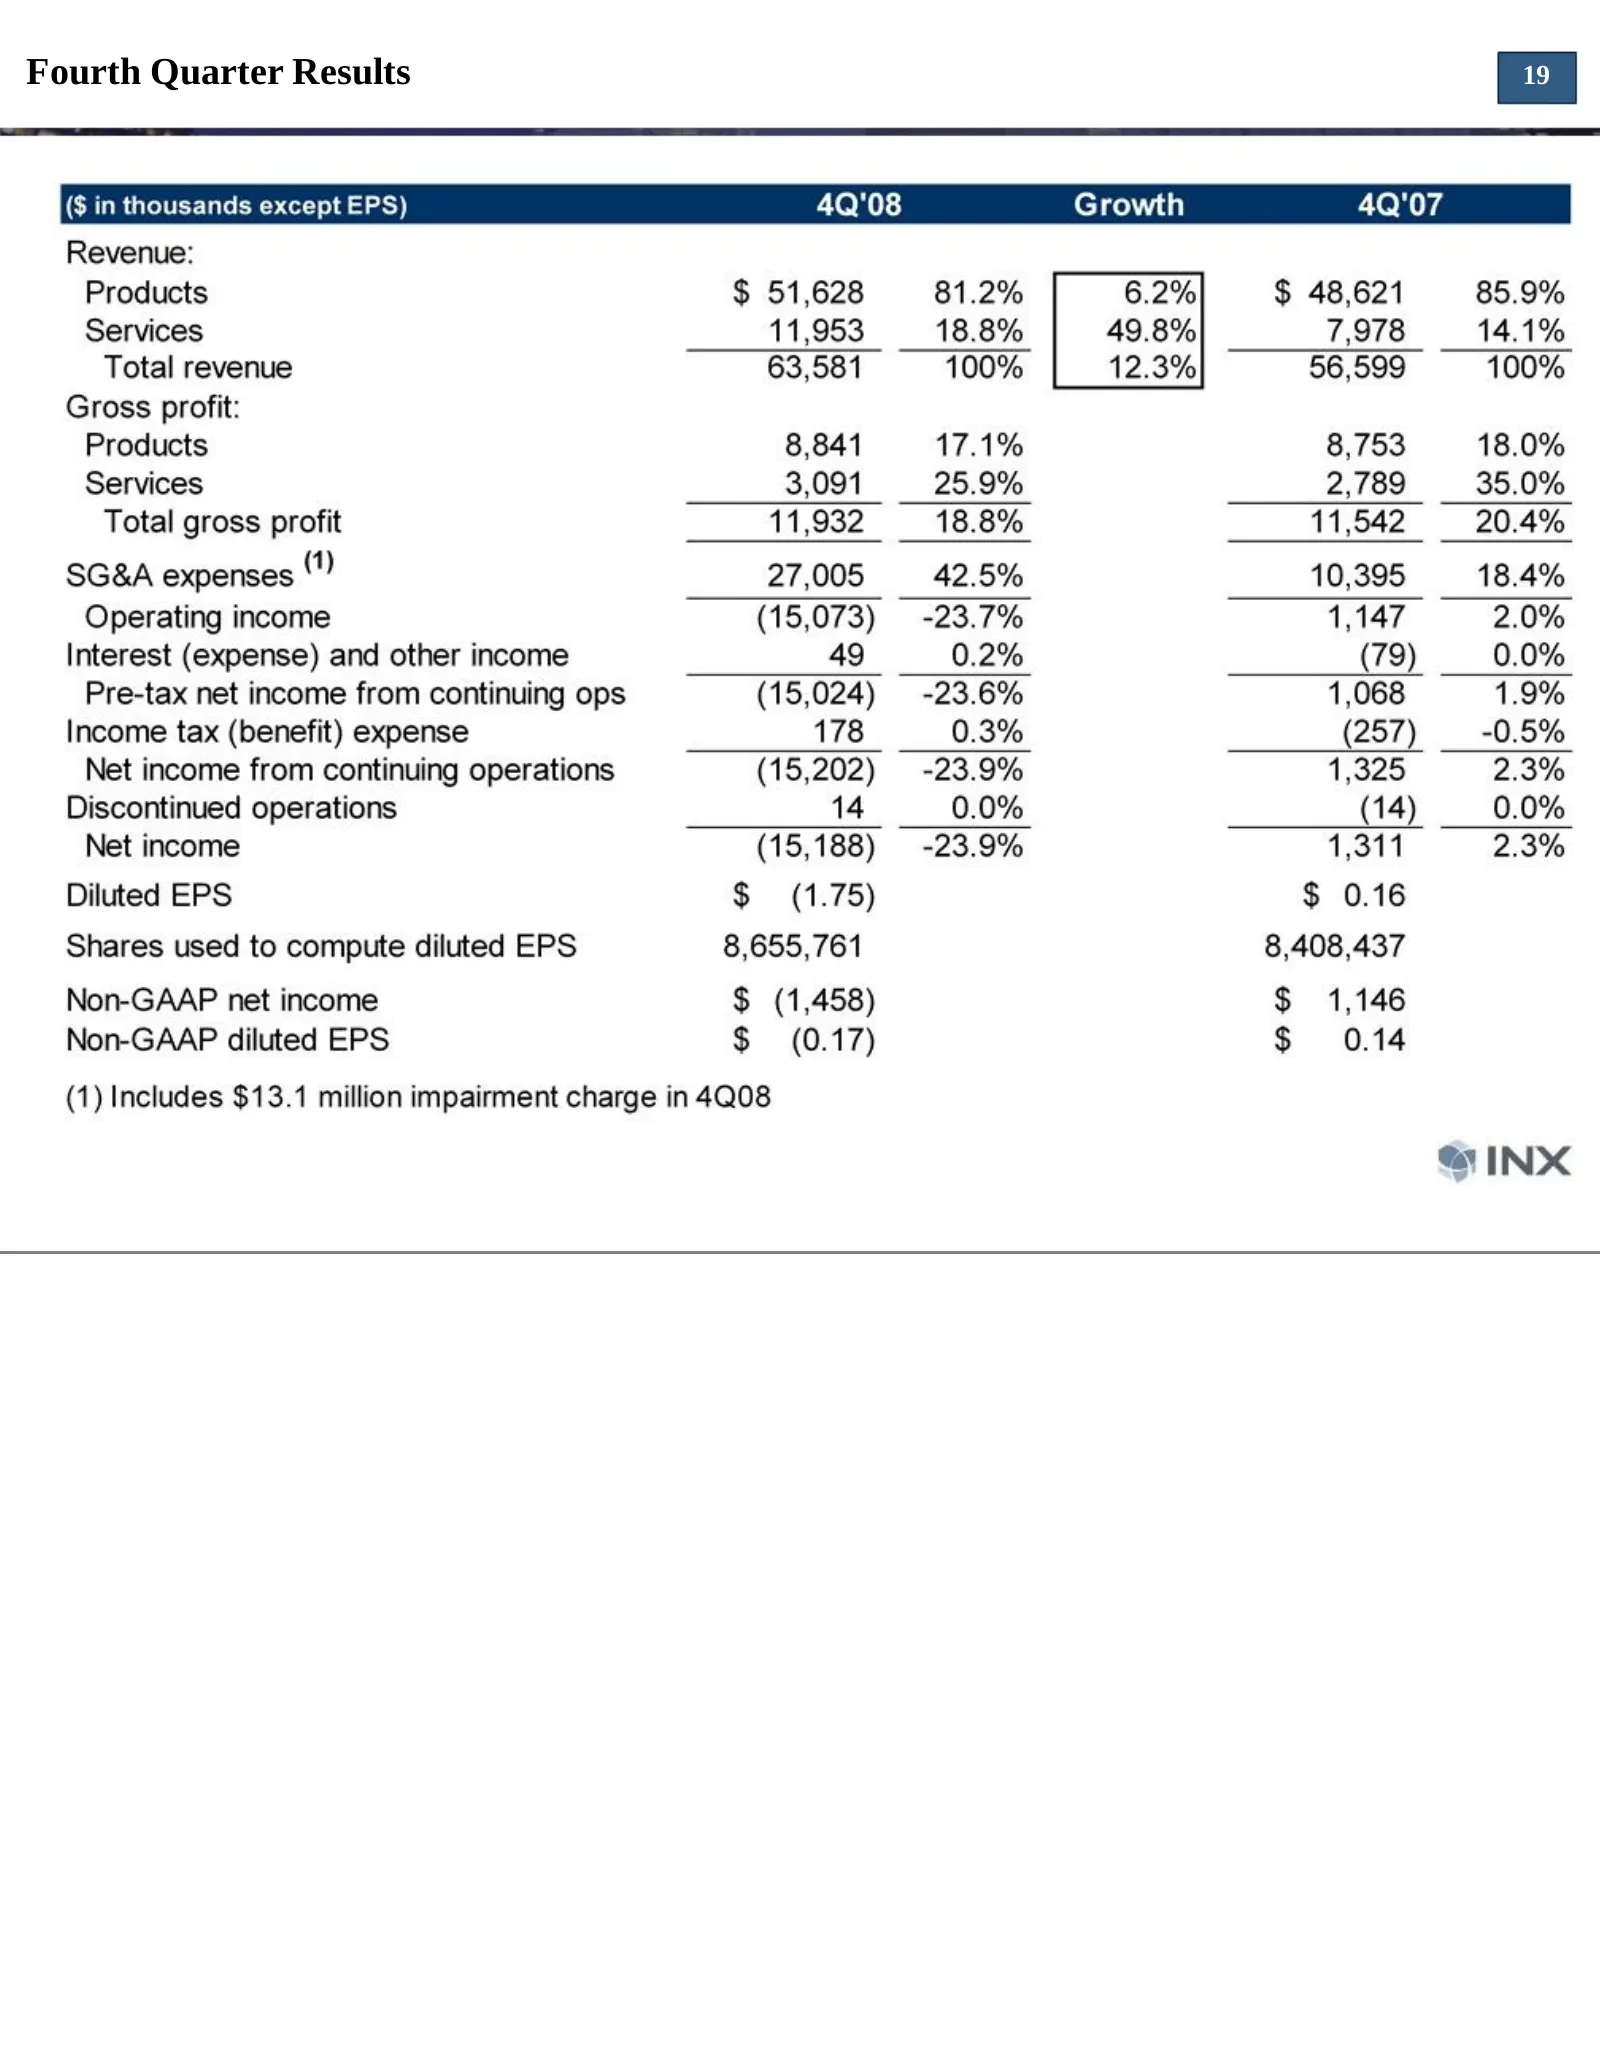
Fourth Quarter Results ($ in thousands except EPS) Revenue: Products Services Total revenue Gross profit: Products Services Total gross profit SG&A expenses (") Operating income Interest (expense) and other income Pre-tax net income from continuing ops Income tax (benefit) expense Net income from co
Slide 20: Year End 2008 Results
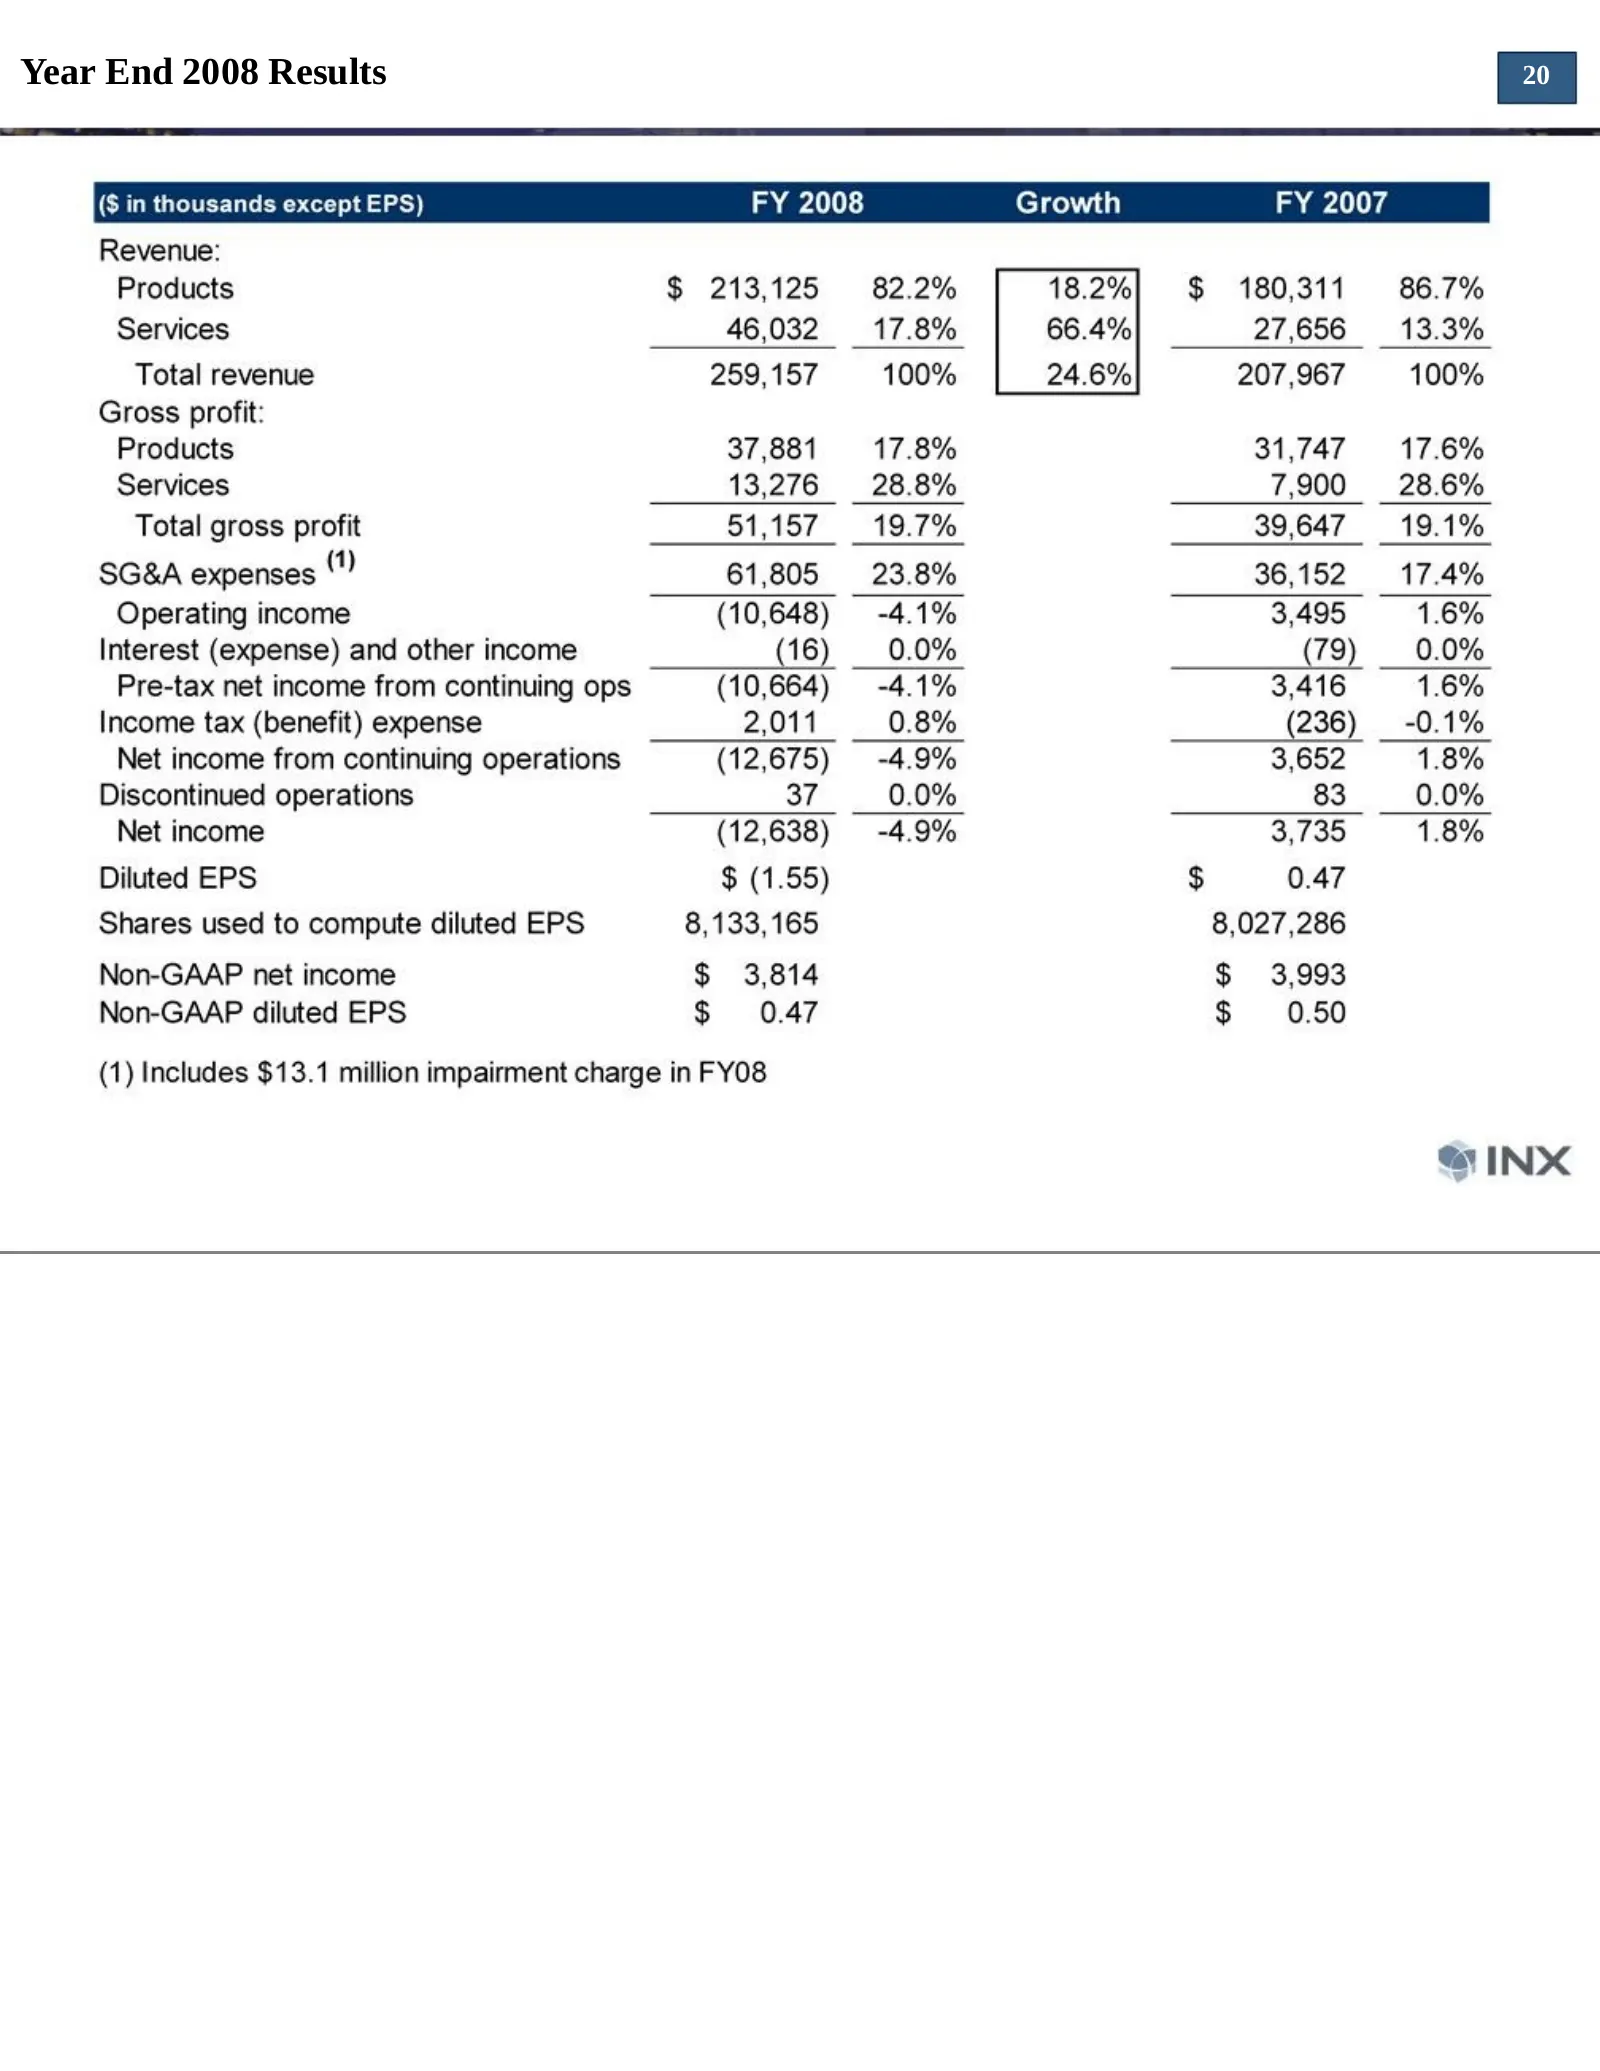
Year End 2008 Results ($ in thousands except EPS) FY 2008 Growth FY 2007 Revenue: Products $ 213,125 82.2% 18.2%] $ 180,311 86.7% Services 46,032 17.8% 66.4% 27,656 13.3% Total revenue 259,157 100% 24.6% 207,967 100% Gross profit: Products 37,881 17.8% 31,747 17.6% Services 13,276 28.8% 7,900 28.6%
Slide 21: Long-Term Progress On Improved Shareholder Value
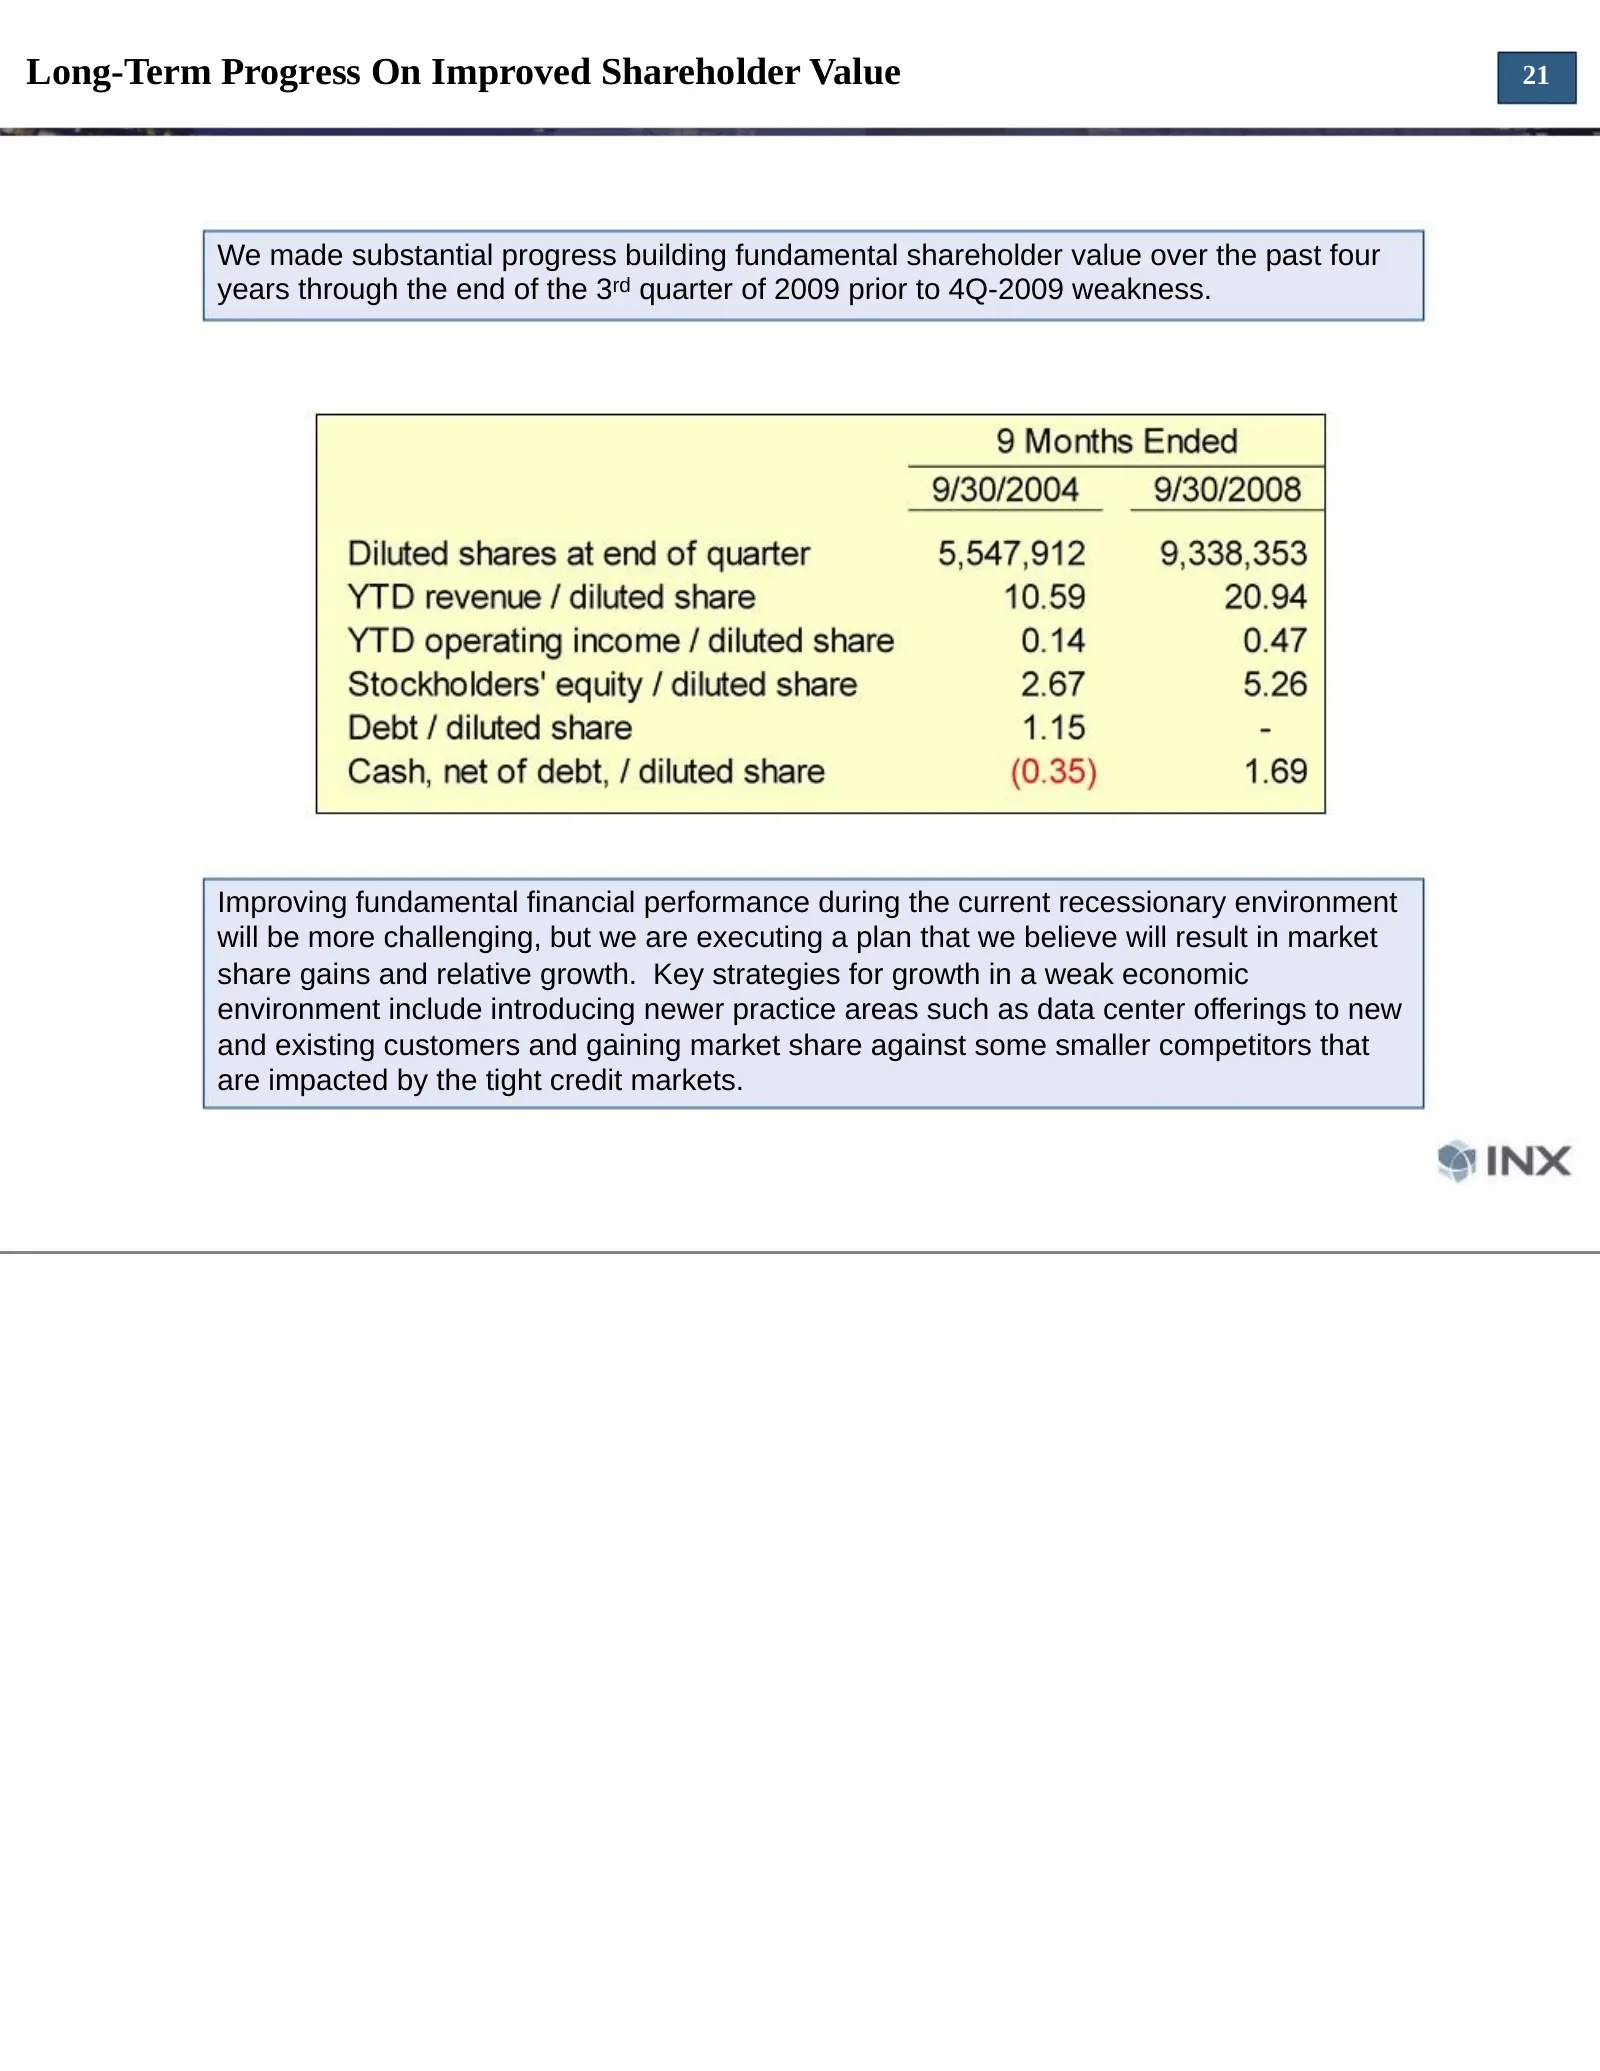
Long-Term Progress On Improved Shareholder Value 21 We made substantial progress building fundamental shareholder value over the past four years through the end of the 3rd quarter of 2009 prior to 4Q-2009 weakness. Improving fundamental financial performance during the current recessionary environme
Slide 22: There Are Reasons To Be Optimistic About INX's Long-Term Prospects
There Are Reasons To Be Optimistic About INX’s Long-Term Prospects 22 In Spite Of The Current Recession INX is focused on delivering some of the best areas of technology, from a growth perspective Network security issues will continue unabated, irrespective of economic conditions, and spending is of
Slide 23: How We Are Addressing The Current Economic Recession
How We Are Addressing The Current Economic Recession 23 We are operating the company with an expectation that customer demand will remain soft for at least the first half of 2009, and more likely through 2009 or even longer Faced with an inability to forecast when economic activity and customer dema
Slide 24: Customer Categories and Mix
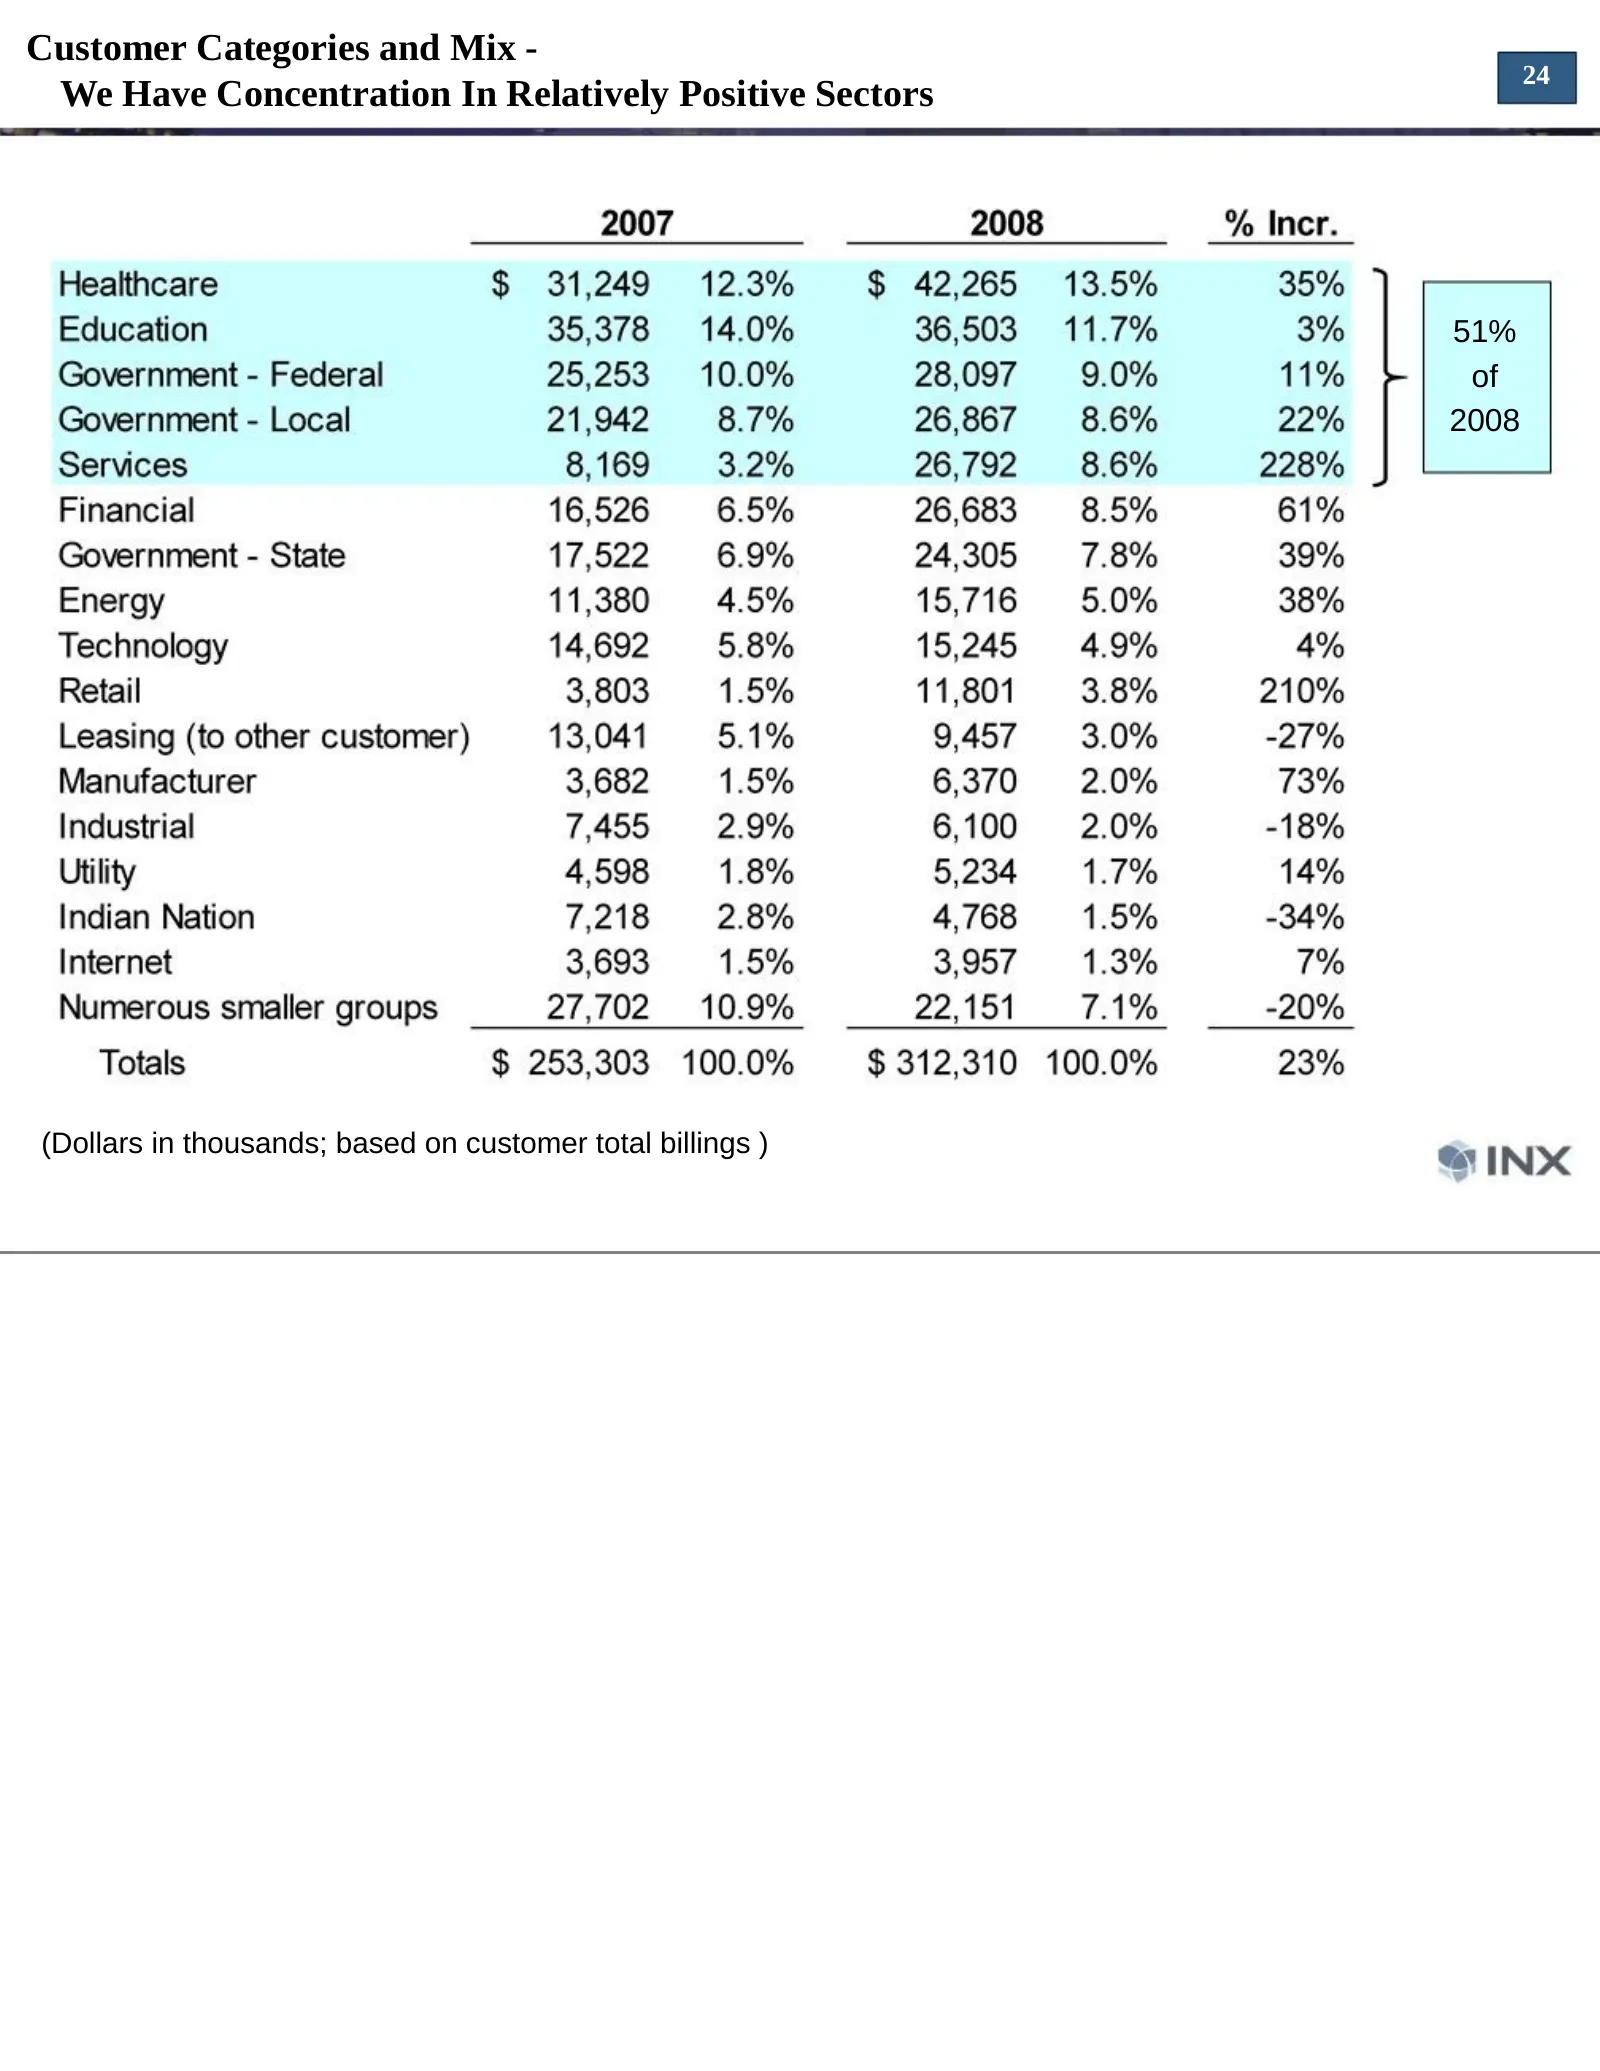
Customer Categories and Mix - 24 We Have Concentration In Relatively Positive Sectors 51% of 2008 (Dollars in thousands; based on customer total billings )
Slide 25: Staffing Trends - Key To Both Growth and Improving Margins
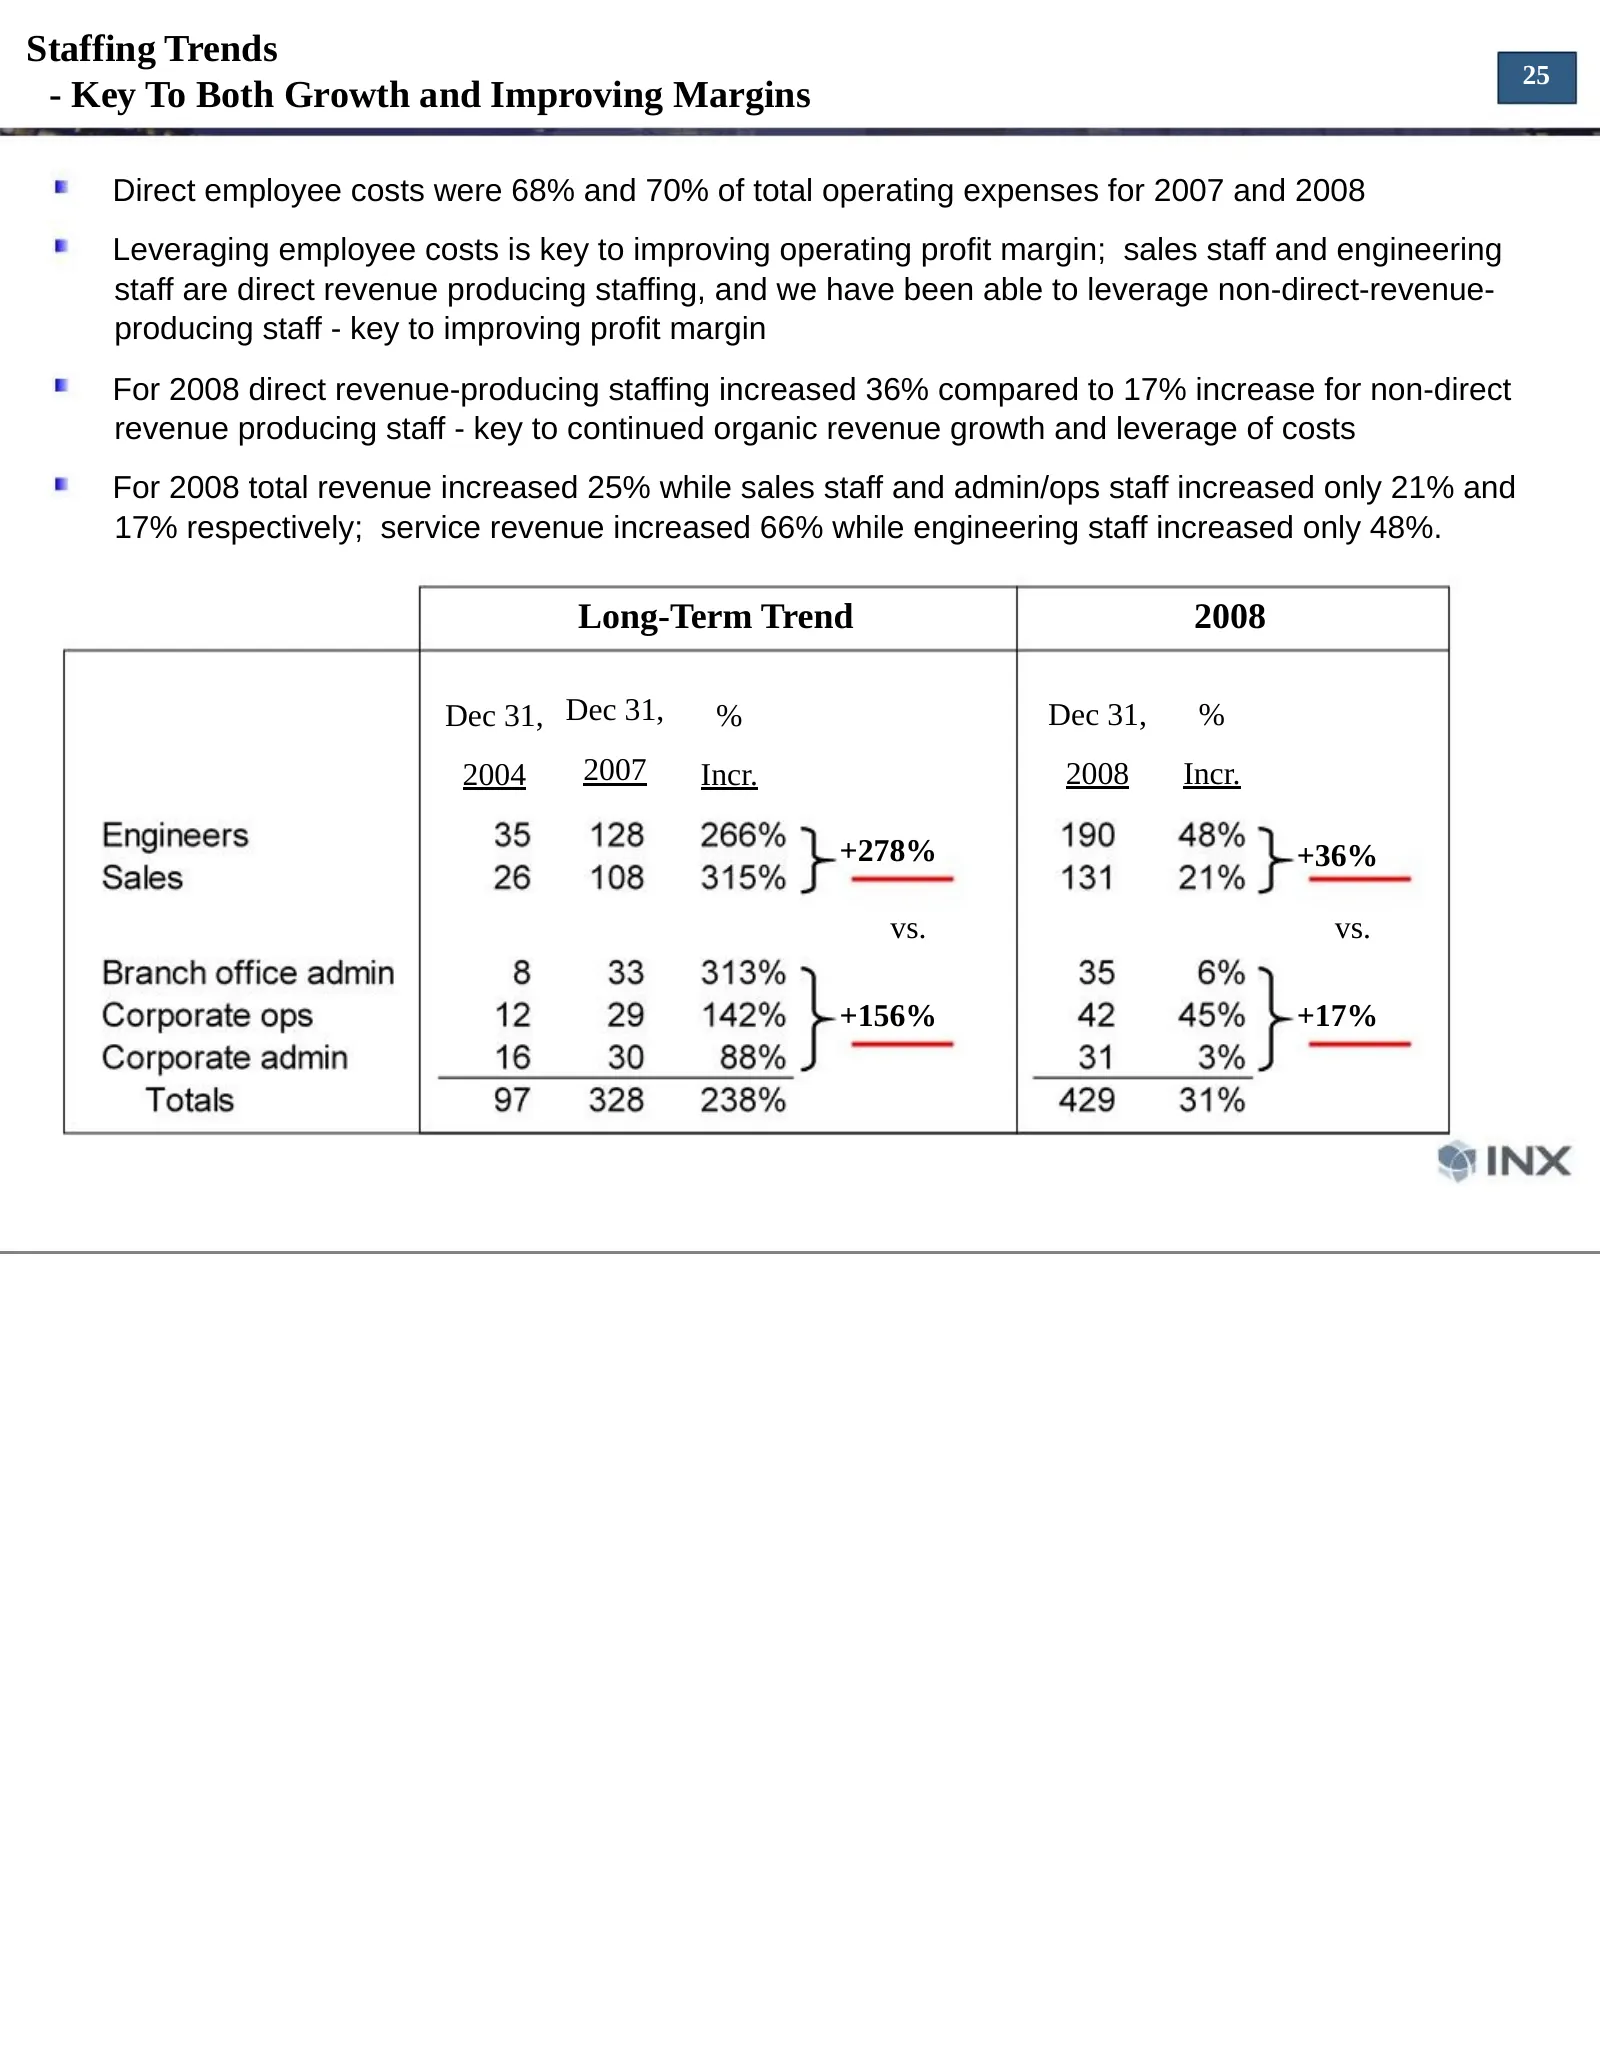
Staffing Trends 25 - Key To Both Growth and Improving Margins Direct employee costs were 68% and 70% of total operating expenses for 2007 and 2008 Leveraging employee costs is key to improving operating profit margin; sales staff and engineering staff are direct revenue producing staffing, and we ha
Slide 26: Summary
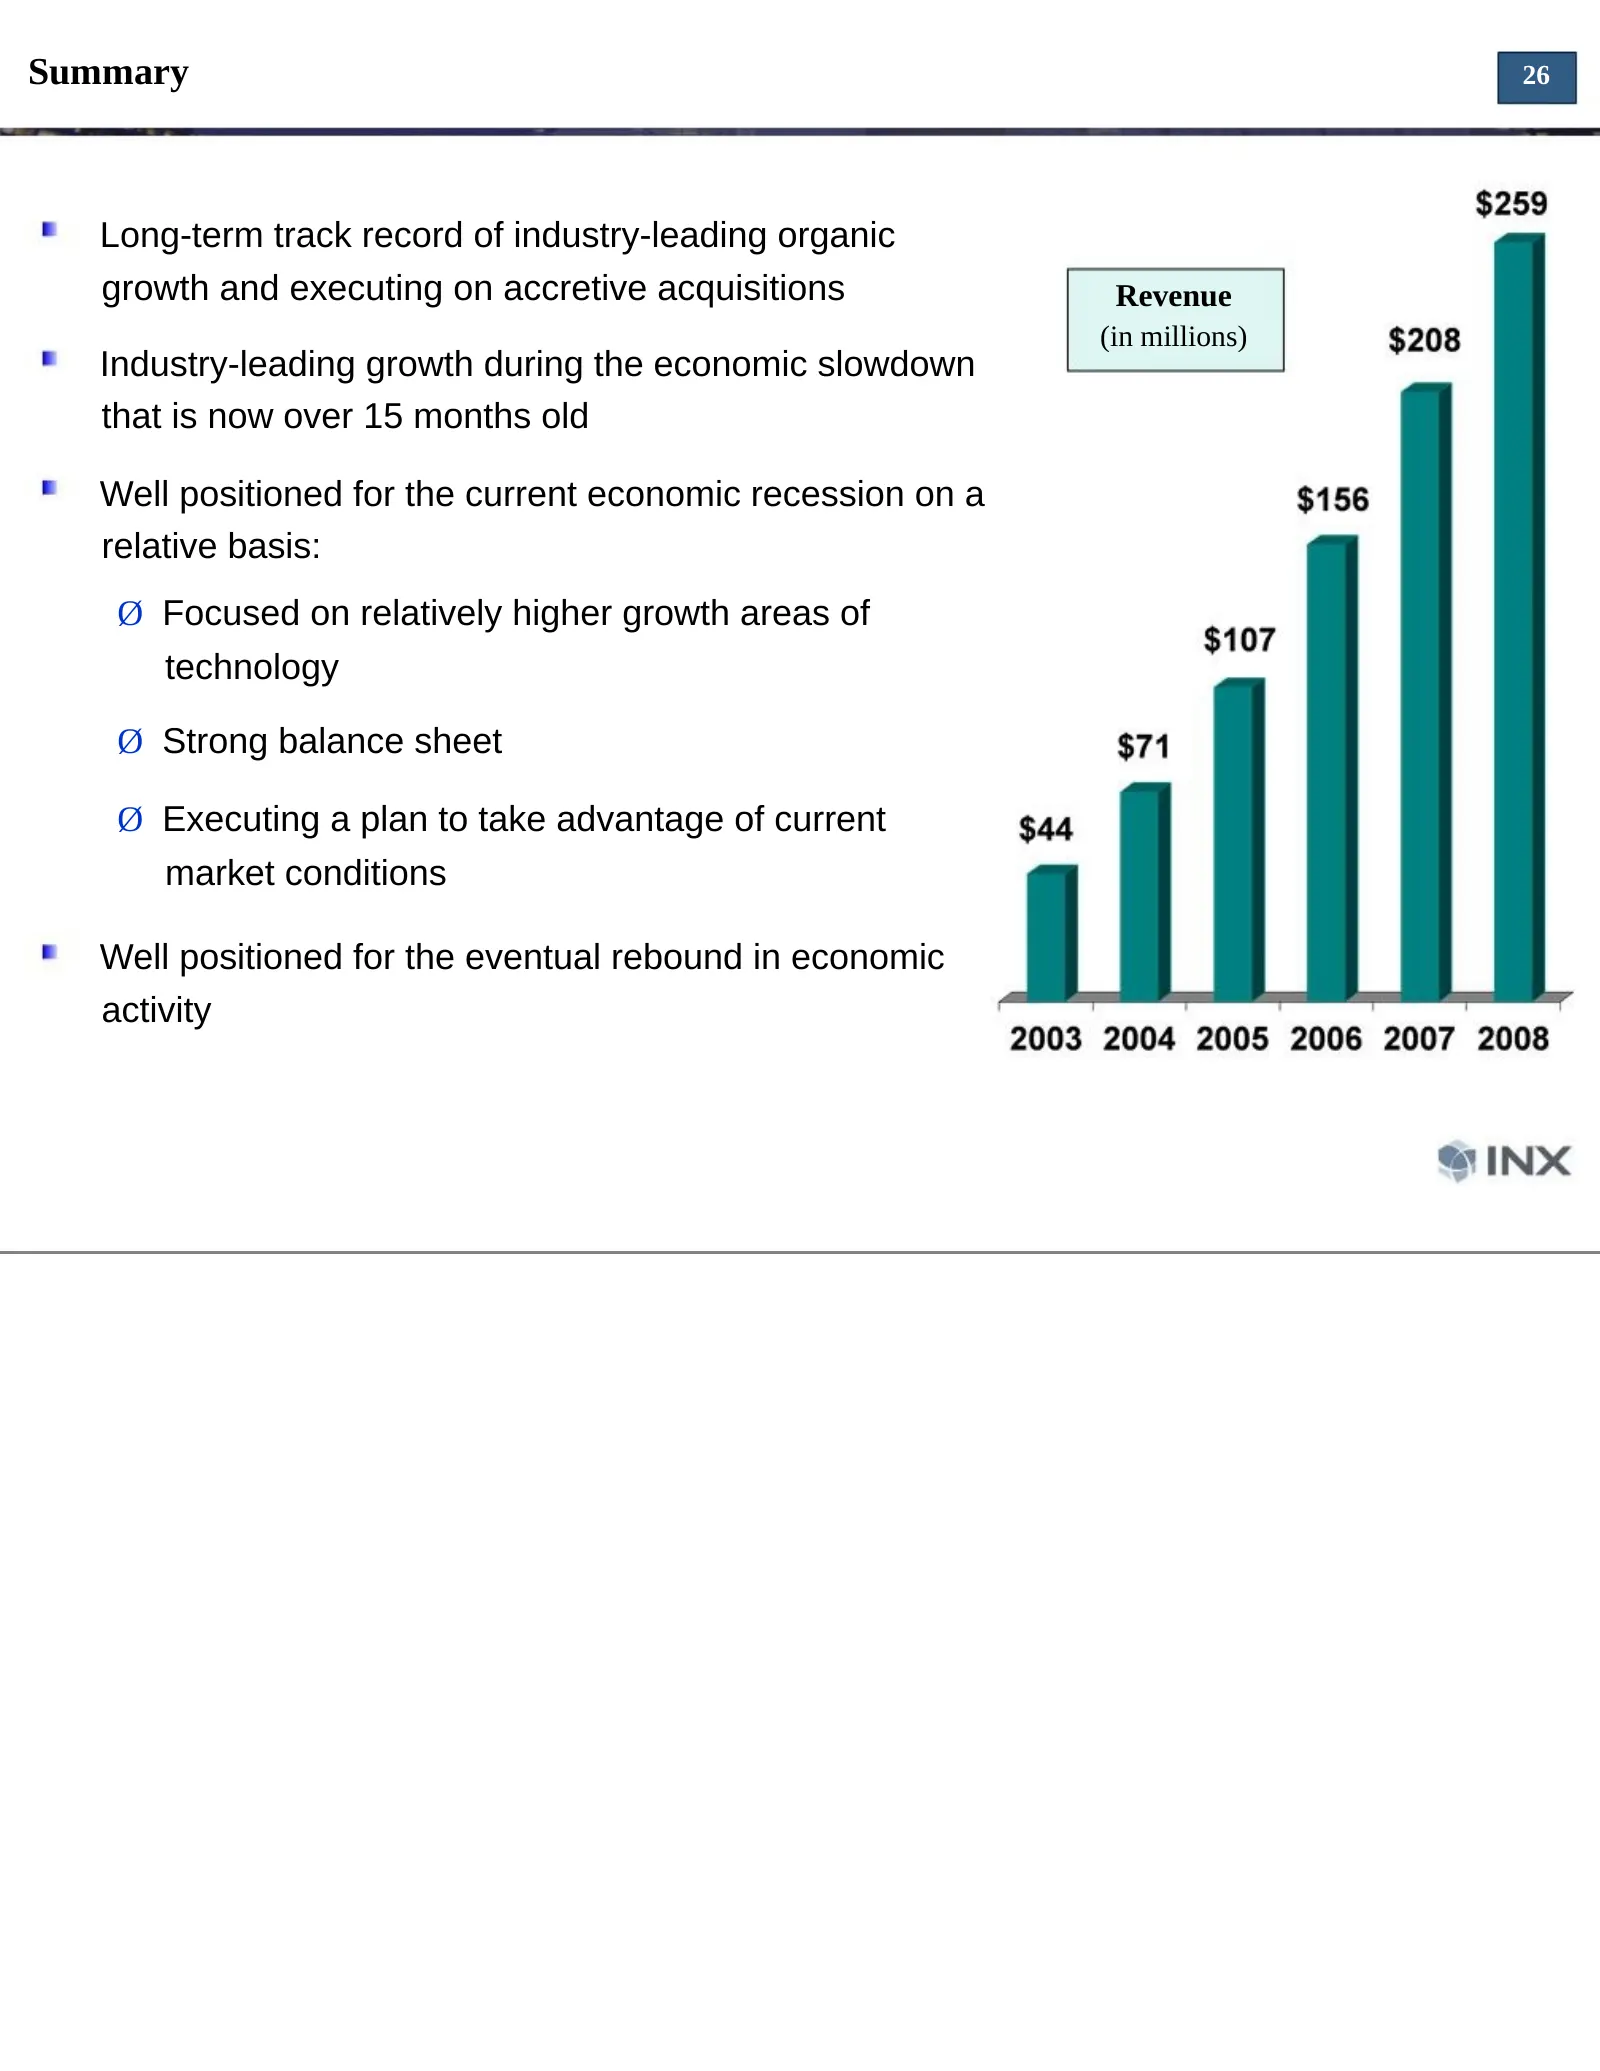
Summary 26 Long-term track record of industry-leading organic growth and executing on accretive acquisitions Revenue (in millions) Industry-leading growth during the economic slowdown that is now over 15 months old Well positioned for the current economic recession on a relative basis: Ø Focused on

Slide 27
Source: SEC EDGAR · 8-K filed Mar 18, 2009
More decks from INX Inc
 Merger or Acquisition (November 2011)10 slides · Nov 1, 2011
 Rodman & Renshaw Global Investment Conference 201120 slides · Sep 13, 2011
 Shareholder Meeting (July 2011)15 slides · Jul 19, 2011
 Q1 2011 Earnings Presentation15 slides · Jul 13, 2011
 FY2010 Earnings Presentation28 slides · Jun 6, 2011
 Corporate Update (November 2010)24 slides · Nov 10, 2010