INX — Rodman & Renshaw Global Investment Conference 2011
20 slides from INX's conference presentation, Sep 13, 2011
Slide 1: Rodman & Renshaw Global Investment Conference
Slide 2: Safe Harbor and Non-GAAP Statements
GAAP Reconci joking Statements Non-GAAP Reconciliation To GAAP During this presentation references to financial measures of INX will include references to non-GAAP financial measures. INX provides a reconciliation between GAAP and non-GAAP financial information within this presentation and on its we
Slide 3: Overview of INX Inc.
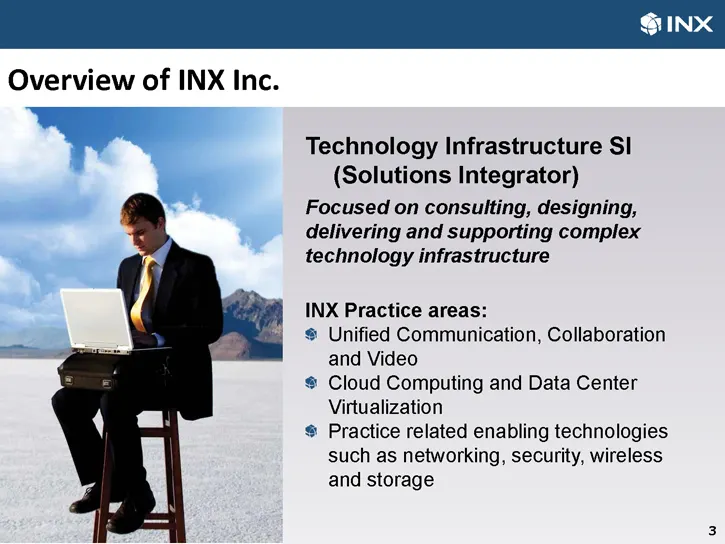
Overview of INX Inc. a i Technology Infrastructure SI (Solutions Integrator) Focused on consulting, designing, delivering and supporting complex technology infrastructure INX Practice areas: ® Unified Communication, Collaboration and Video © Cloud Computing and Data Center Virtualization ® Practice
Slide 4: Focused on High Growth Technologies
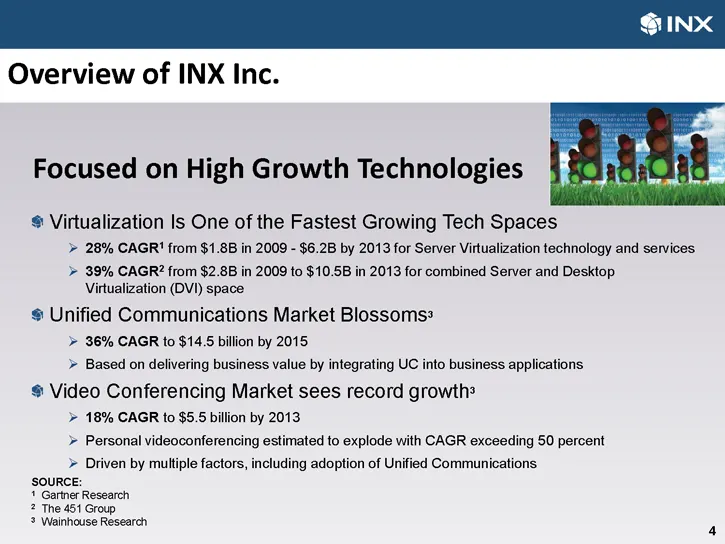
Overview of INX Inc. Focused on High Growth Technologies $ Virtualization Is One of the Fastest Growing Tech Spaces > 28% CAGR' from $1.8B in 2009 - $6.2B by 2013 for Server Virtualization technology and services > 39% CAGR? from $2.8B in 2009 to $10.5B in 2013 for combined Server and Desktop Virtua
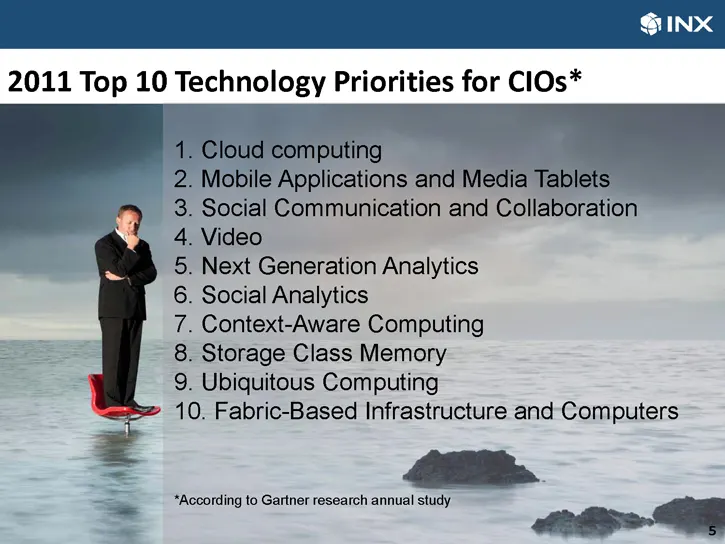
Slide 5: 2011 Top Technology Priorities for CIOs
2011 Top 10 Technology Priorities for ClOs* ud computing . . Mobile Applications and 3. Social Communication and Collaboration 4. Video 5. Next Generation Analytics 6. Social Analytics 7. Context-Aware Computing 8. Storage Class Memory 9. Ubiquitous Computing 10. Fabric-Based Infrastructure and'Comp
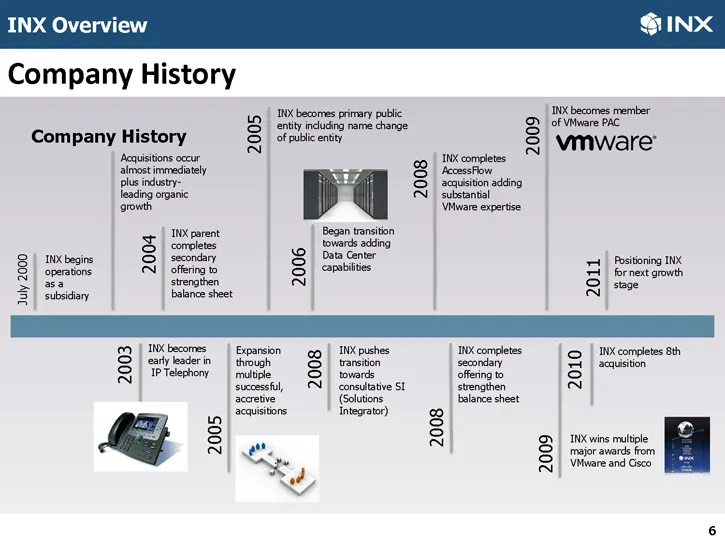
Slide 6: INX Overview: Company History
INX Overview Company History ee 1X becomes member @ ante @ ye tiers ota Pac company History Scfrbic ents Ss vmware eausiions our Wy completes Cees, Bhatt plus indy S _2aqusiton adding feading eroanic I Subsancal growth Winare expertise WXparent Began tansiton se Bie Seer | mxtege | S| een $B | bat c
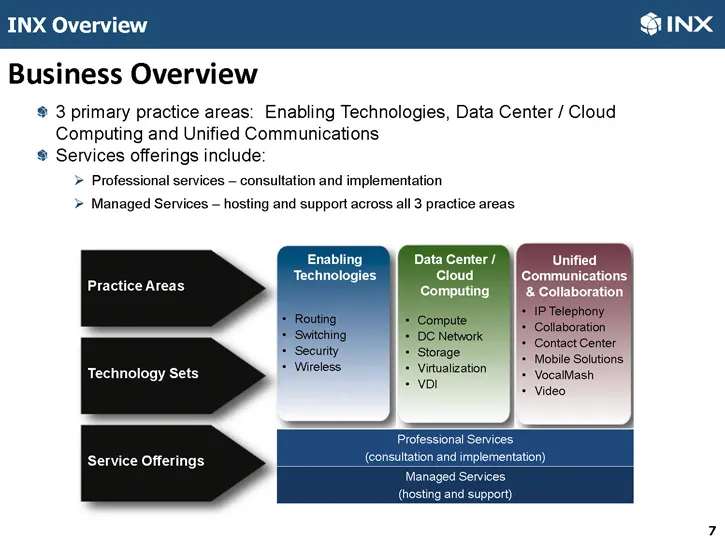
Slide 7: INX Overview: Business Overview
INX Overview GINX Business Overview © 3 primary practice areas: Enabling Technologies, Data Center / Cloud Computing and Unified Communications ® Services offerings include: > Professional services — consultation and implementation > Managed Services — hosting and support across all 3 practice areas
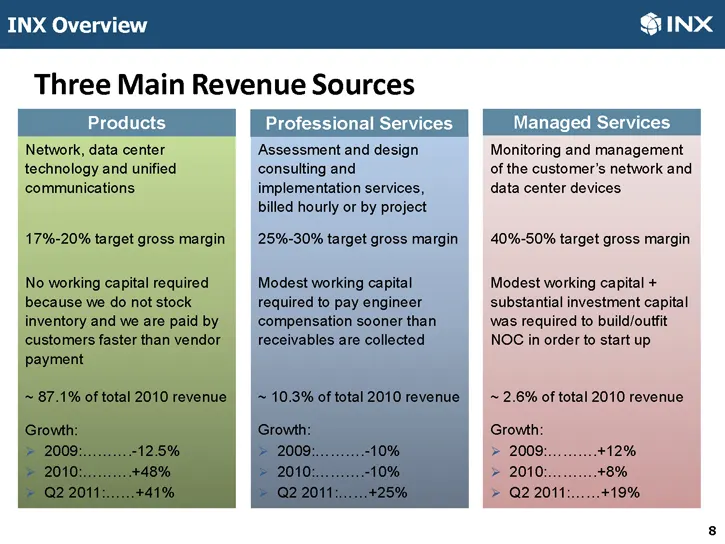
Slide 8: Three Main Revenue Sources
INX Overview GINX Three Main Revenue Sources | Products = Professional Services Managed Services Network, data center Assessment and design Monitoring and management technology and unified consulting and of the customer's network and ‘communications implementation services, data center devices bille
Slide 9: Customers: Enterprise Organizations
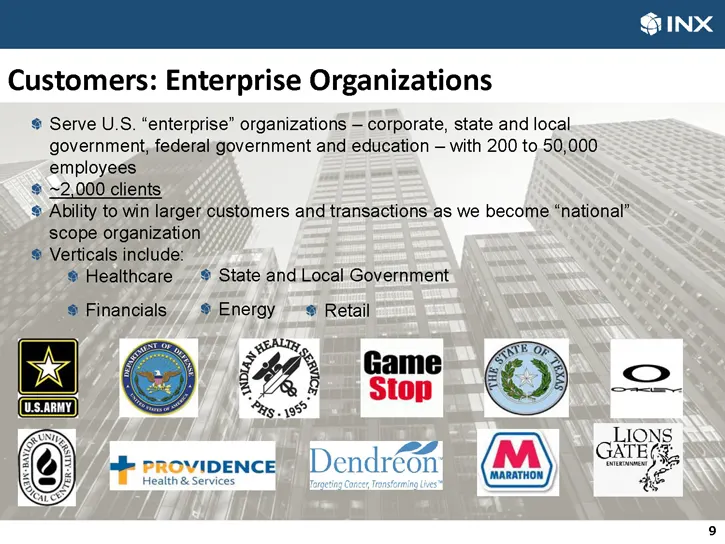
Customers: Enterprise Organizations ® Serve U.S. “enterprise” organizations — corporate, state and local government, federaligovernment and education — with 200 to 50,000 employees. ~2,000 clients Ability to win larger customers and transactions as we become “national” scope organization ® Verticals
Slide 10: INX Overview: Locations
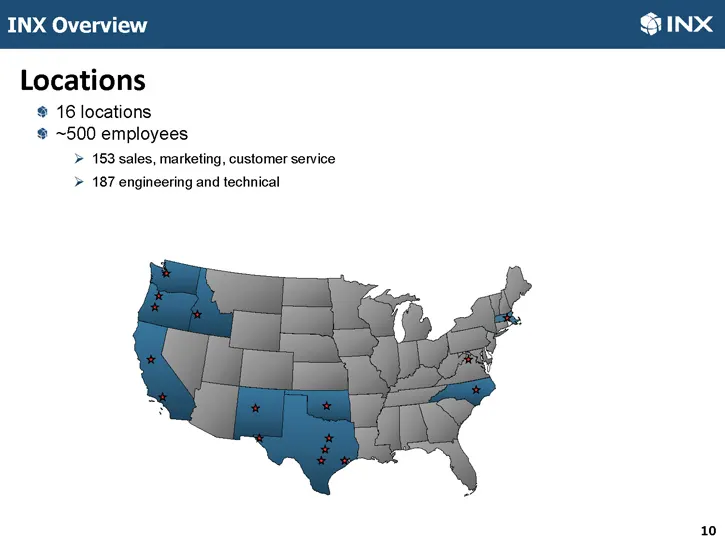
INX Overview pS INX Locations ® 16 locations ¢ ~500 employees > 153 sales, marketing, customer service > 187 engineering and technical 10
Slide 11: Industry Recognition and Awards
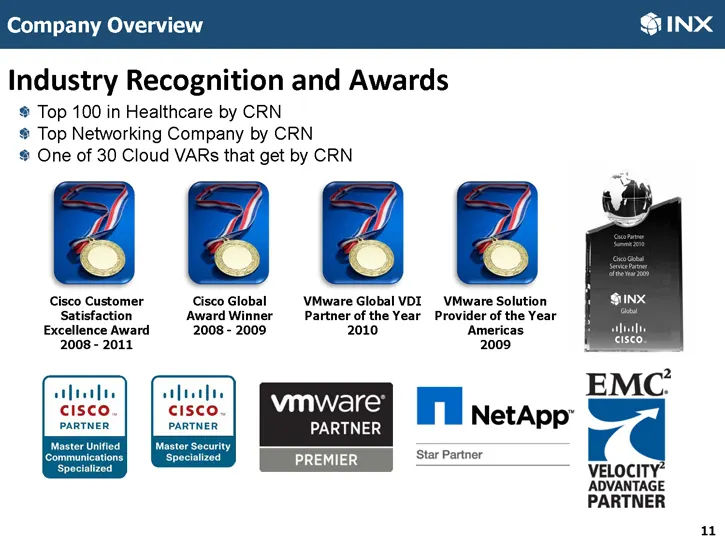
Company Overview Industry Recognition and Awards Top 100 in Healthcare by CRN Top Networking Company by CRN One of 30 Cloud VARs that get by CRN BBE Cisco Customer Cisco Global VMware Global VDI_ VMware Solution Satisfaction AwardWinner Partner of the Year Provider of the Year Excellence Award 2008
Slide 12: Focused In Interrelated Areas of Enterprise Technology Infrastructure
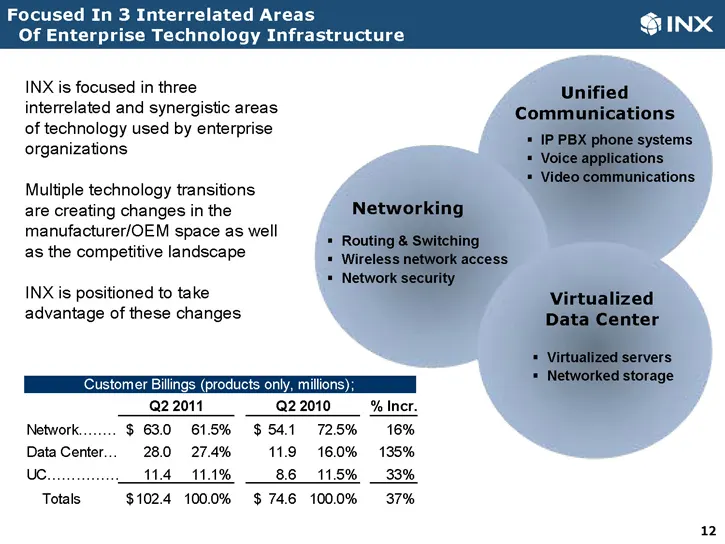
Focused In 3 Interrelated Areas Of Enterprise Technology Infrastructure INX is focused in three interrelated and synergistic areas of technology used by enterprise organizations Multiple technology transitions are creating changes in the Nei manufacturer/OEM space as well . Ral as the competitive la
Slide 13: Financial Overview
SINX FINANCIAL OVERVIEW
Slide 14: Recent History
Recent History ® Completed financial restatement (due principally to errors in revenue recognition accounting policies) in June 2011. Cost for restatement was in excess of $9 million spread over multiple quarters. INX continued growing during restatement process. ® Began transitioning finance operat
Slide 15: Trends
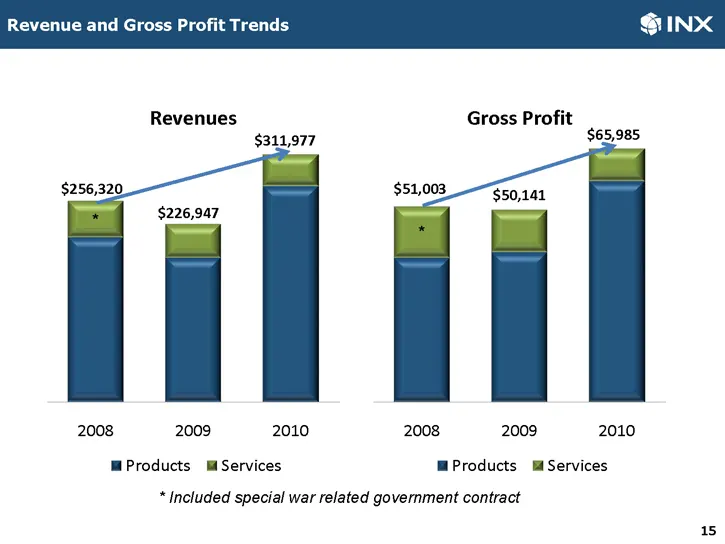
Trends Revenues Gross Profit $311,977 $65,985 $50,141 $226,947 2008 2009 2010 2008 2009 2010 ™Products i Services MProducts ml Services * Included special war related government contract 15
Slide 16: Revenue and Gross Profit Trends
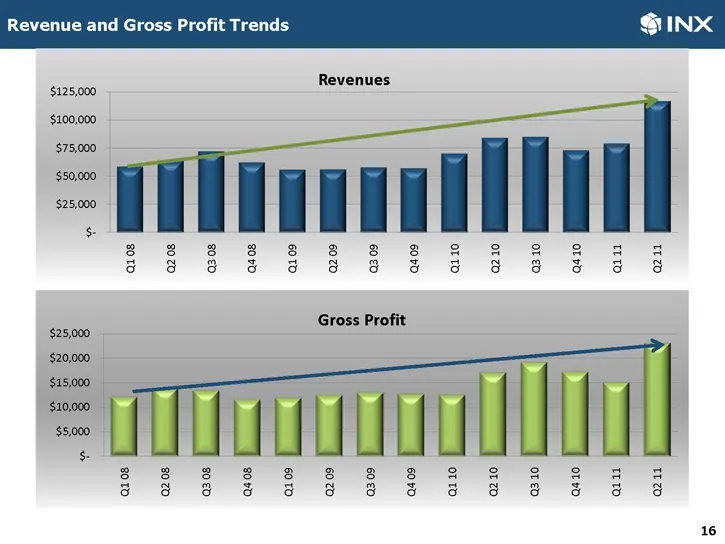
Revenue and Gross Profit Tren aise Revenues $100,000 $75,000 $50,000 $25,000 > 8 8 s 3 g@ 2s 8 e868 6 o¢ $8 6 6 3 8 = Gross Profit $20,000 14 $15,000 =U ios sos x09 309 409 aio 210 310 410 an an 16
Slide 17: Q2-2011 Operating Results — Reconciliation
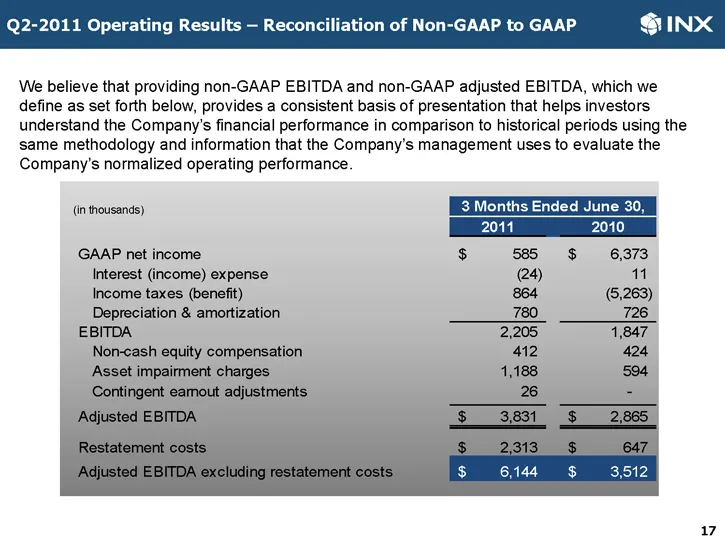
Q2-2011 Operating Results — Reconci We believe that providing non-GAAP EBITDA and non-GAAP adjusted EBITDA, which we define as set forth below, provides a consistent basis of presentation that helps investors understand the Company's financial performance in comparison to historical periods using th
Slide 18: Key Balance Sheet Items
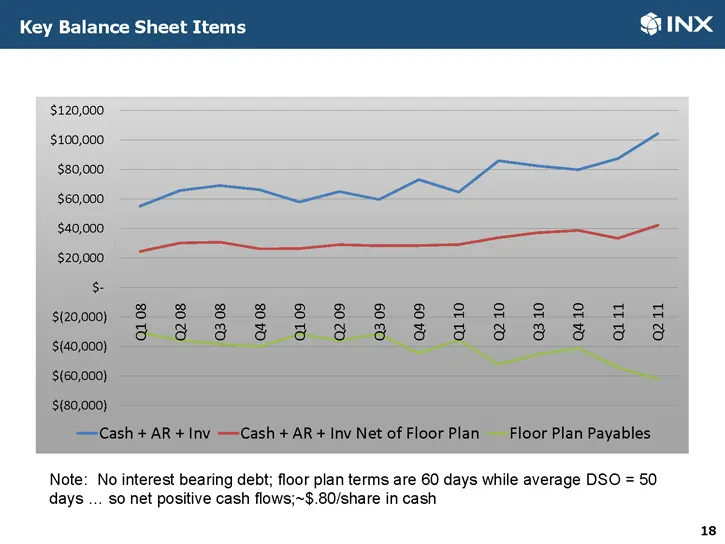
Key Balance Sheet Items $120,000 $100,000 $80,000 $60,000 $40,000 $20,000 $s +$(20,000) ‘$(40,000) ‘$(60,000) ‘$(80,000) Cash + AR + Inv —Cash + AR + Inv Net of Floor Plan Floor Plan Payables Q1 08 02.08 03 08 04 08 Q109 02.09 03.09 04.09 Q110 210 0310 04.10 aii 211 Note: No interest bearing debt; f
Slide 19: Q3 2011 Outlook
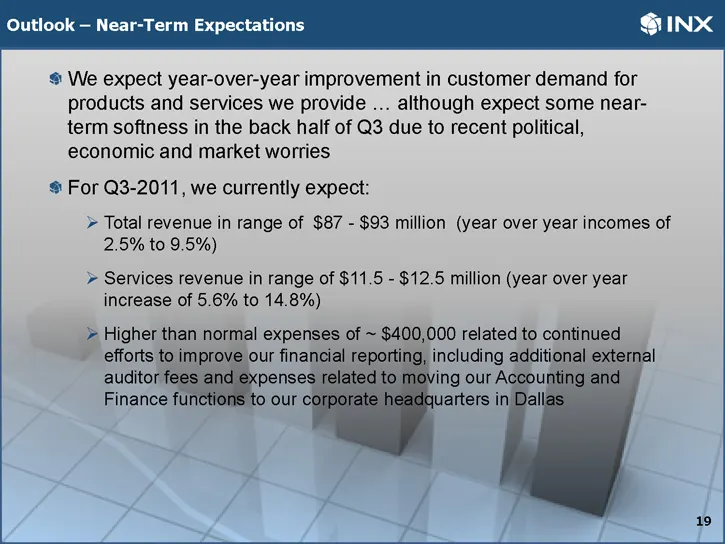
% We expect year-over-year improvement in customer demand for products and services we provide ... although expect some near- term softness in the back half of Q3 due to recent political, economic and market worries ® For Q3-2011, we currently expect: » Total revenue in range of $87 - $93 million (y
Slide 20: INX Investment Takeaways
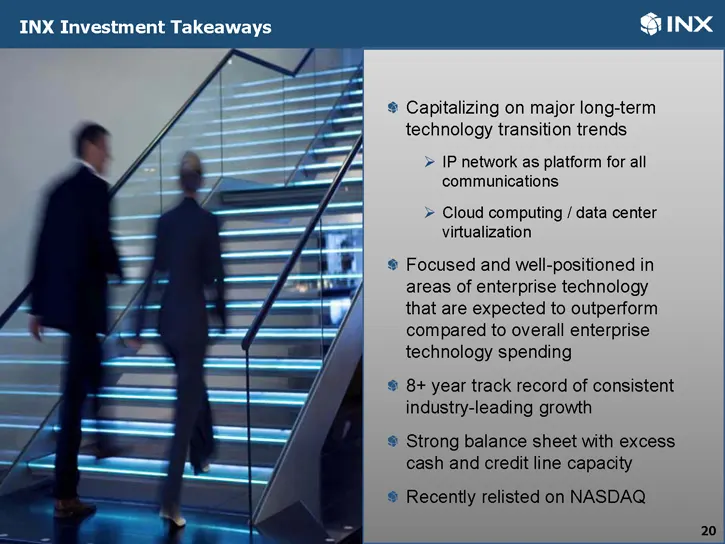
INX Investment Takeaways ® Capitalizing on major long-term technology transition trends > IP network as platform for all communications > Cloud computing / data center virtualization ® Focused and well-positioned in areas of enterprise technology that are expected to outperform compared to overall e
Source: SEC EDGAR · 8-K filed Sep 13, 2011
More decks from INX Inc
 Merger or Acquisition (November 2011)10 slides · Nov 1, 2011
 Shareholder Meeting (July 2011)15 slides · Jul 19, 2011
 Q1 2011 Earnings Presentation15 slides · Jul 13, 2011
 FY2010 Earnings Presentation28 slides · Jun 6, 2011
 Corporate Update (November 2010)24 slides · Nov 10, 2010
 Q3 2009 Earnings Presentation20 slides · Nov 10, 2009