SunTrust Banks — Barclays Global Financial Services Conference 2015
24 slides from SunTrust Banks's conference presentation, Sep 17, 2015

Slide 1: Barclays Global Financial Services Conference
Barclays Global Financial Services Conference Aleem Gillani, Chief Financial Officer, SunTrust Banks, Inc. September 17, 2015
Slide 2: The following should be read in conjunction with the financial statements, notes and other
2 The following should be read in conjunction with the financial statements, notes and other information contained in the Company’s 2014 Annual Report on Form 10-K, Quarterly Reports on Form 10-Q, and Current Reports on Form 8-K. This presentation includes non-GAAP financial measures to describe Sun
Slide 3: Investment Thesis: Why invest in SunTrust?
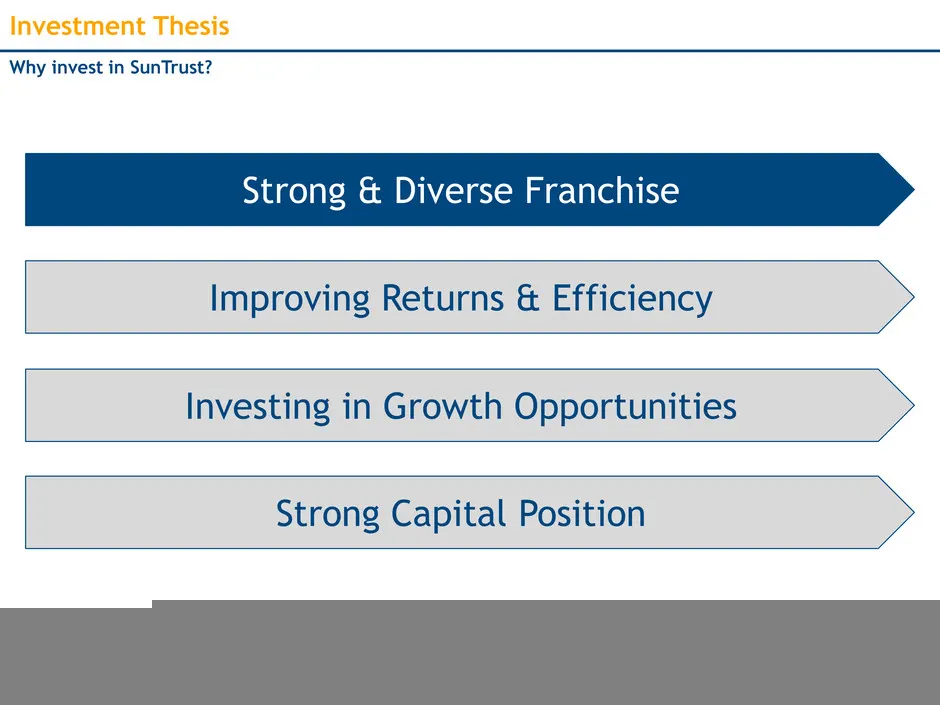
3 Investment Thesis Improving Returns & Efficiency Investing in Growth Opportunities Strong & Diverse Franchise Strong Capital Position Why invest in SunTrust?
Slide 4: Franchise Overview: Who is SunTrust?
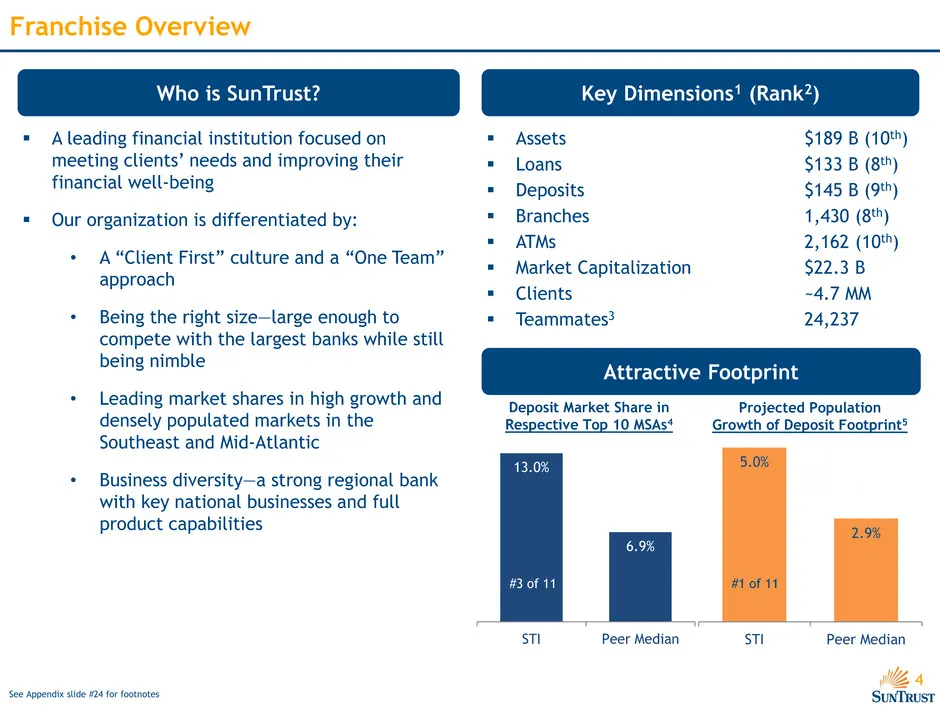
4 13.0% 6.9% STI Peer Median 5.0% 2.9% STI Peer Median Franchise Overview Who is SunTrust? Key Dimensions1 (Rank2) A leading financial institution focused on meeting clients’ needs and improving their financial well-being Our organization is differentiated by: • A “Client First” culture and a “O
Slide 5: Diverse Business Mix and Strong Franchises
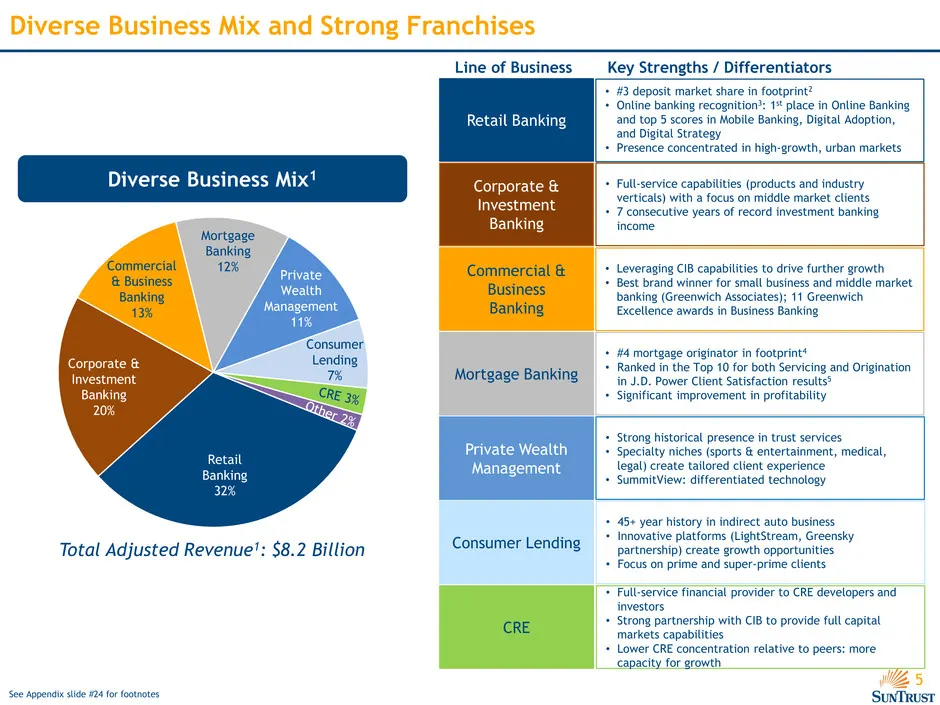
5 Diverse Business Mix and Strong Franchises Diverse Business Mix1 Total Adjusted Revenue1: $8.2 Billion Commercial & Business Banking 13% Private Wealth Management 11% Consumer Lending 7% Corporate & Investment Banking 20% Mortgage Banking 12% Retail Banking 32% Retail Banking Corporate & Investmen
Slide 6: Strategic Consistency
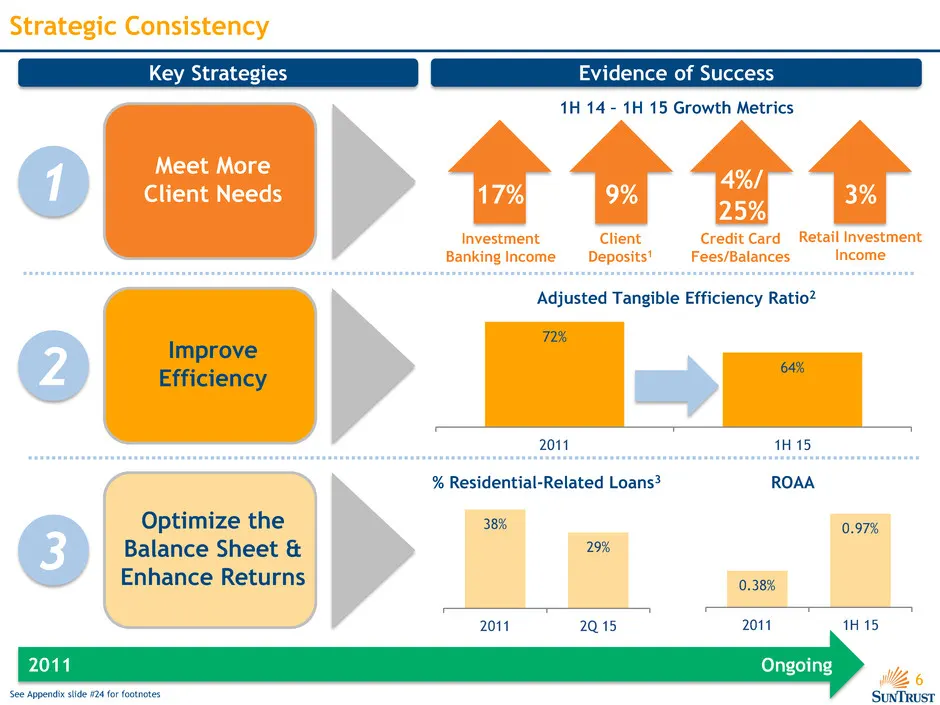
6 Strategic Consistency Key Strategies Evidence of Success 1H 14 – 1H 15 Growth Metrics Adjusted Tangible Efficiency Ratio2 Meet More Client Needs Improve Efficiency Optimize the Balance Sheet & Enhance Returns % Residential-Related Loans3 17% Investment Banking Income 4%/ 25% Credit Card Fees/Balan
Slide 7: Investment Thesis: Why invest in SunTrust?
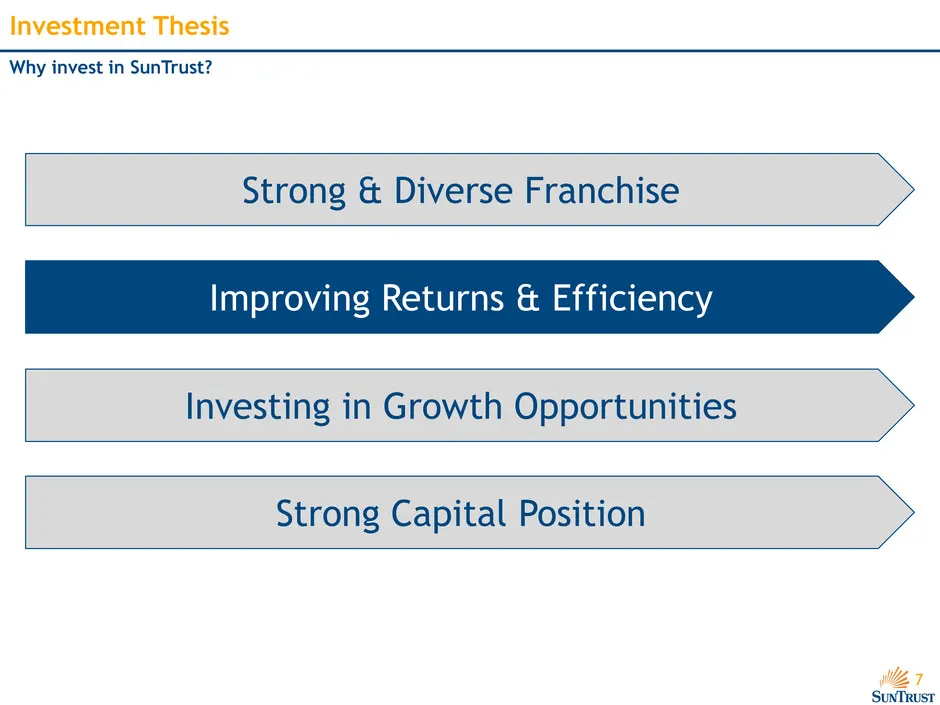
7 Investment Thesis Improving Returns & Efficiency Investing in Growth Opportunities Strong & Diverse Franchise Strong Capital Position Why invest in SunTrust?
Slide 8: Solid Progress on Key Fronts
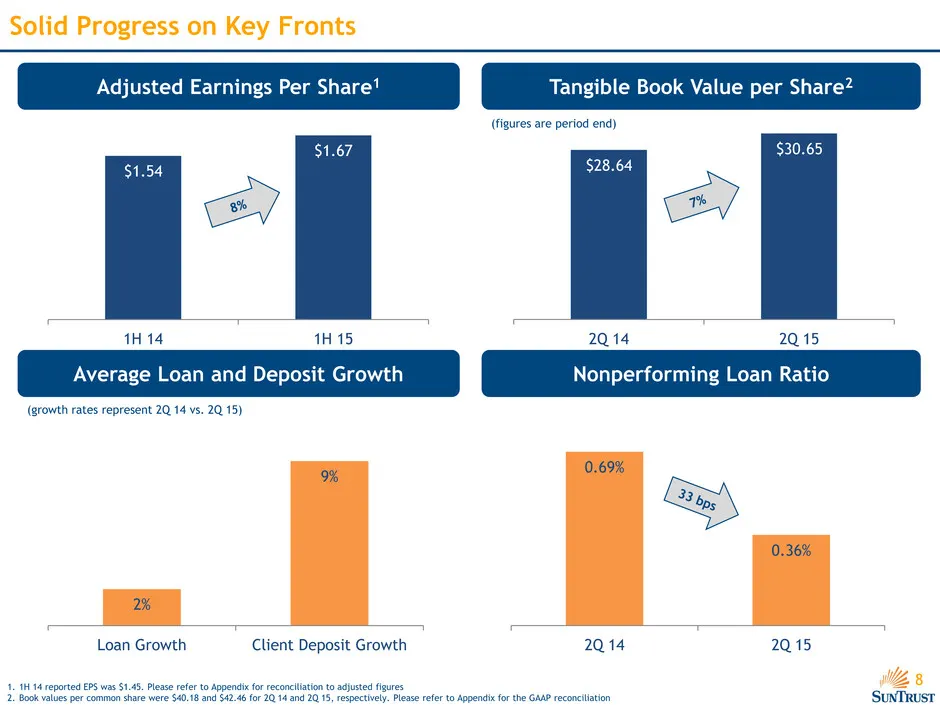
8 0.69% 0.36% 2Q 14 2Q 15 $1.54 $1.67 1H 14 1H 15 Solid Progress on Key Fronts Adjusted Earnings Per Share1 Nonperforming Loan Ratio Tangible Book Value per Share2 Average Loan and Deposit Growth (growth rates represent 2Q 14 vs. 2Q 15) 1. 1H 14 reported EPS was $1.45. Please refer to Appendix for r
Slide 9: Adjusted Tangible Efficiency Ratio
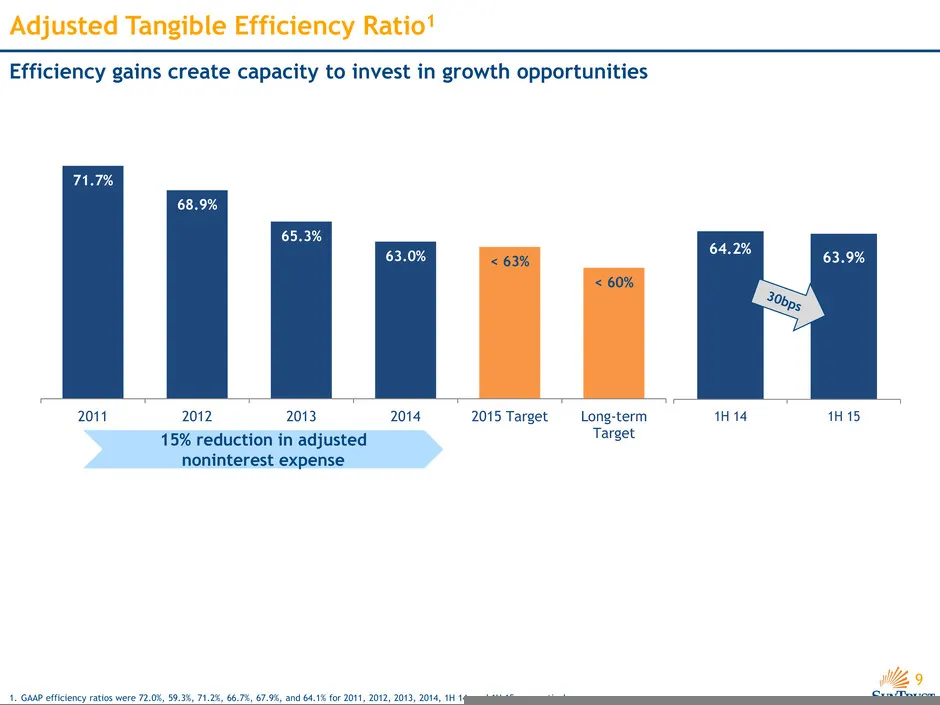
9 Adjusted Tangible Efficiency Ratio1 Efficiency gains create capacity to invest in growth opportunities 1H 14 1H 15 71.7% 68.9% 65.3% 63.0% < 63% < 60% 2011 20 2 2013 2014 2015 Target Long-term Target 64.2% 63.9% 15% reduction in adjusted noninterest expense 1. GAAP efficiency ratios were 72.0%, 59
Slide 10: Balance Sheet Optimization
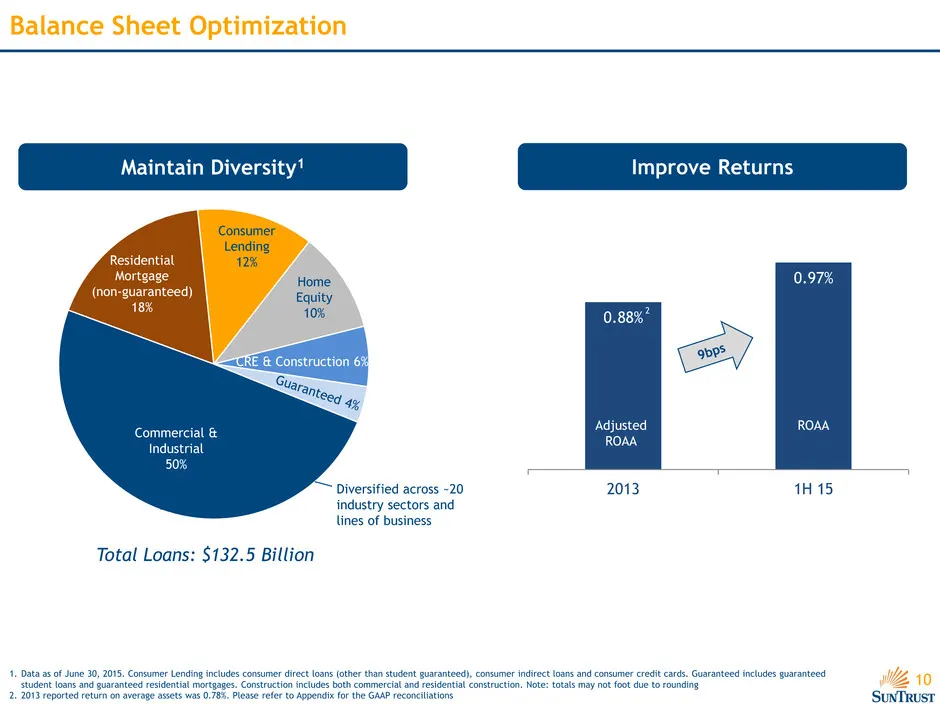
10 0.88% 0.97% 2013 1H 15 Balance Sheet Optimization 1. Data as of June 30, 2015. Consumer Lending includes consumer direct loans (other than student guaranteed), consumer indirect loans and consumer credit cards. Guaranteed includes guaranteed student loans and guaranteed residential mortgages. Con
Slide 11: Investment Thesis: Why invest in SunTrust?
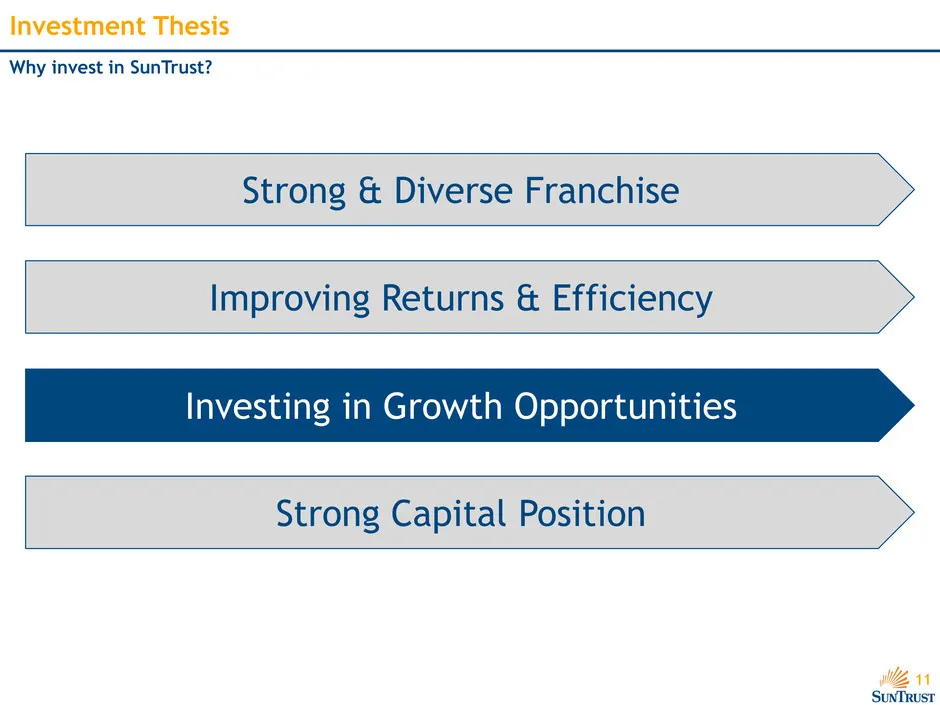
11 Investment Thesis Improving Returns & Efficiency Investing in Growth Opportunities Strong & Diverse Franchise Strong Capital Position Why invest in SunTrust?
Slide 12: Wholesale Banking Areas of Focus
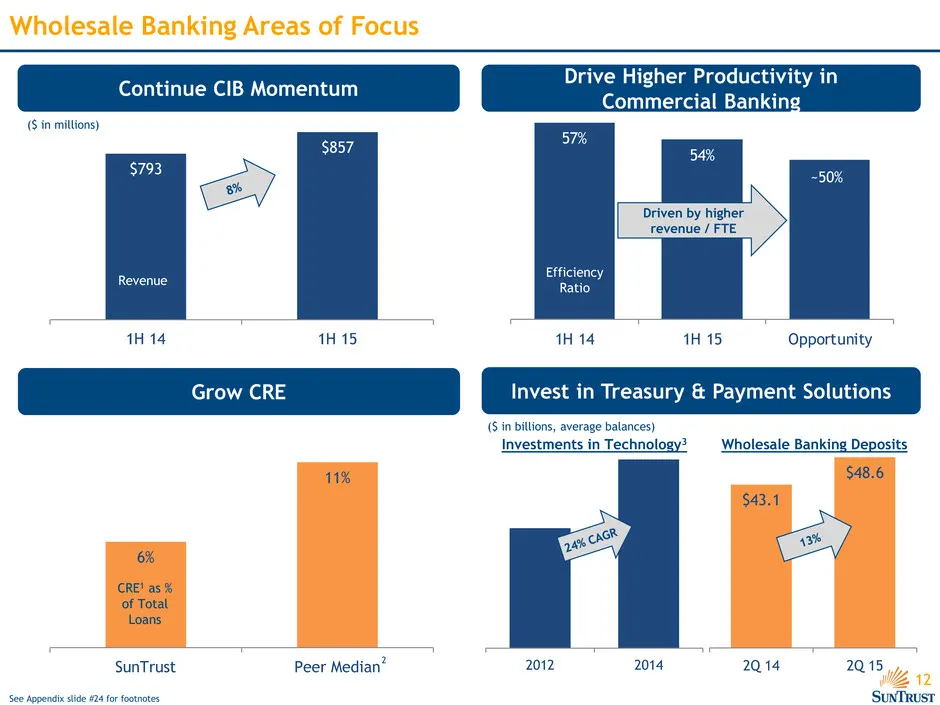
12 $793 $857 1H 14 1H 15 57% 54% 1H 14 1H 15 Opportunity 6% 11% SunTrust Peer Median $43.1 $48.6 2Q 14 2Q 15 Wholesale Banking Areas of Focus Grow CRE Continue CIB Momentum Drive Higher Productivity in Commercial Banking ($ in millions) Efficiency Ratio CRE1 as % of Total Loans 2 Driven by higher re
Slide 13: Continuous, Strategic Investments
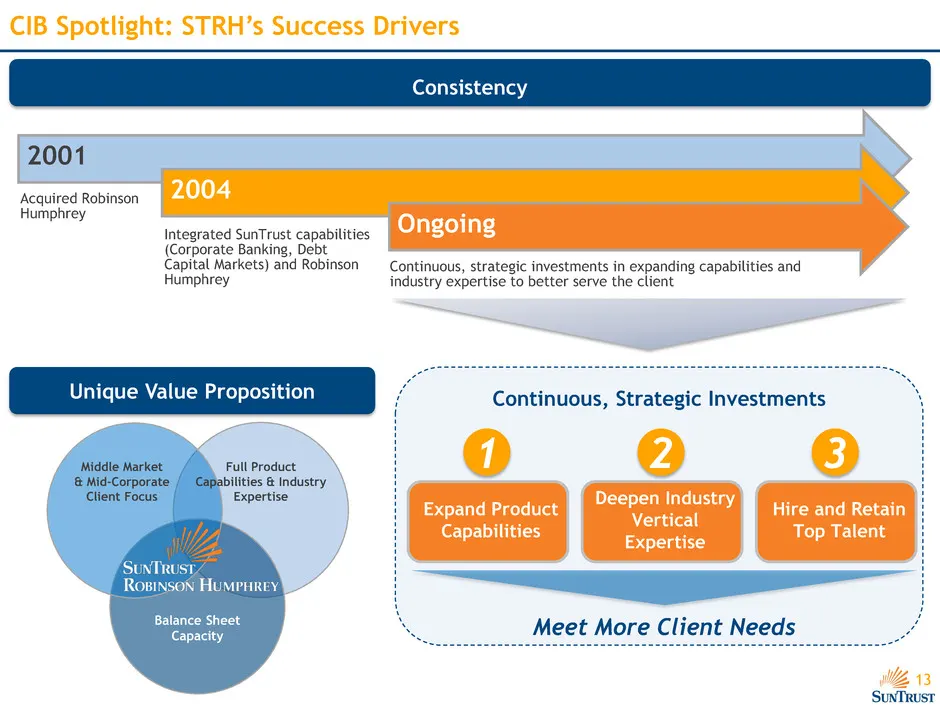
13 Continuous, Strategic Investments 2001 Acquired Robinson Humphrey 2004 Integrated SunTrust capabilities (Corporate Banking, Debt Capital Markets) and Robinson Humphrey Ongoing Continuous, strategic investments in expanding capabilities and industry expertise to better serve the client CIB Spotlig
Slide 14: CIB Spotlight: Demonstrated Results
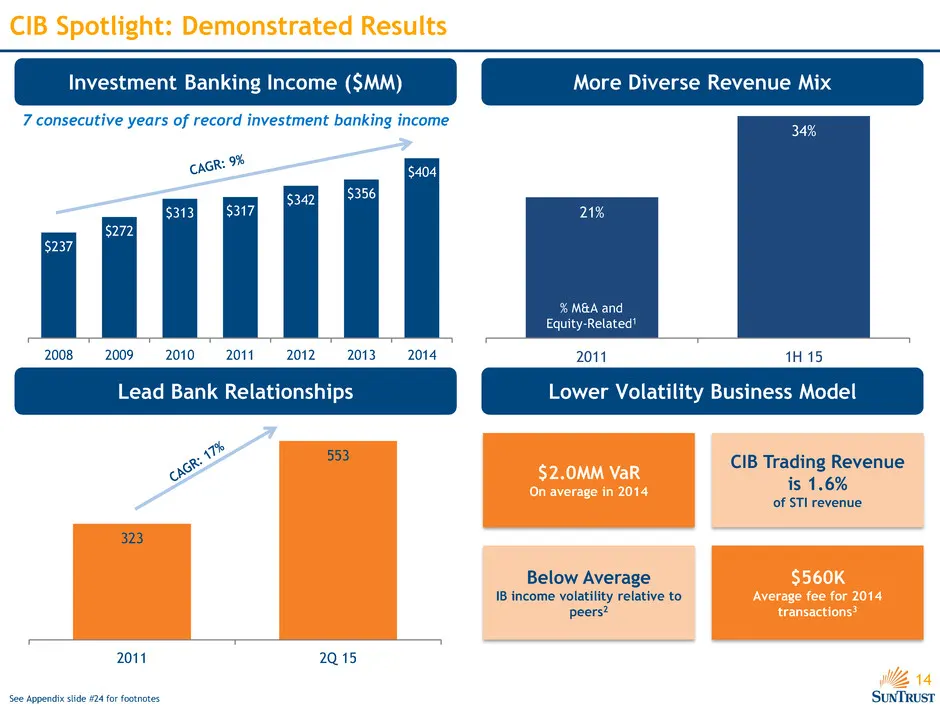
14 323 553 2011 2Q 15 $237 $272 $313 $317 $342 $356 $404 2008 2009 2010 2011 2012 2013 2014 21% 34% 2011 1H 15 CIB Spotlight: Demonstrated Results Investment Banking Income ($MM) More Diverse Revenue Mix Lead Bank Relationships Lower Volatility Business Model $2.0MM VaR On average in 2014 CIB Tradin
Slide 15: Consumer Banking and Private Wealth Management Areas of Focus
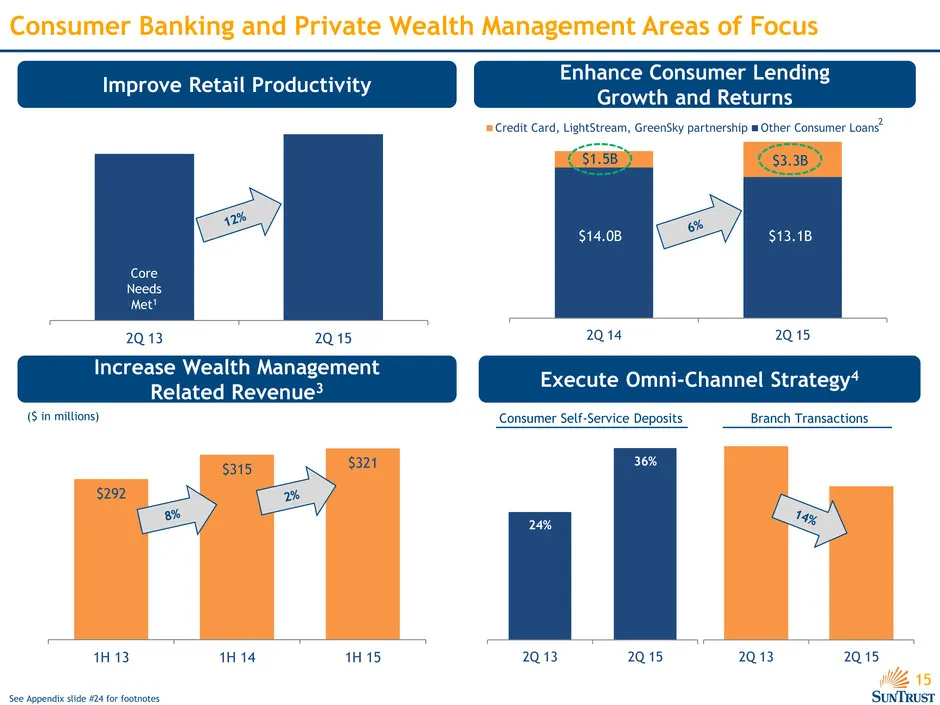
15 2Q 13 2Q 15 Increase Wealth Management Related Revenue3 $292 $315 $321 1H 13 1H 14 1H 15 2Q 14 2Q 15 Enhance Consumer Lending Growth and Returns 2Q 13 2Q 15 Consumer Banking and Private Wealth Management Areas of Focus See Appendix slide #24 for footnotes Improve Retail Productivity Core Needs Me
Slide 16: Mortgage Banking Areas of Focus
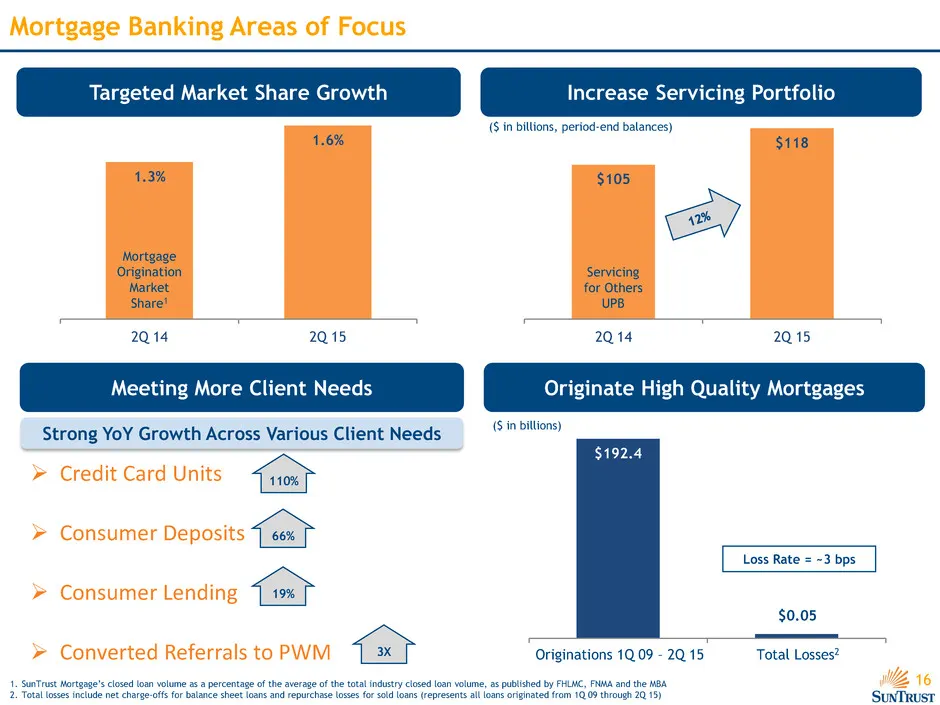
16 1.3% 1.6% 2Q 14 2Q 15 Targeted Market Share Growth $192.4 Mortgage Banking Areas of Focus $105 $118 2Q 14 2Q 15 Servicing for Others UPB ($ in billions, period-end balances) Increase Servicing Portfolio Mortgage Origination Market Share1 ($ in billions) Meeting More Client Needs Originate High Qu
Slide 17: Investment Thesis: Why invest in SunTrust?
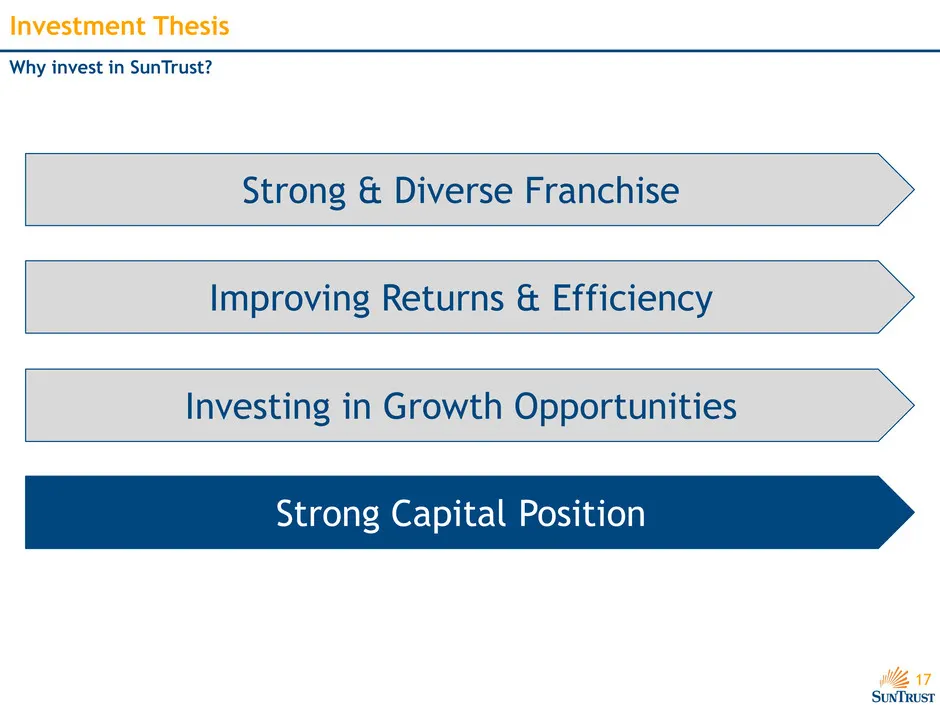
17 Investment Thesis Improving Returns & Efficiency Investing in Growth Opportunities Strong & Diverse Franchise Strong Capital Position Why invest in SunTrust?
Slide 18: Strong Capital Position Supports Growth
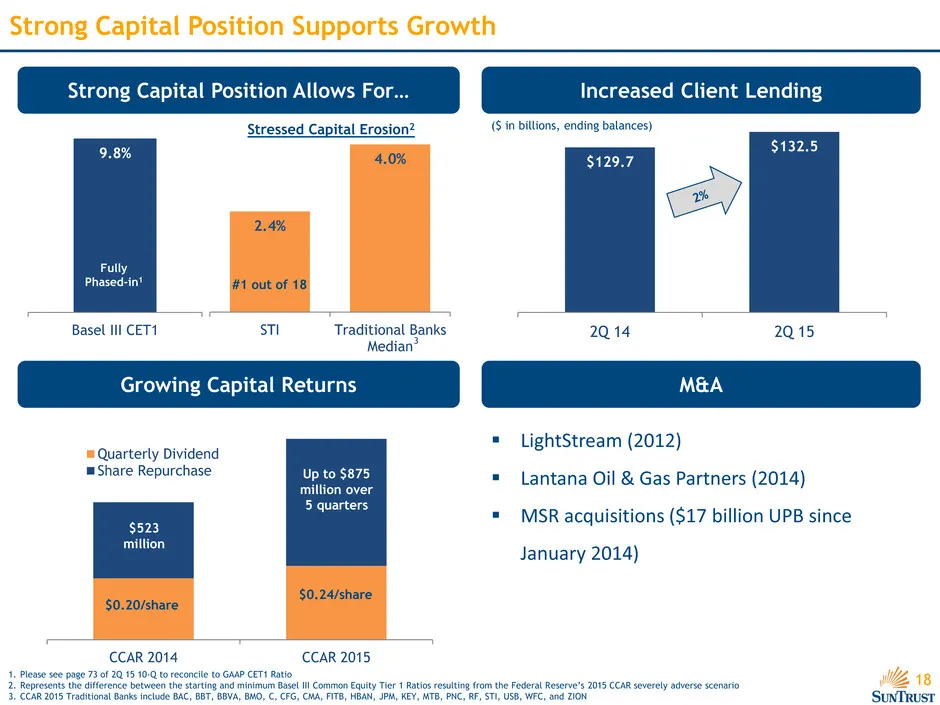
18 2.4% 4.0% STI Traditional Banks Median 9.8% Basel III CET1 $129.7 $132.5 2Q 14 2Q 15 CCAR 2014 CCAR 2015 Quarterly Dividend Share Repurchase Strong Capital Position Supports Growth Growing Capital Returns Strong Capital Position Allows For… Increased Client Lending M&A LightStream (2012) Lant
Slide 19: Investment Thesis: Why invest in SunTrust?
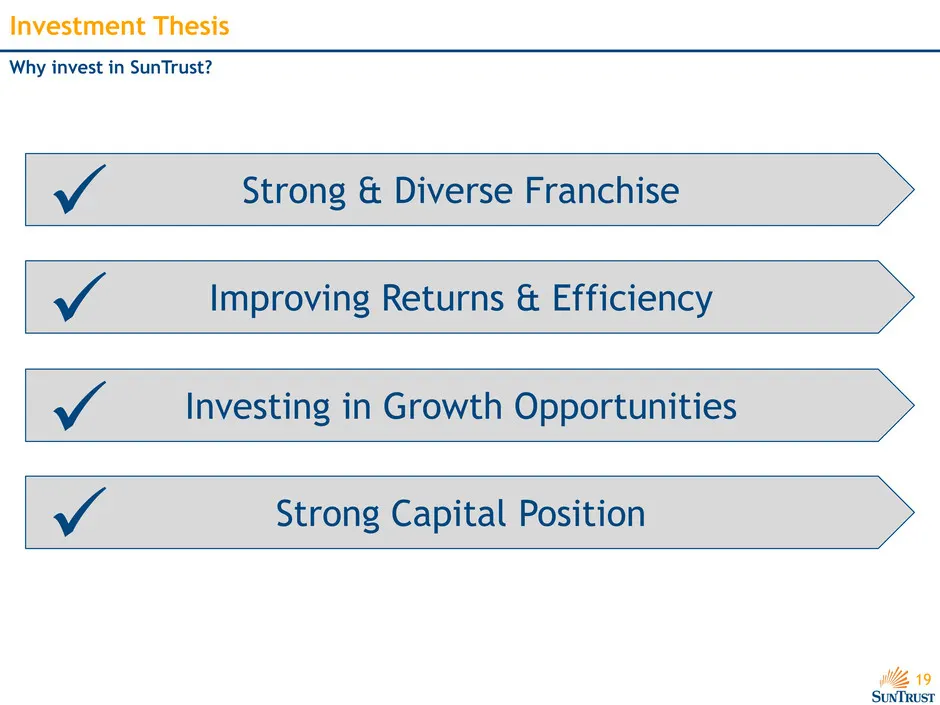
19 Investment Thesis Improving Returns & Efficiency Investing in Growth Opportunities Strong & Diverse Franchise Strong Capital Position Why invest in SunTrust?

Slide 20: Appendix
Appendix
Slide 21: Reconciliation of Tangible Book Value Per Share
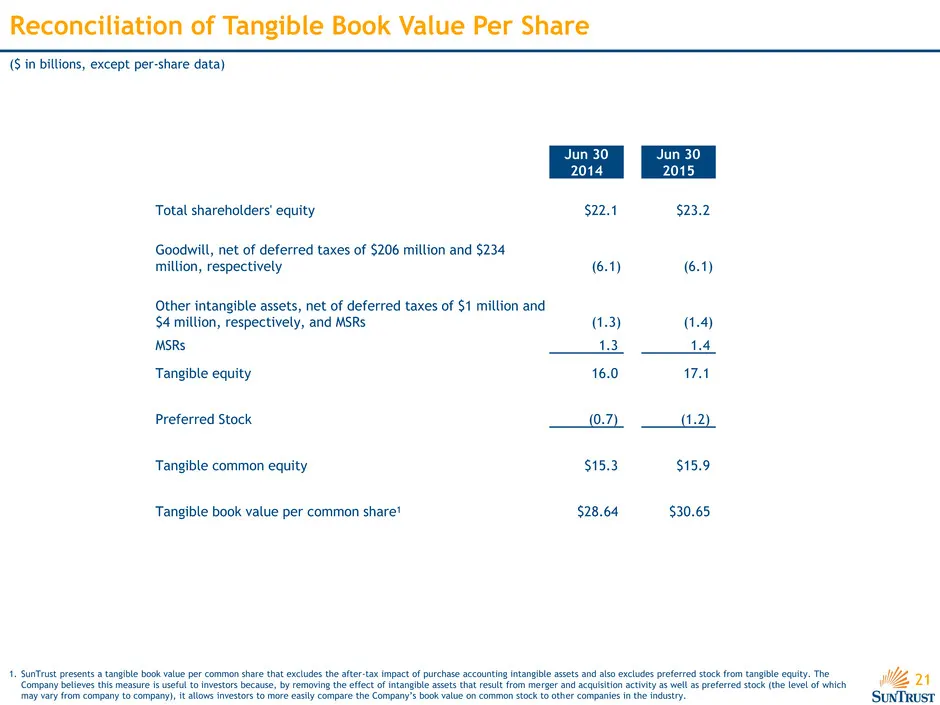
21 Reconciliation of Tangible Book Value Per Share ($ in billions, except per-share data) 1. SunTrust presents a tangible book value per common share that excludes the after-tax impact of purchase accounting intangible assets and also excludes preferred stock from tangible equity. The Company believ
Slide 22: Reconciliation of Efficiency Ratios
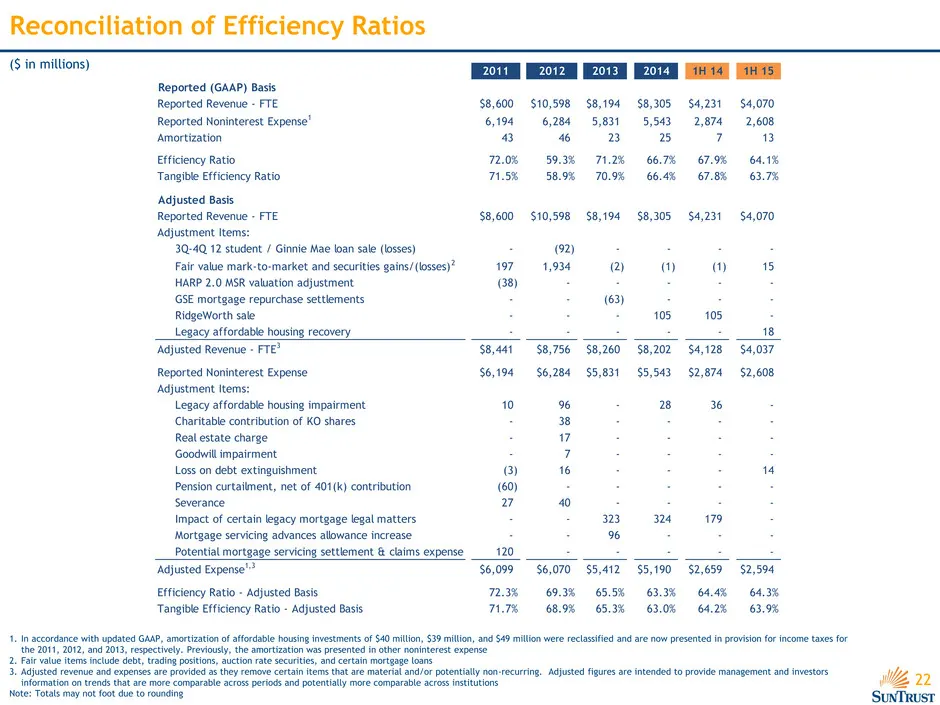
22 Reconciliation of Efficiency Ratios ($ in millions) 1. In accordance with updated GAAP, amortization of affordable housing investments of $40 million, $39 million, and $49 million were reclassified and are now presented in provision for income taxes for the 2011, 2012, and 2013, respectively. Pre
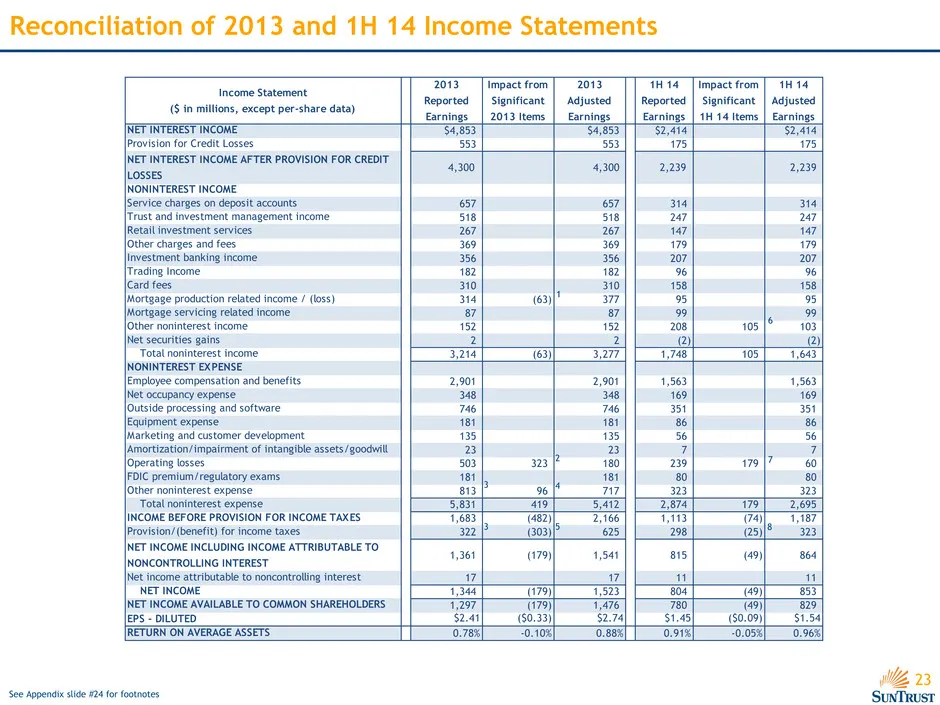
Slide 23: Income Statement
23 Income Statement ($ in millions, except per-share data) 2013 Reported Earnings Impact from Significant 2013 Items 2013 Adjusted Earnings 1H 14 Reported Earnings Impact from Significant 1H 14 Items 1H 14 Adjusted Earnings NET INTEREST INCOME $4,853 $4,853 $2,414 $2,414 Provision for Credit Losses
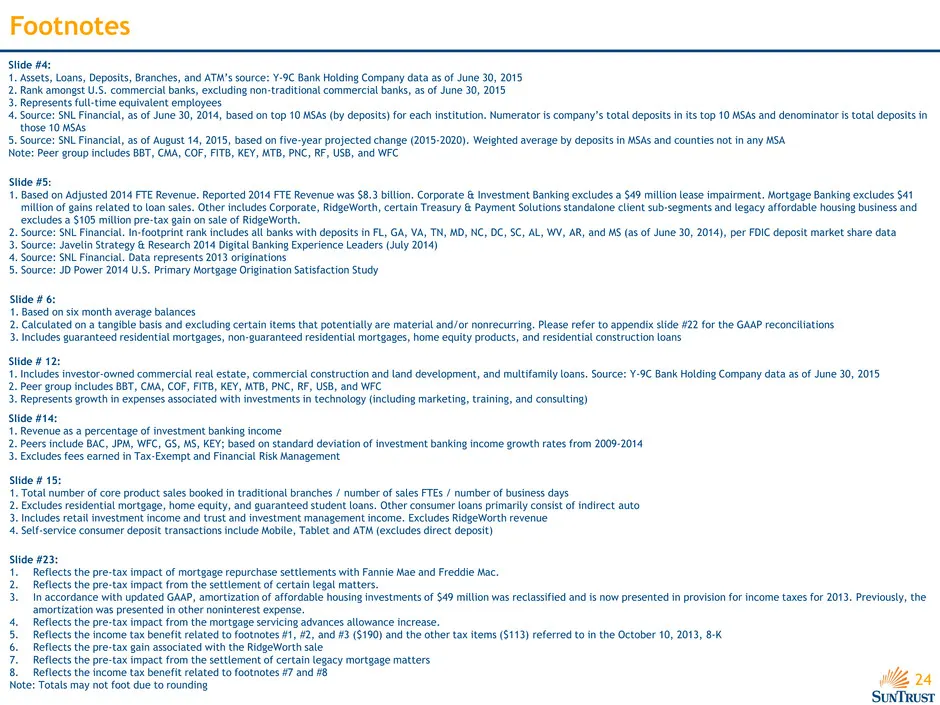
Slide 24: Footnotes
24 Footnotes Slide #5: 1. Based on Adjusted 2014 FTE Revenue. Reported 2014 FTE Revenue was $8.3 billion. Corporate & Investment Banking excludes a $49 million lease impairment. Mortgage Banking excludes $41 million of gains related to loan sales. Other includes Corporate, RidgeWorth, certain Treasu
Source: SEC EDGAR · 8-K filed Sep 17, 2015
More decks from SunTrust Banks Inc
 Q3 2019 Earnings Presentation21 slides · Oct 17, 2019
 Q2 2019 Earnings Presentation22 slides · Jul 18, 2019
 Q1 2019 Earnings Presentation22 slides · Apr 18, 2019
 Merger or Acquisition (February 2019)38 slides · Feb 7, 2019
 Q4 2018 Earnings Presentation23 slides · Jan 18, 2019
 2018 Goldman Sachs US Financial Services Conference30 slides · Dec 4, 2018