SunTrust Banks — Merger or Acquisition (February 2019)
38 slides from SunTrust Banks's merger presentation, Feb 7, 2019
Slide 1: Transformational Merger of Equals to Create The Premier Financial Institution
Transformational Merger of Equals to Create The Premier Financial Institution February 7, 2019
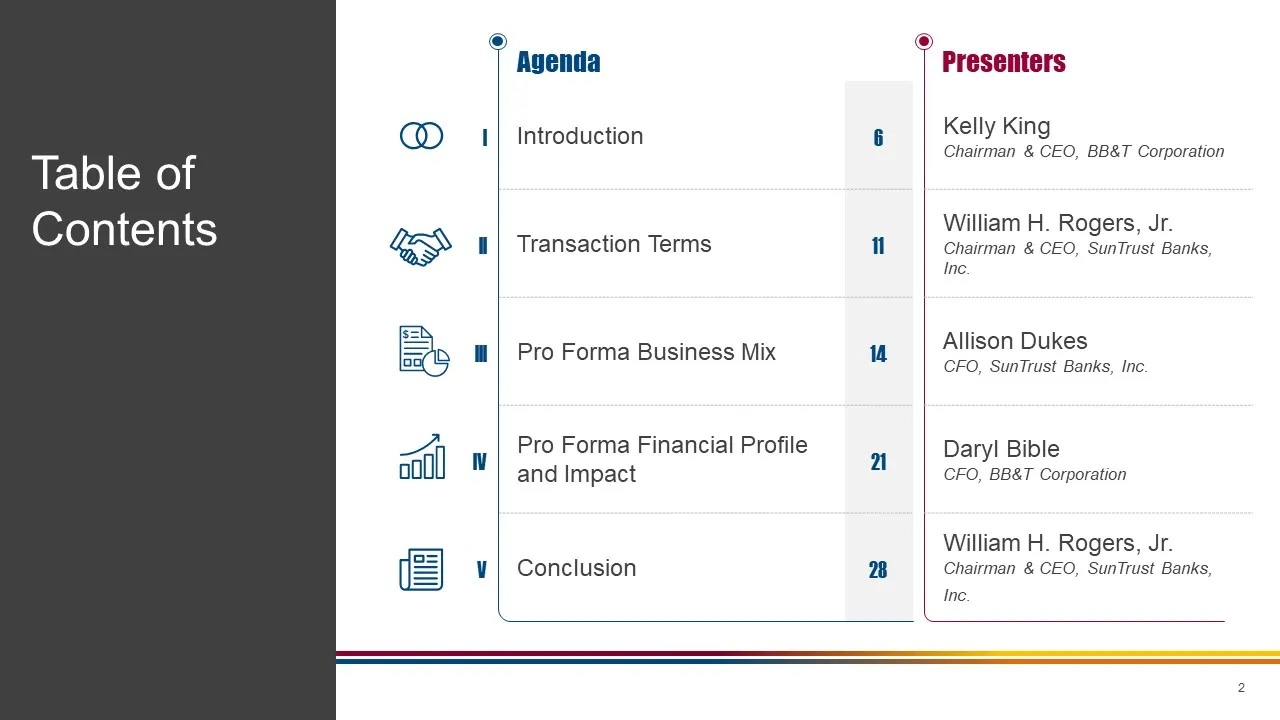
Slide 2: Agenda and Presenters
Introduction 6 Transaction Terms 11 Pro Forma Business Mix 14 Pro Forma Financial Profile and Impact 21 Conclusion 28 Agenda Presenters Kelly KingChairman & CEO, BB&T Corporation William H. Rogers, Jr.Chairman & CEO, SunTrust Banks, Inc. Allison DukesCFO, SunTrust Banks, Inc. Daryl BibleCFO, BB&T Co
Slide 3: Forward-Looking / Non-GAAP Statements
Forward-Looking / Non-GAAP Statements Cautionary Note Regarding Forward-Looking StatementsThis communication contains “forward-looking statements” within the meaning of the Private Securities Litigation Reform Act of 1995 regarding the financial condition, results of operations, business plans and t
Slide 4: Additional Statements
Additional Statements Additional Information about the Merger and Where to Find ItIn connection with the proposed merger with SunTrust, BB&T will file with the SEC a registration statement on Form S-4 to register the shares of BB&T’s capital stock to be issued in connection with the merger. The regi
Slide 5: Section I Introduction
Section I Introduction
Slide 6: Individually, Strong; Together, Best
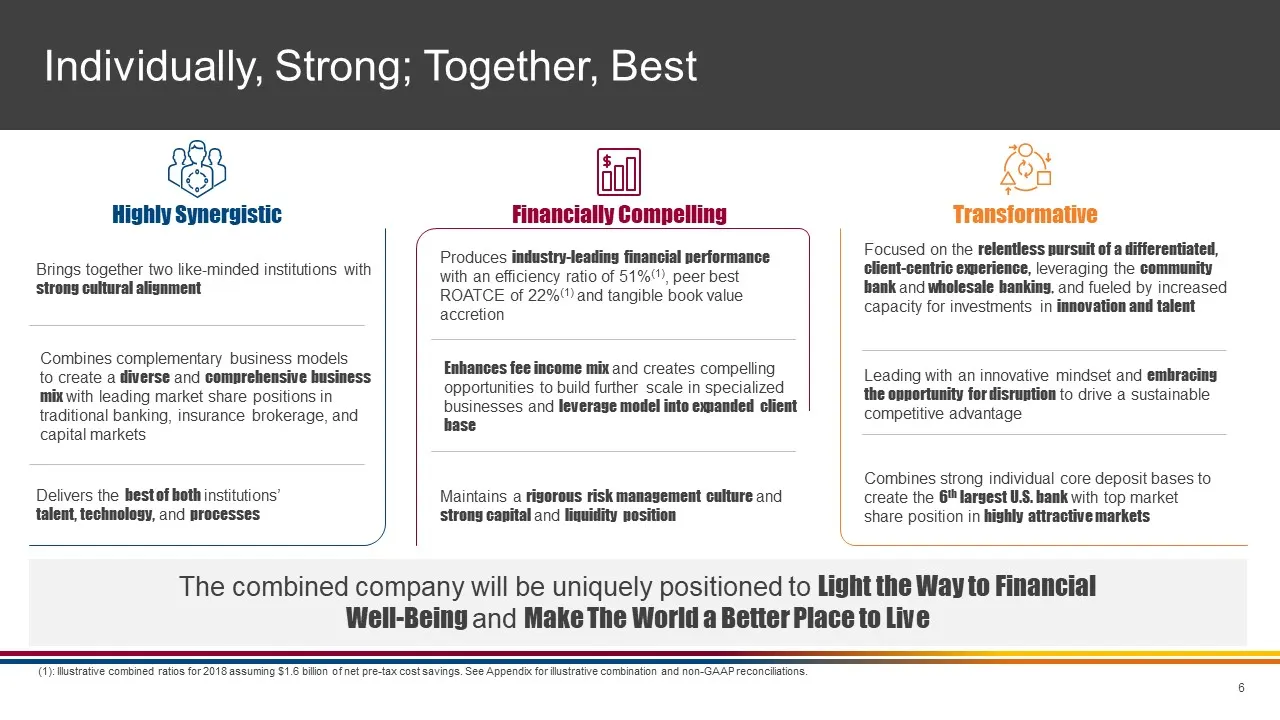
Individually, Strong; Together, Best Highly Synergistic Transformative Financially Compelling Brings together two like-minded institutions with strong cultural alignment Produces industry-leading financial performance with an efficiency ratio of 51%(1), peer best ROATCE of 22%(1) and tangible book v
Slide 7: Not just a merger of two legacy institutions; culture matters
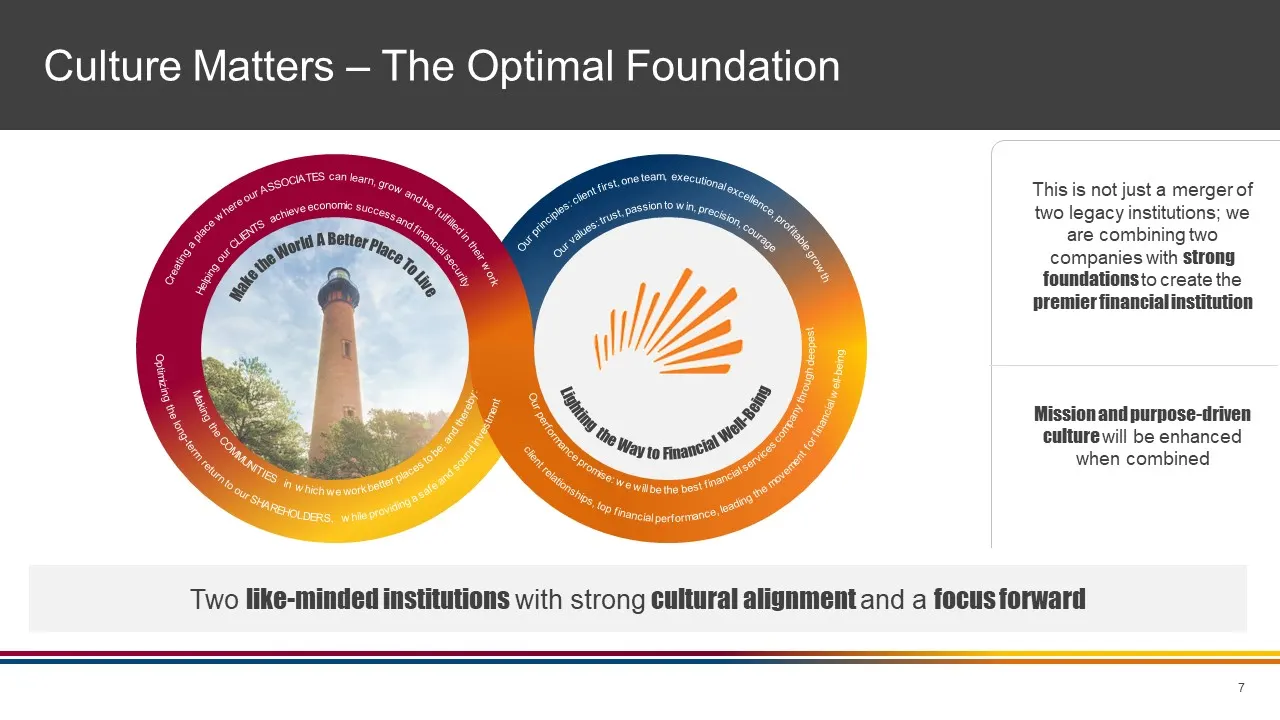
This is not just a merger of two legacy institutions; we are combining two companies with strong foundations to create the premier financial institutionMission and purpose-driven culture will be enhanced when combined client relationships, top financial performance, leading the movement for financia
Slide 8: A Powerful Combination
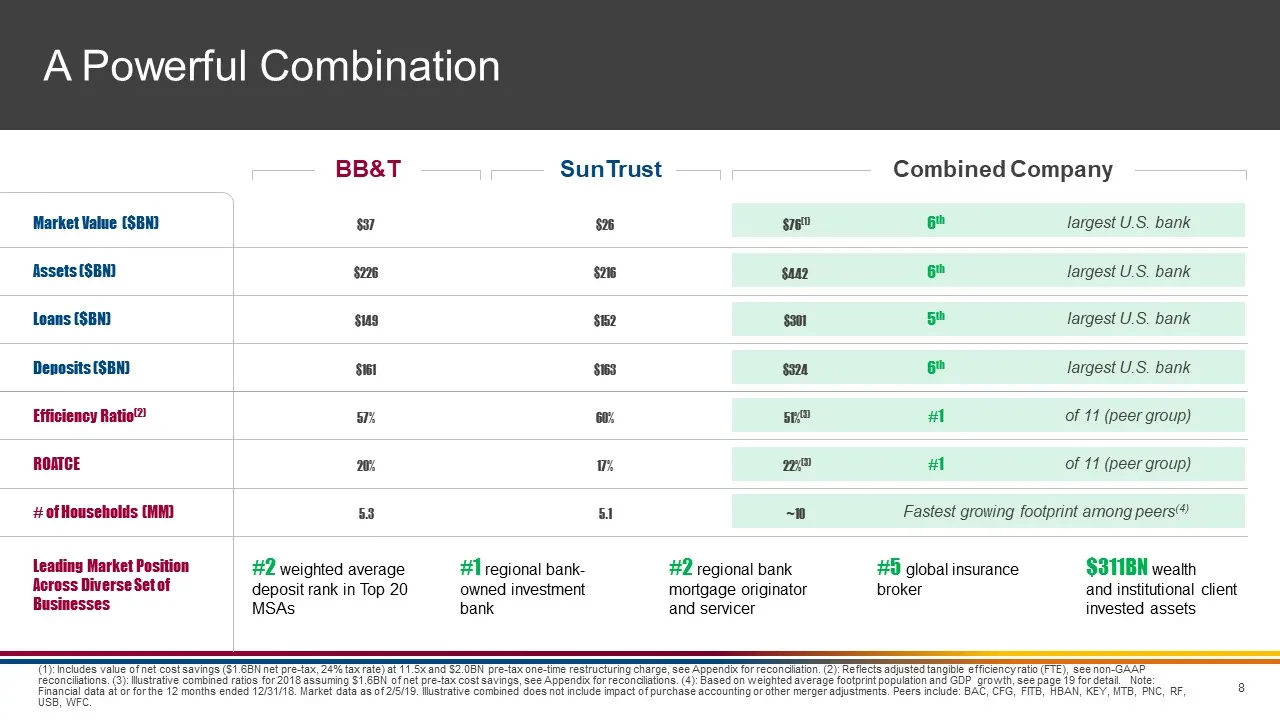
A Powerful Combination Efficiency Ratio(2) # of Households (MM) Leading Market Position Across Diverse Set of Businesses Market Value ($BN) Assets ($BN) Loans ($BN) Deposits ($BN) ROATCE Combined Company #2 weighted average deposit rank in Top 20 MSAs #1 regional bank-owned investment bank #2 region
Slide 9: Focused Forward on Transformational Digital Innovation
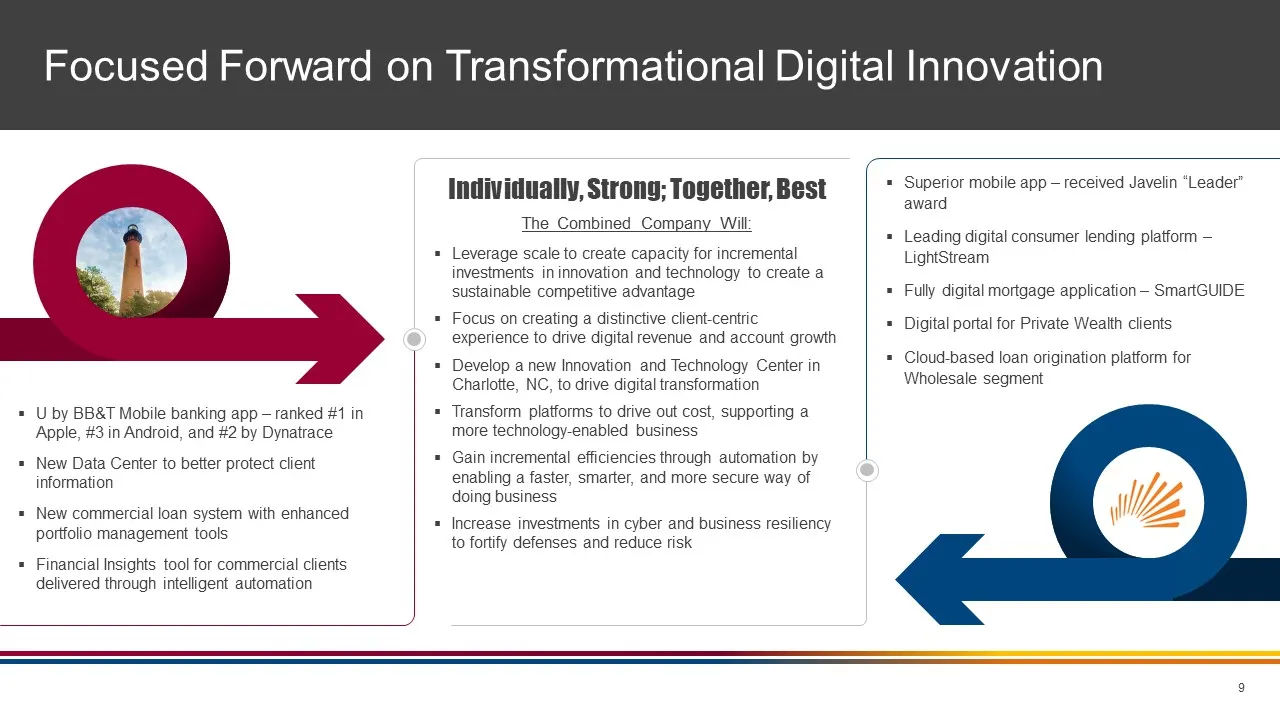
Focused Forward on Transformational Digital Innovation U by BB&T Mobile banking app – ranked #1 in Apple, #3 in Android, and #2 by DynatraceNew Data Center to better protect client informationNew commercial loan system with enhanced portfolio management toolsFinancial Insights tool for commercial cl
Slide 10: Section II Transaction Terms
Section II Transaction Terms
Slide 11: Merger of Equals Terms
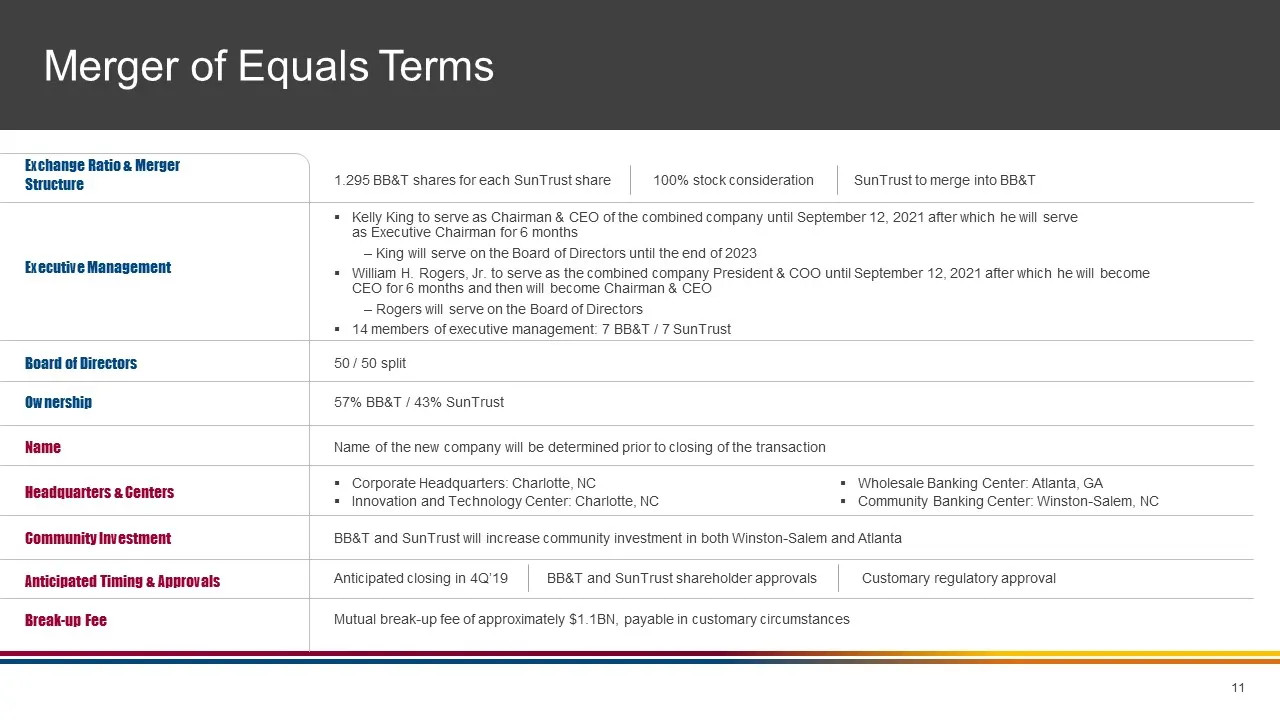
Merger of Equals Terms Name of the new company will be determined prior to closing of the transaction Name BB&T and SunTrust will increase community investment in both Winston-Salem and Atlanta Community Investment 50 / 50 split Board of Directors 57% BB&T / 43% SunTrust Ownership Break-up Fee Mutua
Slide 12: Complementary and Experienced Management Team
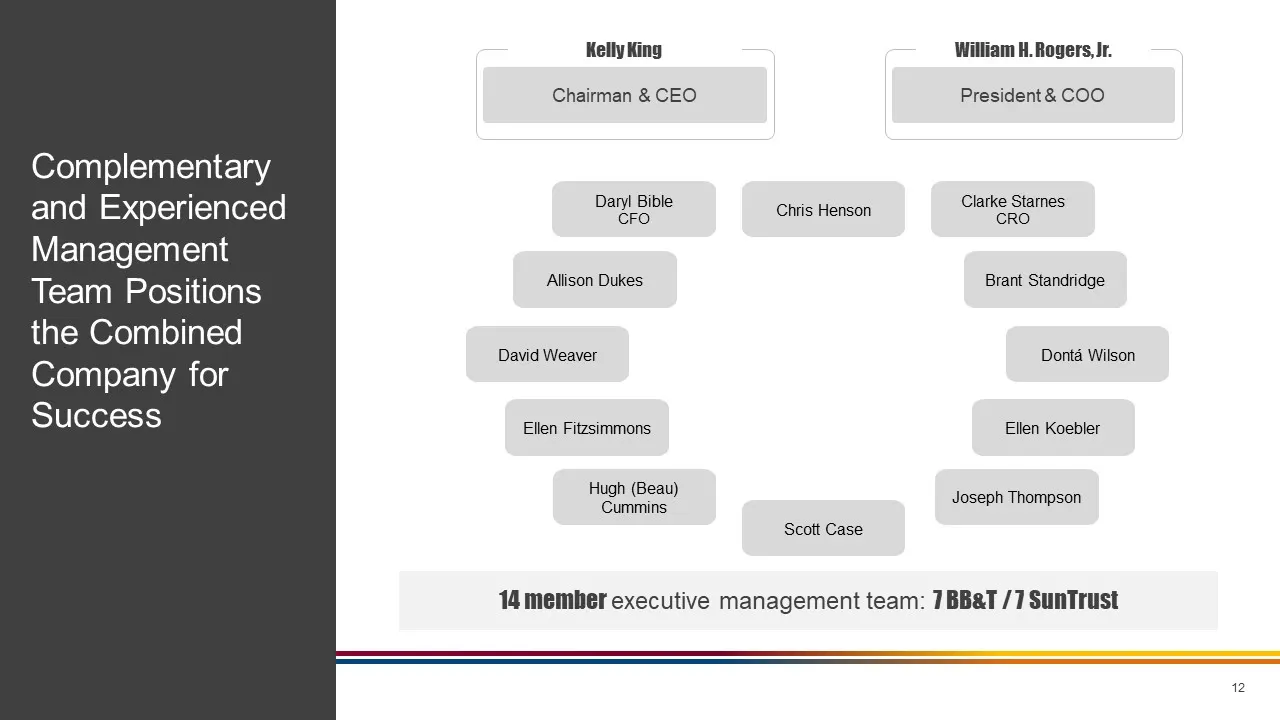
14 member executive management team: 7 BB&T / 7 SunTrust Kelly King Chairman & CEO William H. Rogers, Jr. President & COO Chris Henson Clarke StarnesCRO Brant Standridge Dontá Wilson Ellen Koebler Joseph Thompson Scott Case Hugh (Beau) Cummins Ellen Fitzsimmons David Weaver Allison Dukes Daryl Bible
Slide 13: Section III Pro Forma Business Mix
Section III Pro Forma Business Mix
Slide 14: Complementary and Diversified Business Mix
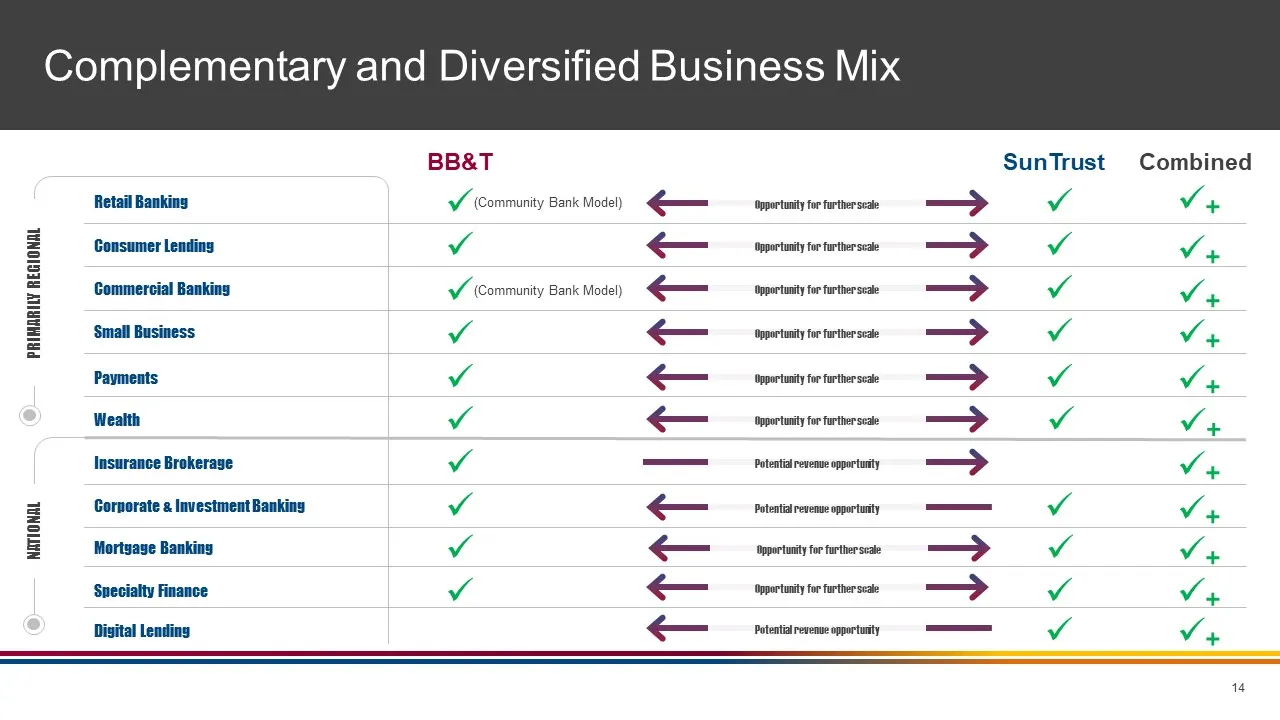
Complementary and Diversified Business Mix Retail Banking Consumer Lending Commercial Banking Small Business Payments Insurance Brokerage Corporate & Investment Banking BB&T SunTrust (Community Bank Model) (Community Bank Model) Specialty Finance Combined + + + + +
Slide 15: Differentiated and Diversified Revenue Streams
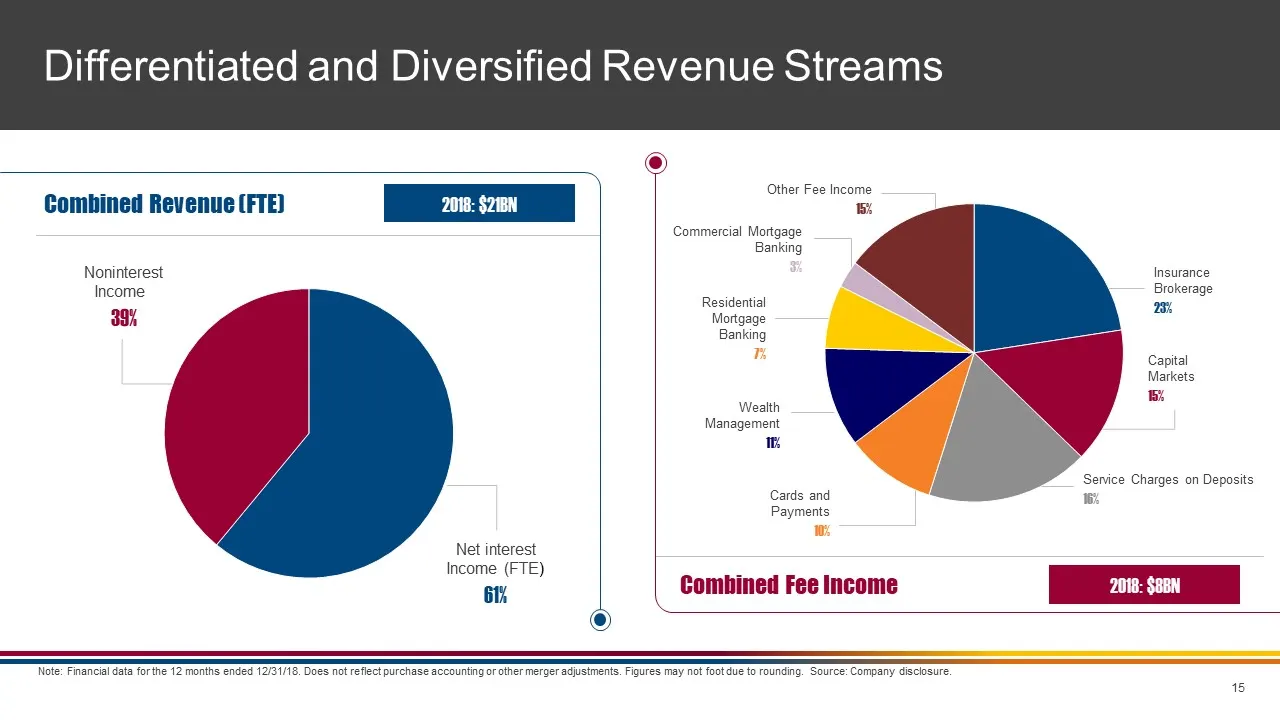
Differentiated and Diversified Revenue Streams Note: Financial data for the 12 months ended 12/31/18. Does not reflect purchase accounting or other merger adjustments. Figures may not foot due to rounding. Source: Company disclosure. Combined Revenue (FTE) Combined Fee Income Noninterest Income 39%
Slide 16: Diversified Balance Sheet
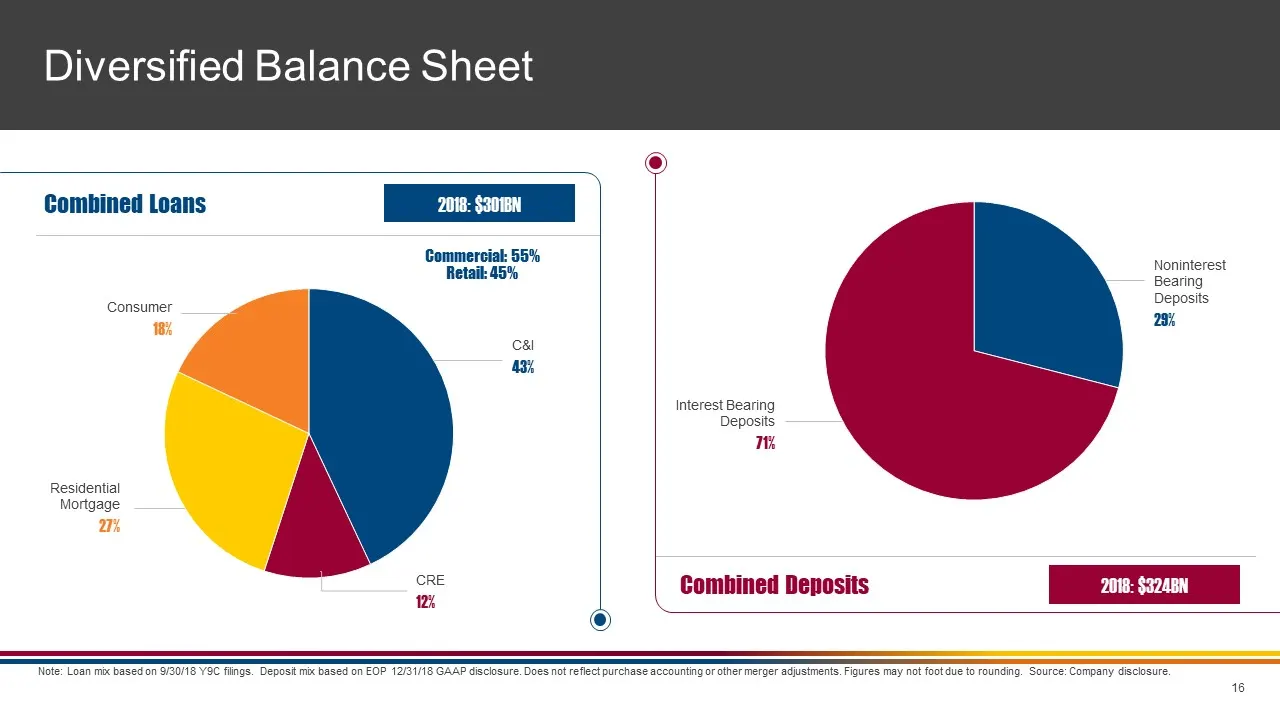
Diversified Balance Sheet Note: Loan mix based on 9/30/18 Y9C filings. Deposit mix based on EOP 12/31/18 GAAP disclosure. Does not reflect purchase accounting or other merger adjustments. Figures may not foot due to rounding. Source: Company disclosure. Noninterest Bearing Deposits29% C&I43% CRE12%
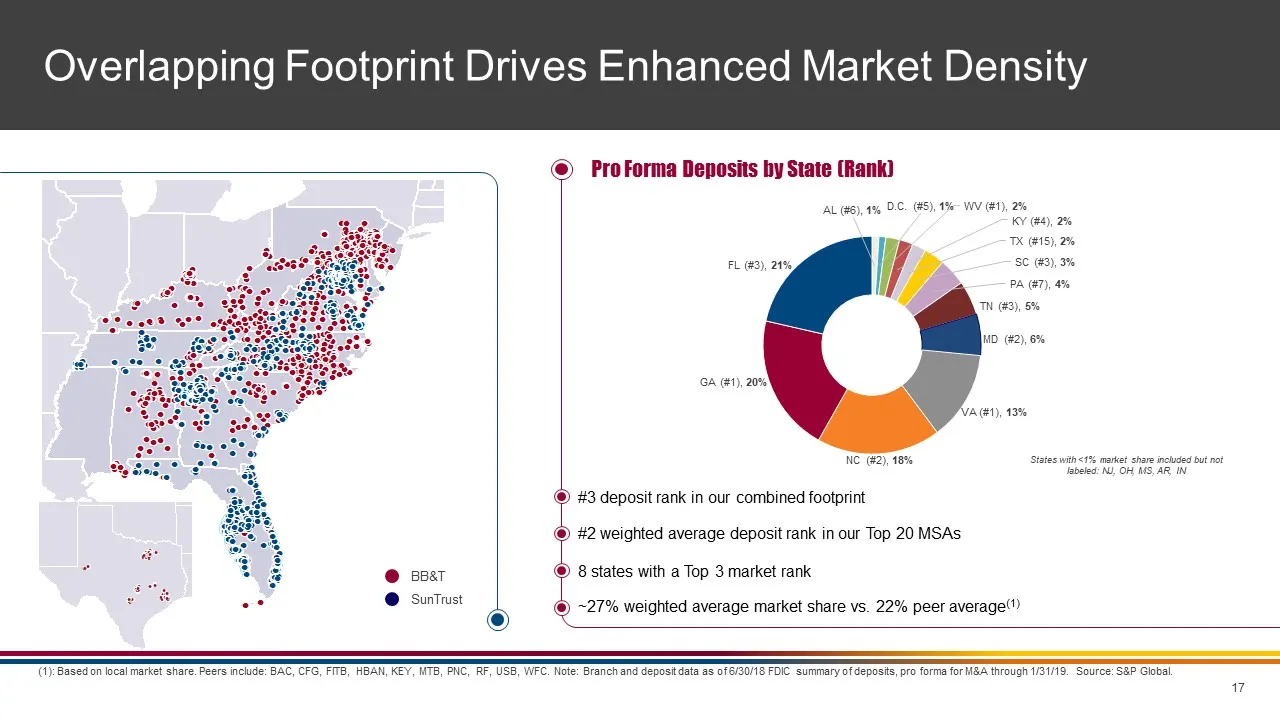
Slide 17: Overlapping Footprint Drives Enhanced Market Density
Overlapping Footprint Drives Enhanced Market Density (1): Based on local market share. Peers include: BAC, CFG, FITB, HBAN, KEY, MTB, PNC, RF, USB, WFC. Note: Branch and deposit data as of 6/30/18 FDIC summary of deposits, pro forma for M&A through 1/31/19. Source: S&P Global. BB&T SunTrust Pro Form
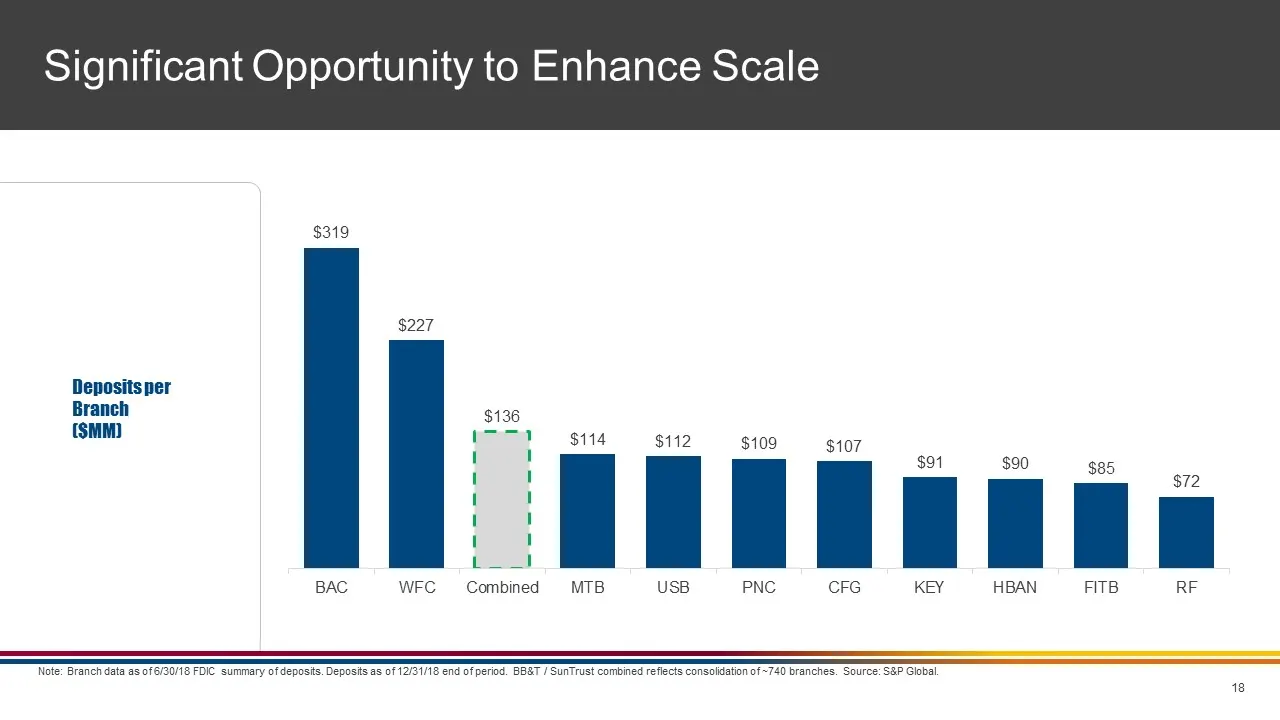
Slide 18: Significant Opportunity to Enhance Scale
Significant Opportunity to Enhance Scale Note: Branch data as of 6/30/18 FDIC summary of deposits. Deposits as of 12/31/18 end of period. BB&T / SunTrust combined reflects consolidation of ~740 branches. Source: S&P Global. Deposits per Branch ($MM)
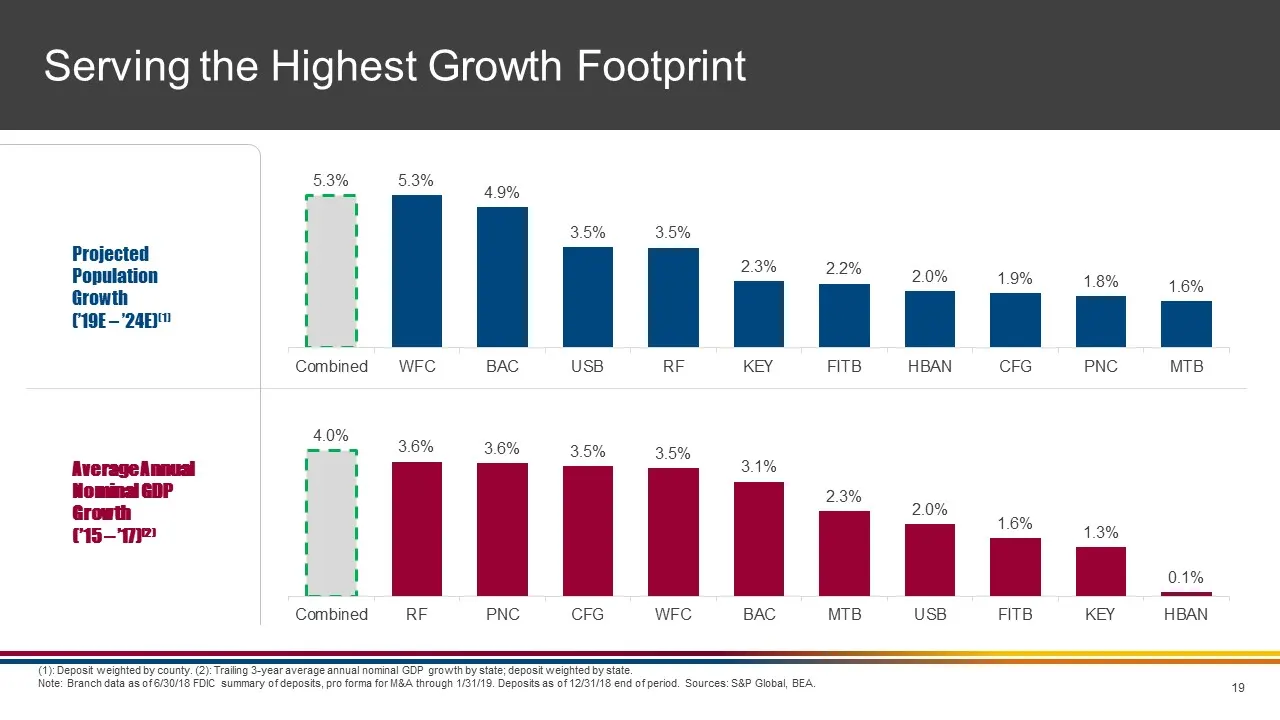
Slide 19: Serving the Highest Growth Footprint
Serving the Highest Growth Footprint (1): Deposit weighted by county. (2): Trailing 3-year average annual nominal GDP growth by state; deposit weighted by state. Note: Branch data as of 6/30/18 FDIC summary of deposits, pro forma for M&A through 1/31/19. Deposits as of 12/31/18 end of period. Source
Slide 20: Section IV Pro Forma Financial Profile and Impact
Section IV Pro Forma Financial Profile and Impact
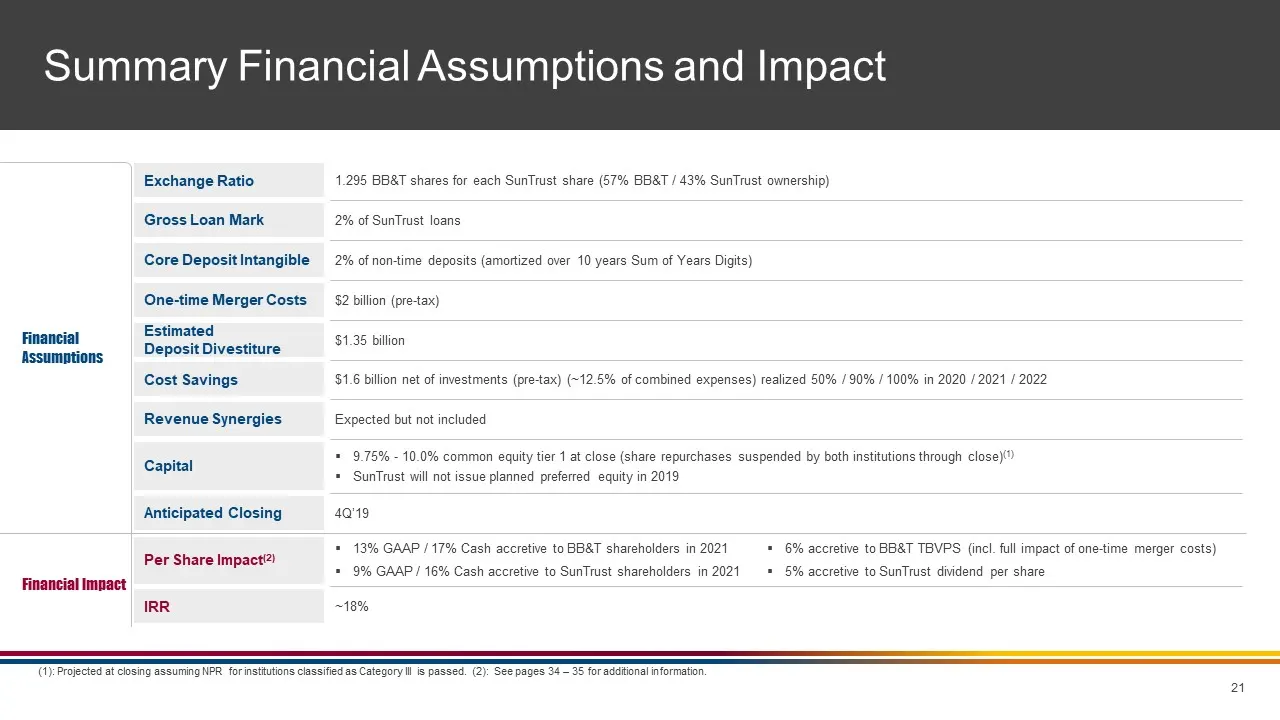
Slide 21: Summary Financial Assumptions and Impact
Capital Per Share Impact(2) Summary Financial Assumptions and Impact Financial Assumptions EstimatedDeposit Divestiture Cost Savings Revenue Synergies Exchange Ratio Gross Loan Mark Core Deposit Intangible One-time Merger Costs Anticipated Closing IRR 9.75% - 10.0% common equity tier 1 at close (sha
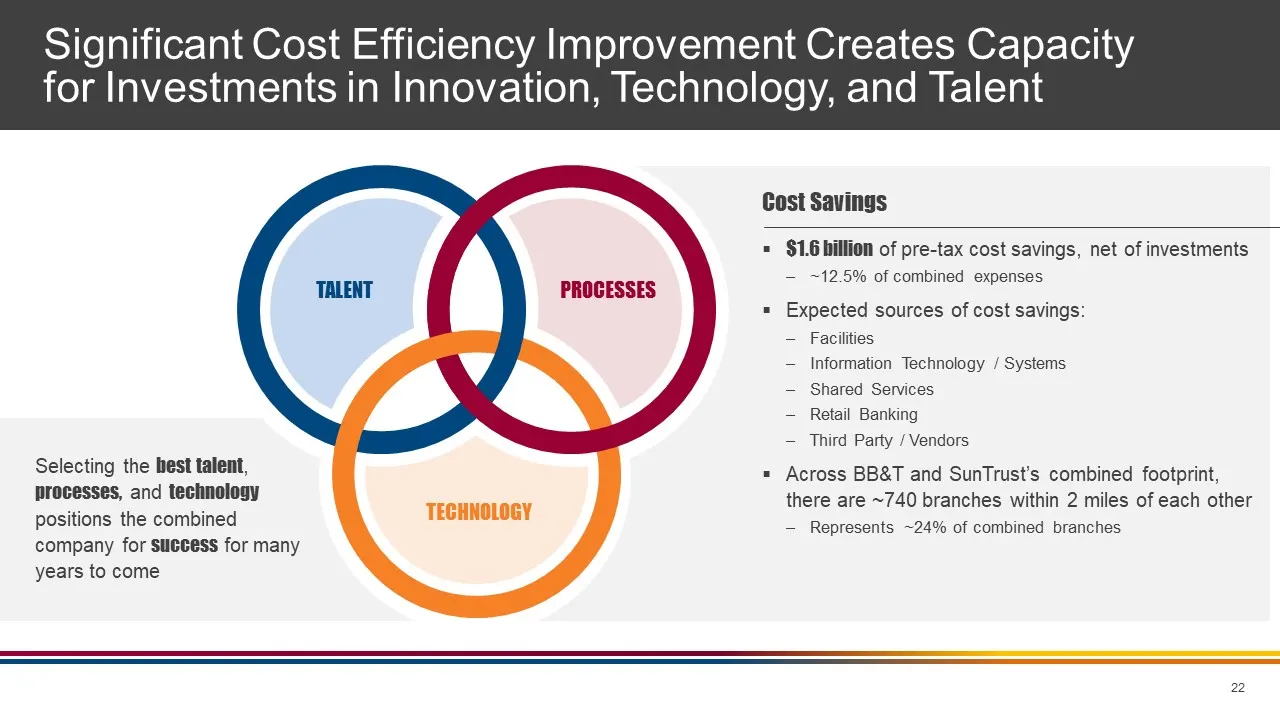
Slide 22: Significant Cost Efficiency Improvement
TALENT Selecting the best talent, processes, and technology positions the combined company for success for many years to come Significant Cost Efficiency Improvement Creates Capacity for Investments in Innovation, Technology, and Talent PROCESSES TECHNOLOGY Cost Savings$1.6 billion of pre-tax cost s
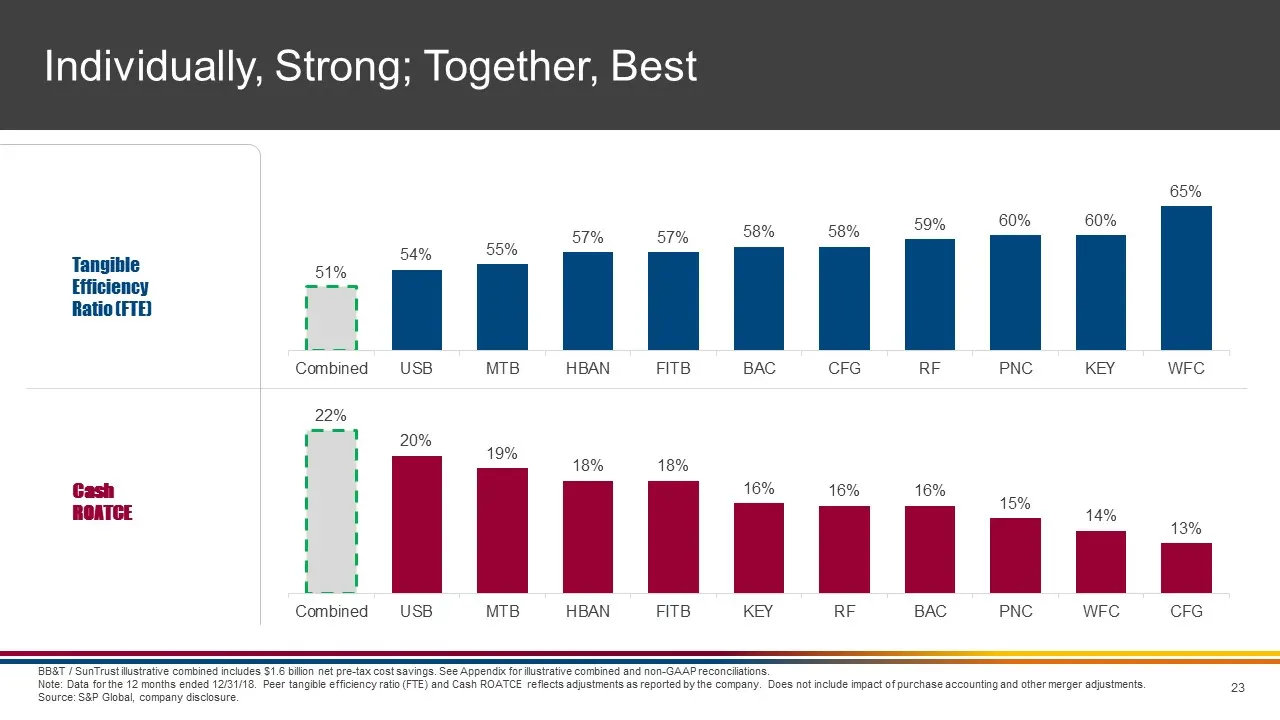
Slide 23: Individually, Strong; Together, Best
Individually, Strong; Together, Best BB&T / SunTrust illustrative combined includes $1.6 billion net pre-tax cost savings. See Appendix for illustrative combined and non-GAAP reconciliations.Note: Data for the 12 months ended 12/31/18. Peer tangible efficiency ratio (FTE) and Cash ROATCE reflects ad
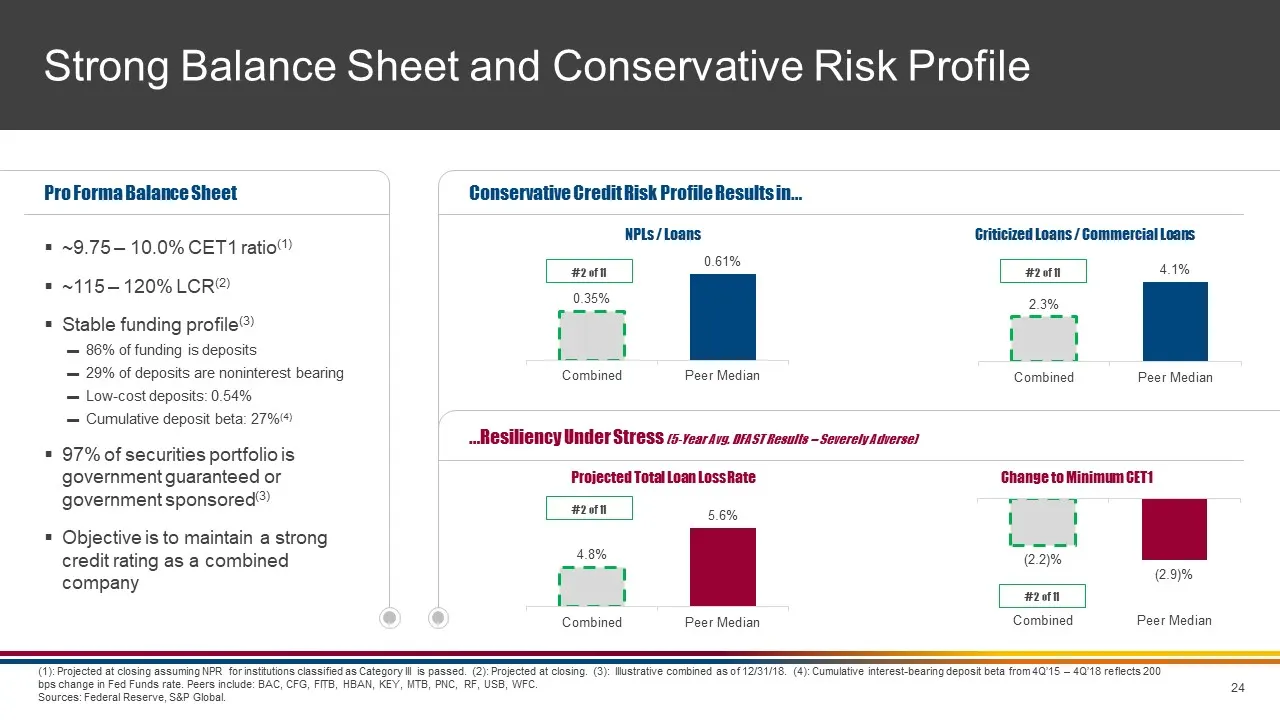
Slide 24: Strong Balance Sheet and Conservative Risk Profile
Strong Balance Sheet and Conservative Risk Profile (1): Projected at closing assuming NPR for institutions classified as Category III is passed. (2): Projected at closing. (3): Illustrative combined as of 12/31/18. (4): Cumulative interest-bearing deposit beta from 4Q’15 – 4Q’18 reflects 200 bps cha
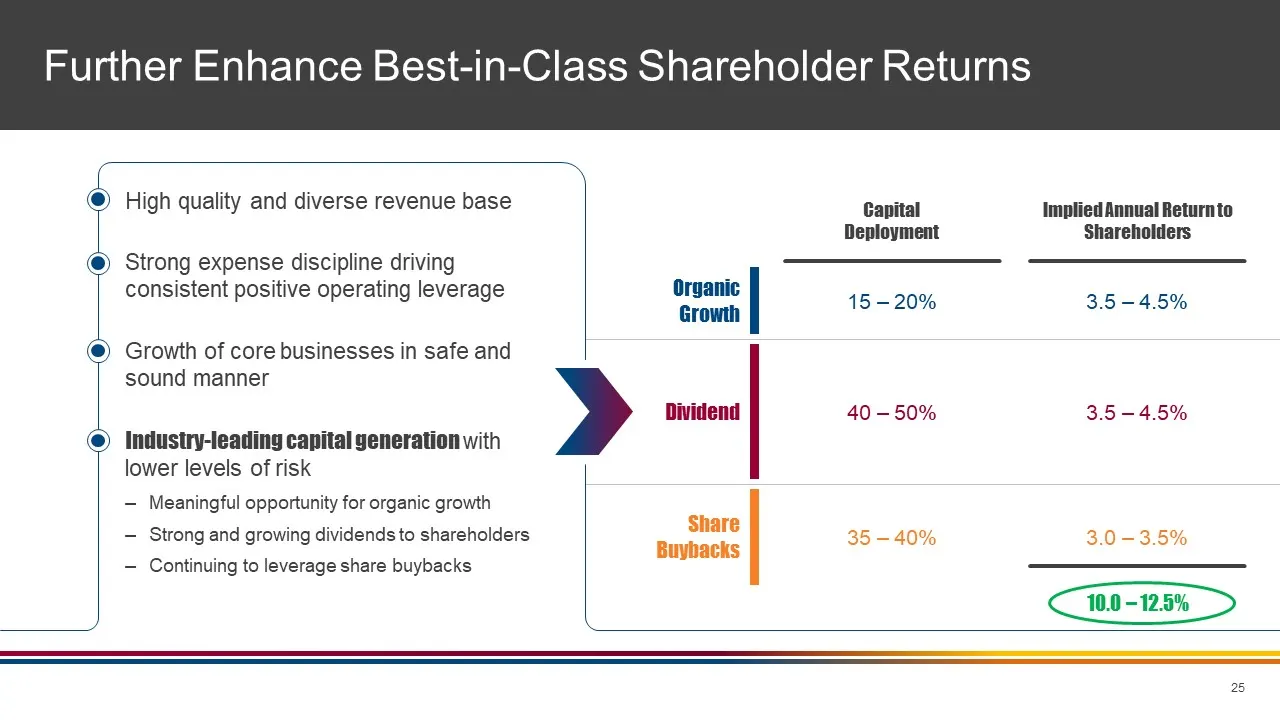
Slide 25: Further Enhance Best-in-Class Shareholder Returns
Further Enhance Best-in-Class Shareholder Returns High quality and diverse revenue base CapitalDeployment 15 – 20% 40 – 50% 35 – 40% Implied Annual Return to Shareholders 3.5 – 4.5% 3.5 – 4.5% 3.0 – 3.5% OrganicGrowth Dividend Share Buybacks 10.0 – 12.5% Strong expense discipline driving consistent
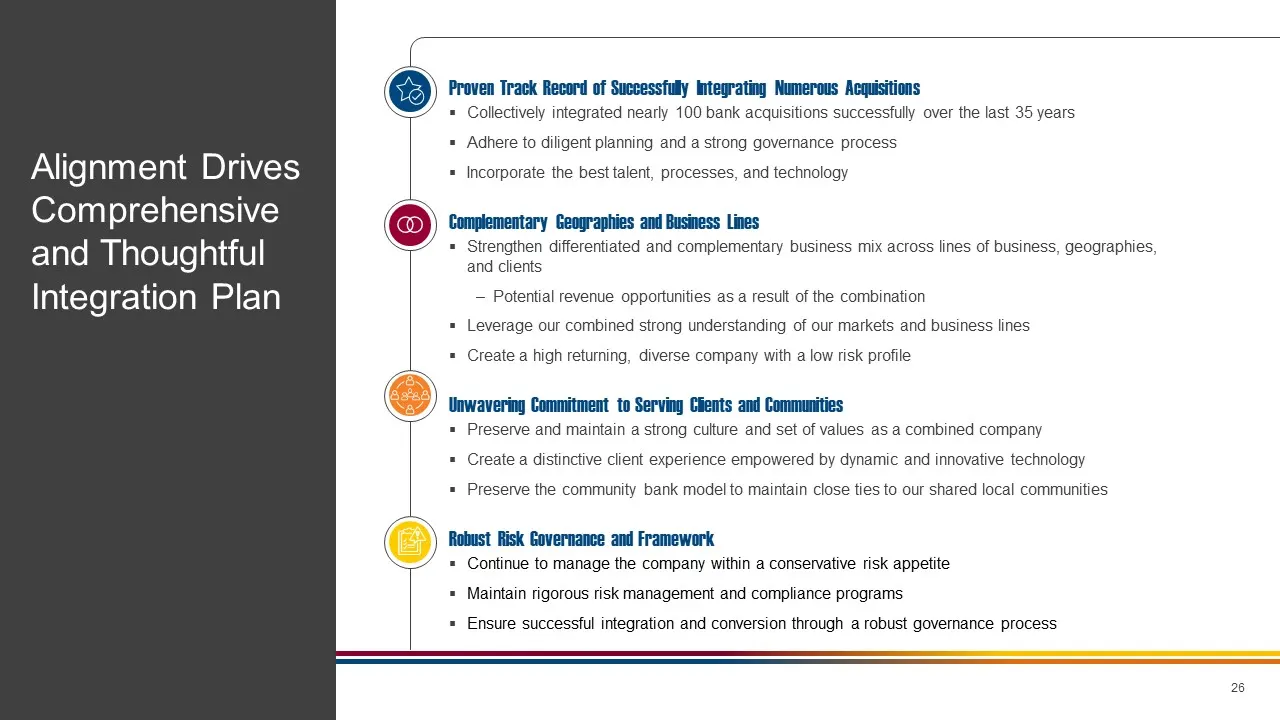
Slide 26: Proven Track Record of Successfully Integrating Acquisitions
Proven Track Record of Successfully Integrating Numerous AcquisitionsCollectively integrated nearly 100 bank acquisitions successfully over the last 35 yearsAdhere to diligent planning and a strong governance processIncorporate the best talent, processes, and technology Complementary Geographies and

Slide 27: Section V Conclusion
Section V Conclusion
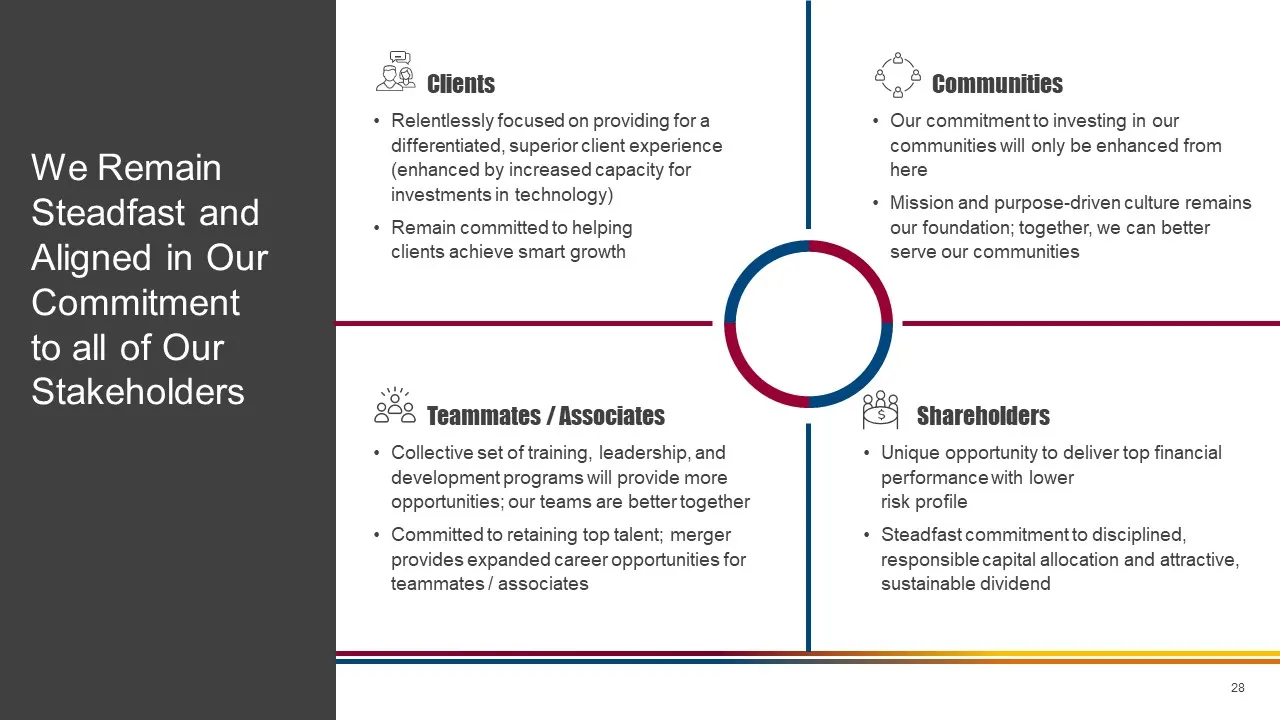
Slide 28: Steadfast and Aligned in Our Commitments
ClientsRelentlessly focused on providing for a differentiated, superior client experience (enhanced by increased capacity for investments in technology)Remain committed to helpingclients achieve smart growth CommunitiesOur commitment to investing in our communities will only be enhanced from hereMis
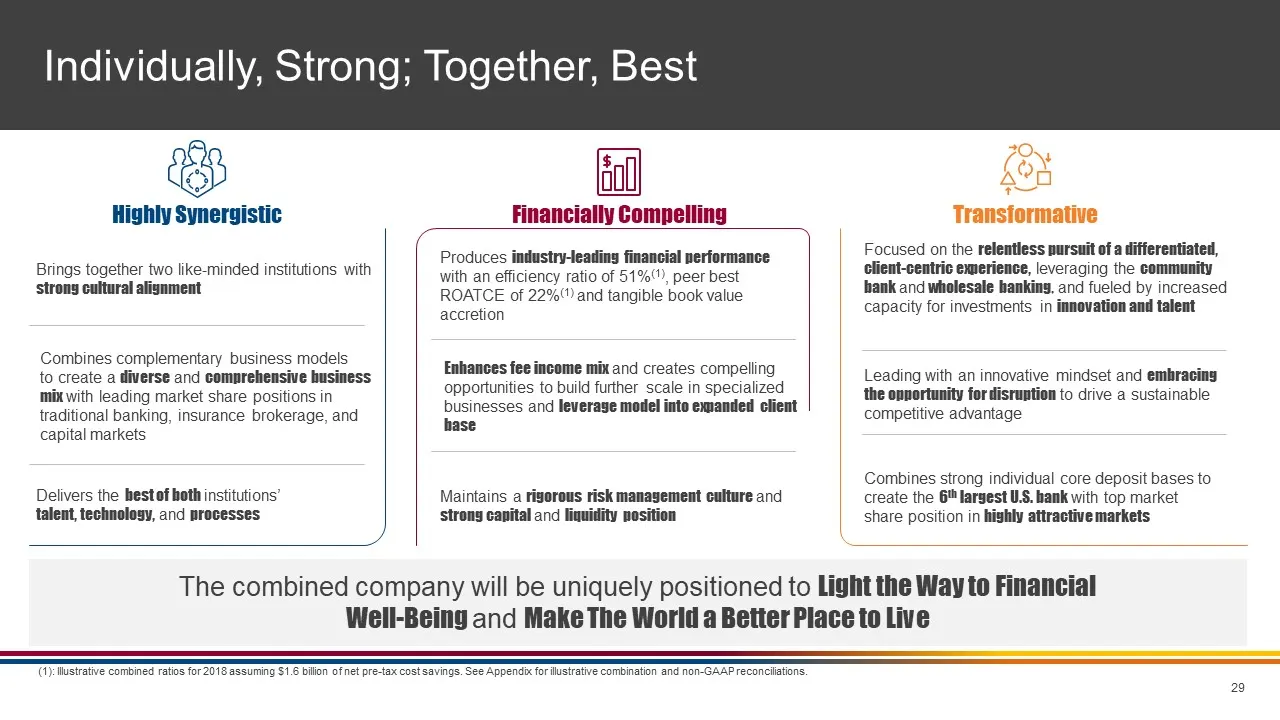
Slide 29: Individually, Strong; Together, Best
Individually, Strong; Together, Best (1): Illustrative combined ratios for 2018 assuming $1.6 billion of net pre-tax cost savings. See Appendix for illustrative combination and non-GAAP reconciliations. Highly Synergistic Transformative Financially Compelling Brings together two like-minded institut
Slide 30: Appendix
Appendix
Slide 31: Combined Deposits by MSA
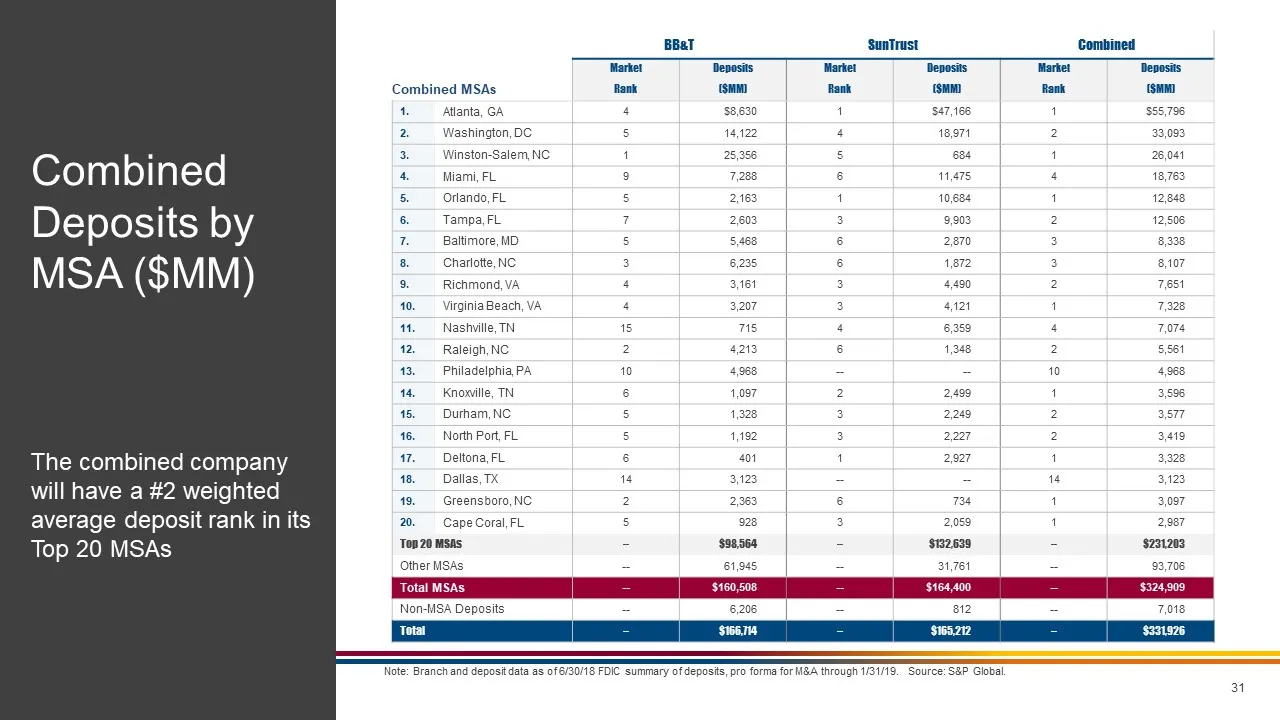
Note: Branch and deposit data as of 6/30/18 FDIC summary of deposits, pro forma for M&A through 1/31/19. Source: S&P Global. Combined Deposits by MSA ($MM) BB&T SunTrust Combined Market Deposits Market Deposits Market Deposits Combined MSAs Rank ($MM) Rank ($MM) Rank ($MM) 1. Atlanta, GA 4 $8,630 1
Slide 32: Illustrative Combined 2018 Efficiency Ratio / ROATCE
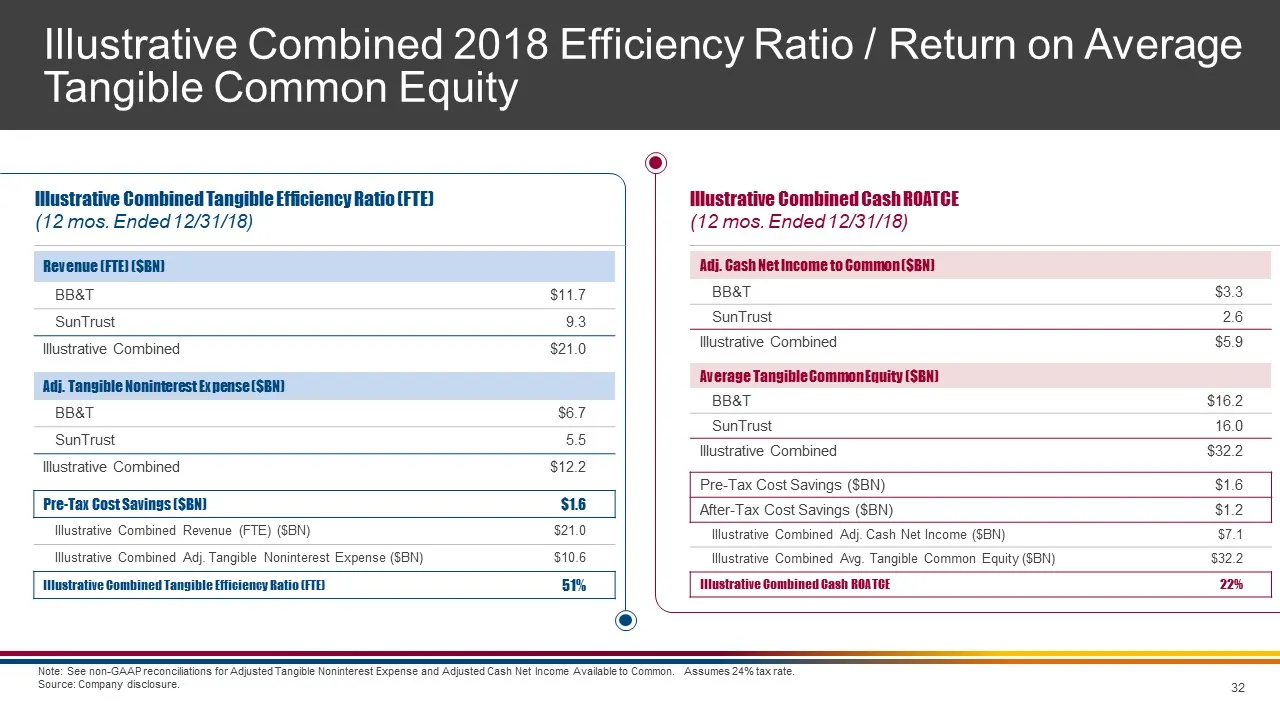
Illustrative Combined 2018 Efficiency Ratio / Return on Average Tangible Common Equity Note: See non-GAAP reconciliations for Adjusted Tangible Noninterest Expense and Adjusted Cash Net Income Available to Common. Assumes 24% tax rate.Source: Company disclosure. Illustrative Combined Tangible Effici
Slide 33: Illustrative Combined Market Value
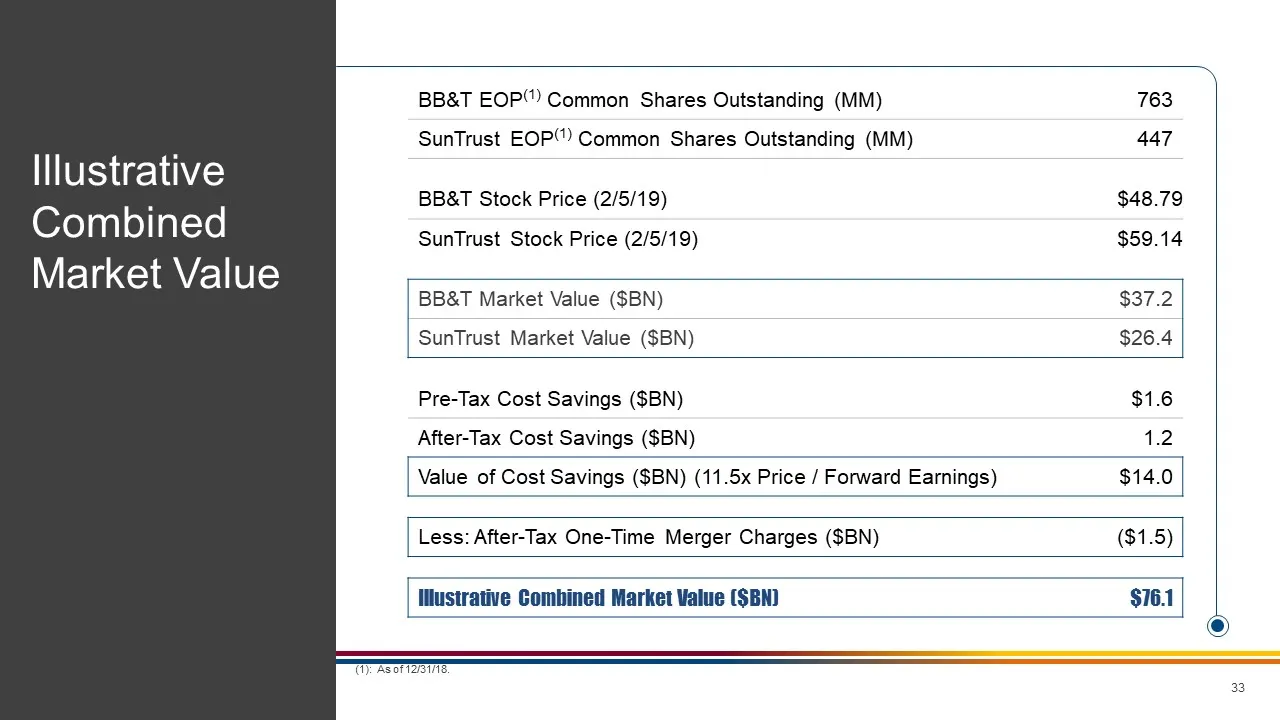
BB&T EOP(1) Common Shares Outstanding (MM) 763 SunTrust EOP(1) Common Shares Outstanding (MM) 447 BB&T Stock Price (2/5/19) $48.79 SunTrust Stock Price (2/5/19) $59.14 BB&T Market Value ($BN) $37.2 SunTrust Market Value ($BN) $26.4 Pre-Tax Cost Savings ($BN) $1.6 After-Tax Cost Savings ($BN) 1.2 Val
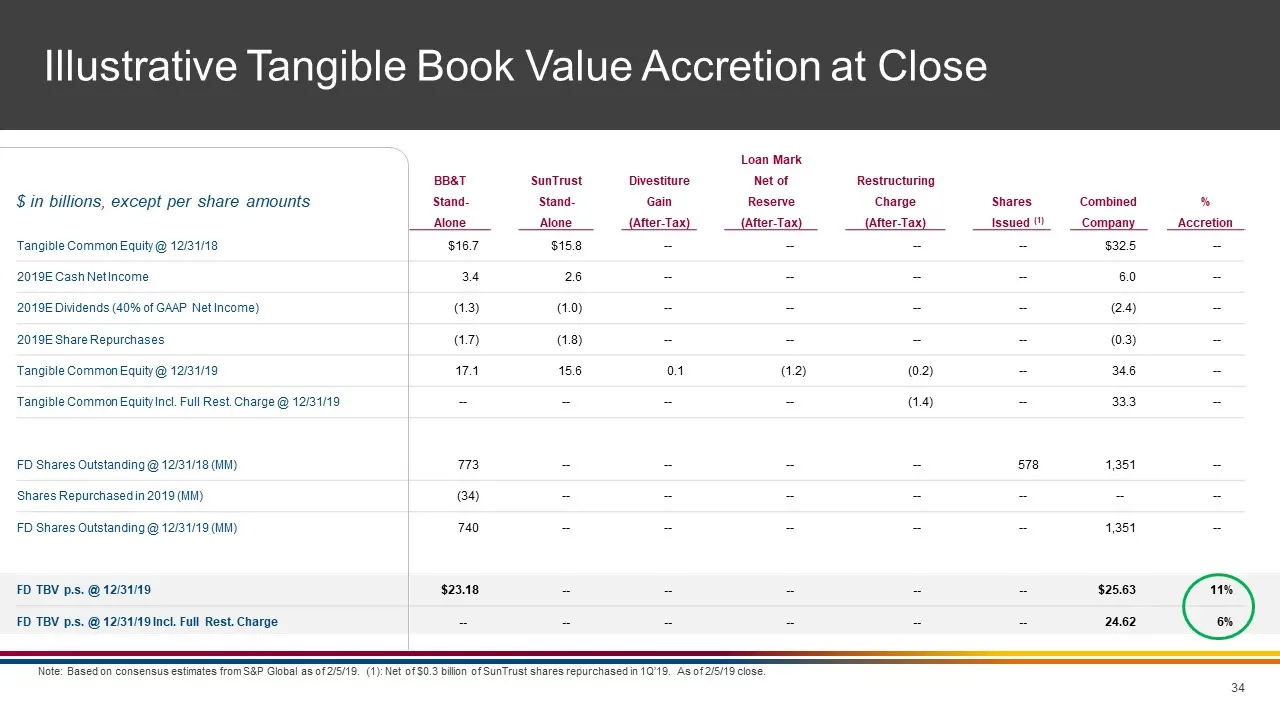
Slide 34: Tangible Book Value Per Share Impact
Loan Mark BB&T SunTrust Divestiture Net of Restructuring Stand- Stand- Gain Reserve Charge Shares Combined % Alone Alone (After-Tax) (After-Tax) (After-Tax) Issued (1) Company Accretion Tangible Common Equity @ 12/31/18 $16.7 $15.8 -- -- -- -- $32.5 -- 2019E Cash Net Income 3.4 2.6 -- -- -- -- 6.0 -
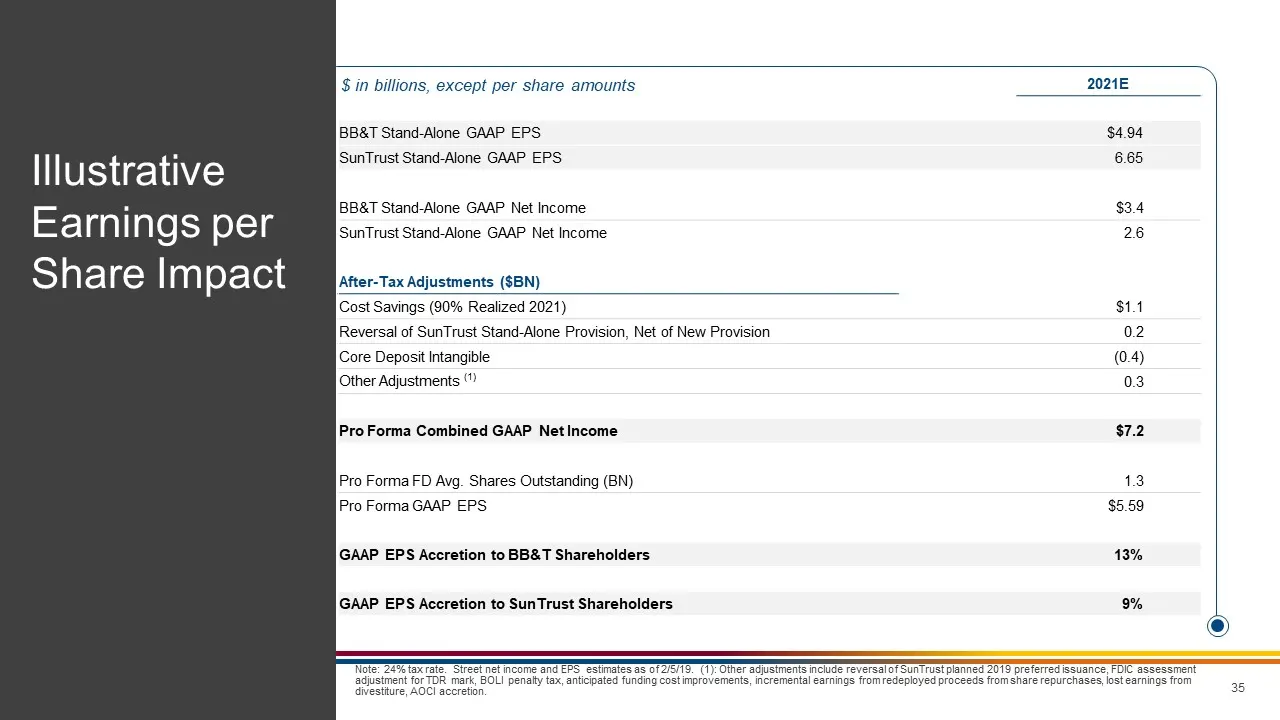
Slide 35: Illustrative Earnings per Share Impact
Illustrative Earnings per Share Impact 2021E BB&T Stand-Alone GAAP EPS $4.94 SunTrust Stand-Alone GAAP EPS 6.65 BB&T Stand-Alone GAAP Net Income $3.4 SunTrust Stand-Alone GAAP Net Income 2.6 After-Tax Adjustments ($BN) Cost Savings (90% Realized 2021) $1.1 Reversal of SunTrust Stand-Alone Provision,
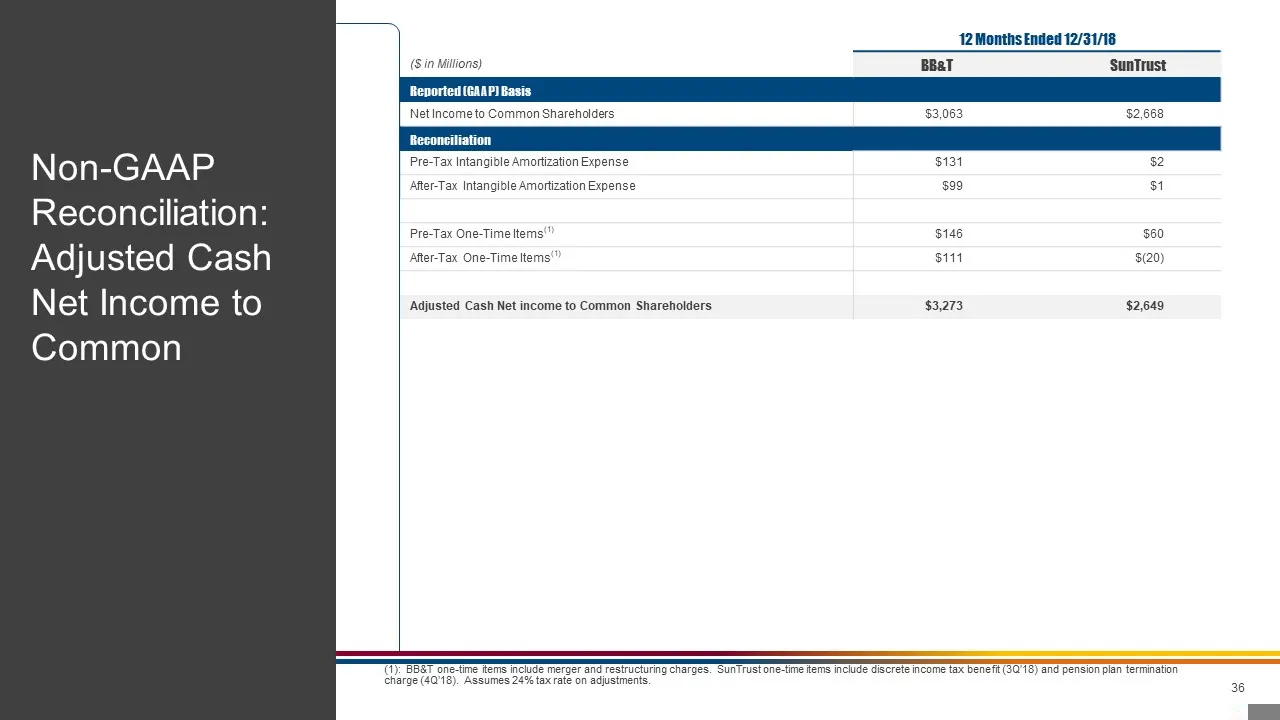
Slide 36: Non-GAAP Reconciliation: Adjusted Cash Net Income to Common
(1): BB&T one-time items include merger and restructuring charges. SunTrust one-time items include discrete income tax benefit (3Q’18) and pension plan termination charge (4Q’18). Assumes 24% tax rate on adjustments. Non-GAAP Reconciliation: Adjusted Cash Net Income to Common 12 Months Ended 12/31/1
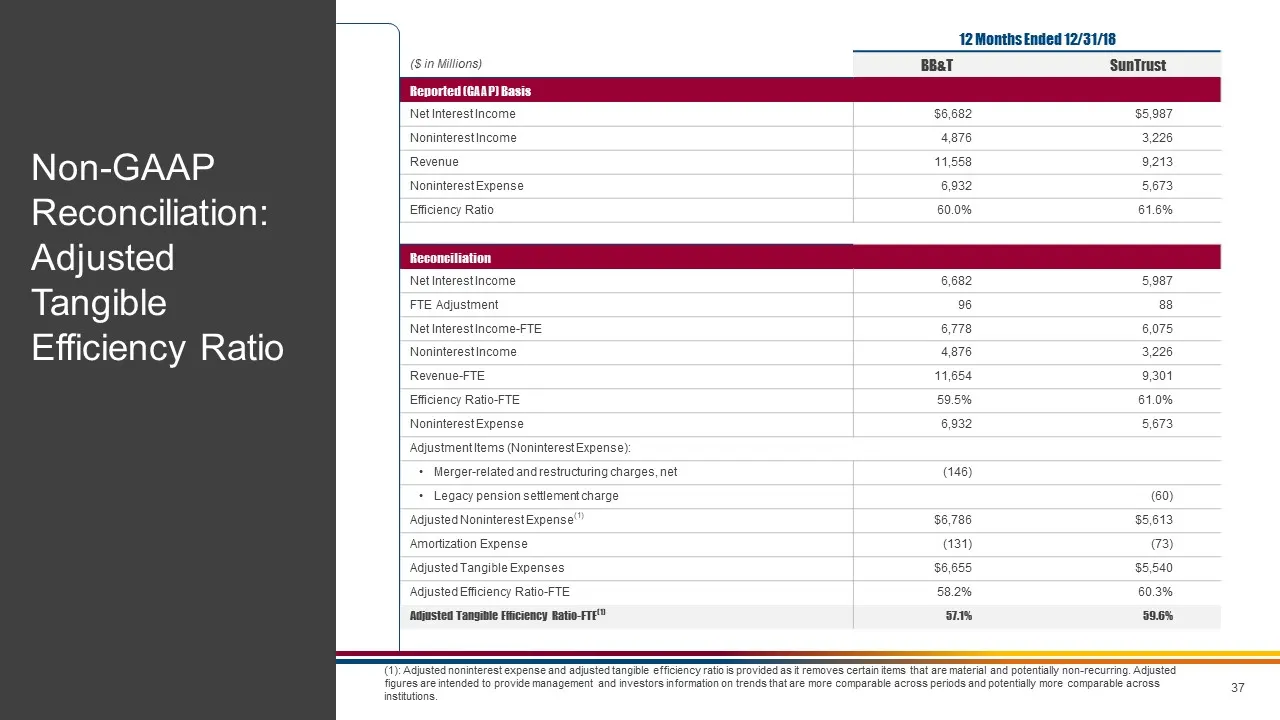
Slide 37: Non-GAAP Reconciliation: Adjusted Tangible Efficiency Ratio
(1): Adjusted noninterest expense and adjusted tangible efficiency ratio is provided as it removes certain items that are material and potentially non-recurring. Adjusted figures are intended to provide management and investors information on trends that are more comparable across periods and potent

Slide 38: Transformational Merger of Equals to Create The Premier Financial Institution
Transformational Merger of Equals to Create The Premier Financial Institution www.thepremierfinancialinstitution.com
Source: SEC EDGAR · 425 filed Feb 7, 2019
More decks from SunTrust Banks Inc
 Q3 2019 Earnings Presentation21 slides · Oct 17, 2019
 Q2 2019 Earnings Presentation22 slides · Jul 18, 2019
 Q1 2019 Earnings Presentation22 slides · Apr 18, 2019
 Q4 2018 Earnings Presentation23 slides · Jan 18, 2019
 2018 Goldman Sachs US Financial Services Conference30 slides · Dec 4, 2018
 2018 Association of Boston Bancanalysts Conference24 slides · Nov 8, 2018