SunTrust Banks — 2018 Association of Boston Bancanalysts Conference
24 slides from SunTrust Banks's conference presentation, Nov 8, 2018
Slide 1: 2018 Association of Boston Bancanalysts Conference
R: 245 G: 128 B: 37 R: 255 Orange G: 164 B: 0 R: 0 G: 70 B: 127 R: 94 G: 149 B: 210 2018 BANCANALYSTS R: 173 G: 201 Blue B: 232 ASSOCIATION OF BOSTON R: 222 G: 233 B: 245 CONFERENCE R: 47 Beau Cummins, Co-Chief Operating Officer G: 104 B: 167 November 8, 2018 R: 92 G: 92 B: 92 R: 127 G: 127 Grey B:
Slide 2: Important Cautionary Statement
R: 245 G: 128 B: 37 IMPORTANT CAUTIONARY STATEMENT R: 255 Orange G: 164 B: 0 The following should be read in conjunction with the financial statements, notes and other information contained in the Company’s 2017 Annual Report on Form 10-K, Quarterly Reports on Form 10-Q, and Current Reports on Form
Slide 3: SunTrust Overview
R: 245 G: 128 B: 37 R: 255 Orange G: 164 B: 0 R: 0 G: 70 B: 127 R: 94 G: 149 B: 210 R: 173 G: 201 Blue B: 232 SUNTRUST OVERVIEW R: 222 G: 233 B: 245 R: 47 G: 104 B: 167 R: 92 G: 92 B: 92 R: 127 G: 127 Grey B: 127 R: 190 G: 190 B: 190 R: 0 G: 176 B: 80 Other
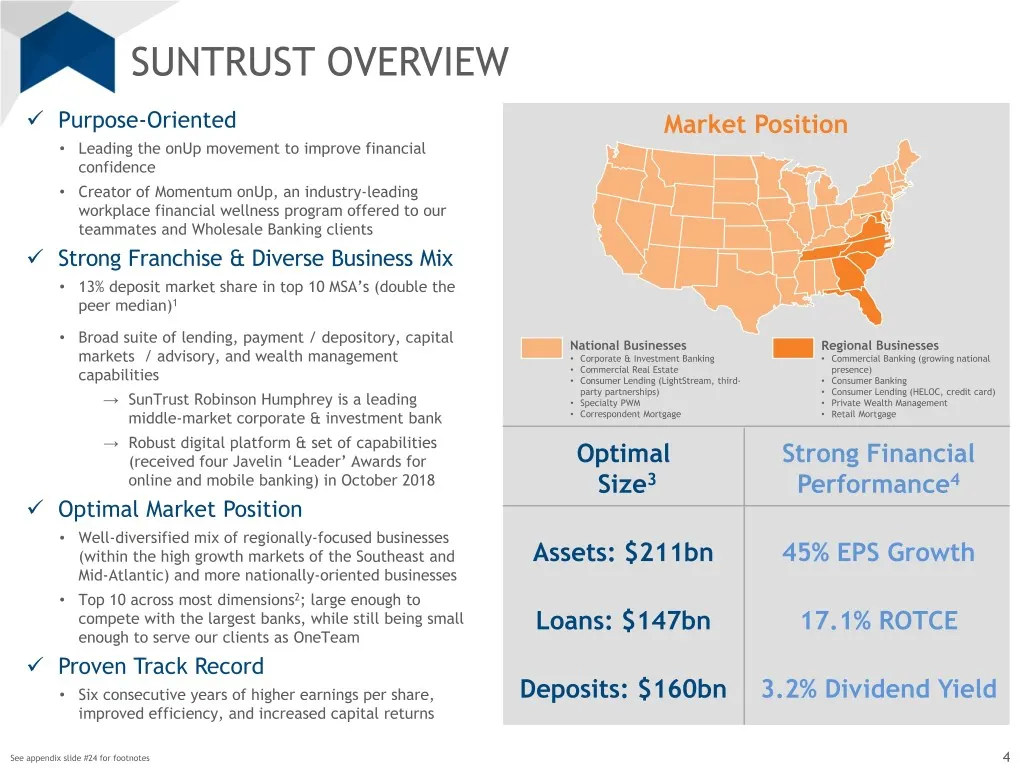
Slide 4: SunTrust Overview
R: 245 G: 128 B: 37 SUNTRUST OVERVIEW R: 255 Orange G: 164 B: 0 Purpose-Oriented Market Position R: 0 • Leading the onUp movement to improve financial G: 70 confidence B: 127 • Creator of Momentum onUp, an industry-leading R: 94 workplace financial wellness program offered to our G: 149 teammates
Slide 5: Investment Thesis
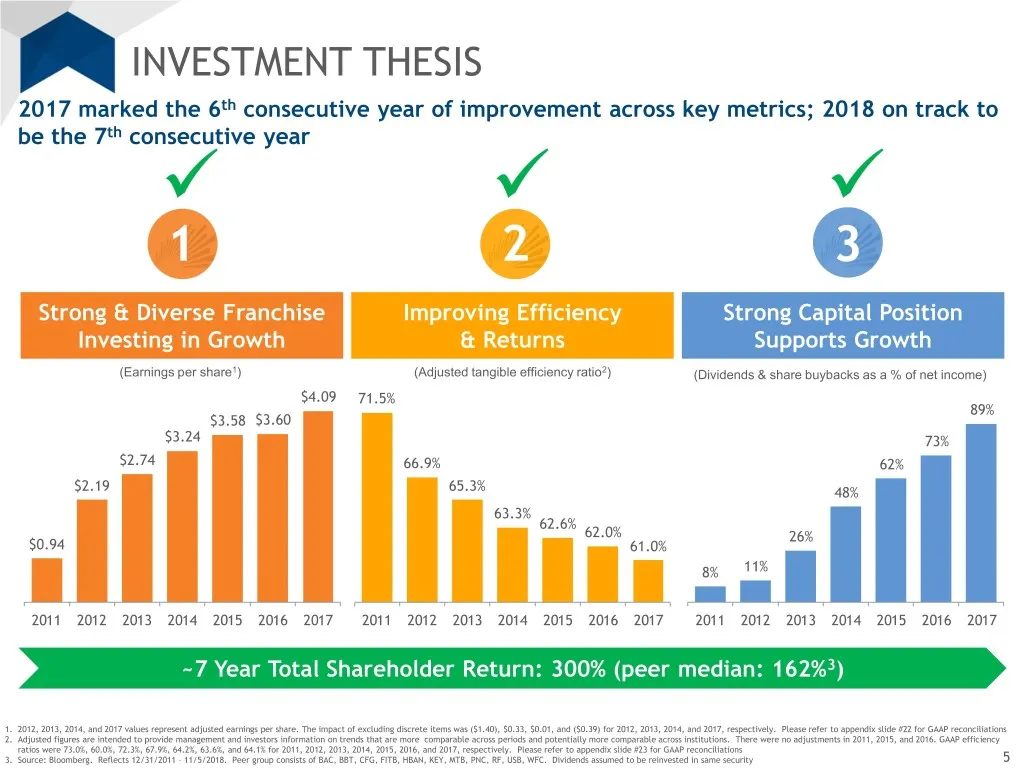
R: 245 G: 128 B: 37 INVESTMENT THESIS R: 255 Orange G: 164 th B: 0 2017 marked the 6 consecutive year of improvement across key metrics; 2018 on track to be the 7th consecutive year R: 0 G: 70 B: 127 R: 94 G: 149 B: 210 1 2 3 R: 173 G: 201 Blue B: 232 Strong & Diverse Franchise Improving Effic
Slide 6: Wholesale Banking Overview
R: 245 G: 128 B: 37 R: 255 Orange G: 164 B: 0 R: 0 G: 70 B: 127 R: 94 G: 149 B: 210 R: 173 G: 201 Blue B: 232 WHOLESALE BANKING R: 222 G: 233 B: 245 OVERVIEW R: 47 G: 104 B: 167 R: 92 G: 92 B: 92 R: 127 G: 127 Grey B: 127 R: 190 G: 190 B: 190 R: 0 G: 176 B: 80 Other
Slide 7: Wholesale Banking Overview
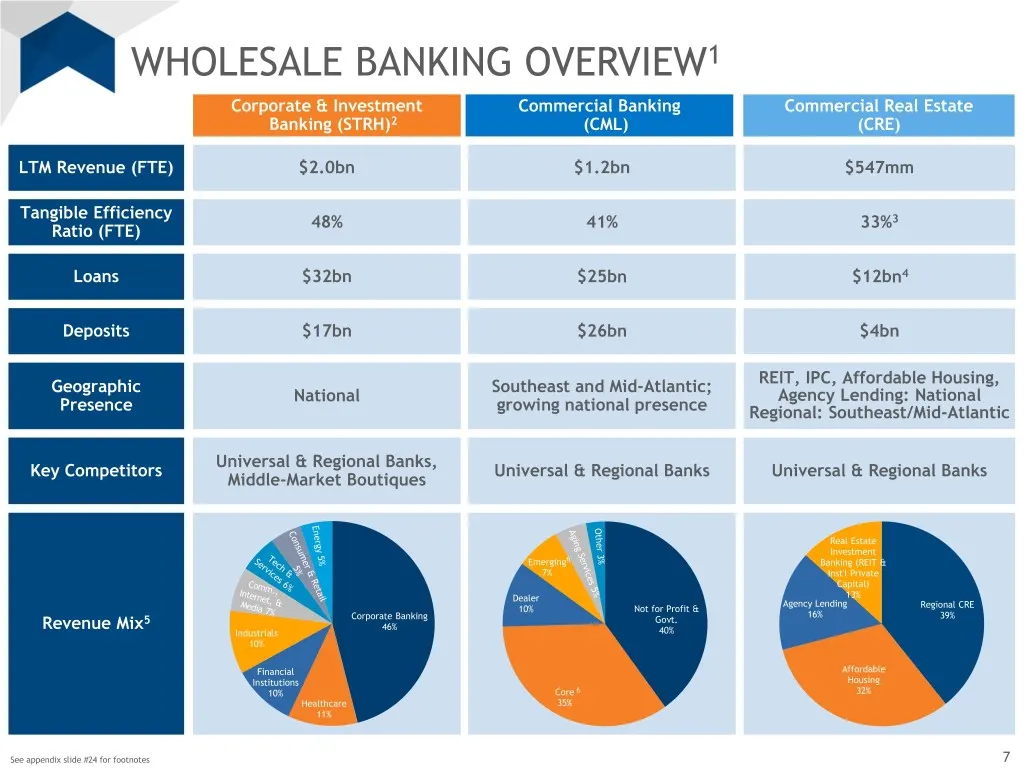
R: 245 G: 128 B: 37 WHOLESALE BANKING OVERVIEW1 R: 255 Orange G: 164 B: 0 Corporate & Investment Commercial Banking Commercial Real Estate Banking (STRH)2 (CML) (CRE) R: 0 G: 70 LTM Revenue (FTE) $2.0bn $1.2bn $547mm B: 127 Tangible Efficiency R: 94 48% 41% 33%3 G: 149 Ratio (FTE) B: 210 Loans $32bn
Slide 8: Wholesale Banking: Financial Performance
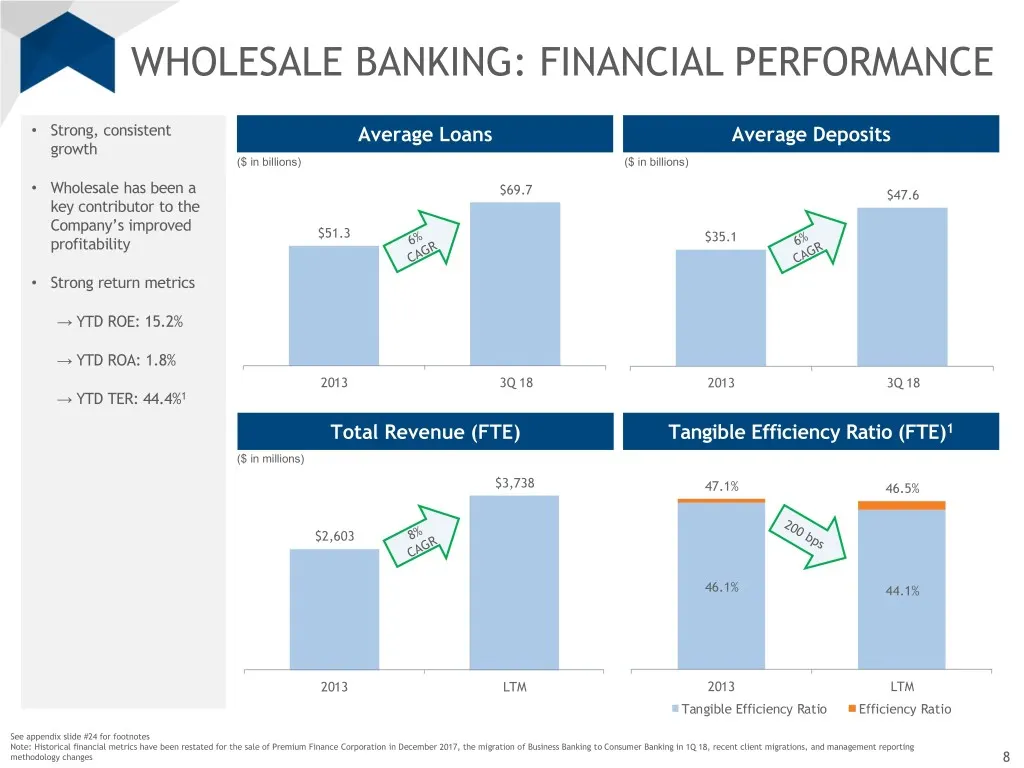
R: 245 G: 128 B: 37 WHOLESALE BANKING: FINANCIAL PERFORMANCE R: 255 Orange G: 164 B: 0 • Strong, consistent Average Loans Average Deposits R: 0 growth G: 70 ($ in billions) ($ in billions) B: 127 • Wholesale has been a $69.7 $47.6 key contributor to the R: 94 Company’s improved G: 149 $51.3 $35.1 B:
Slide 9: Strong Risk Management Culture
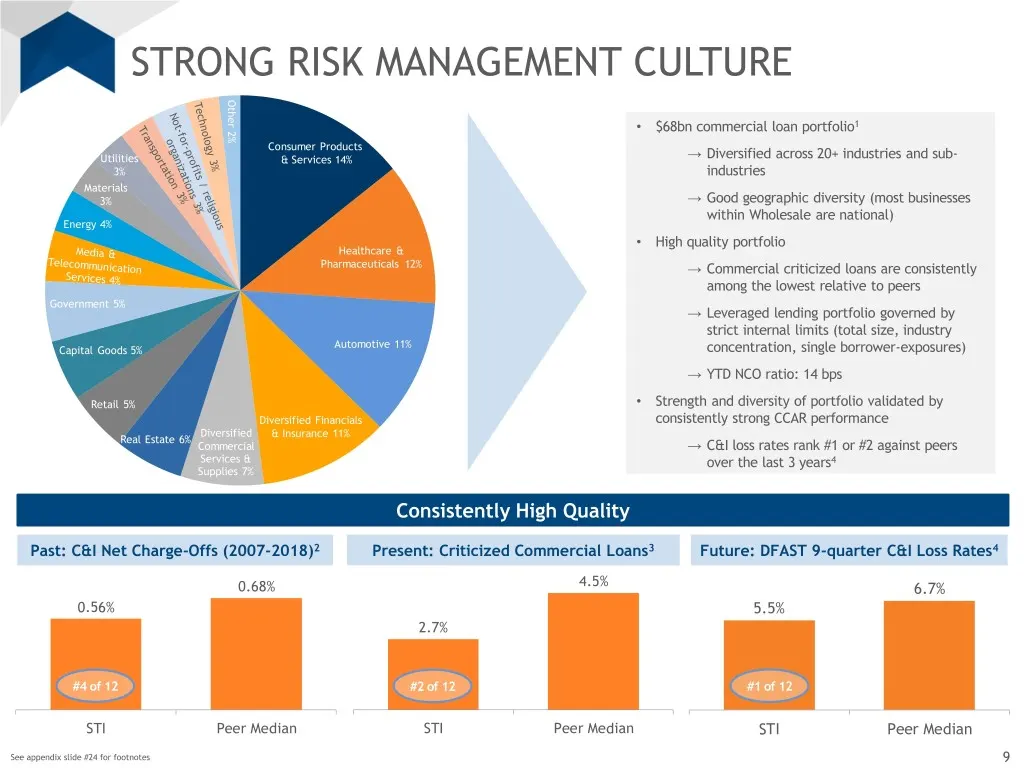
R: 245 G: 128 B: 37 STRONG RISK MANAGEMENT CULTURE R: 255 Orange G: 164 2% Other B: 0 • $68bn commercial loan portfolio1 R: 0 Consumer Products Utilities → Diversified across 20+ industries and sub- G: 70 & Services 14% 3% industries B: 127 Materials 3% → Good geographic diversity (most businesses R
Slide 10: Overview of Wholesale Banking Strategy
R: 245 G: 128 B: 37 R: 255 Orange G: 164 B: 0 R: 0 G: 70 B: 127 R: 94 G: 149 B: 210 R: 173 G: 201 Blue B: 232 OVERVIEW OF R: 222 G: 233 B: 245 WHOLESALE BANKING R: 47 G: 104 STRATEGY B: 167 R: 92 G: 92 B: 92 R: 127 G: 127 Grey B: 127 R: 190 G: 190 B: 190 R: 0 G: 176 B: 80 Other
Slide 11: Wholesale Segment: Competitive Advantage
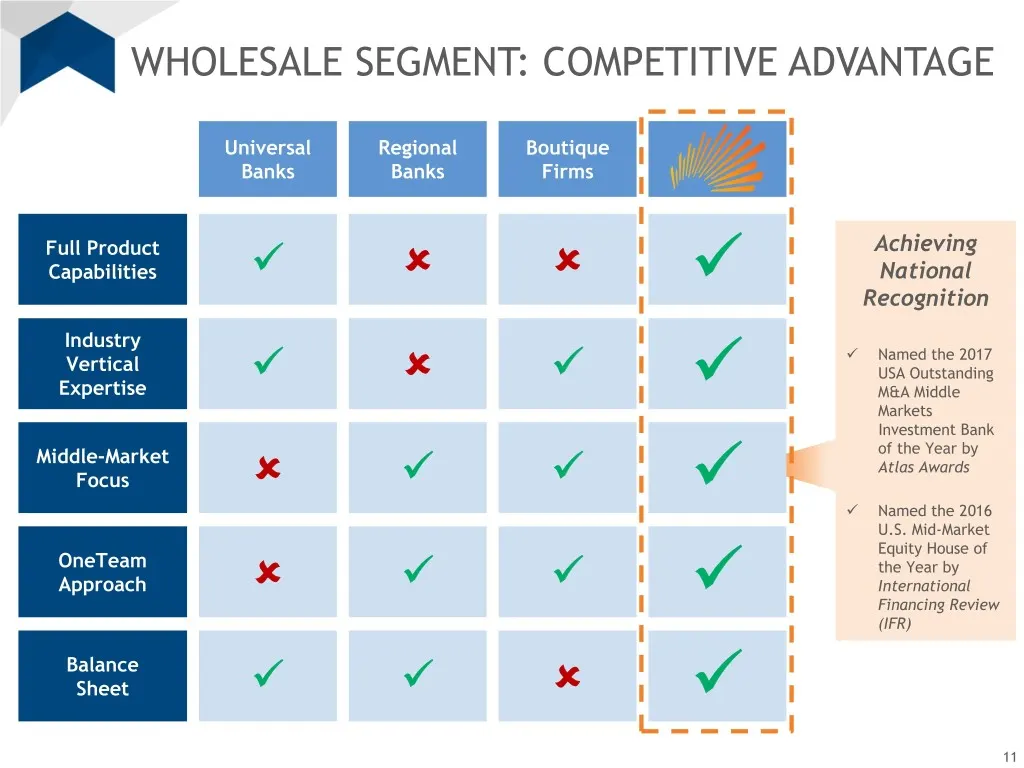
R: 245 G: 128 B: 37 WHOLESALE SEGMENT: COMPETITIVE ADVANTAGE R: 255 Orange G: 164 B: 0 R: 0 Universal Regional Boutique G: 70 B: 127 Banks Banks Firms R: 94 G: 149 B: 210 Full Product Achieving Capabilities National R: 173 G: 201 Recognition Blue B: 232 Industry R: 222 Named the 2017 G: 23
Slide 12: STRH: Proven Success with Future Potential
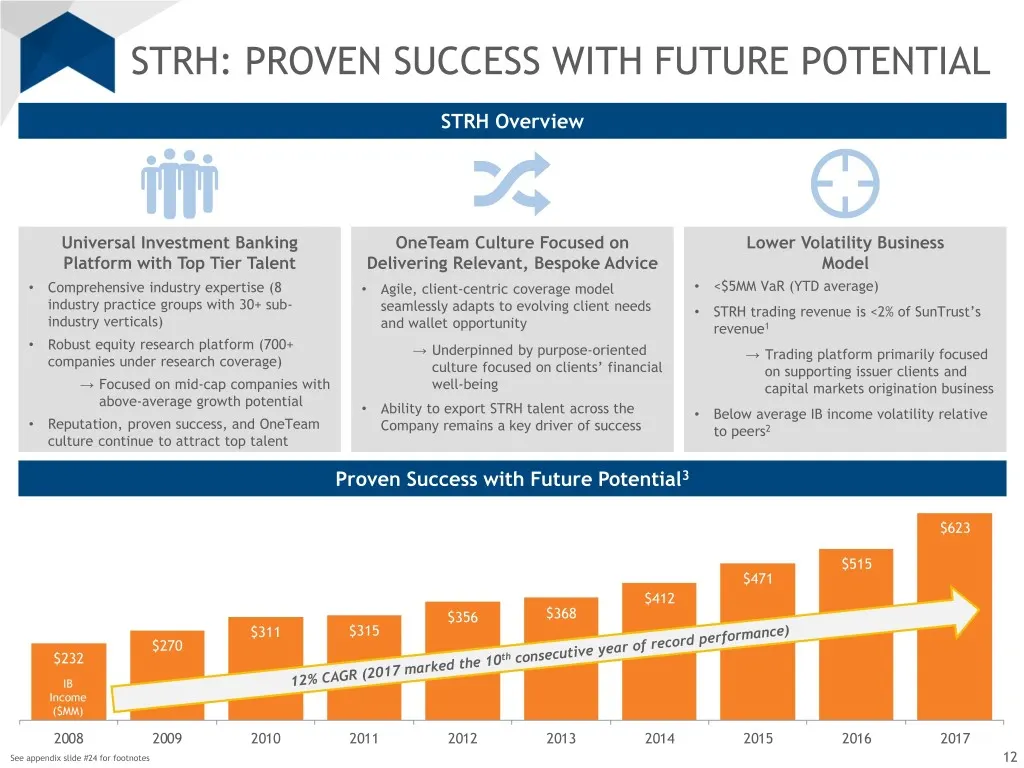
R: 245 G: 128 B: 37 STRH: PROVEN SUCCESS WITH FUTURE POTENTIAL R: 255 Orange G: 164 B: 0 STRH Overview R: 0 G: 70 B: 127 R: 94 G: 149 B: 210 Universal Investment Banking OneTeam Culture Focused on Lower Volatility Business Platform with Top Tier Talent Delivering Relevant, Bespoke Advice Model R: 17
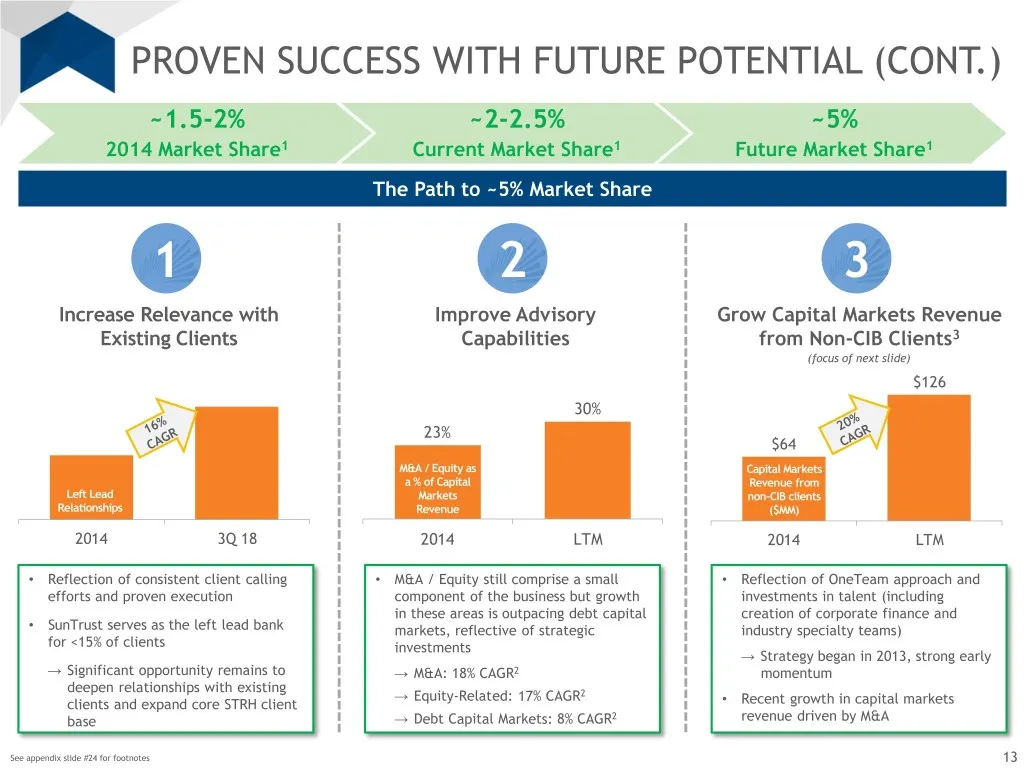
Slide 13: Proven Success with Future Potential (Cont.)
R: 245 G: 128 B: 37 PROVEN SUCCESS WITH FUTURE POTENTIAL (CONT.) R: 255 Orange G: 164 B: 0 ~1.5-2% ~2-2.5% ~5% R: 0 2014 Market Share1 Current Market Share1 Future Market Share1 G: 70 B: 127 The Path to ~5% Market Share R: 94 G: 149 B: 210 1 2 3 R: 173 G: 201 Blue B: 232 Increase Relevance with Impr
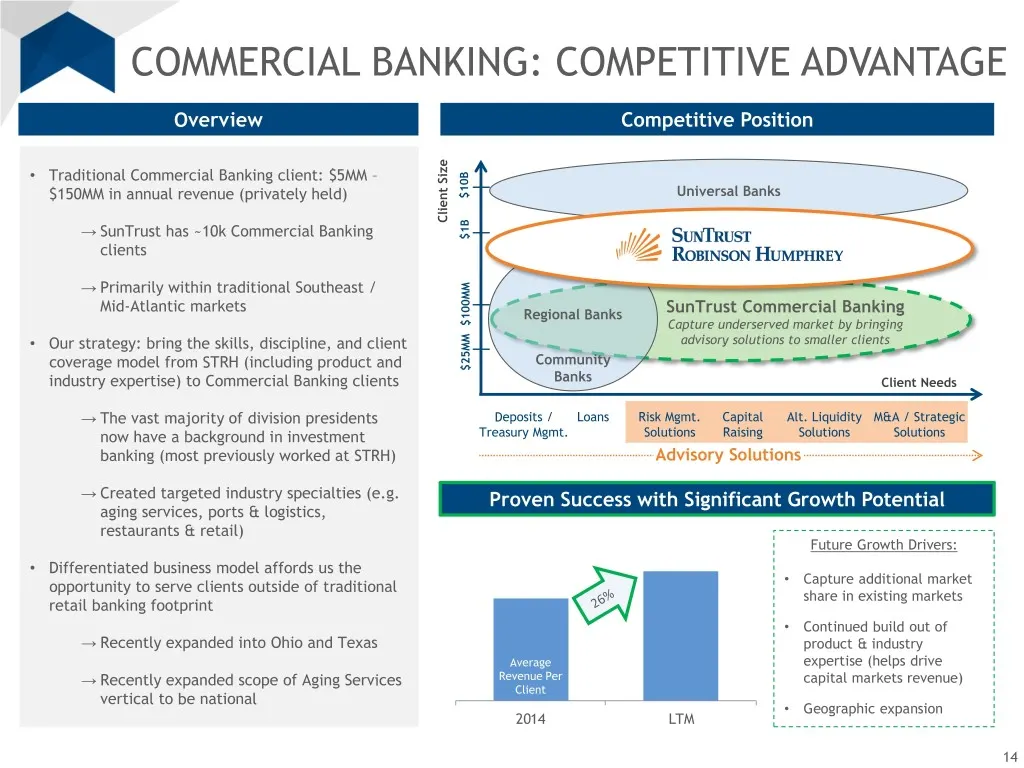
Slide 14: Commercial Banking: Competitive Advantage
R: 245 G: 128 B: 37 COMMERCIAL BANKING: COMPETITIVE ADVANTAGE R: 255 Orange G: 164 B: 0 Overview Competitive Position R: 0 G: 70 B: 127 • Traditional Commercial Banking client: $5MM – $150MM in annual revenue (privately held) $10B Universal Banks R: 94 Size Client G: 149 → SunTrust has ~10k Commerci
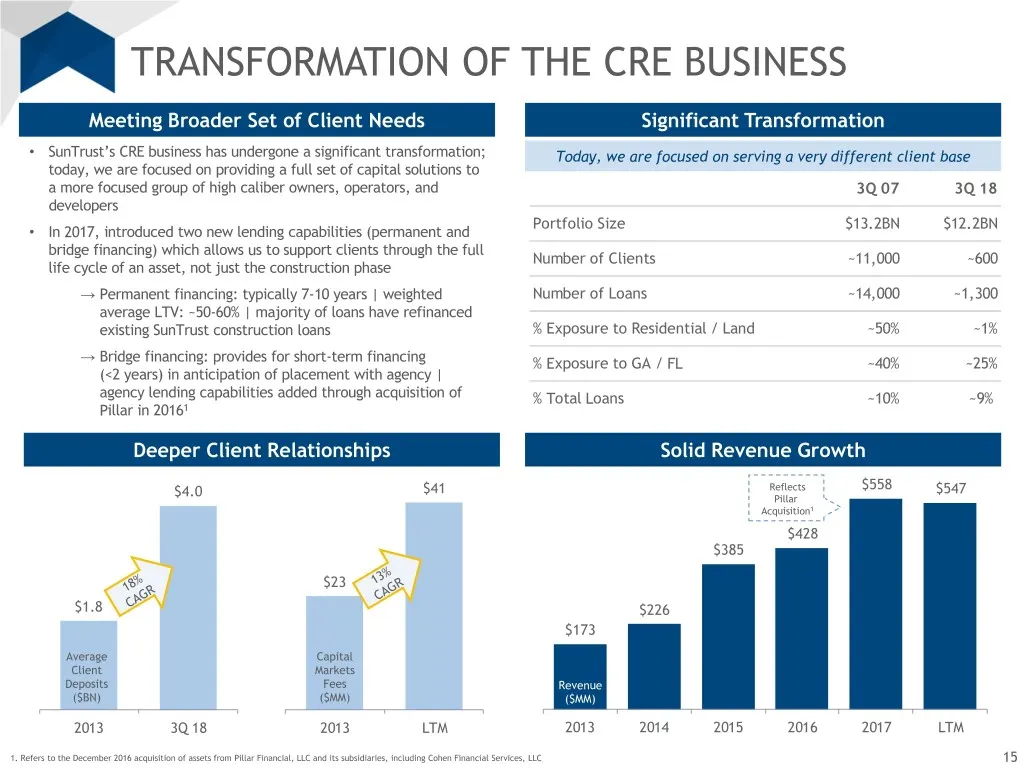
Slide 15: Transformation of the CRE Business
R: 245 G: 128 B: 37 TRANSFORMATION OF THE CRE BUSINESS R: 255 Orange G: 164 B: 0 Meeting Broader Set of Client Needs Significant Transformation R: 0 • SunTrust’s CRE business has undergone a significant transformation; Today, we are focused on serving a very different client base G: 70 today, we are
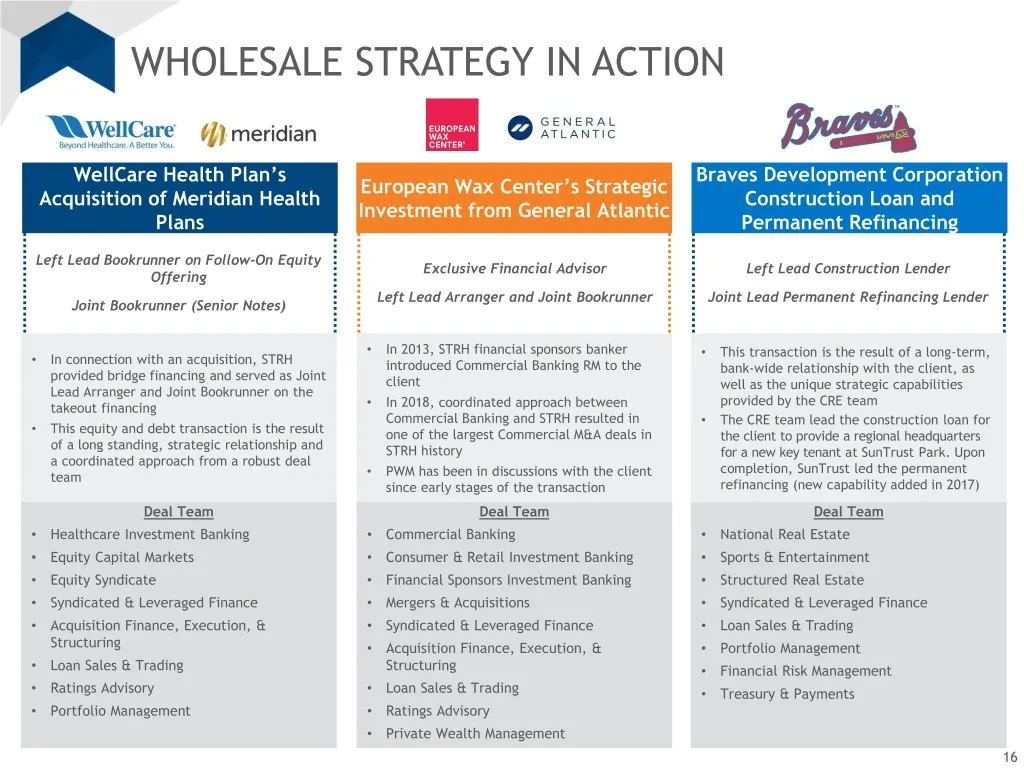
Slide 16: Wholesale Strategy in Action
R: 245 G: 128 B: 37 WHOLESALE STRATEGY IN ACTION R: 255 Orange G: 164 B: 0 R: 0 G: 70 B: 127 WellCare Health Plan’s Braves Development Corporation European Wax Center’s Strategic Acquisition of Meridian Health Construction Loan and R: 94 Investment from General Atlantic G: 149 Plans Permanent Refina
Slide 17: Exporting Home Grown Talent Across the Company
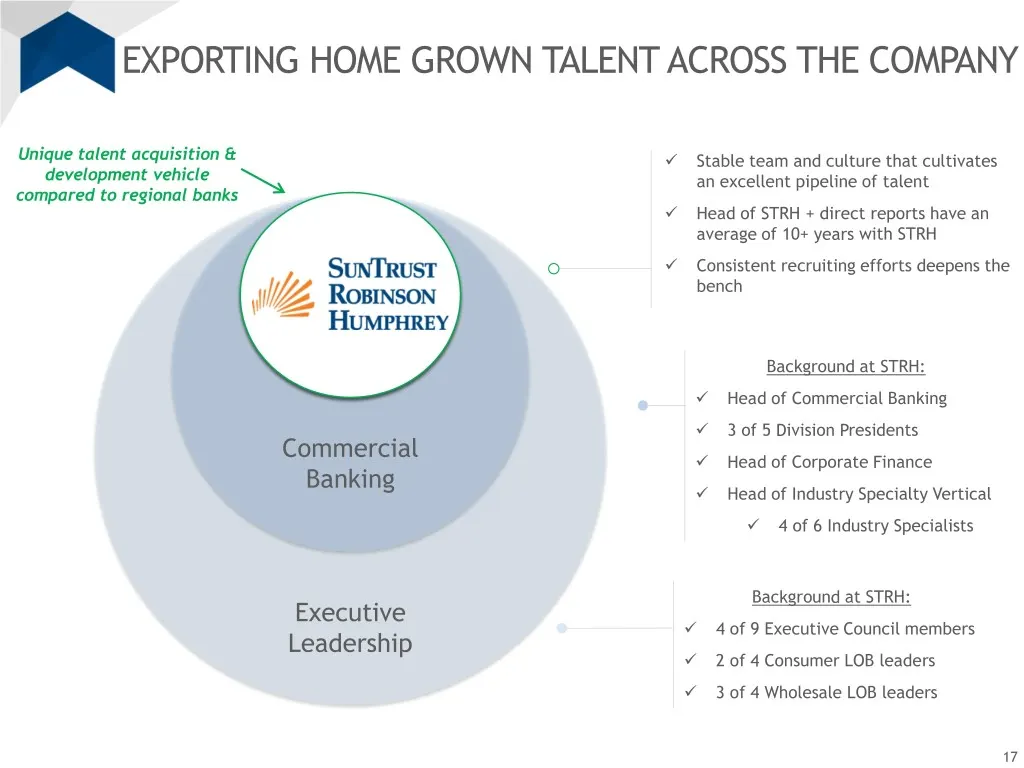
R: 245 G: 128 B: 37 EXPORTING HOME GROWN TALENT ACROSS THE COMPANY R: 255 Orange G: 164 B: 0 R: 0 Unique talent acquisition & G: 70 Stable team and culture that cultivates B: 127 development vehicle an excellent pipeline of talent compared to regional banks R: 94 Head of STRH + direct reports ha
Slide 18: Purpose in Action: Momentum onUp
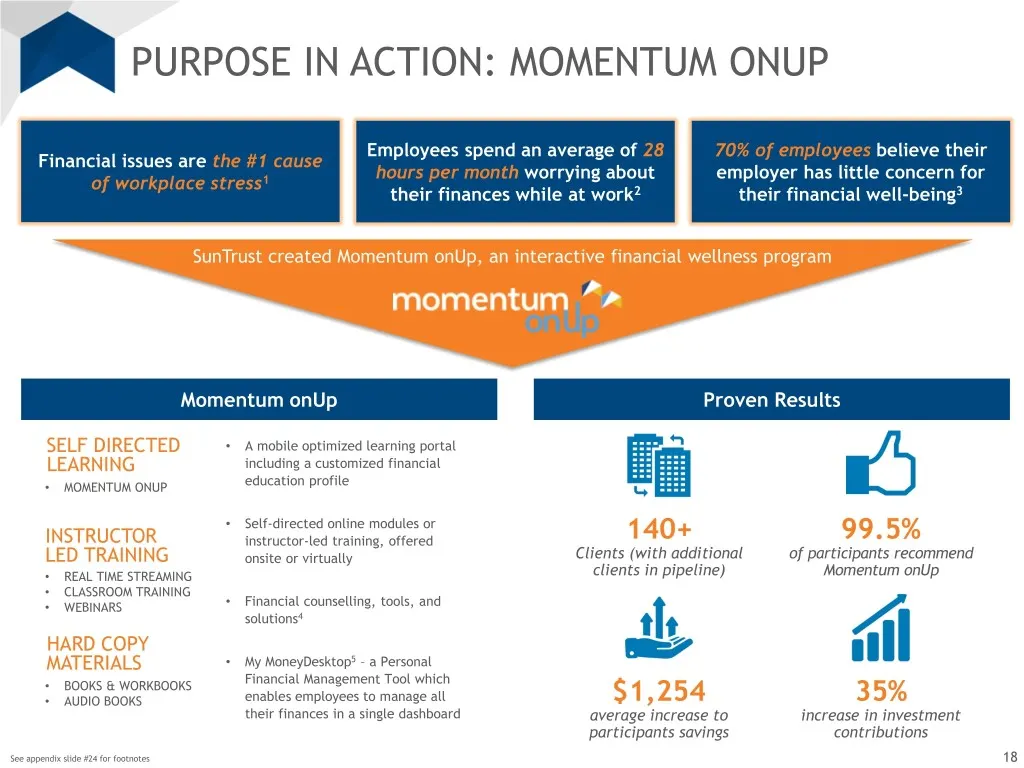
R: 245 G: 128 B: 37 PURPOSE IN ACTION: MOMENTUM ONUP R: 255 Orange G: 164 B: 0 R: 0 Employees spend an average of 28 70% of employees believe their Financial issues are the #1 cause G: 70 hours per month worrying about employer has little concern for B: 127 of workplace stress1 their finances while
Slide 19: Recap: Why Invest in SunTrust?
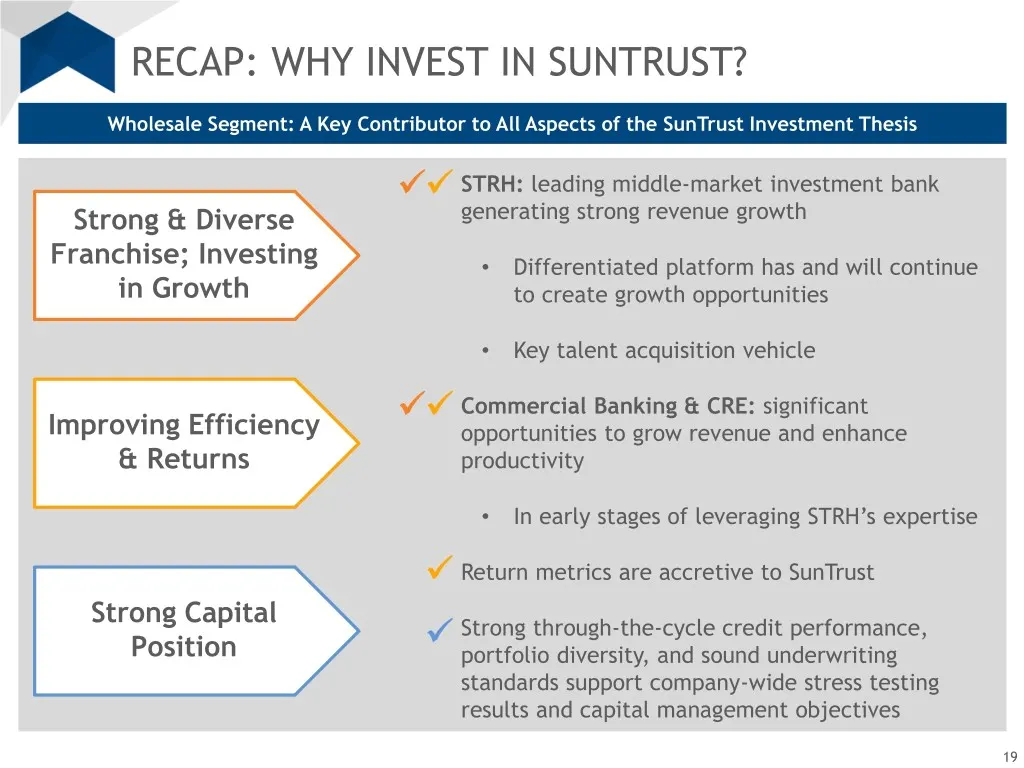
R: 245 G: 128 B: 37 RECAP: WHY INVEST IN SUNTRUST? R: 255 Orange G: 164 B: 0 Wholesale Segment: A Key Contributor to All Aspects of the SunTrust Investment Thesis R: 0 G: 70 B: 127 STRH: leading middle-market investment bank R: 94 generating strong revenue growth G: 149 Strong & Diverse B: 210 Fr

Slide 20: Appendix
R: 245 G: 128 B: 37 R: 255 Orange G: 164 B: 0 R: 0 G: 70 B: 127 R: 94 G: 149 B: 210 R: 173 G: 201 Blue B: 232 APPENDIX R: 222 G: 233 B: 245 R: 47 G: 104 B: 167 R: 92 G: 92 B: 92 R: 127 G: 127 Grey B: 127 R: 190 G: 190 B: 190 R: 0 G: 176 B: 80 Other
Slide 21: Capital Markets Revenue Mix
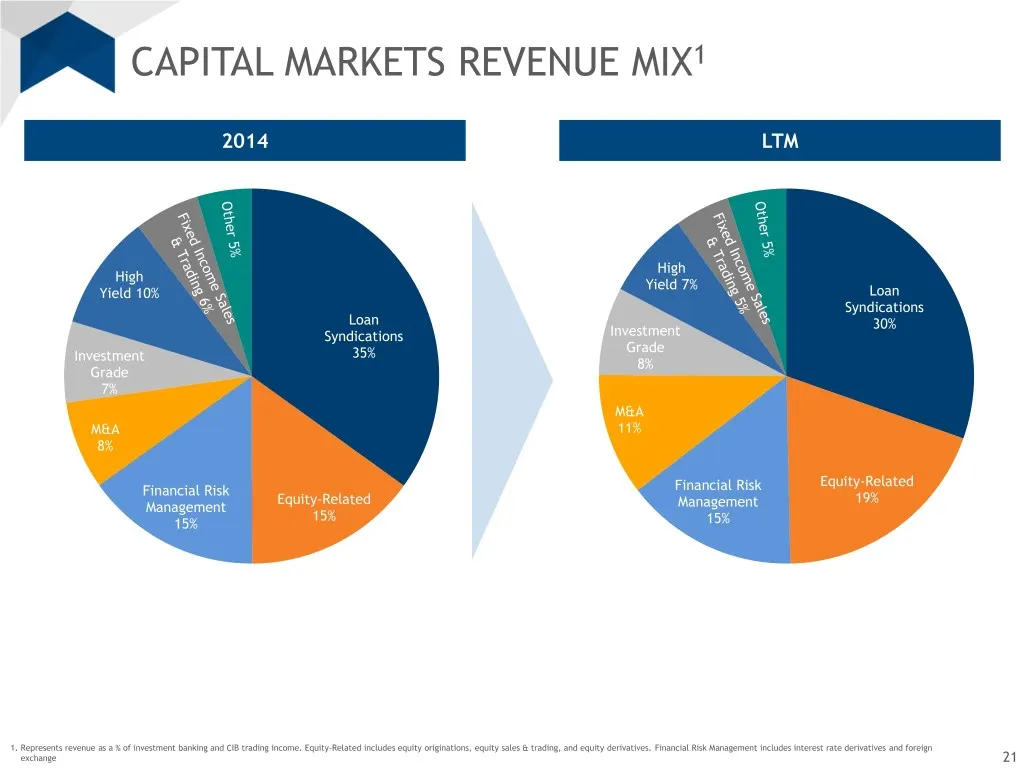
CAPITAL MARKETS REVENUE MIX1 2014 LTM High High Yield 7% Yield 10% Loan Syndications Loan 30% Syndications Investment Grade Investment 35% 8% Grade 7% M&A M&A 11% 8% Equity-Related Financial Risk Financial Risk Equity-Related 19% Management Management 15% 15% 15% 1. Represents revenue as a % of inve
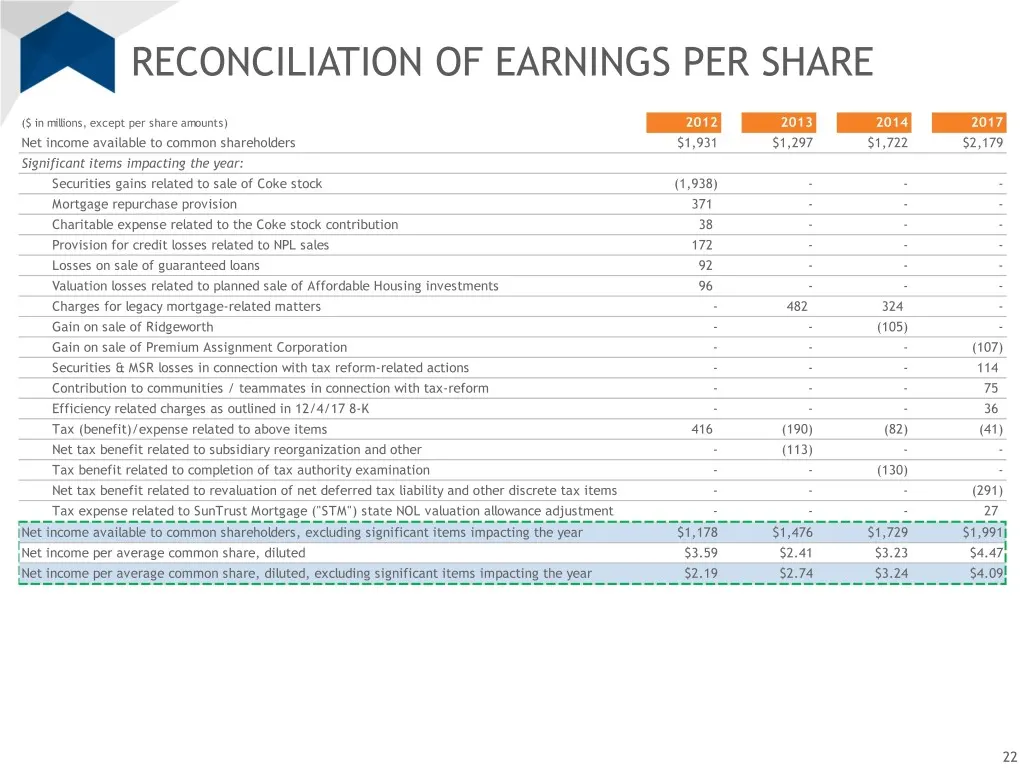
Slide 22: Reconciliation of Earnings Per Share
RECONCILIATION OF EARNINGS PER SHARE ($ in millions, except per share amounts) 2012 2013 2014 2017 Net income available to common shareholders $1,931 $1,297 $1,722 $2,179 Significant items impacting the year: Securities gains related to sale of Coke stock (1,938) - - - Mortgage repurchase provision
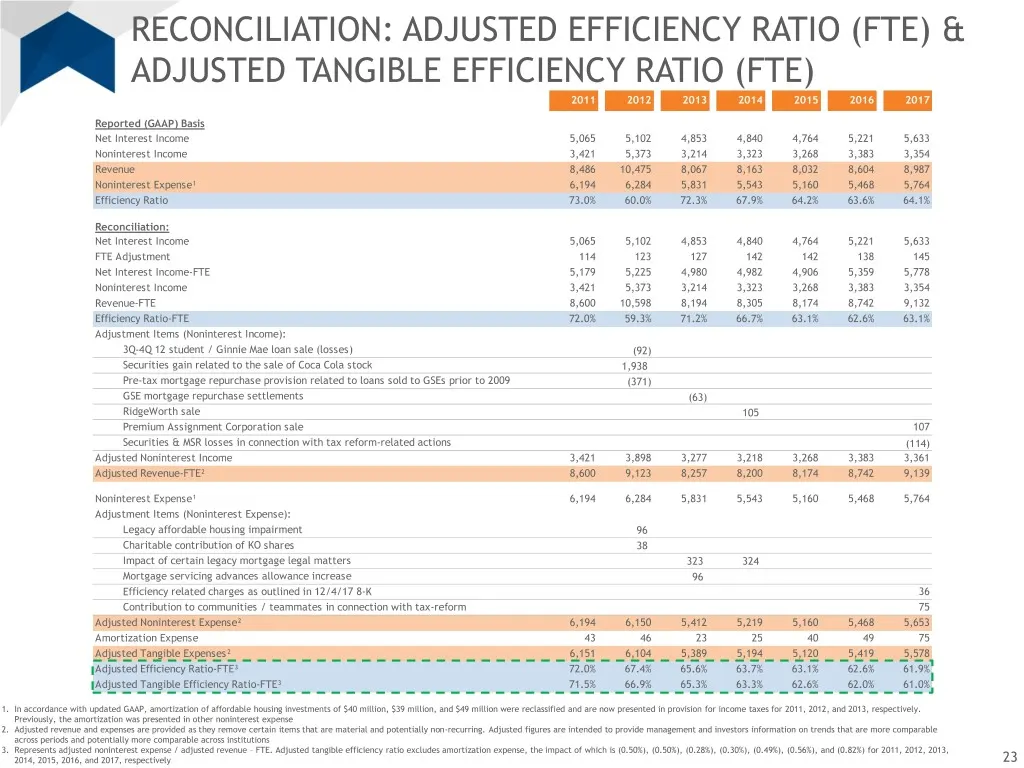
Slide 23: Reconciliation: Adjusted Efficiency Ratio (FTE) & Adjusted Tangible Efficiency Ratio (FTE)
RECONCILIATION: ADJUSTED EFFICIENCY RATIO (FTE) & ADJUSTED TANGIBLE EFFICIENCY RATIO (FTE) 2011 2012 2013 2014 2015 2016 2017 Reported (GAAP) Basis Net Interest Income 5,065 5,102 4,853 4,840 4,764 5,221 5,633 Noninterest Income 3,421 5,373 3,214 3,323 3,268 3,383 3,354 Revenue 8,486 10,475 8,067 8,
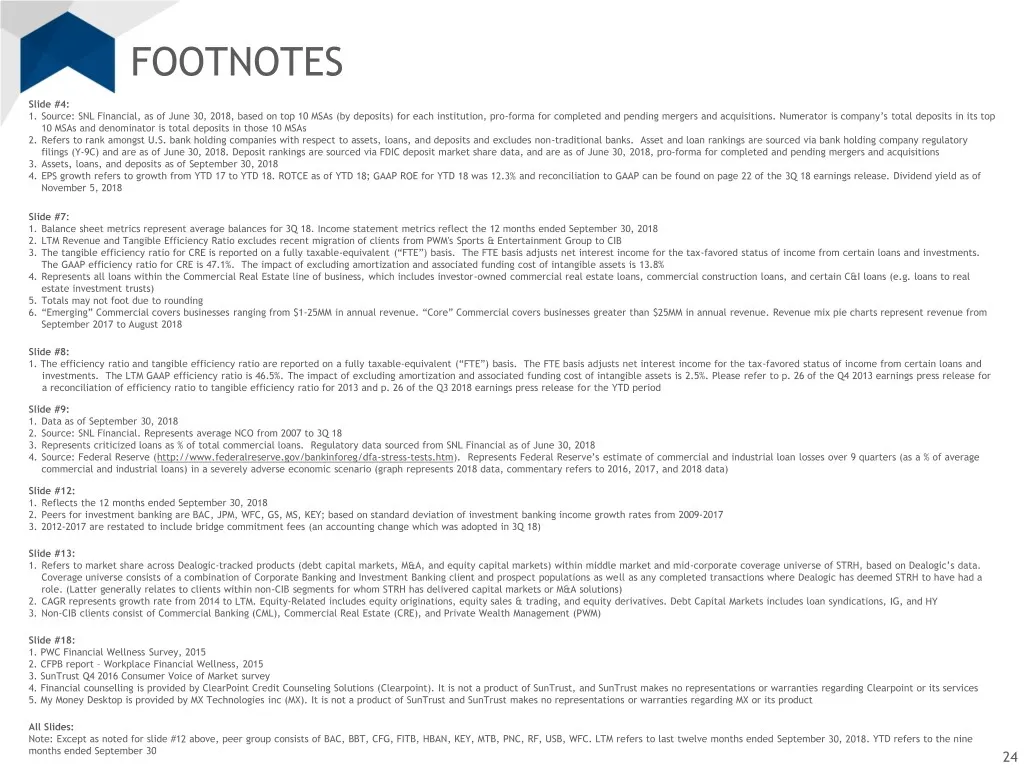
Slide 24: Footnotes
FOOTNOTES Slide #4: 1. Source: SNL Financial, as of June 30, 2018, based on top 10 MSAs (by deposits) for each institution, pro-forma for completed and pending mergers and acquisitions. Numerator is company’s total deposits in its top 10 MSAs and denominator is total deposits in those 10 MSAs 2. Ref
Source: SEC EDGAR · 8-K filed Nov 8, 2018
More decks from SunTrust Banks Inc
 Q3 2019 Earnings Presentation21 slides · Oct 17, 2019
 Q2 2019 Earnings Presentation22 slides · Jul 18, 2019
 Q1 2019 Earnings Presentation22 slides · Apr 18, 2019
 Merger or Acquisition (February 2019)38 slides · Feb 7, 2019
 Q4 2018 Earnings Presentation23 slides · Jan 18, 2019
 2018 Goldman Sachs US Financial Services Conference30 slides · Dec 4, 2018