Diamond Foods — Merrill Lynch 1-on-1 Conference 2008
31 slides from Diamond Foods's conference presentation, Dec 10, 2008

Slide 1: Promoting Active and Healthy Lifestyles
Promoting Active and Healthy Lifestyles Merrill Lynch 1-on-1 Conference Boston, MA December 2008 120308

Slide 2: Important Information
Important Information This material contains forward-looking statements, including forecasts of growth, long-term financial goals, expanding margins, industry growth and our strategic plans, that involve known and unknown risks and uncertainties that may cause actual results, levels of activity, per
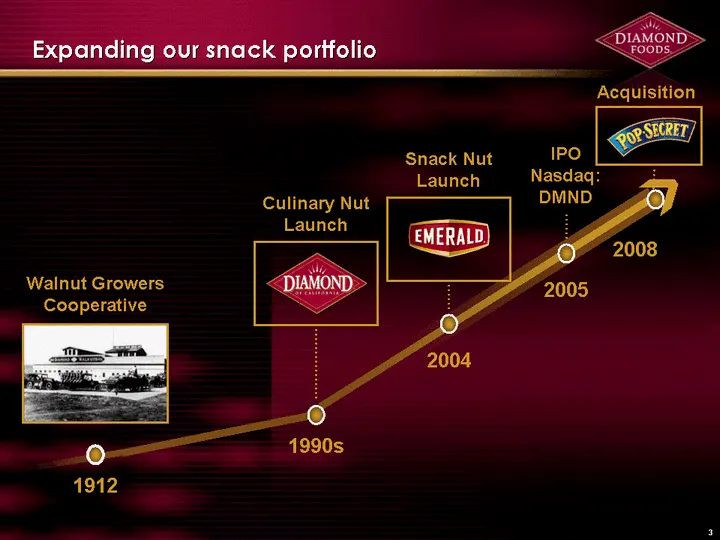
Slide 3: Expanding our snack portfolio
Expanding our snack portfolio Walnut Growers Cooperative 1912 2004 IPO Nasdaq: DMND 2005 2008 Acquisition 1990s Culinary Nut Launch
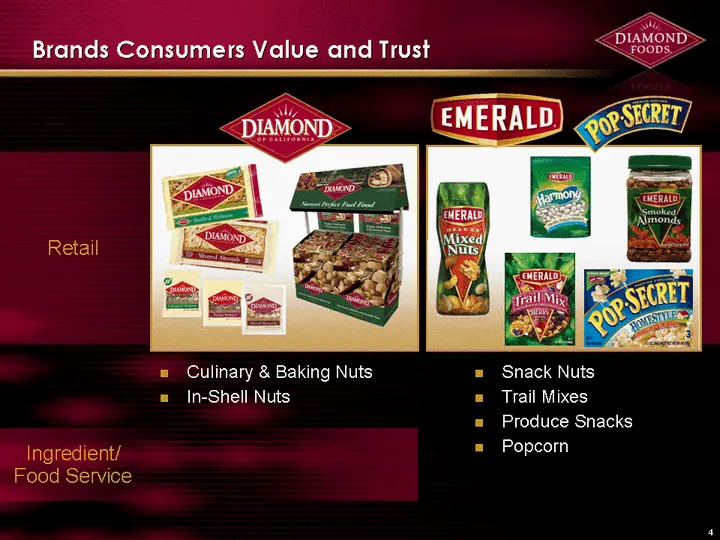
Slide 4: Brands Consumers Value and Trust
Snack Nuts Trail Mixes Produce Snacks Popcorn Brands Consumers Value and Trust Culinary & Baking Nuts In-Shell Nuts Ingredient/ Food Service Retail
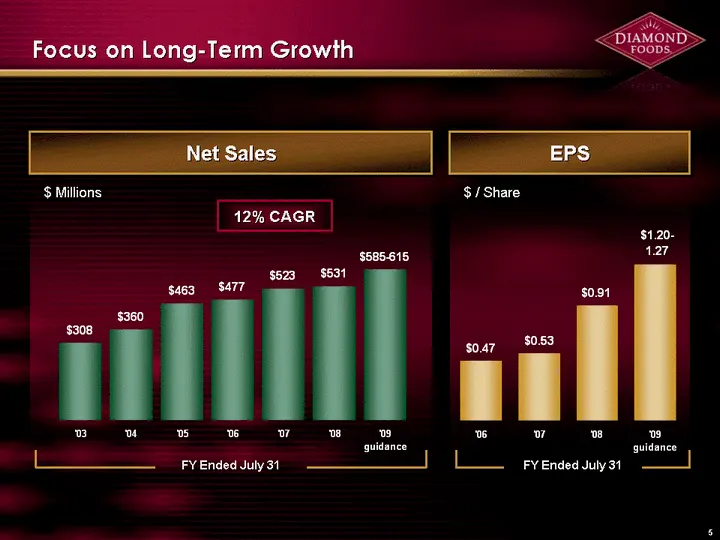
Slide 5: Focus on Long-Term Growth
Net Sales Focus on Long-Term Growth FY Ended July 31 '03 '04 '05 '06 '07 '08 '09 guidance 308.45 359.7 462.5 477.2 522.6 531.492 600 $ Millions 12% CAGR EPS $ / Share FY Ended July 31 '06 '07 '08 '09 guidance 0.47 0.53 0.91 1.235
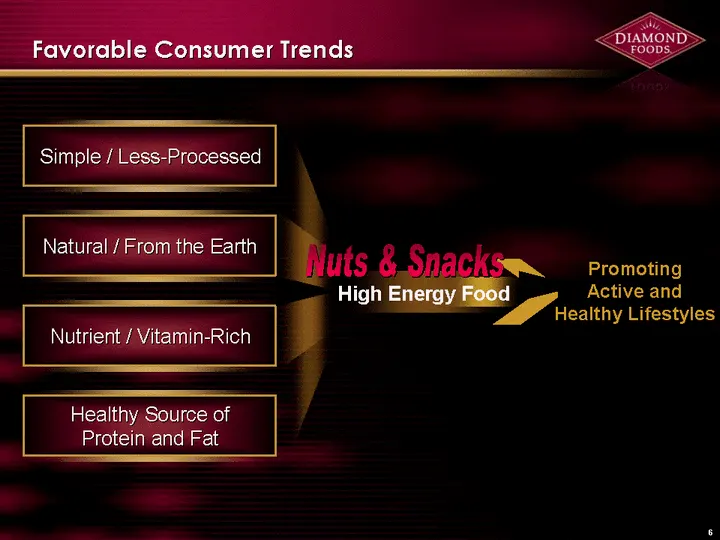
Slide 6: Favorable Consumer Trends
Favorable Consumer Trends Simple / Less-Processed Natural / From the Earth Nutrient / Vitamin-Rich Healthy Source of Protein and Fat High Energy Food Promoting Active and Healthy Lifestyles Nuts & Snacks
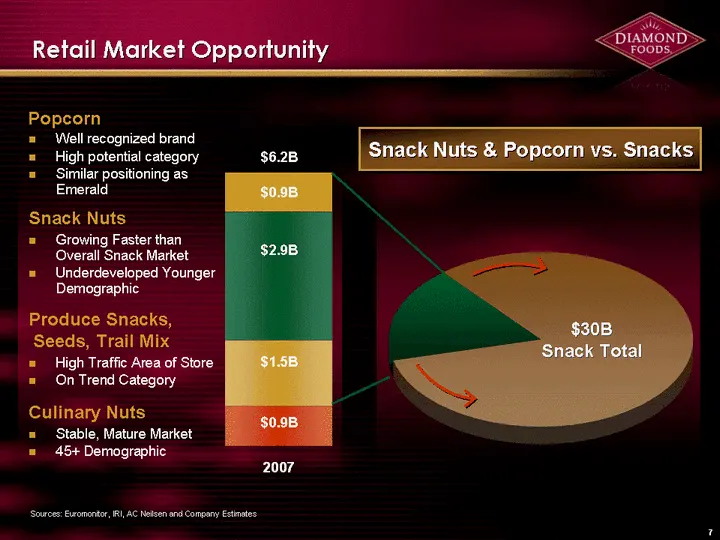
Slide 7: Retail Market Opportunity
Retail Market Opportunity Sources: Euromonitor, IRI, AC Neilsen and Company Estimates Snack Nuts Produce Snacks, Seeds, Trail Mix Culinary Nuts Well recognized brand High potential category Similar positioning as Emerald High Traffic Area of Store On Trend Category Stable, Mature Market 45+ Demograp
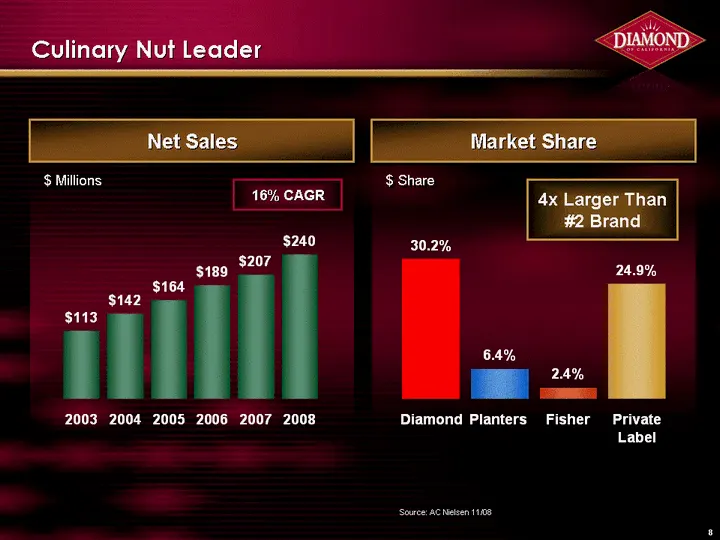
Slide 8: Culinary Nut Leader
Culinary Nut Leader Net Sales Market Share Sales 2003 113 2004 142 2005 164 2006 189 2007 207 2008 240 Source: AC Nielsen 11/08 Share Diamond 0.302 Planters 0.064 Fisher 0.024 Private Label 0.249 $ Millions $ Share 16% CAGR 4x Larger Than #2 Brand
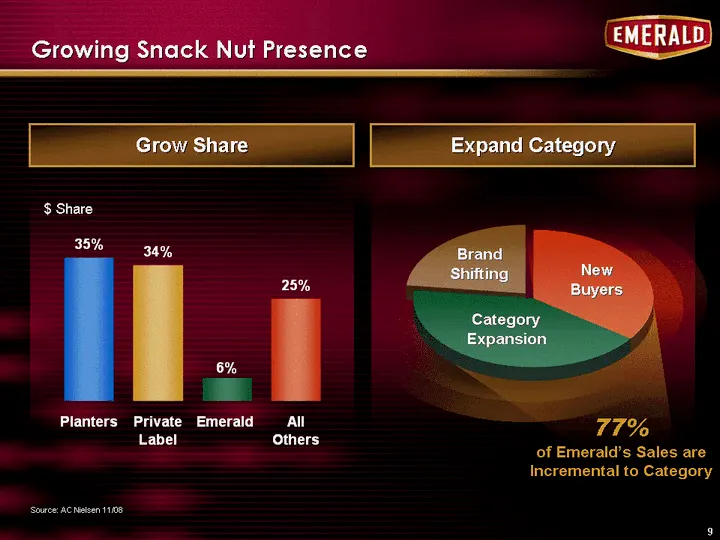
Slide 9: Growing Snack Nut Presence
Growing Snack Nut Presence Source: AC Nielsen 11/08 Grow Share Share Planters 0.353 Private Label 0.336 Emerald 0.058 All Others 0.253 $ Share Expand Category 77% of Emerald's Sales are Incremental to Category new buyer categ exp brand shift East 35 42 23 Brand Shifting Category Expansion New Buyers
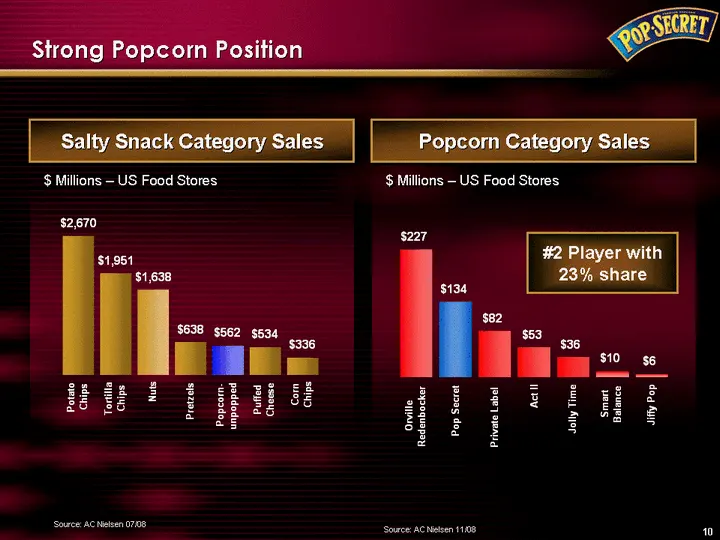
Slide 10: Strong Popcorn Position
Strong Popcorn Position Salty Snack Category Sales Popcorn Category Sales Sales Potato Chips 2670 Tortilla Chips 1951 Nuts 1638 Pretzels 638 Popcorn-unpopped 562 Puffed Cheese 534 Corn Chips 336 Sales Orville Redenbocker 226.9 Pop Secret 133.7 Private Label 82.4 Act II 53.4 Jolly Time 36.2 Smart Bal
Slide 11: Brand Demographics
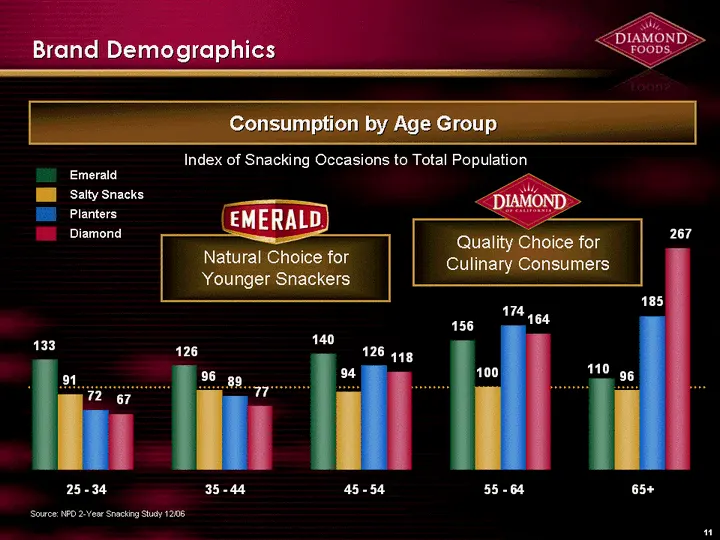
Brand Demographics Salty Snacks Emerald Planter's Diamond 25 - 34 133 91 72 67 35 - 44 126 96 89 77 45 - 54 140 94 126 118 55 - 64 156 100 174 164 65+ 110 96 185 267 Quality Choice for Culinary Consumers Natural Choice for Younger Snackers Diamond Emerald Salty Snacks Planters Source: NPD 2-Year Sna
Slide 12: Diamond Brand Development
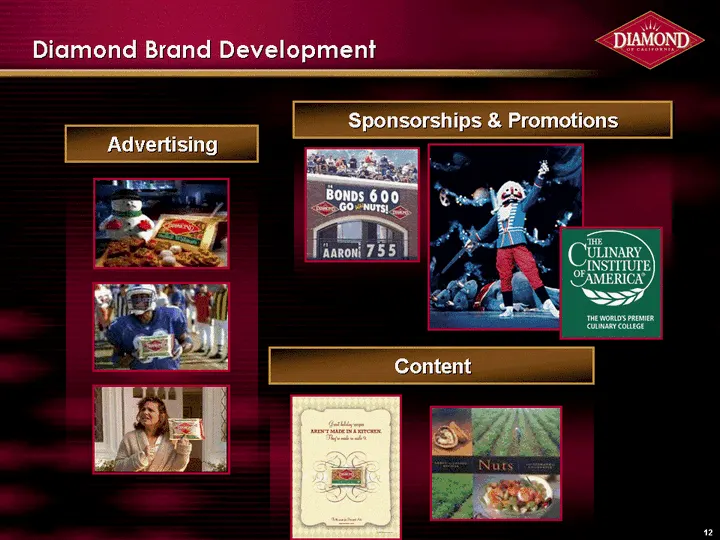
Diamond Brand Development Sponsorships & Promotions Content
Slide 13: Emerald Brand Development
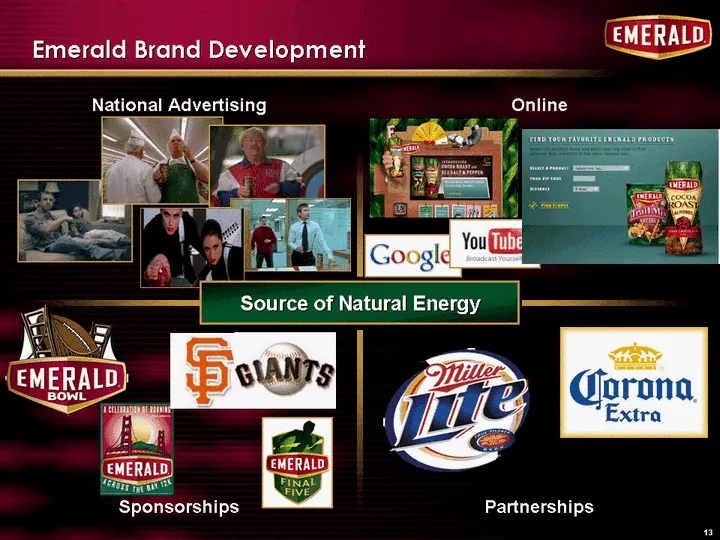
Emerald Brand Development National Advertising Online Sponsorships Partnerships Source of Natural Energy
Slide 14: Pop Secret Brand Development
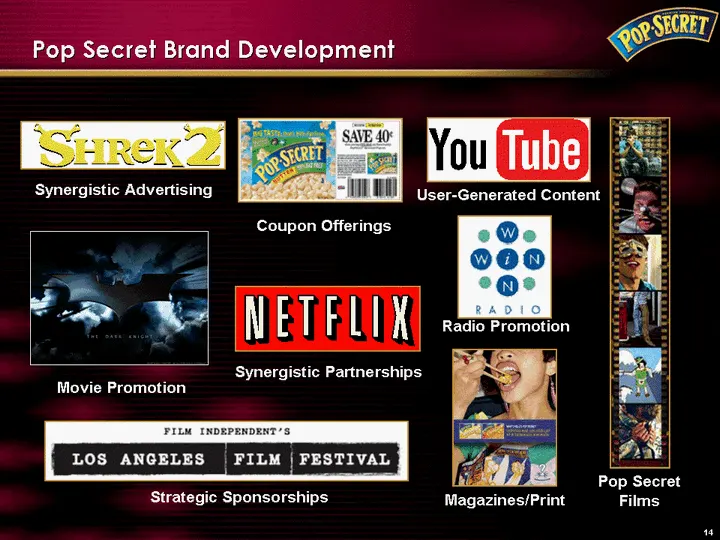
Pop Secret Brand Development Coupon Offerings Synergistic Advertising Movie Promotion Strategic Sponsorships Synergistic Partnerships User-Generated Content Magazines/Print Pop Secret Films Radio Promotion
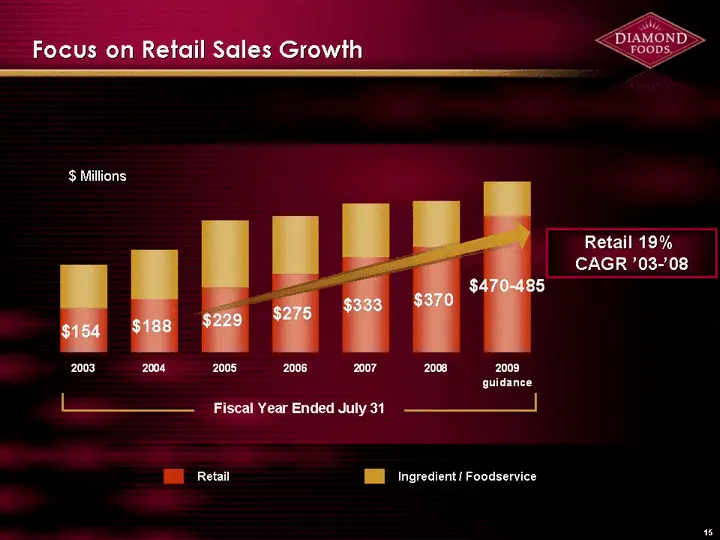
Slide 15: Focus on Retail Sales Growth
Retail 19% CAGR '03-'08 Focus on Retail Sales Growth Retail Non 2003 153.8 154.65 2004 187.5 172.18 2005 228.5 234 2006 274.9 202.3 2007 333.1 189.5 2008 370.4 161.1 2009 guidance 478 122 Retail $ Millions Fiscal Year Ended July 31
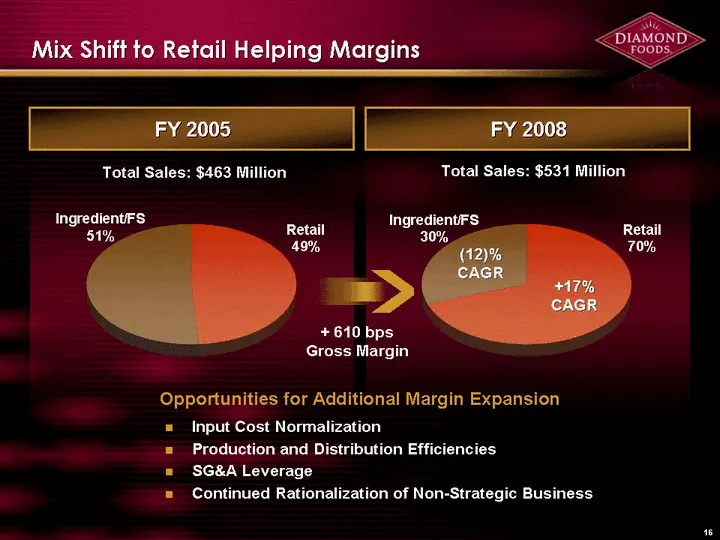
Slide 16: Mix Shift to Retail Helping Margins
FY 2005 FY 2008 Mix Shift to Retail Helping Margins Total Sales: $463 Million Total Sales: $531 Million Ingredient/FS 51% Retail 49% Ingredient/FS 30% Retail 70% + 610 bps Gross Margin Opportunities for Additional Margin Expansion Input Cost Normalization Production and Distribution Efficiencies SG&
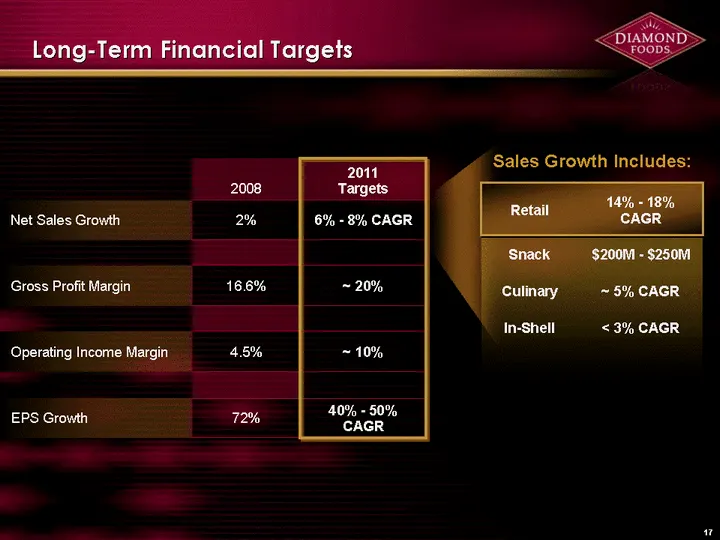
Slide 17: Long-Term Financial Targets
Long-Term Financial Targets 2008 2011 Targets Net Sales Growth 2% 6% - 8% CAGR Operating Income Margin 4.5% ~ 10% EPS Growth 72% 40% - 50% CAGR Retail 14% - 18% CAGR Snack $200M - $250M Culinary ~ 5% CAGR In-Shell < 3% CAGR Gross Profit Margin 16.6% ~ 20% Sales Growth Includes:
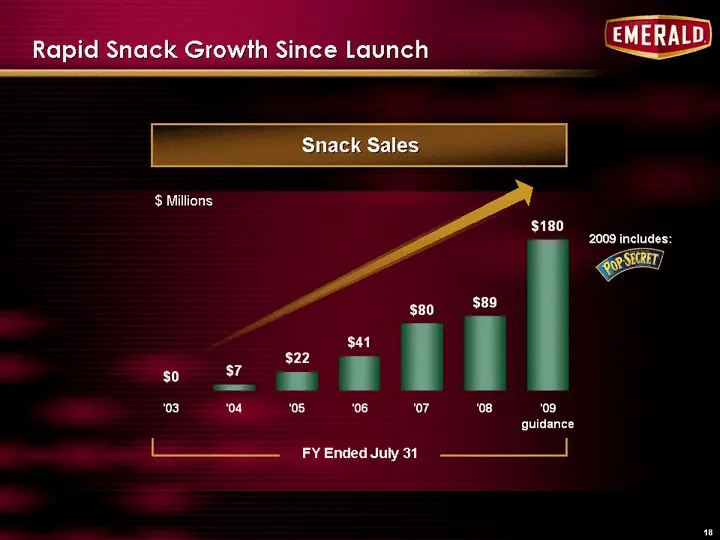
Slide 18: Rapid Snack Growth Since Launch
Rapid Snack Growth Since Launch '03 '04 '05 '06 '07 '08 '09 guidance 0.4 7 22 41 80 88.6 180 FY Ended July 31 $ Millions Snack Sales 2009 includes:
Slide 19: Snack Growth Levers
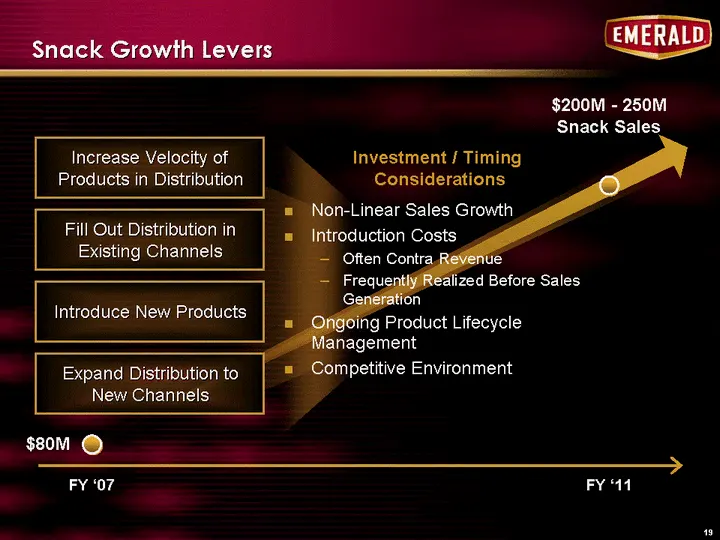
Snack Growth Levers FY '07 FY '11 $80M $200M - 250M Snack Sales Increase Velocity of Products in Distribution Fill Out Distribution in Existing Channels Introduce New Products Expand Distribution to New Channels Non-Linear Sales Growth Introduction Costs Often Contra Revenue Frequently Realized Befo
Slide 20: Building a Platform for Long-Term Growth
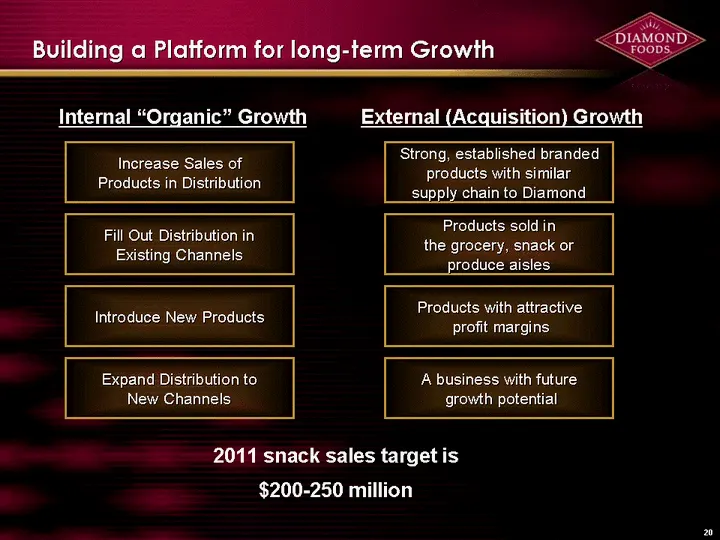
Building a Platform for long-term Growth External (Acquisition) Growth Internal "Organic" Growth 2011 snack sales target is $200-250 million
Slide 21: Pop Secret Overview
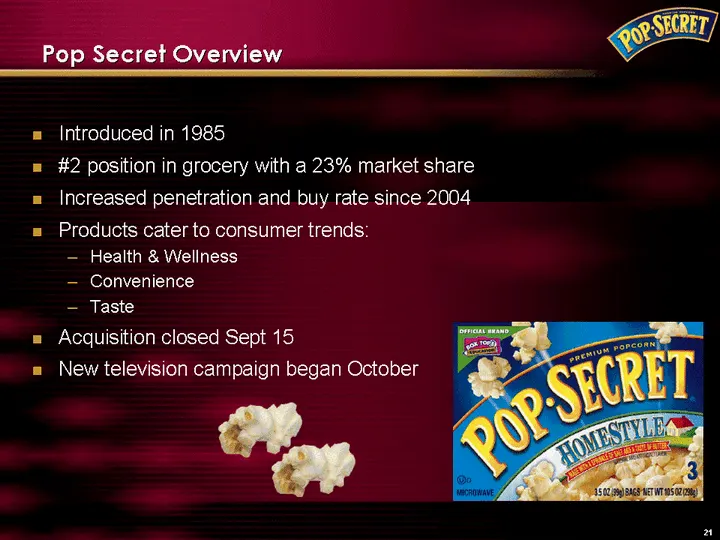
Pop Secret Overview Introduced in 1985 #2 position in grocery with a 23% market share Increased penetration and buy rate since 2004 Products cater to consumer trends: Health & Wellness Convenience Taste Acquisition closed Sept 15 New television campaign began October
Slide 22: Diversified Product Mix
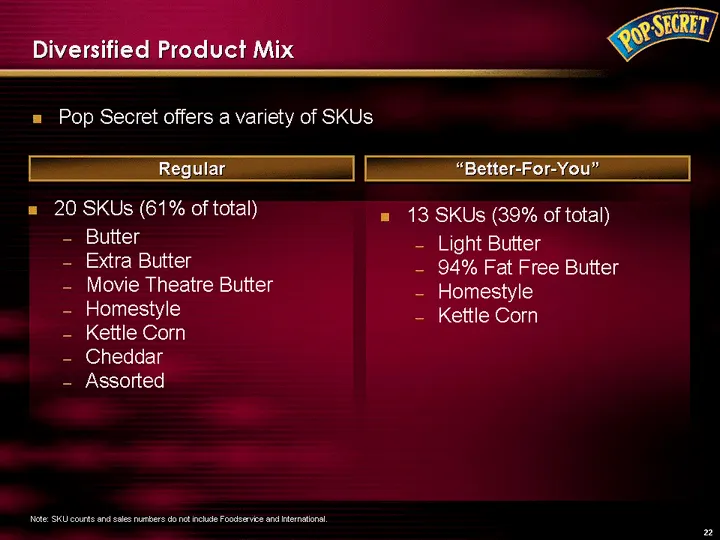
Diversified Product Mix Pop Secret offers a variety of SKUs Regular "Better-For-You" Note: SKU counts and sales numbers do not include Foodservice and International. 20 SKUs (61% of total) Butter Extra Butter Movie Theatre Butter Homestyle Kettle Corn Cheddar Assorted 13 SKUs (39% of total) Light Bu
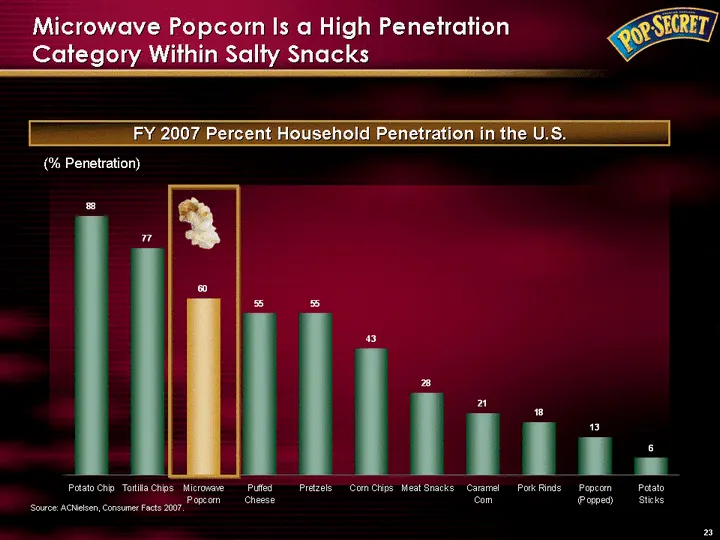
Slide 23: Microwave Popcorn Is a High Penetration Category
Microwave Popcorn Is a High Penetration Category Within Salty Snacks FY 2007 Percent Household Penetration in the U.S. Source: ACNielsen, Consumer Facts 2007. (% Penetration)
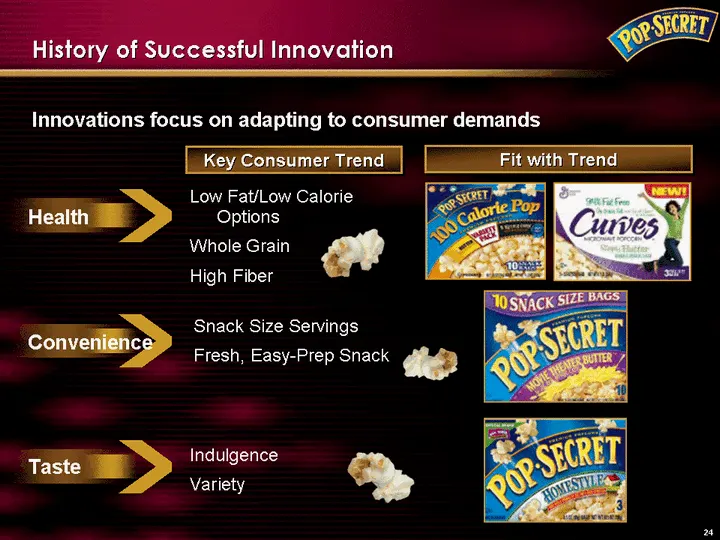
Slide 24: History of Successful Innovation
History of Successful Innovation Innovations focus on adapting to consumer demands Low Fat/Low Calorie Options Whole Grain High Fiber Health Convenience Taste Key Consumer Trend Fit with Trend Snack Size Servings Fresh, Easy-Prep Snack Indulgence Variety
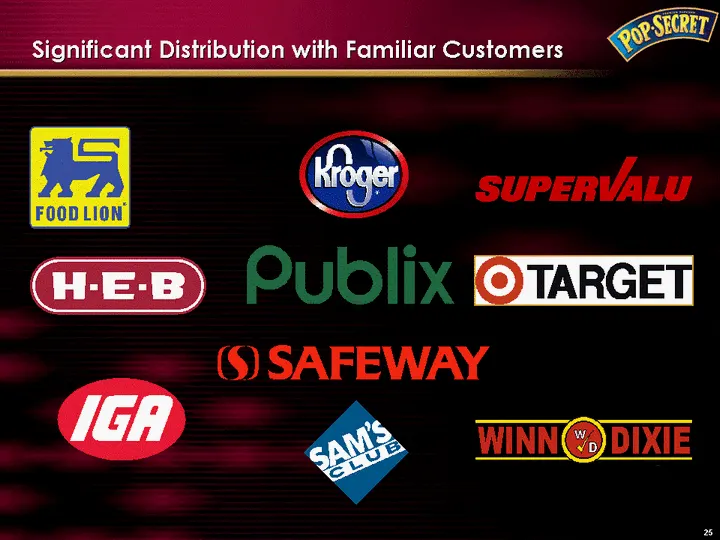
Slide 25: Significant Distribution with Familiar Customers
Significant Distribution with Familiar Customers
Slide 26: Innovation Brands Platform for Long-Term Growth
Innovation Brands Platform for Long-Term Growth
Slide 27: Appendix
Appendix
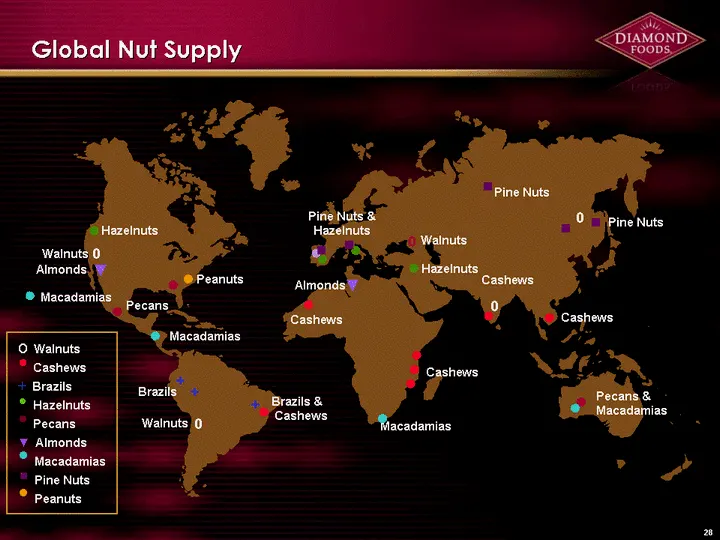
Slide 28: Global Nut Supply
Global Nut Supply Cashews Cashews Walnuts Hazelnuts Cashews Pine Nuts & Hazelnuts Macadamias Pecans & Macadamias Pine Nuts Pine Nuts ^ ^ ^ ^ ^ 0 0 0 Cashews Brazils & Cashews Brazils Macadamias Almonds Pecans Peanuts Macadamias + + Hazelnuts Walnuts 0 + Walnuts Cashews Brazils Hazelnuts Pecans Almon
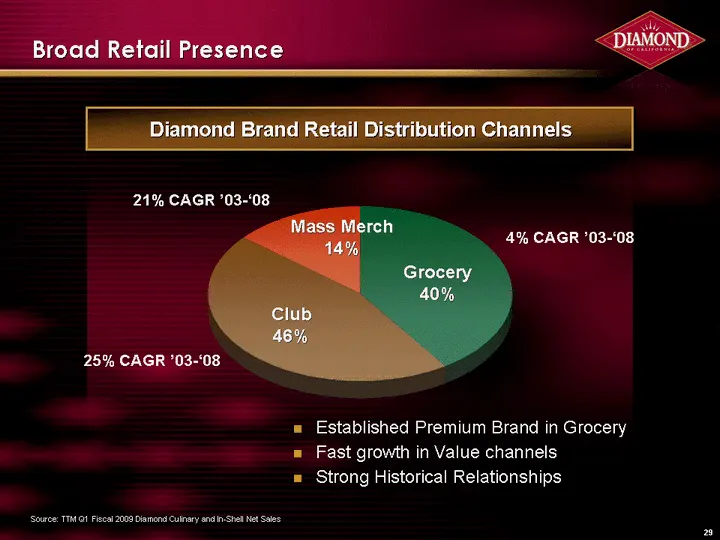
Slide 29: Broad Retail Presence
Broad Retail Presence Cul & Inshell Grocery 118.5 Club 133.6 Mass Merch 40.6 Diamond Brand Retail Distribution Channels Mass Merch 14% Club 46% Grocery 40% Established Premium Brand in Grocery Fast growth in Value channels Strong Historical Relationships Source: TTM Q1 Fiscal 2009 Diamond Culinary a
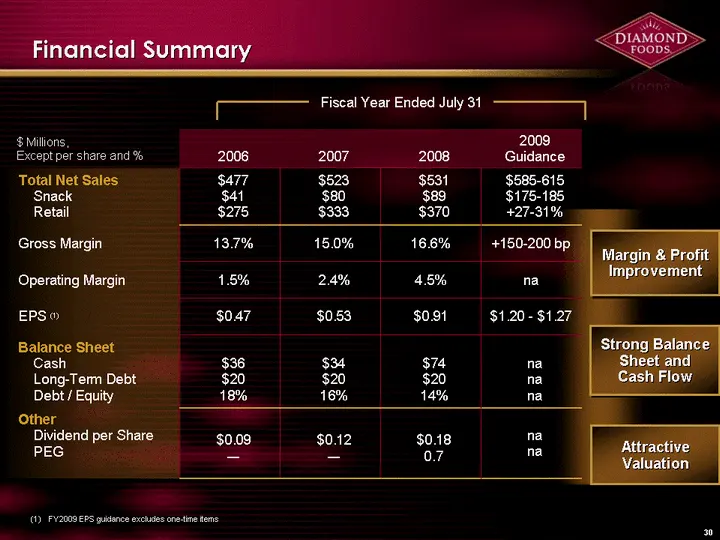
Slide 30: Financial Summary
Margin & Profit Improvement Strong Balance Sheet and Cash Flow Attractive Valuation Financial Summary $ Millions, Except per share and % 2006 2007 2008 2009 Guidance Total Net Sales Snack Retail $477 $41 $275 $523 $80 $333 $531 $89 $370 $585-615 $175-185 +27-31% Gross Margin 13.7% 15.0% 16.6% +150-2

Slide 31: Promoting Active and Healthy Lifestyles
Promoting Active and Healthy Lifestyles
Source: SEC EDGAR · 8-K filed Dec 10, 2008
More decks from Diamond Foods Inc
 Investor Presentation (June 2013)21 slides · Jun 17, 2013
 Investor Presentation (April 2013)21 slides · Apr 29, 2013
 Investor Presentation (February 2013)20 slides · Feb 26, 2013
 Q3 2012 Earnings Presentation18 slides · Nov 14, 2012
 Debt Investor Presentation (May 2012)18 slides · May 23, 2012
 Barclays Capital Back-to-School Consumer Conference 201141 slides · Sep 7, 2011