Blue Hills Bancorp — Piper Jaffray Financial Institutions Conference 2018
23 slides from Blue Hills Bancorp's conference presentation, May 11, 2018
Slide 1: Our Transformative Journey Continues
Piper Jaffray Title Financial Institutions Conference May 2018 Our Transformative Journey Continues 1 1. Footnote.
Slide 2: Forward-Looking Statements
Forward-Looking Statements This presentation, as well as other written communications made from time to time by the Company and its subsidiaries and oral communications made from time to time by authorized officers of the Company, may contain statements relating to the future results of the Company
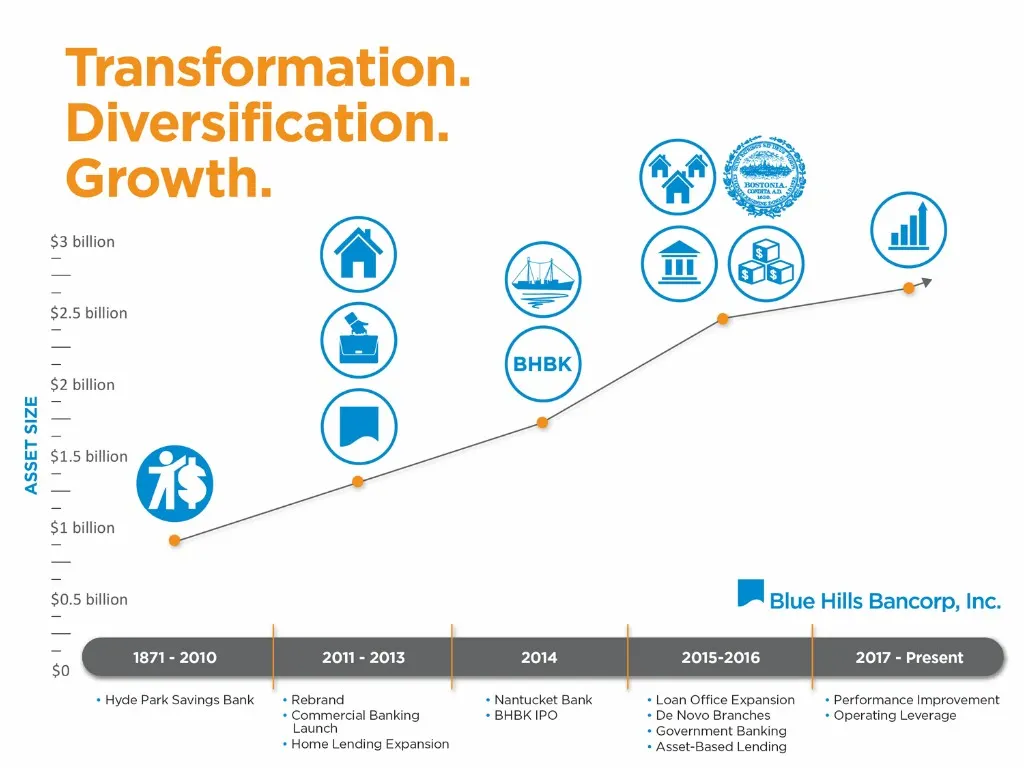
Slide 3: Transformation. Diversification. Growth.
ASSET SIZE Transformation. Diversification. Growth. $3 billion @) $2.5 billion @) $2 billion $1.5 billion $1 billion $0.5 billion 1871 - 2010 2011 - 2013 A Blue Hills Bancorp, Inc. 2015-2016 2017 - Present + Hyde Park Savings Bank + Rebrand + Commercial Banking Launch + Home Lending Expansion + Nant
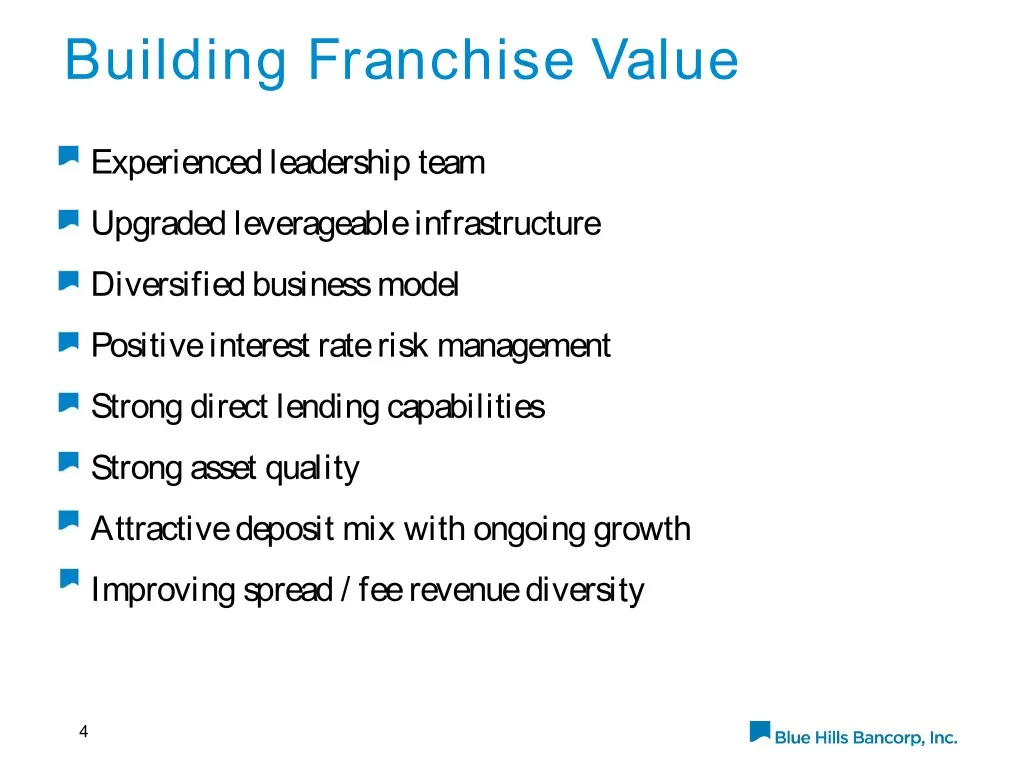
Slide 4: Building Franchise Value
Building Franchise Value Experienced leadership team Upgraded leverageable infrastructure Diversified business model Positive interest rate risk management Strong direct lending capabilities Strong asset quality Attractive deposit mix with ongoing growth Improving spread / fee revenue diversity 4
Slide 5: Attractive Footprint
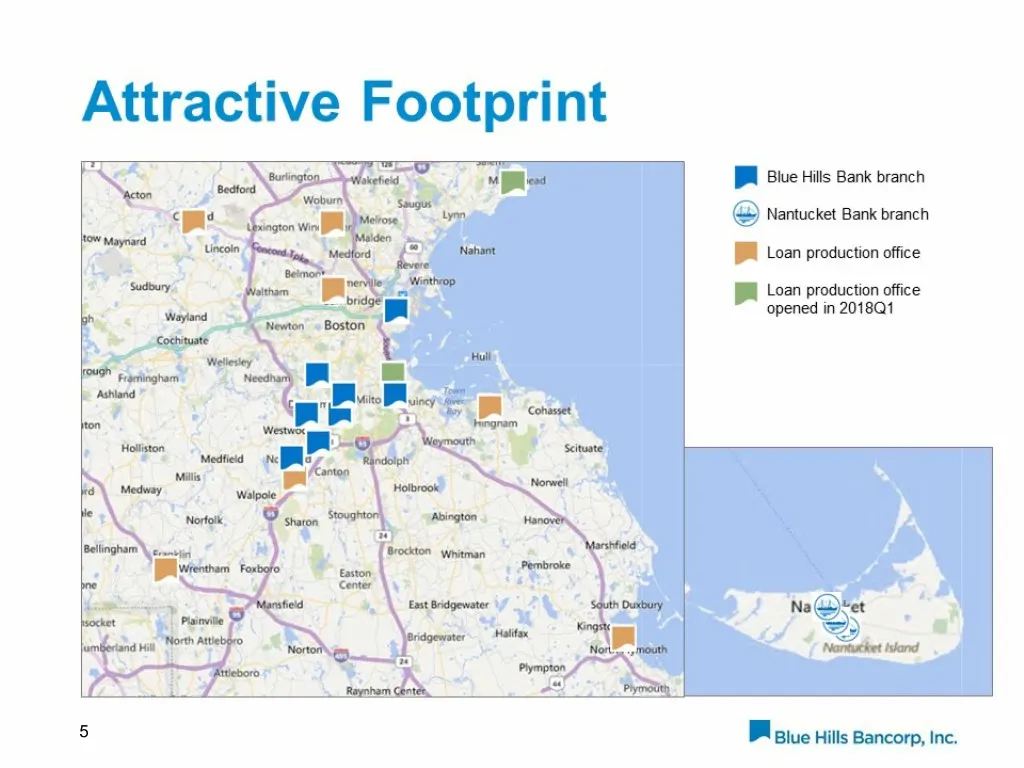
Attractive Footprint DAR Blue Hills Bank branch © Nantucket Bank branch [BM Loan production office JJM Loan production office opened in 2018Q1 5 Baiue tills Bancorp, Inc.
Slide 6: Loan Driven Growth
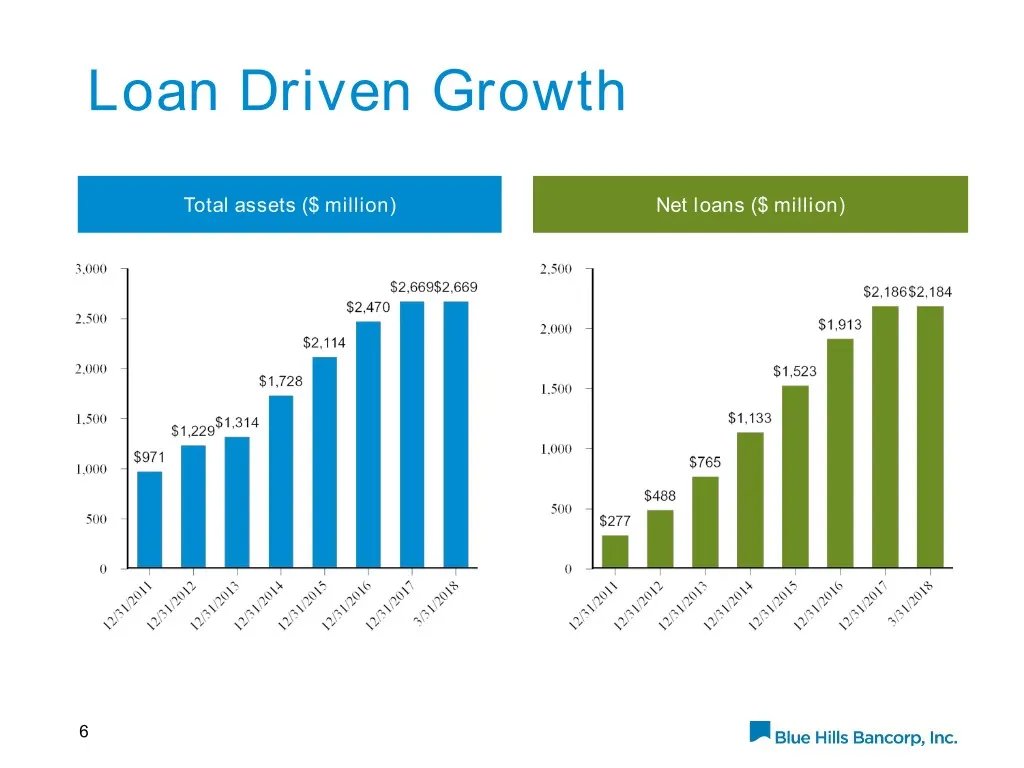
Loan Driven Growth Total assets ($ million) Net loans ($ million) 6
Slide 7: Well Diversified Portfolio
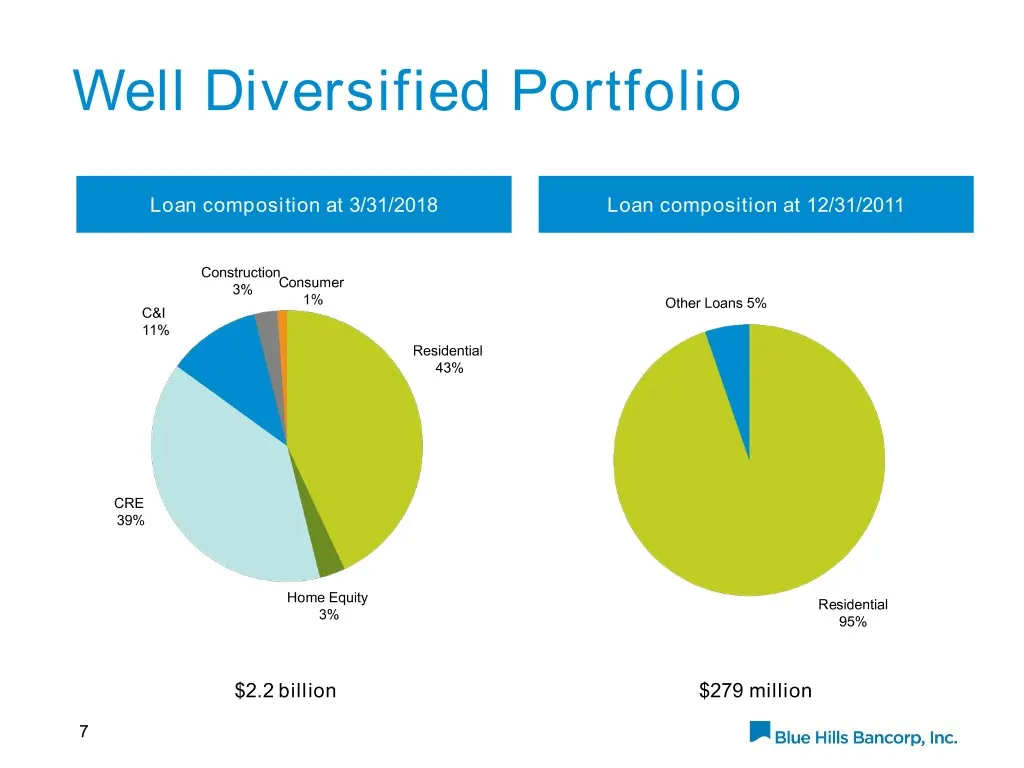
Well Diversified Portfolio Loan composition at 3/31/2018 Loan composition at 12/31/2011 Construction Consumer 3% 1% Other Loans 5% C&I 11% Residential 43% CRE 39% Home Equity Residential 3% 95% $2.2 billion $279 million 7
Slide 8: Valuable Origination Platform
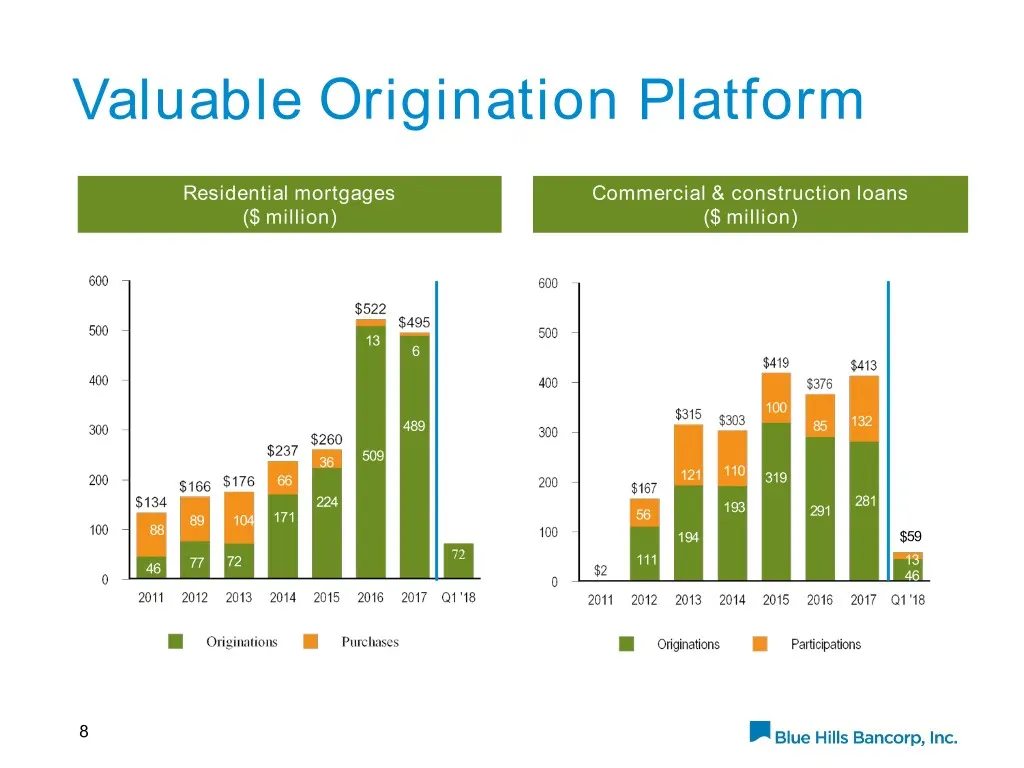
Valuable Origination Platform Residential mortgages Commercial & construction loans ($ million) ($ million) 13 6 100 489 85 132 36 509 110 66 121 319 224 281 193 291 89 104 171 56 88 194 $59 111 13 46 77 72 46 8
Slide 9: Improved Deposit Mix
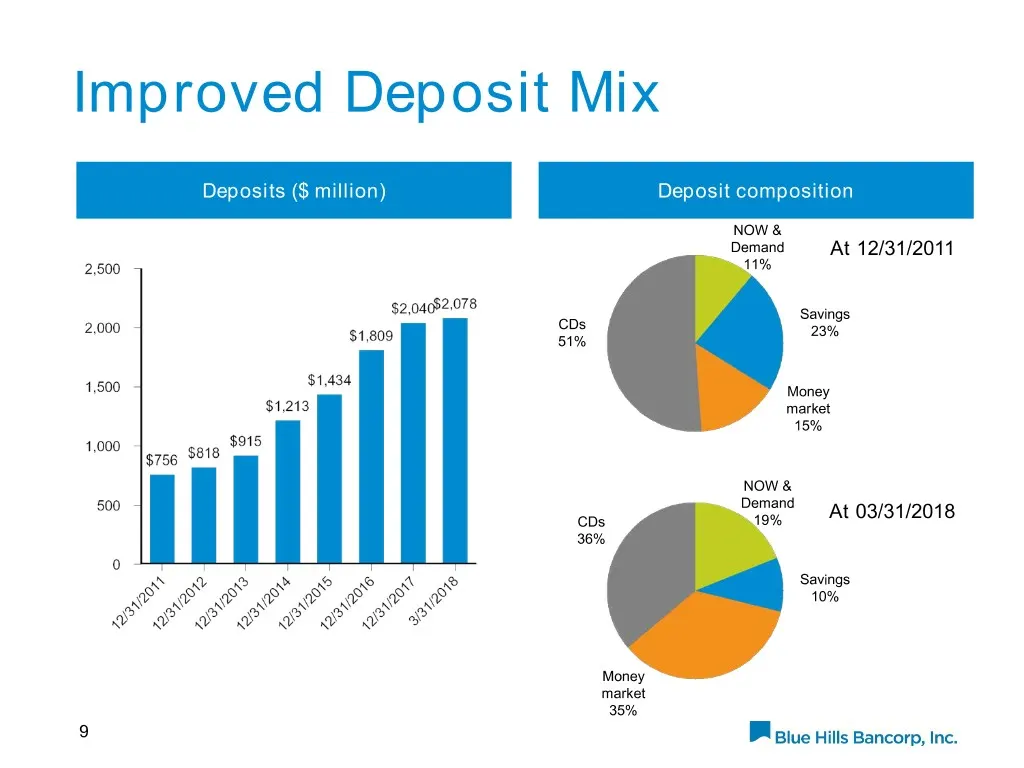
Improved Deposit Mix Deposits ($ million) Deposit composition NOW & Demand At 12/31/2011 11% Savings CDs 23% 51% Money market 15% NOW & Demand CDs 19% At 03/31/2018 36% Savings 10% Money market 35% 9
Slide 10: Net Interest Income Growth
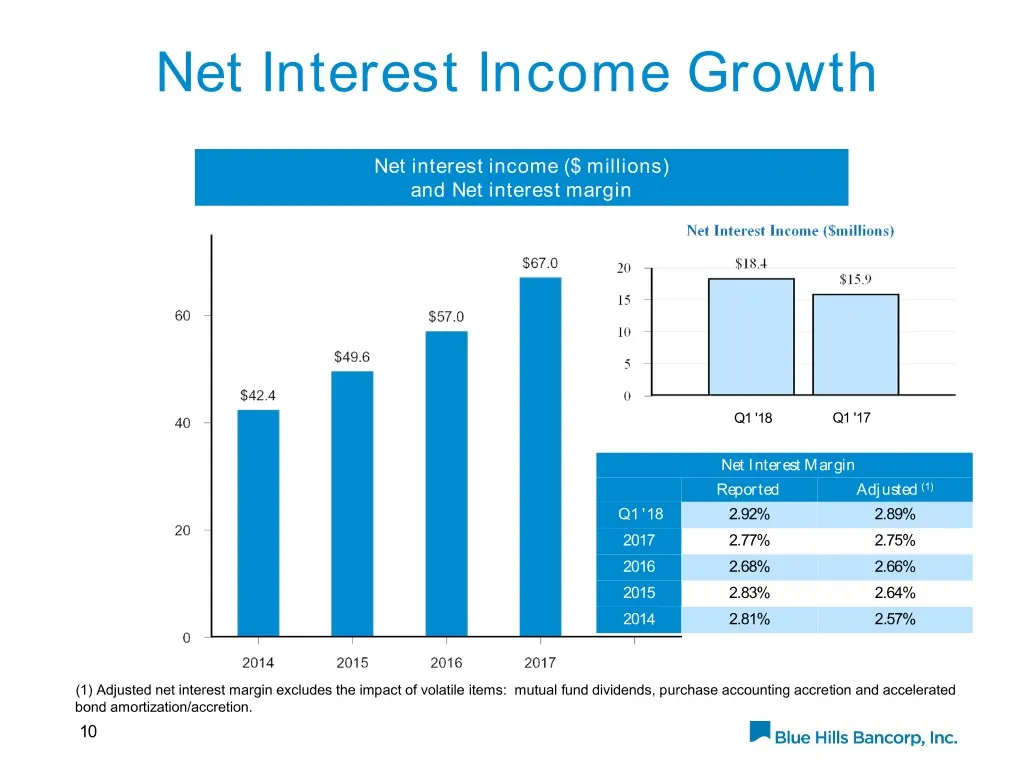
Net Interest Income Growth Net interest income ($ millions) and Net interest margin Q1 '18 Q1 '17 Net Interest Margin Reported Adjusted (1) Q1 '18 2.92% 2.89% 2017 2.77% 2.75% 2016 2.68% 2.66% 2015 2.83% 2.64% 2014 2.81% 2.57% (1) Adjusted net interest margin excludes the impact of volatile items: m
Slide 11: Improving Core Fee Income
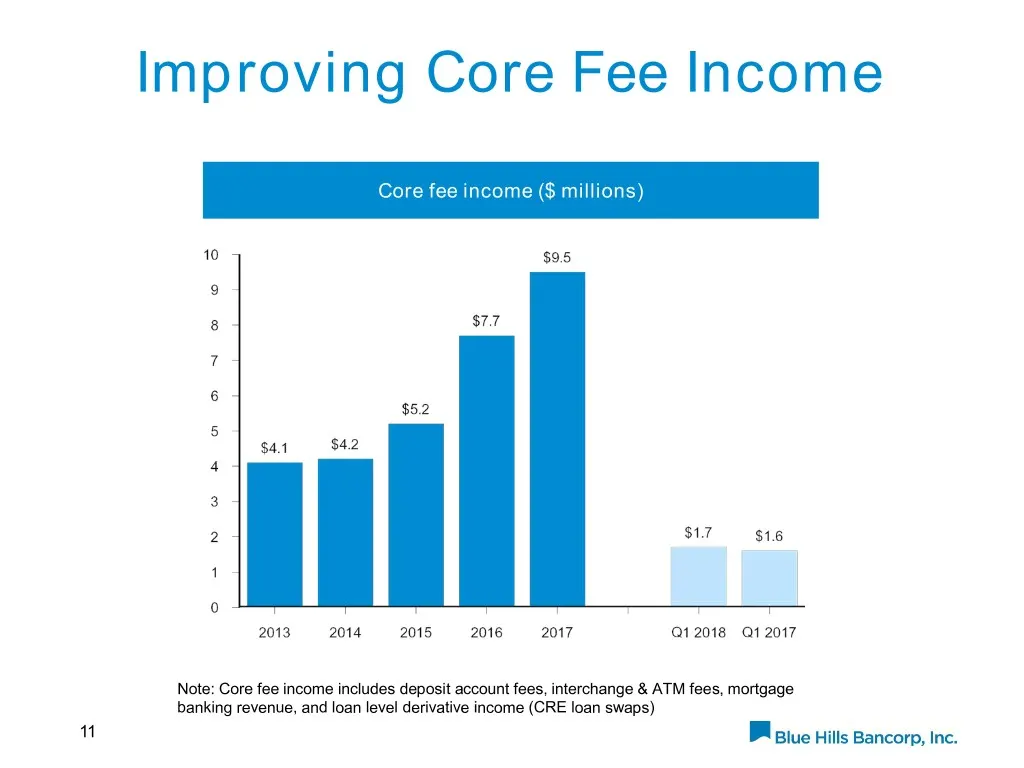
Improving Core Fee Income Core fee income ($ millions) Note: Core fee income includes deposit account fees, interchange & ATM fees, mortgage banking revenue, and loan level derivative income (CRE loan swaps) 11
Slide 12: Leverageable Infrastructure
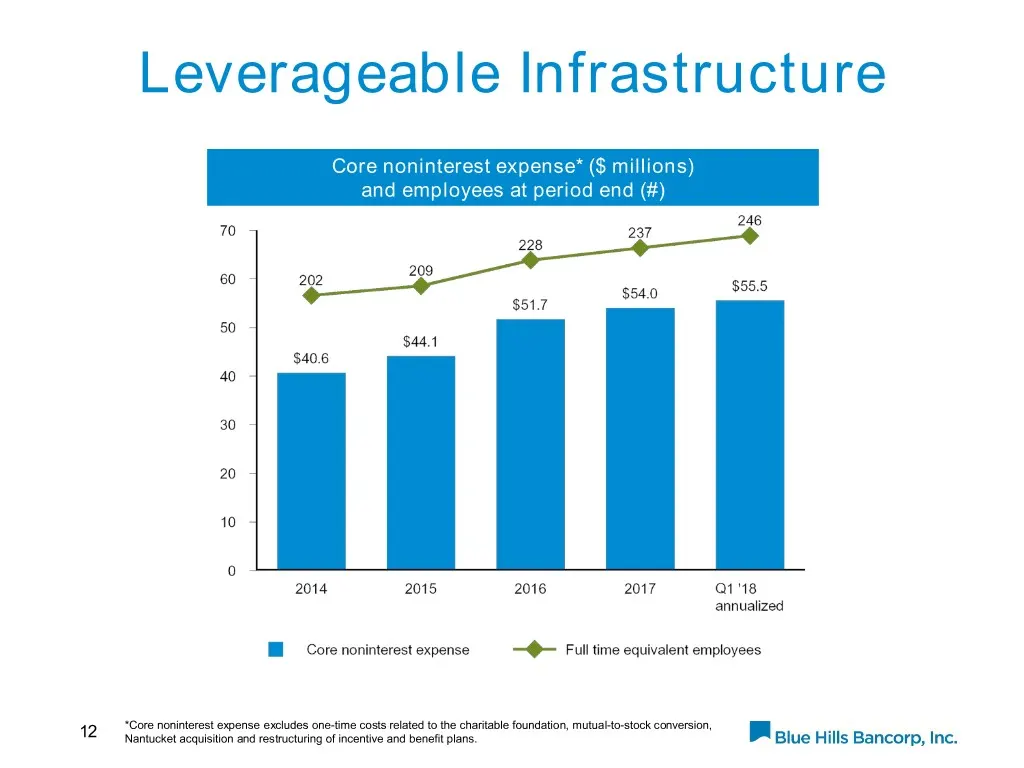
Leverageable Infrastructure Core noninterest expense* ($ millions) and employees at period end (#) *Core noninterest expense excludes one-time costs related to the charitable foundation, mutual-to-stock conversion, 12 Nantucket acquisition and restructuring of incentive and benefit plans.
Slide 13: Noninterest Expense Growth
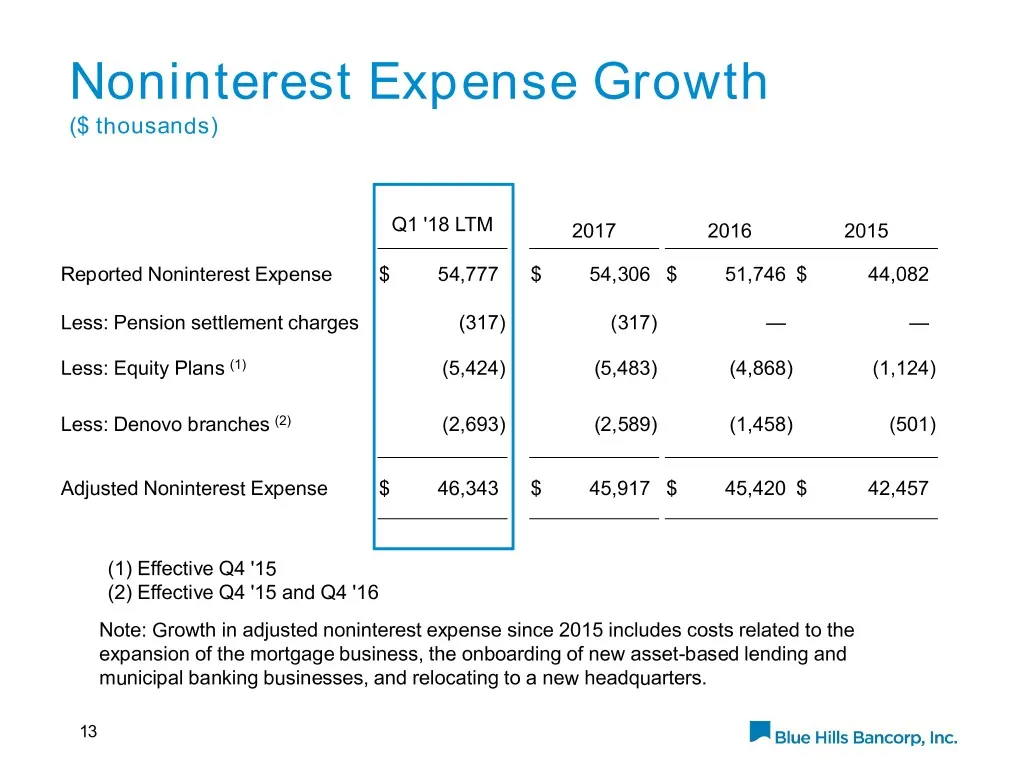
Noninterest Expense Growth ($ thousands) Q1 '18 LTM 2017 2016 2015 Reported Noninterest Expense $ 54,777 $ 54,306 $ 51,746 $ 44,082 Less: Pension settlement charges (317) (317) — — Less: Equity Plans (1) (5,424) (5,483) (4,868) (1,124) Less: Denovo branches (2) (2,693) (2,589) (1,458) (501) Adjusted
Slide 14: Improvement in Earnings
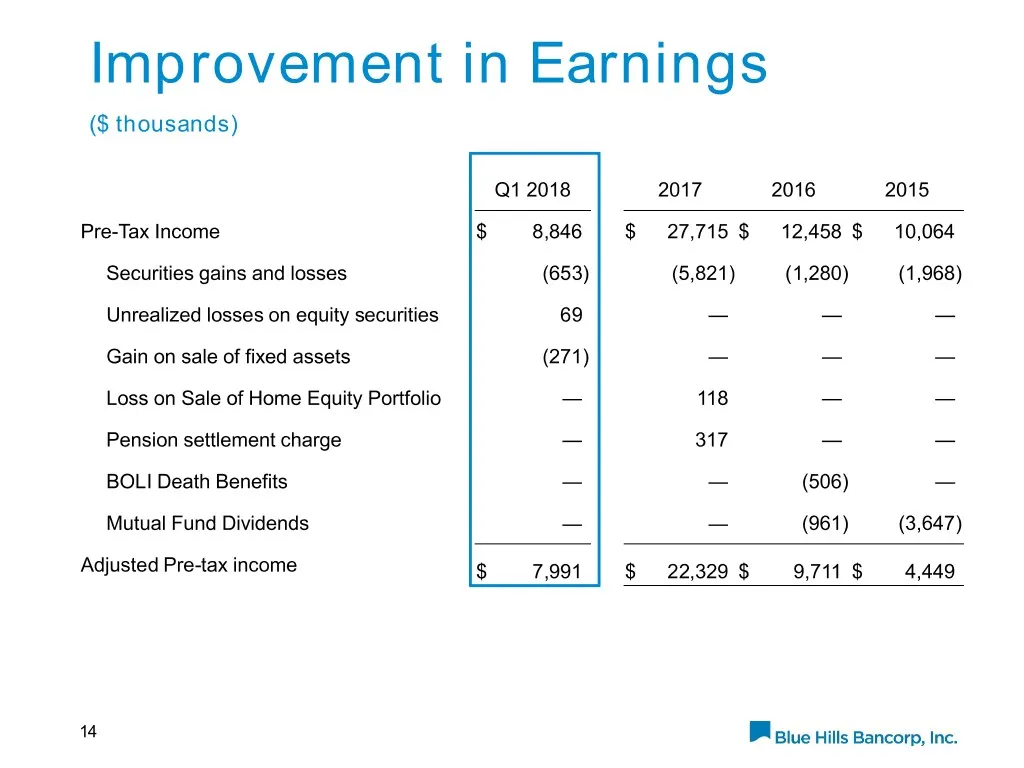
Improvement in Earnings ($ thousands) Q1 2018 2017 2016 2015 Pre-Tax Income $ 8,846 $ 27,715 $ 12,458 $ 10,064 Securities gains and losses (653) (5,821) (1,280) (1,968) Unrealized losses on equity securities 69 — — — Gain on sale of fixed assets (271) — — — Loss on Sale of Home Equity Portfolio — 11
Slide 15: Positive Operating Leverage
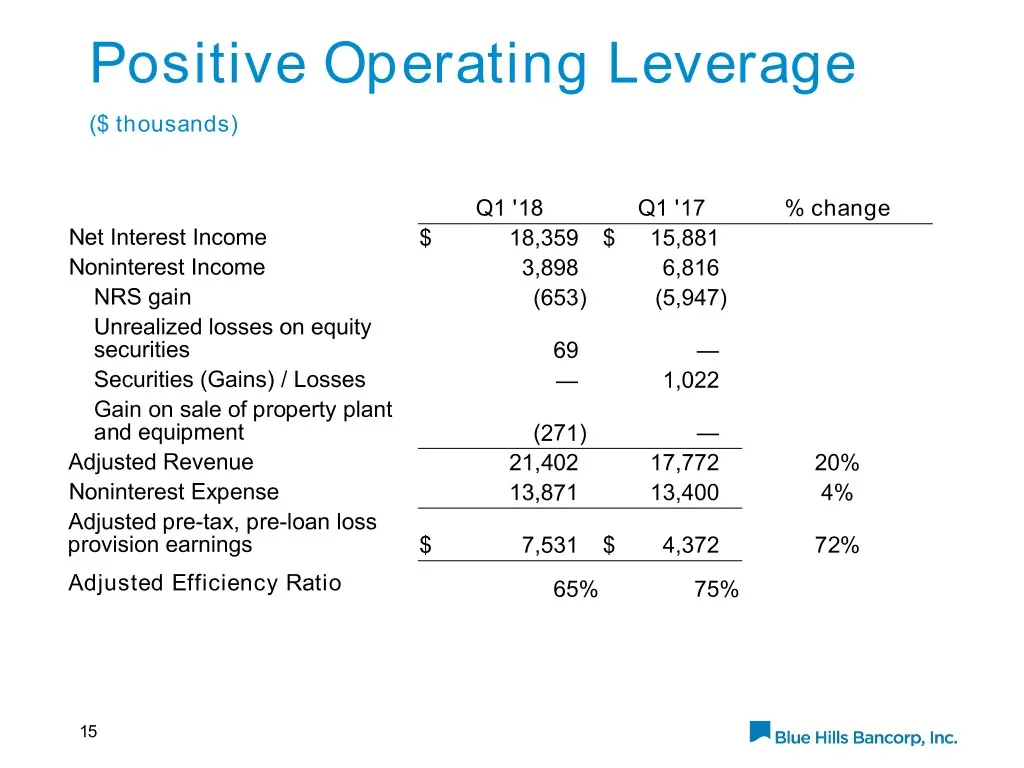
Positive Operating Leverage ($ thousands) Q1 '18 Q1 '17 % change Net Interest Income $ 18,359 $ 15,881 Noninterest Income 3,898 6,816 NRS gain (653) (5,947) Unrealized losses on equity securities 69 — Securities (Gains) / Losses — 1,022 Gain on sale of property plant and equipment (271) — Adjusted R
Slide 16: Reserve Coverage
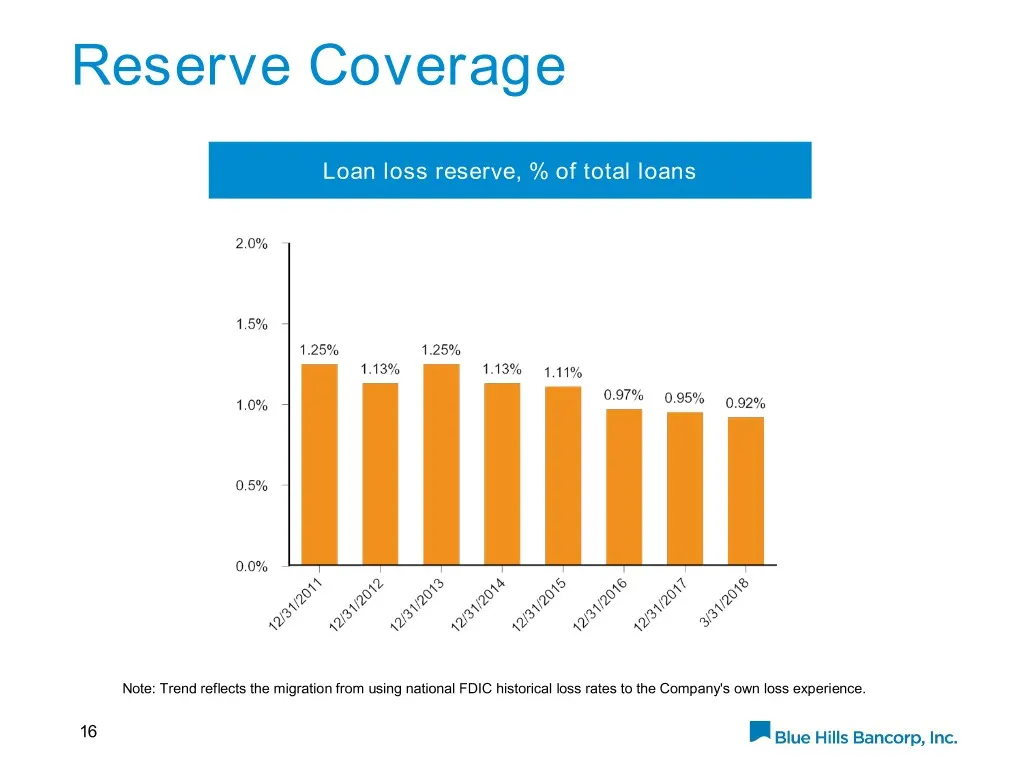
Reserve Coverage Loan loss reserve, % of total loans Note: Trend reflects the migration from using national FDIC historical loss rates to the Company's own loss experience. 16
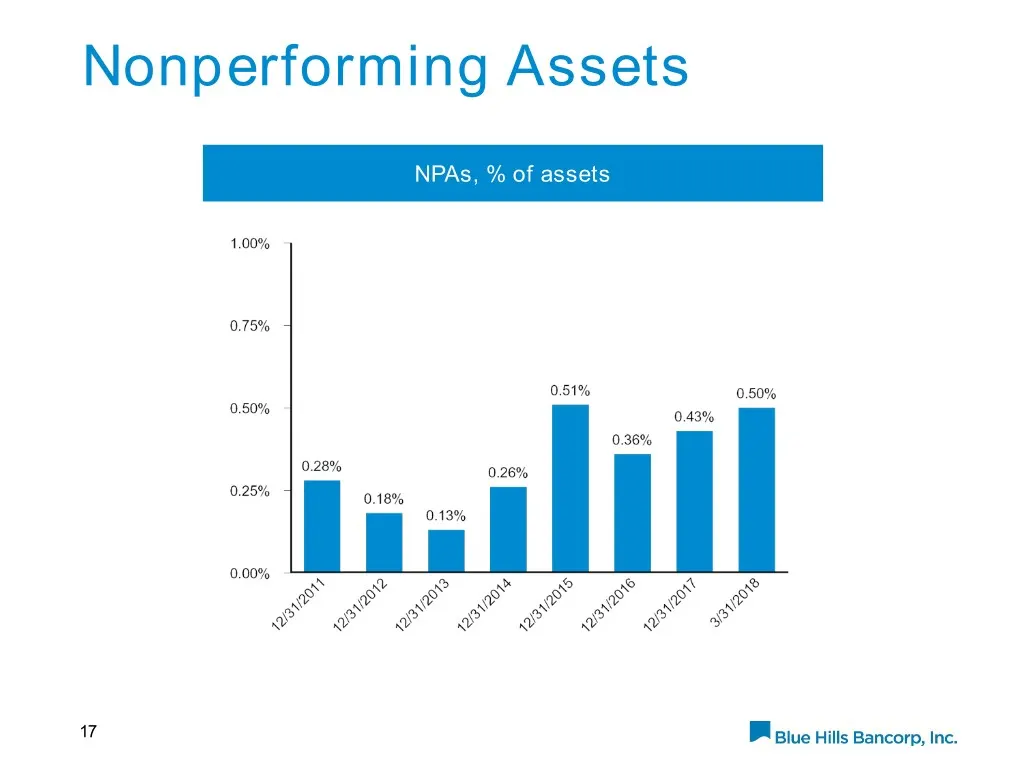
Slide 17: Nonperforming Assets
Nonperforming Assets NPAs, % of assets 17
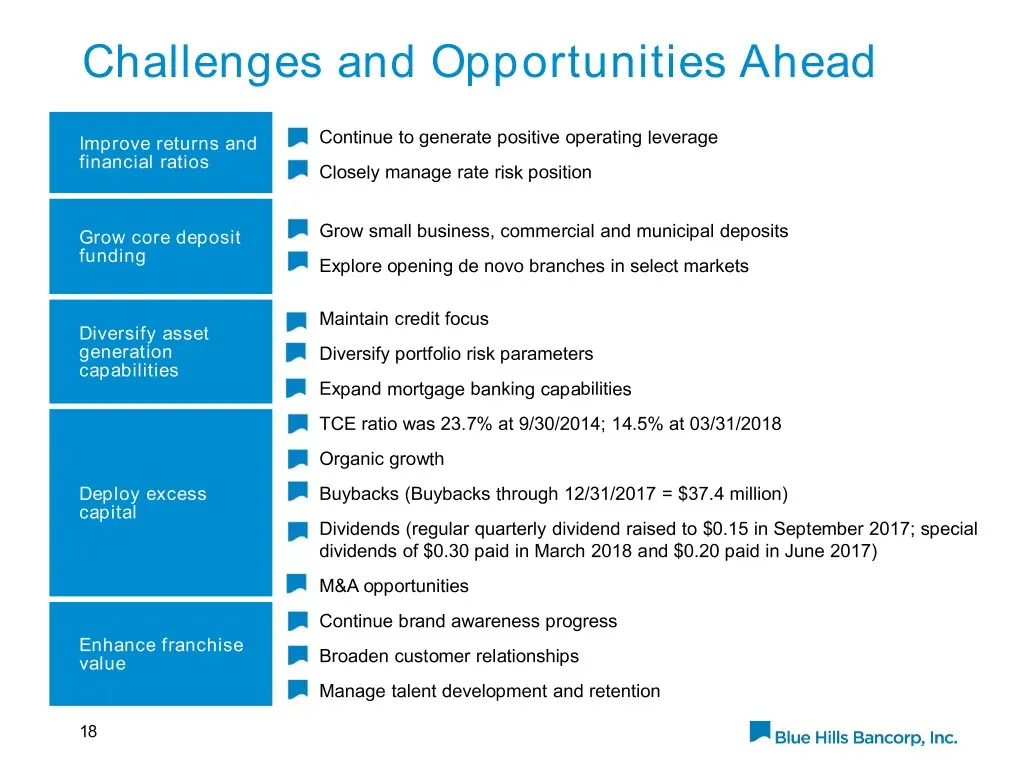
Slide 18: Challenges and Opportunities Ahead
Challenges and Opportunities Ahead Improve returns and Continue to generate positive operating leverage financial ratios Closely manage rate risk position Grow core deposit Grow small business, commercial and municipal deposits funding Explore opening de novo branches in select markets Maintain cred
Slide 19: Appendix
Appendix Praiue tills Bancorp, inc.
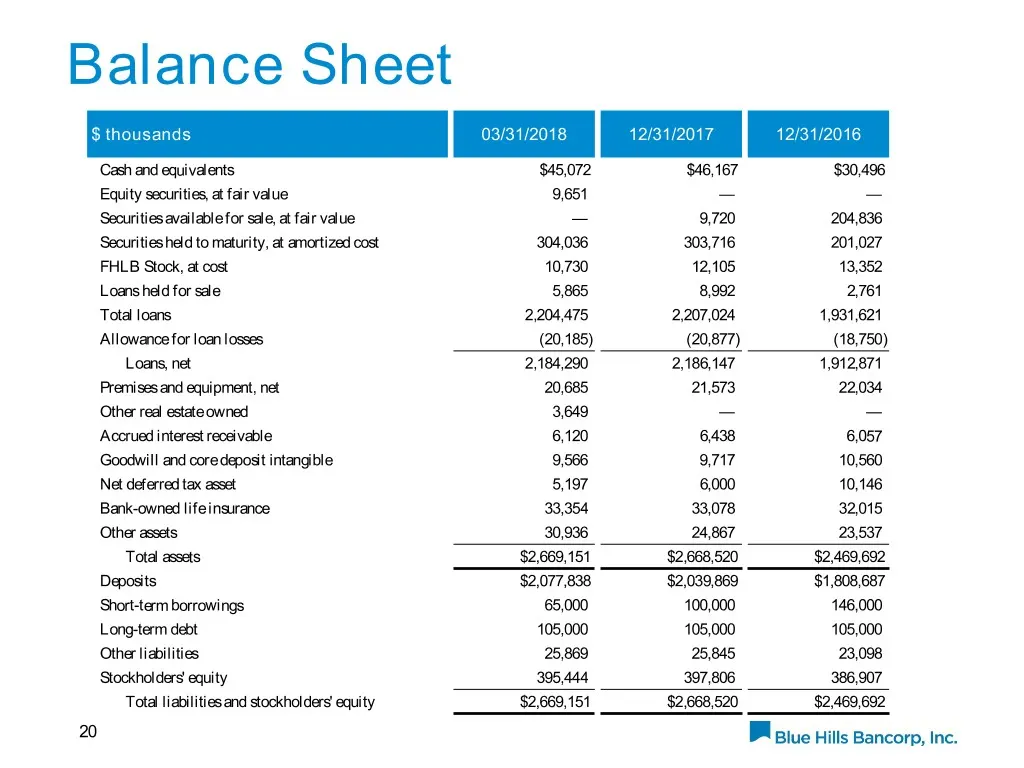
Slide 20: Balance Sheet
Balance Sheet $ thousands 03/31/2018 12/31/2017 12/31/2016 Cash and equivalents $45,072 $46,167 $30,496 Equity securities, at fair value 9,651 — — Securities available for sale, at fair value — 9,720 204,836 Securities held to maturity, at amortized cost 304,036 303,716 201,027 FHLB Stock, at cost 1
Slide 21: Income Statement
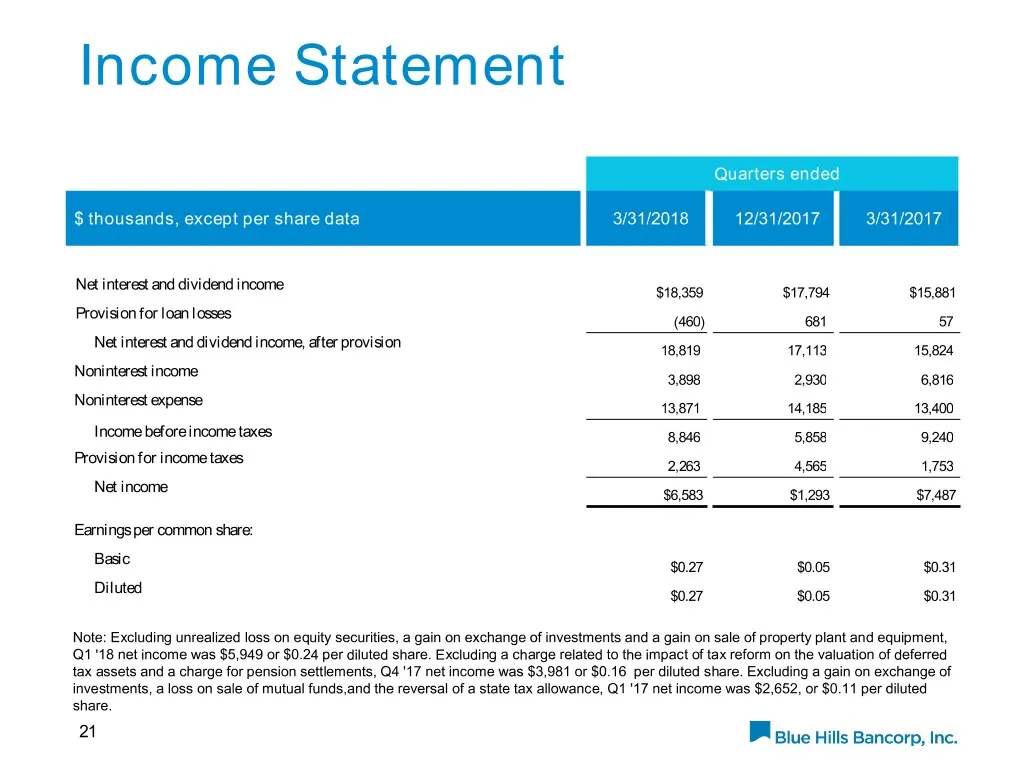
Income Statement Quarters ended $ thousands, except per share data 3/31/2018 12/31/2017 3/31/2017 Net interest and dividend income $18,359 $17,794 $15,881 Provision for loan losses (460) 681 57 Net interest and dividend income, after provision 18,819 17,113 15,824 Noninterest income 3,898 2,930 6,81
Slide 22: Loans and Deposits
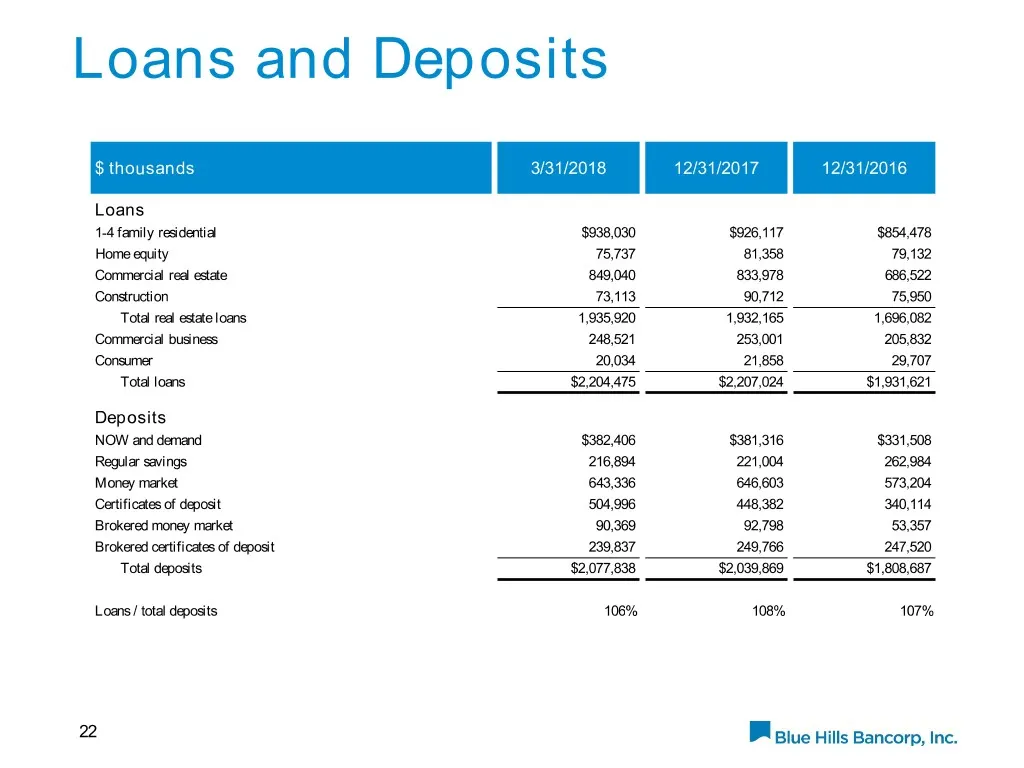
Loans and Deposits $ thousands 3/31/2018 12/31/2017 12/31/2016 Loans 1-4 family residential $938,030 $926,117 $854,478 Home equity 75,737 81,358 79,132 Commercial real estate 849,040 833,978 686,522 Construction 73,113 90,712 75,950 Total real estate loans 1,935,920 1,932,165 1,696,082 Commercial bu
Slide 23: Financial Highlights
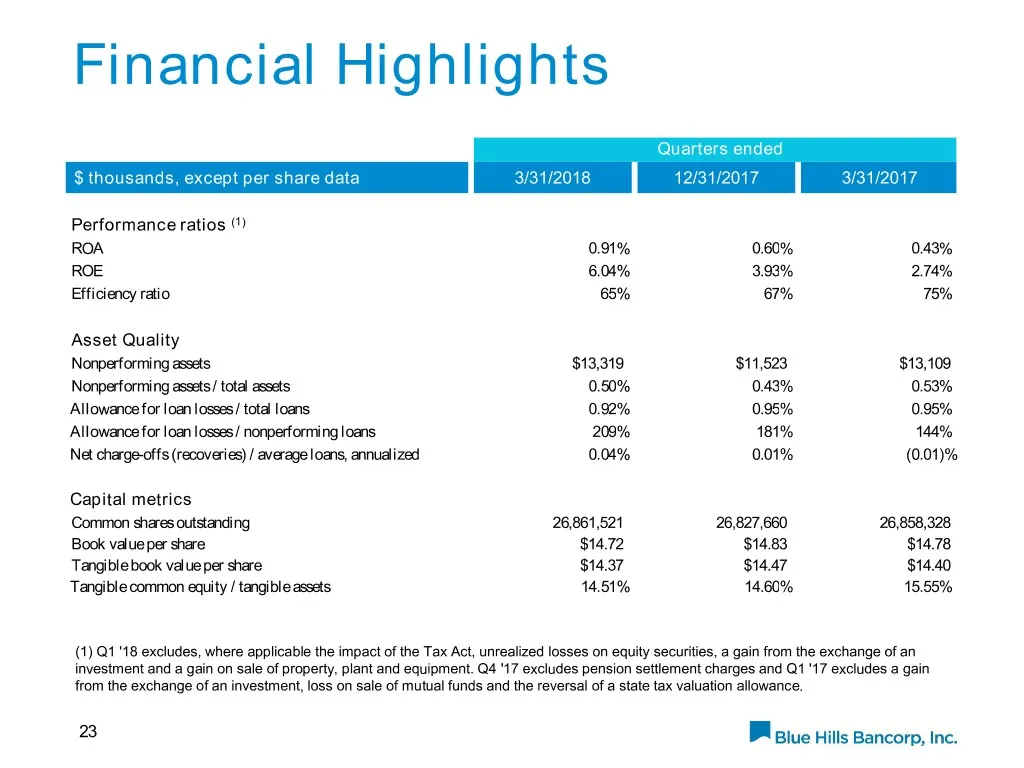
Financial Highlights Quarters ended $ thousands, except per share data 3/31/2018 12/31/2017 3/31/2017 Performance ratios (1) ROA 0.91% 0.60% 0.43% ROE 6.04% 3.93% 2.74% Efficiency ratio 65% 67% 75% Asset Quality Nonperforming assets $13,319 $11,523 $13,109 Nonperforming assets / total assets 0.50% 0
Source: SEC EDGAR · 8-K filed May 11, 2018
More decks from Blue Hills Bancorp Inc
 Merger or Acquisition (September 2018)16 slides · Sep 20, 2018
 Keefe Bruyette & Woods 2018 Community Bank Investor Conference28 slides · Jul 31, 2018
 Shareholder Meeting (May 2018)24 slides · May 16, 2018
 Compass Point Investor Meetings (December 2017)24 slides · Dec 6, 2017
 Piper Jaffray New England Bank Symposium 201724 slides · Sep 28, 2017
 Keefe, Bruyette & Woods 2017 Community Bank Investor Conference24 slides · Aug 1, 2017