Blue Hills Bancorp — Compass Point Investor Meetings (December 2017)
24 slides from Blue Hills Bancorp's conference presentation, Dec 6, 2017
Slide 1: Transformation. Diversification. Growth.
Title 1 Footnote. Compass Point Investor Meetings December 6, 2017 Transformation. Diversification. Growth.
Slide 2: Forward-Looking Statements
Forward-Looking Statements This presentation, as well as other written communications made from time to time by the Company and its subsidiaries and oral communications made from time to time by authorized officers of the Company, may contain statements relating to the future results of the Company
Slide 3: Asset Size
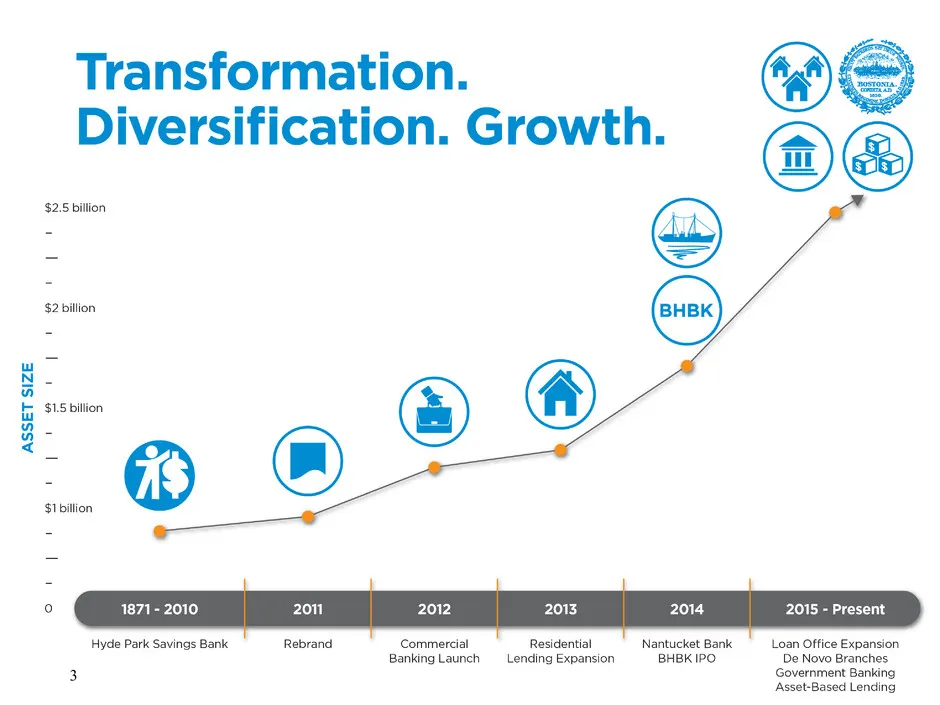
ASSET SIZE Transformation. Diversification. Growth. $25 billion $2 billion $15 billion $1billion ° 1871-2010 Hyde Park Savings Bank Rebrand ce Bani mmercial ‘1 ial king Launch Residenti Lending Expat insion BHBK Nantucket Bank BHBK IPO. 2015 - Present Loan Office Expansion De Novo Branches Governmen
Slide 4: Building Franchise Value
Building Franchise Value Experienced leadership team Upgraded leverageable infrastructure Diversified business model Strong direct lending capabilities Strong asset quality Attractive deposit mix with ongoing growth Improving spread / fee revenue diversity 4
Slide 5: Attractive Footprint
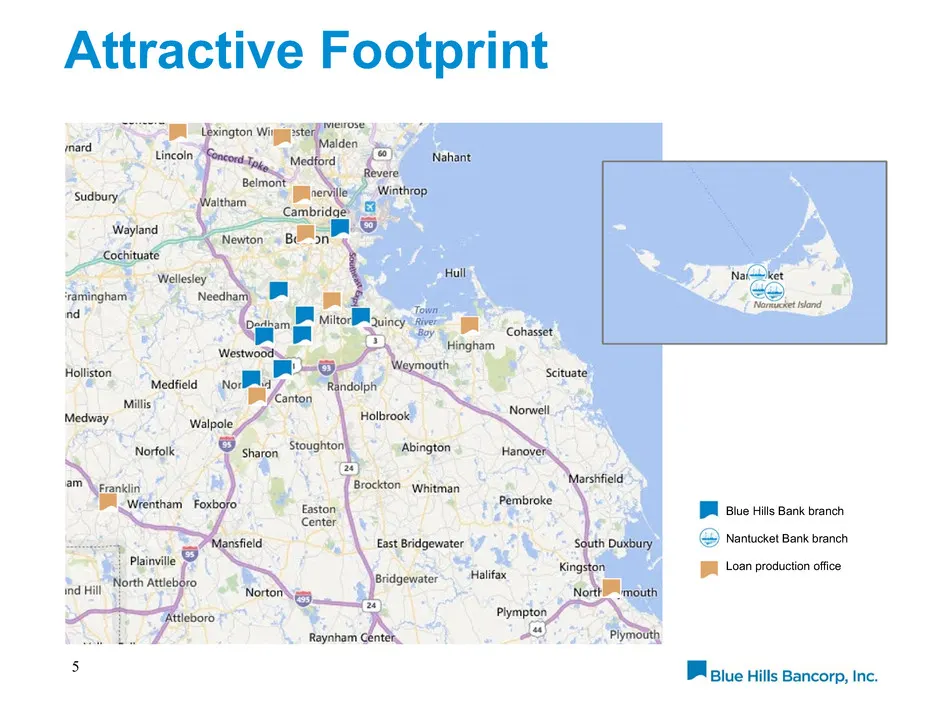
Attractive Footprint 5 Blue Hills Bank branch Loan production office Nantucket Bank branch
Slide 6: Loan Driven Growth
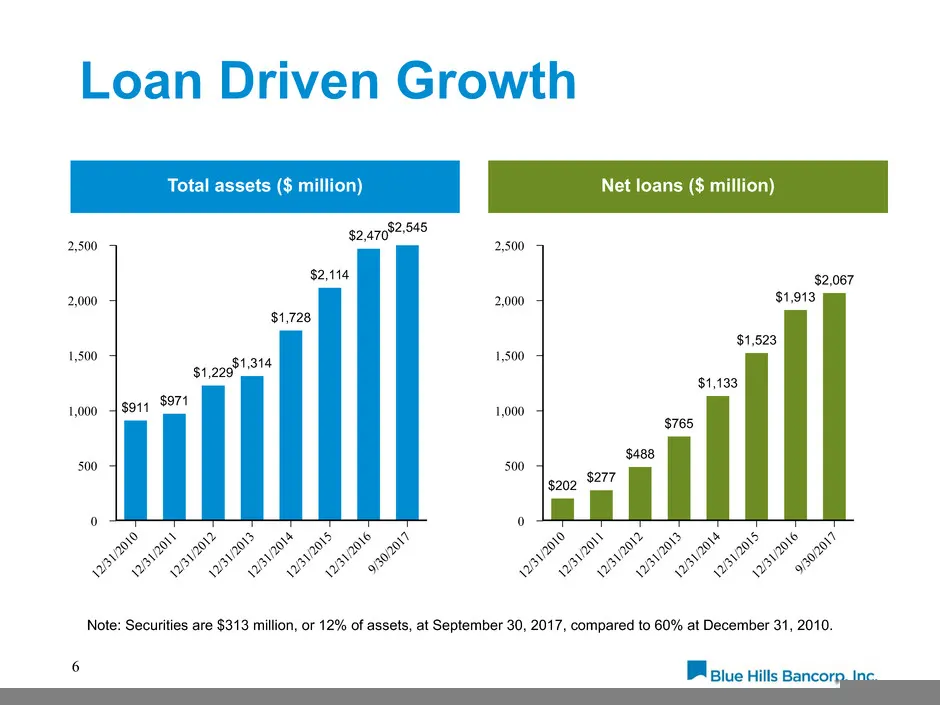
Loan Driven Growth 6 Total assets ($ million) Net loans ($ million) 2,500 2,000 1,500 1,000 500 0 12 /31 /20 10 12 /31 /20 11 12 /31 /20 12 12 /31 /20 13 12 /31 /20 14 12 /31 /20 15 12 /31 /20 16 9/3 0/2 01 7 $911 $971 $1,229 $1,314 $1,728 $2,114 $2,470$2,545 2,500 2,000 1,500 1,000 500 0 12 /31 /20
Slide 7: Well Diversified Portfolio
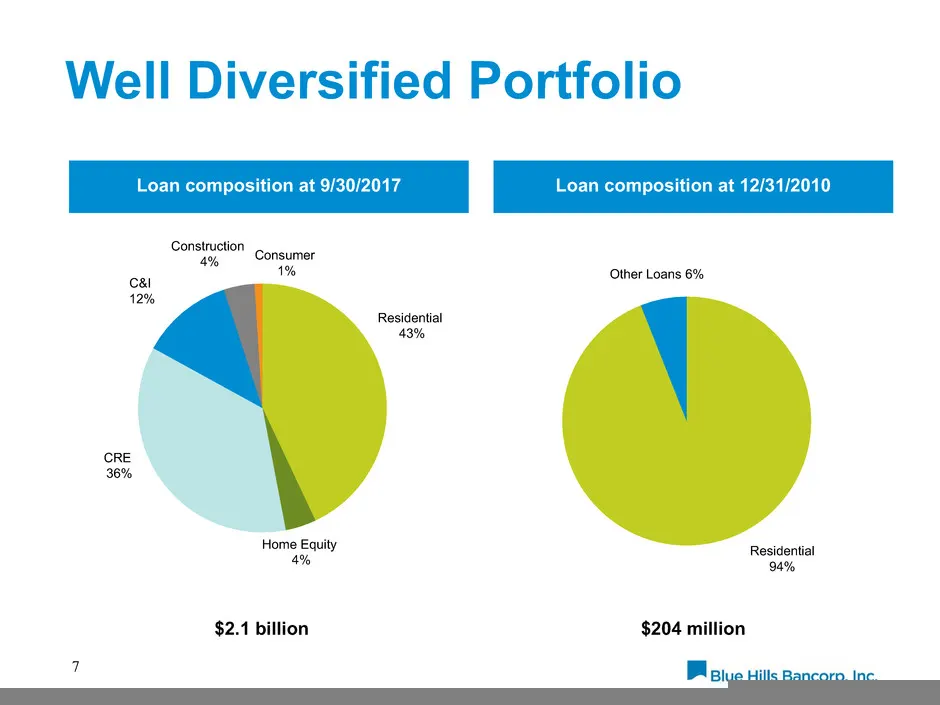
Well Diversified Portfolio 7 Loan composition at 9/30/2017 Loan composition at 12/31/2010 $2.1 billion $204 million Other Loans 6% Residential 94% Consumer 1% Construction 4% C&I 12% CRE 36% Home Equity 4% Residential 43%
Slide 8: Valuable Origination Platform
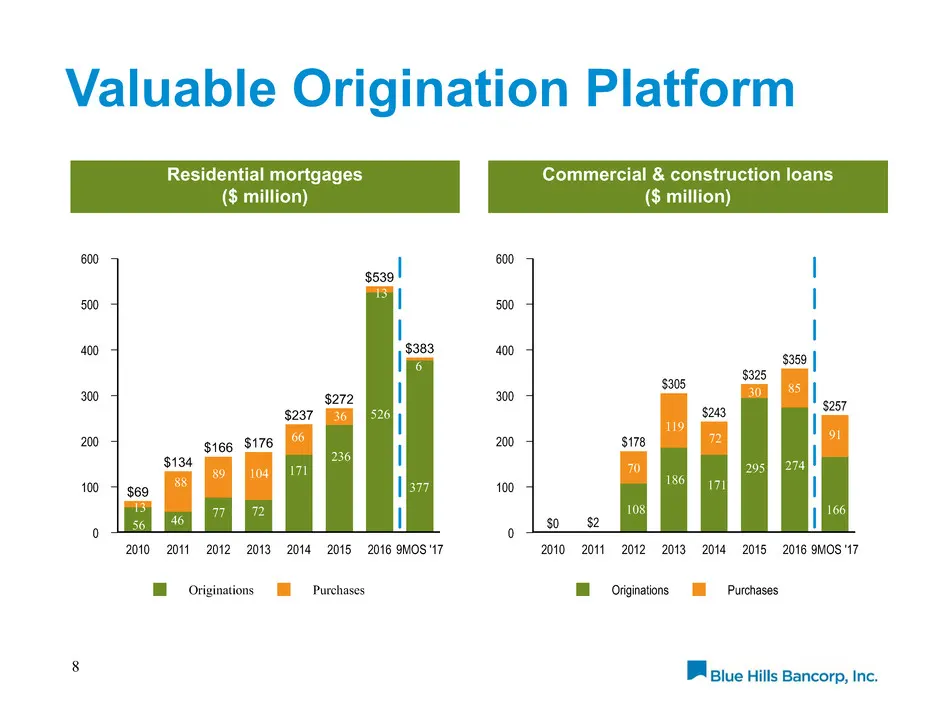
Valuable Origination Platform 8 Residential mortgages ($ million) Commercial & construction loans ($ million) Originations Purchases 600 500 400 300 200 100 0 2010 2011 2012 2013 2014 2015 2016 9MOS '17 $69 $134 $166 $176 $237 $272 $539 $383 Originations Purchases 600 500 400 300 200 100 0 2010 2011
Slide 9: Securities Restructuring
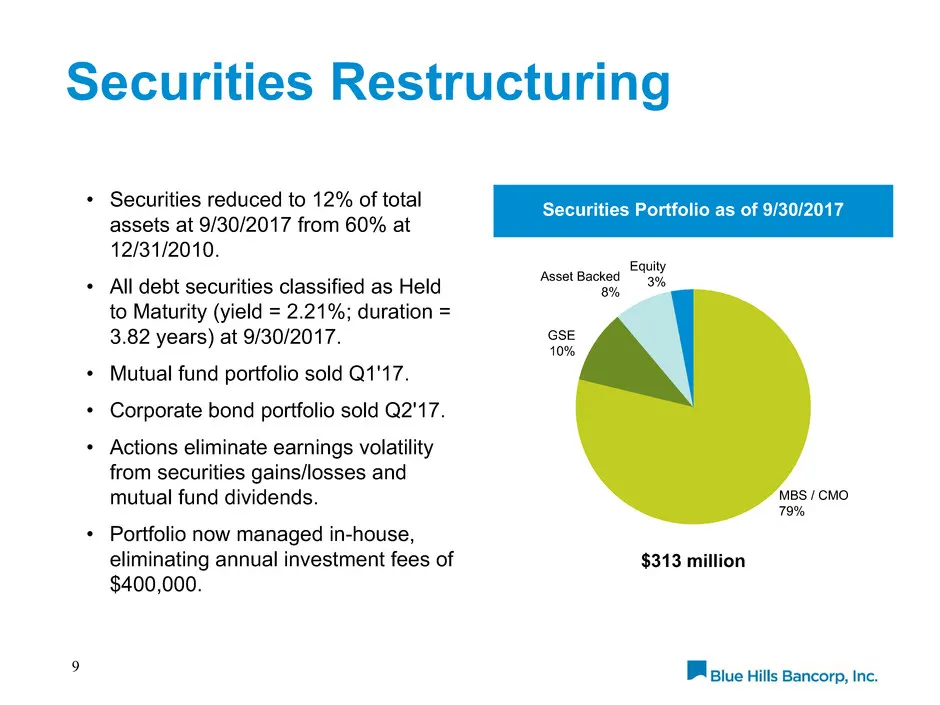
Securities Restructuring MBS / CMO 79% GSE 10% Asset Backed 8% Equity 3% • Securities reduced to 12% of total assets at 9/30/2017 from 60% at 12/31/2010. • All debt securities classified as Held to Maturity (yield = 2.21%; duration = 3.82 years) at 9/30/2017. • Mutual fund portfolio sold Q1'17. • Co
Slide 10: Improved Deposit Mix
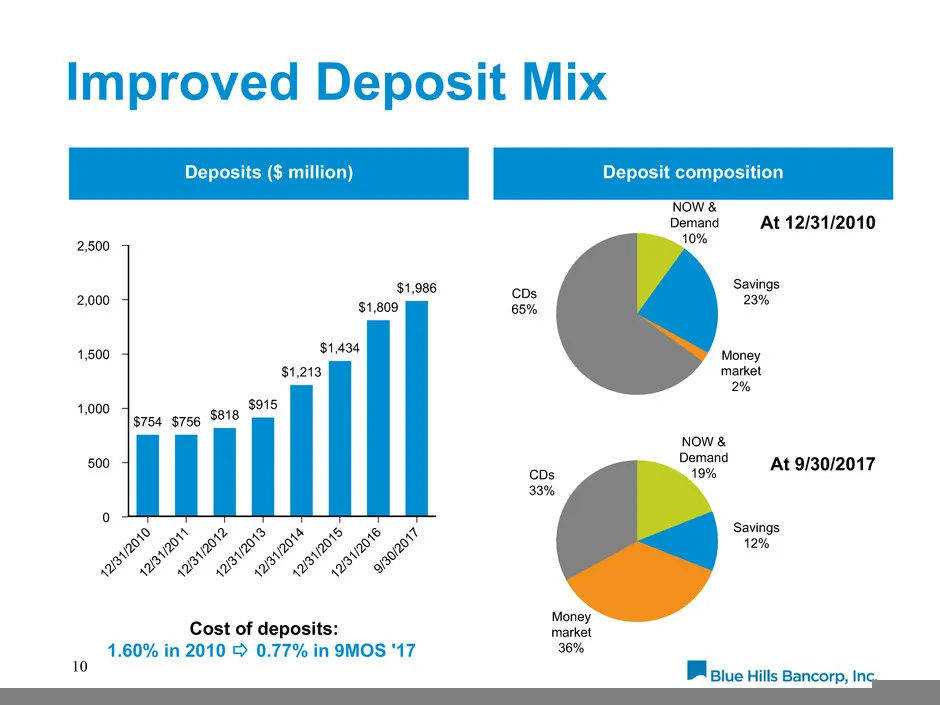
Improved Deposit Mix 10 Deposits ($ million) Deposit composition At 12/31/2010 At 9/30/2017 Cost of deposits: 1.60% in 2010 0.77% in 9MOS '17 2,500 2,000 1,500 1,000 500 0 12 /31 /20 10 12 /31 /20 11 12 /31 /20 12 12 /31 /20 13 12 /31 /20 14 12 /31 /20 15 12 /31 /20 16 9/3 0/2 01 7 $754 $756 $818 $9
Slide 11: Net Interest Income Growth
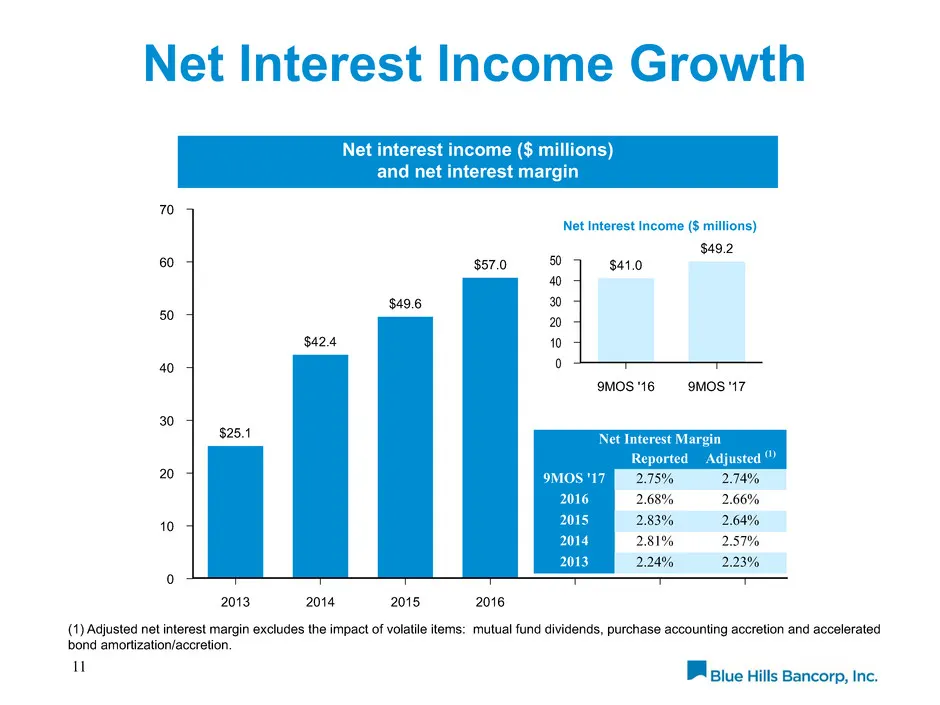
Net Interest Income Growth 11 Net interest income ($ millions) and net interest margin (1) Adjusted net interest margin excludes the impact of volatile items: mutual fund dividends, purchase accounting accretion and accelerated bond amortization/accretion. 70 60 50 40 30 20 10 0 2013 2014 2015 2016
Slide 12: Improving Core Fee Income
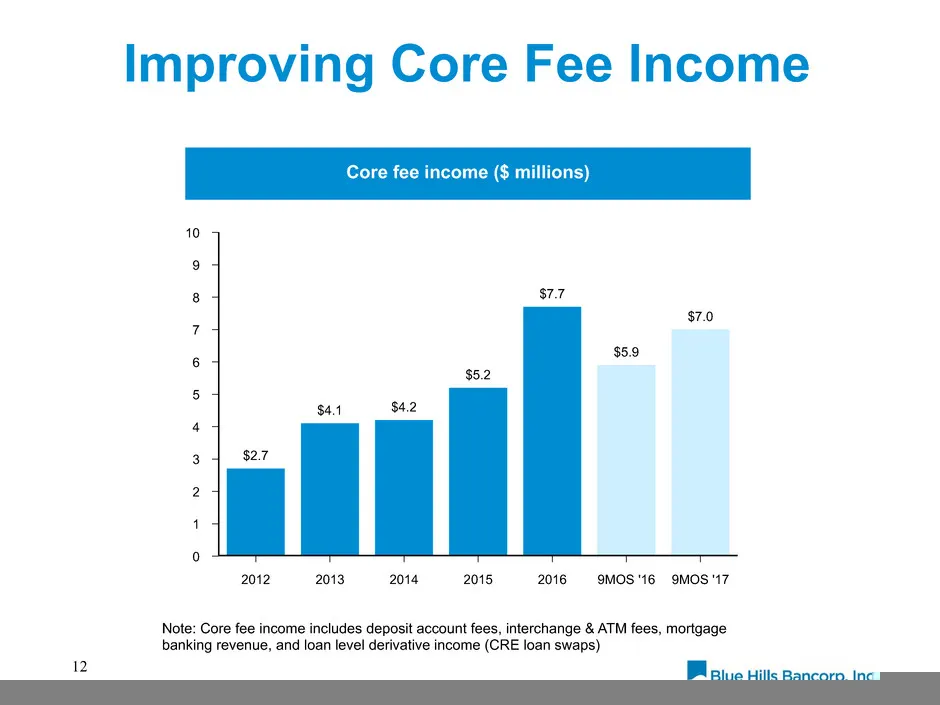
Improving Core Fee Income Note: Core fee income includes deposit account fees, interchange & ATM fees, mortgage banking revenue, and loan level derivative income (CRE loan swaps) 12 Core fee income ($ millions) 10 9 8 7 6 5 4 3 2 1 0 2012 2013 2014 2015 2016 9MOS '16 9MOS '17 $2.7 $4.1 $4.2 $5.2 $7.
Slide 13: Leverageable Infrastructure
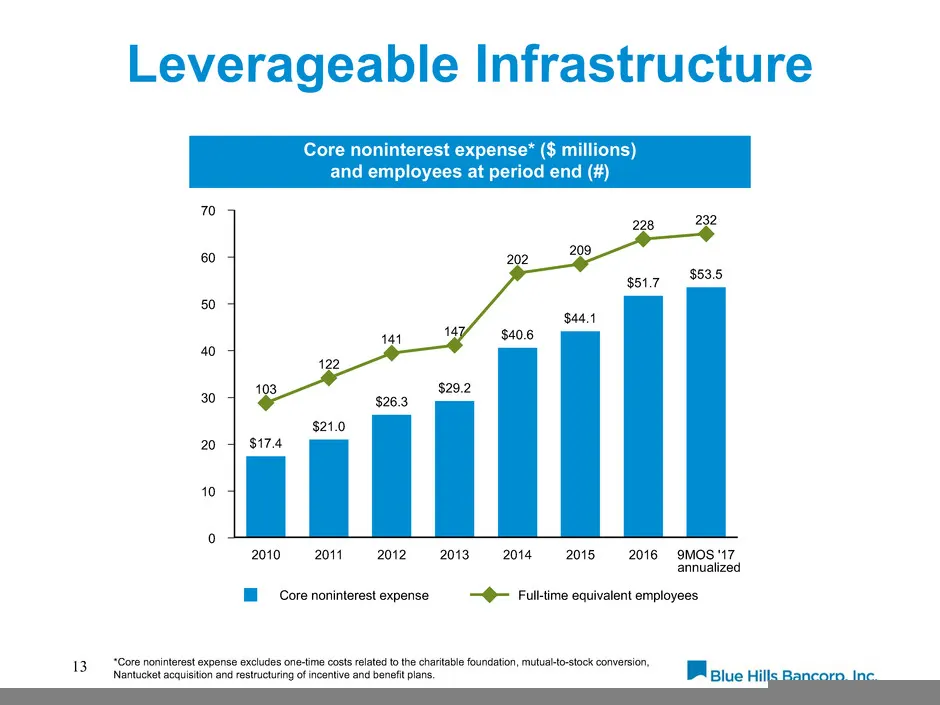
Leverageable Infrastructure 13 Core noninterest expense* ($ millions) and employees at period end (#) *Core noninterest expense excludes one-time costs related to the charitable foundation, mutual-to-stock conversion, Nantucket acquisition and restructuring of incentive and benefit plans. Core nonin
Slide 14: Noninterest Expense Growth
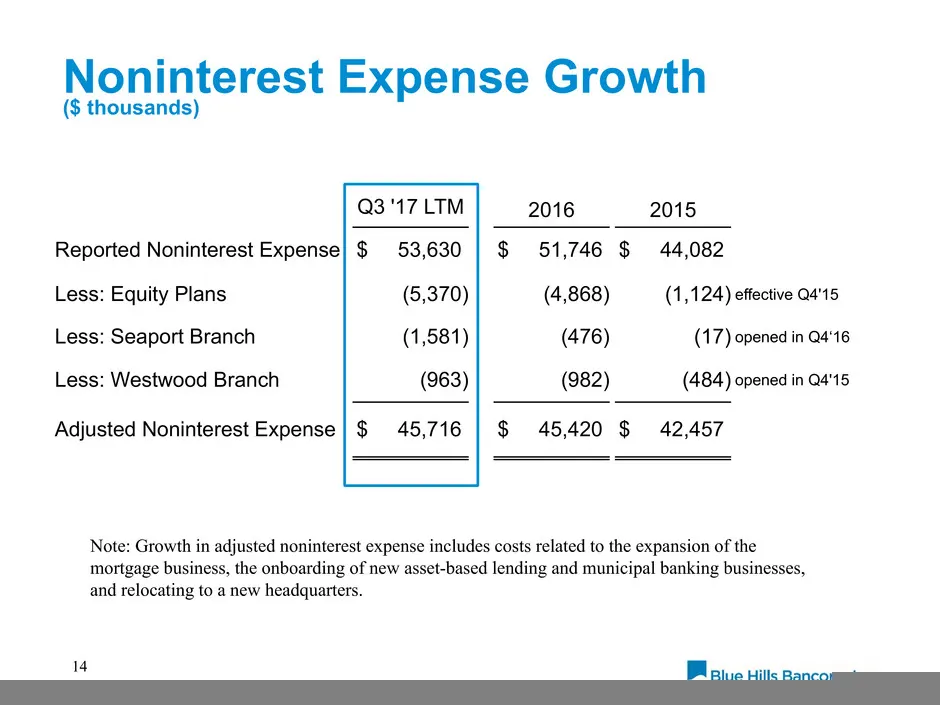
Noninterest Expense Growth ($ thousands) 14 Q3 '17 LTM 2016 2015 Reported Noninterest Expense $ 53,630 $ 51,746 $ 44,082 Less: Equity Plans (5,370) (4,868) (1,124) effective Q4'15 Less: Seaport Branch (1,581) (476) (17) opened in Q4‘16 Less: Westwood Branch (963) (982) (484) opened in Q4'15 Adjusted
Slide 15: Improvement in Earnings
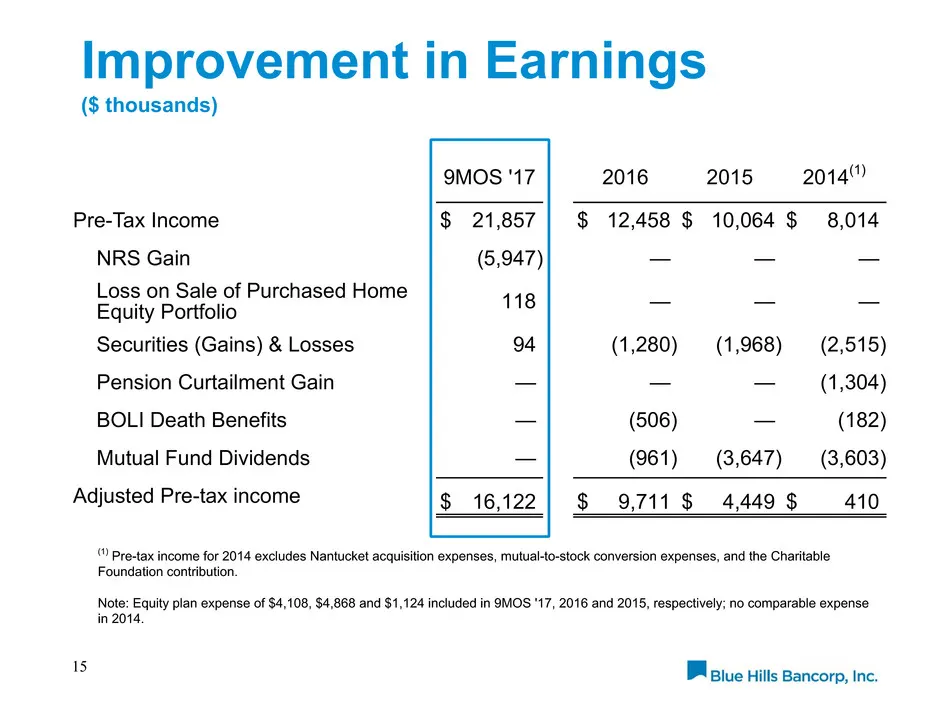
Improvement in Earnings ($ thousands) 15 9MOS '17 2016 2015 2014(1) Pre-Tax Income $ 21,857 $ 12,458 $ 10,064 $ 8,014 NRS Gain (5,947) — — — Loss on Sale of Purchased Home Equity Portfolio 118 — — — Securities (Gains) & Losses 94 (1,280) (1,968) (2,515) Pension Curtailment Gain — — — (1,304) BOLI De
Slide 16: Positive Operating Leverage
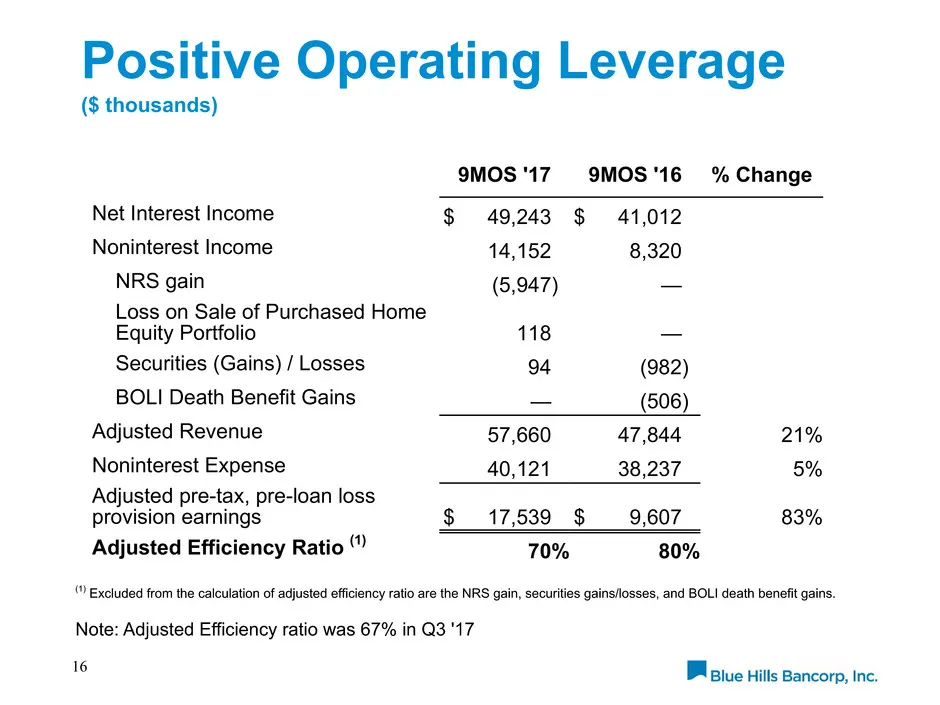
Positive Operating Leverage ($ thousands) 16 9MOS '17 9MOS '16 % Change Net Interest Income $ 49,243 $ 41,012 Noninterest Income 14,152 8,320 NRS gain (5,947) — Loss on Sale of Purchased Home Equity Portfolio 118 — Securities (Gains) / Losses 94 (982) BOLI Death Benefit Gains — (506) Adjusted Revenu
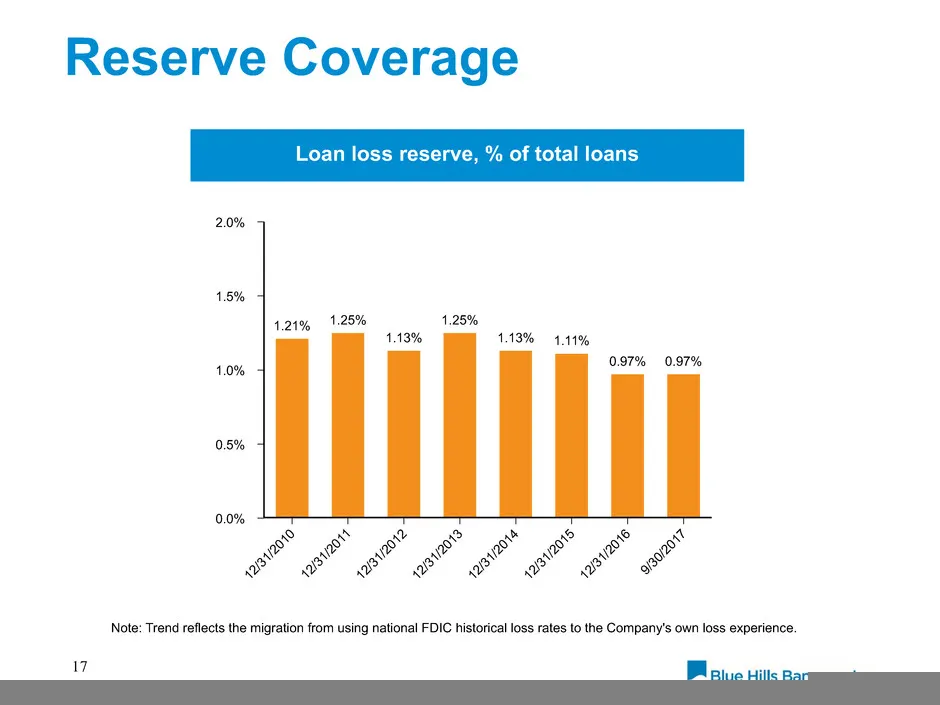
Slide 17: Reserve Coverage
Reserve Coverage 17 Loan loss reserve, % of total loans Note: Trend reflects the migration from using national FDIC historical loss rates to the Company's own loss experience. 2.0% 1.5% 1.0% 0.5% 0.0% 12 /31 /20 10 12 /31 /20 11 12 /31 /20 12 12 /31 /20 13 12 /31 /20 14 12 /31 /20 15 12 /31 /20 16 9
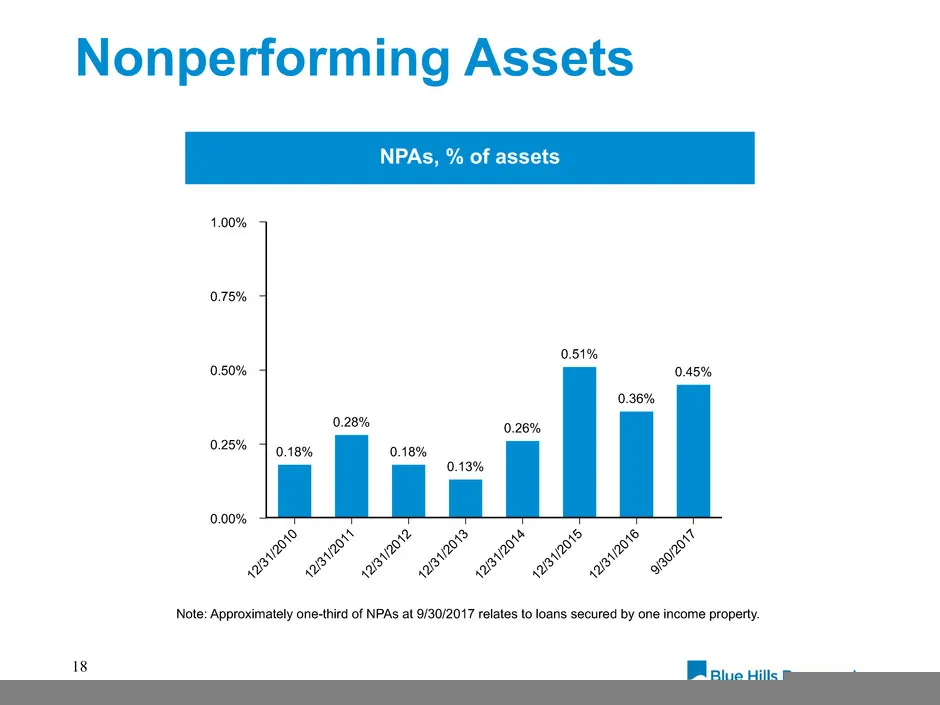
Slide 18: Nonperforming Assets
Nonperforming Assets 18 NPAs, % of assets 1.00% 0.75% 0.50% 0.25% 0.00% 12 /31 /20 10 12 /31 /20 11 12 /31 /20 12 12 /31 /20 13 12 /31 /20 14 12 /31 /20 15 12 /31 /20 16 9/3 0/2 01 7 0.18% 0.28% 0.18% 0.13% 0.26% 0.51% 0.36% 0.45% Note: Approximately one-third of NPAs at 9/30/2017 relates to loans s
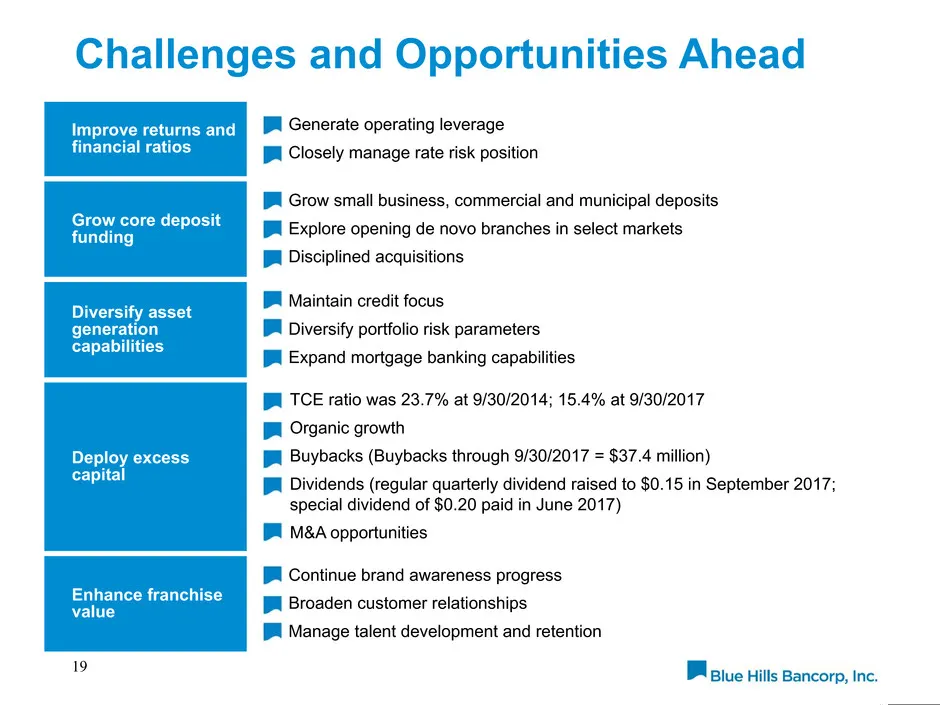
Slide 19: Challenges and Opportunities Ahead
Challenges and Opportunities Ahead 19 Improve returns and financial ratios Generate operating leverage Closely manage rate risk position Grow core deposit funding Grow small business, commercial and municipal deposits Explore opening de novo branches in select markets Disciplined acquisitions Divers
Slide 20: Appendix
Appendix 20
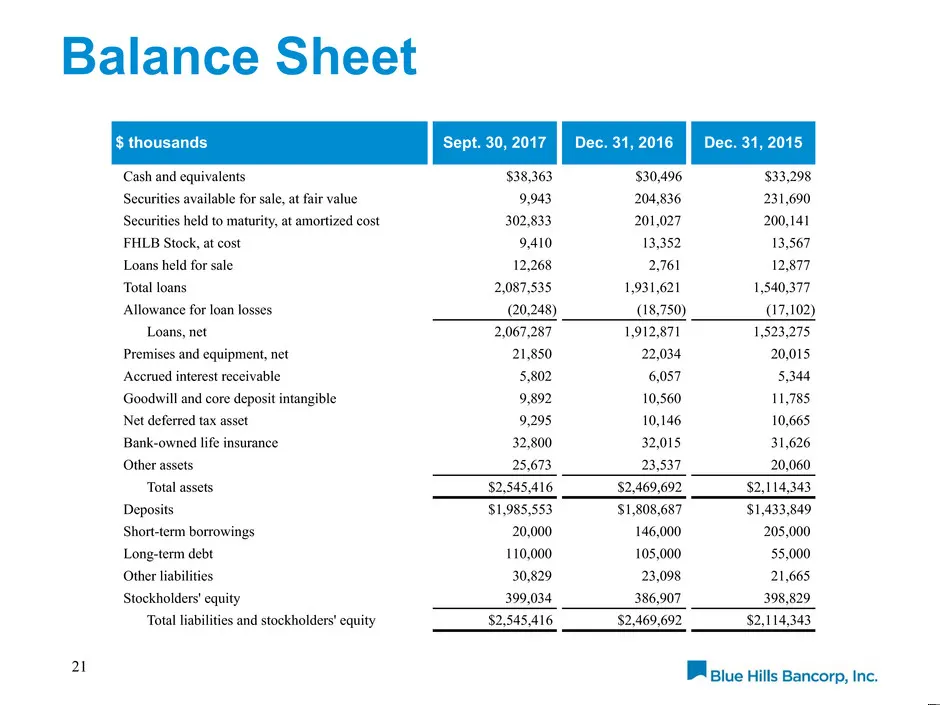
Slide 21: Balance Sheet
21 $ thousands Sept. 30, 2017 Dec. 31, 2016 Dec. 31, 2015 Cash and equivalents $38,363 $30,496 $33,298 Securities available for sale, at fair value 9,943 204,836 231,690 Securities held to maturity, at amortized cost 302,833 201,027 200,141 FHLB Stock, at cost 9,410 13,352 13,567 Loans held for sale
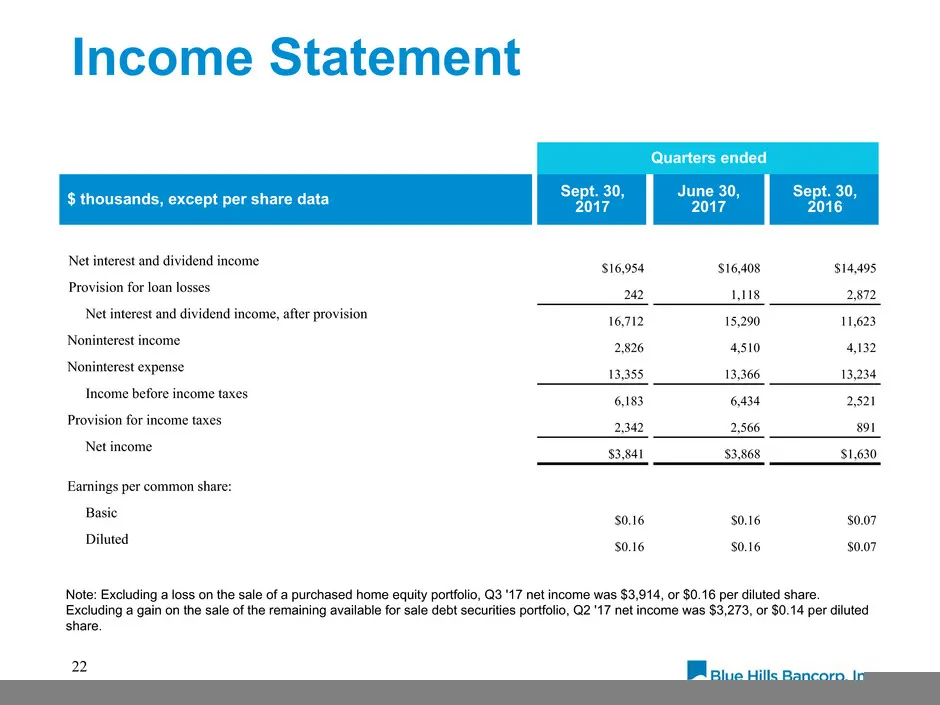
Slide 22: Income Statement
22 Quarters ended $ thousands, except per share data Sept. 30,2017 June 30, 2017 Sept. 30, 2016 Net interest and dividend income $16,954 $16,408 $14,495 Provision for loan losses 242 1,118 2,872 Net interest and dividend income, after provision 16,712 15,290 11,623 Noninterest income 2,826 4,510 4,1
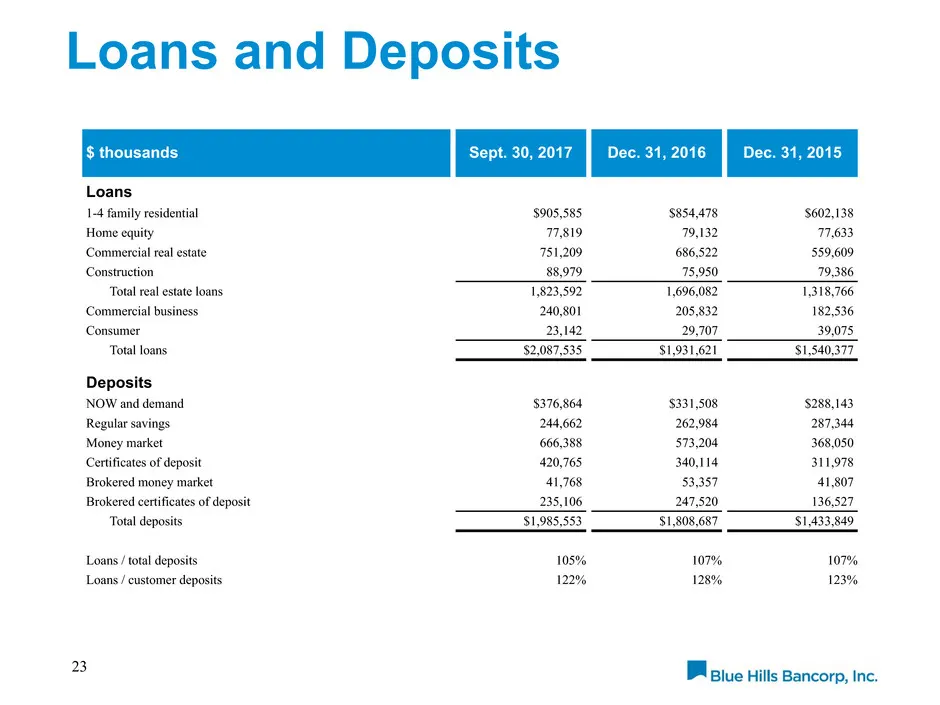
Slide 23: Loans and Deposits
23 Loans and Deposits $ thousands Sept. 30, 2017 Dec. 31, 2016 Dec. 31, 2015 Loans 1-4 family residential $905,585 $854,478 $602,138 Home equity 77,819 79,132 77,633 Commercial real estate 751,209 686,522 559,609 Construction 88,979 75,950 79,386 Total real estate loans 1,823,592 1,696,082 1,318,766
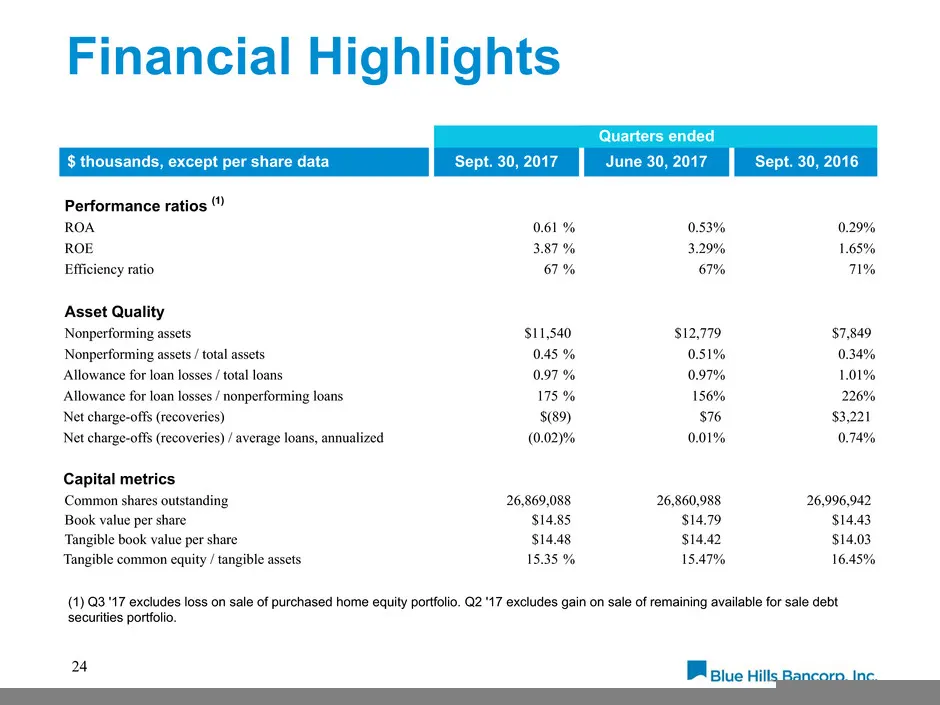
Slide 24: Financial Highlights
24 Financial Highlights Quarters ended $ thousands, except per share data Sept. 30, 2017 June 30, 2017 Sept. 30, 2016 Performance ratios (1) ROA 0.61 % 0.53% 0.29% ROE 3.87 % 3.29% 1.65% Efficiency ratio 67 % 67% 71% Asset Quality Nonperforming assets $11,540 $12,779 $7,849 Nonperforming assets / to
Source: SEC EDGAR · 8-K filed Dec 6, 2017
More decks from Blue Hills Bancorp Inc
 Merger or Acquisition (September 2018)16 slides · Sep 20, 2018
 Keefe Bruyette & Woods 2018 Community Bank Investor Conference28 slides · Jul 31, 2018
 Shareholder Meeting (May 2018)24 slides · May 16, 2018
 Piper Jaffray Financial Institutions Conference 201823 slides · May 11, 2018
 Piper Jaffray New England Bank Symposium 201724 slides · Sep 28, 2017
 Keefe, Bruyette & Woods 2017 Community Bank Investor Conference24 slides · Aug 1, 2017