Florida East Coast Industries Inc
Florida East Coast Industries — Investor Presentation (September 2005)
68 slides from Florida East Coast Industries's investor presentation, Sep 7, 2005
Slide 1: Ready To Go: Florida East Coast Industries Investor Presentation
Ready To Go Florida East Coast Industries Investor Presentation
Slide 2: Forward-looking statements
Florida East Coast Industries This presentation contains forward-looking statements within the meaning of Section 27A of the Securities Act of 1933, as amended, and Section 21E of the Securities Exchange Act of 1934, as amended. These forward-looking statements include the Company’s present expectat
Slide 3: A Brief History
Florida East Coast Industries A Brief History In 1883 Henry Flagler began assembling a railroad starting in Jacksonville and going down Florida’s east coast. Flagler bought or acquired, through government land grants, large tracts of land in close proximity to the railroad and over time, built a siz
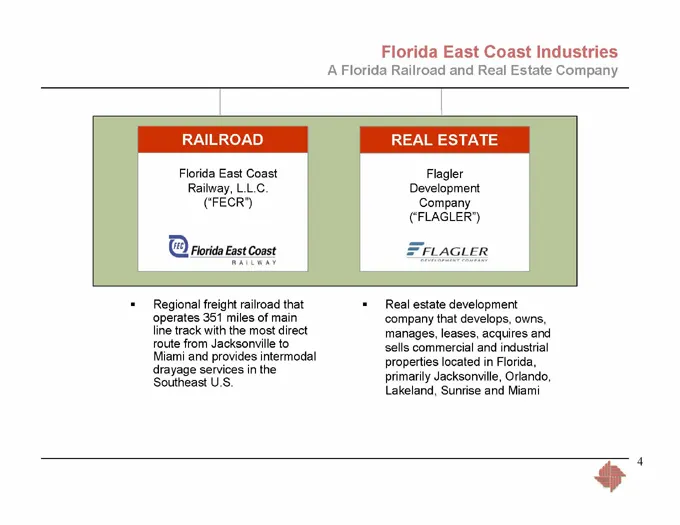
Slide 4: A Florida Railroad and Real Estate Company
Florida East Coast Industries A Florida Railroad and Real Estate Company RAILROAD Florida East Coast Railway, L.L.C. (“FECR”) REAL ESTATE Flagler Development Company (“FLAGLER”) Regional freight railroad that operates 351 miles of main line track with the most direct route from Jacksonville to Miami
Slide 5: Florida Statistics
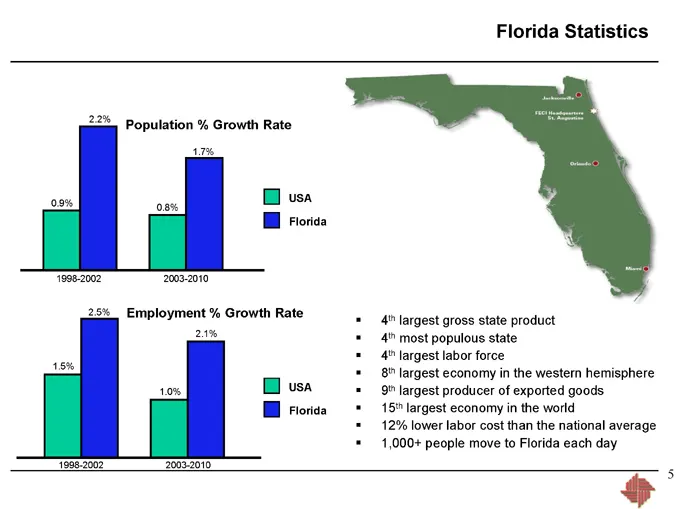
Florida Statistics Population % Growth Rate 0.9% 2.2% 0.8% 1.7% 1998-2002 2003-2010 USA Florida Employment % Growth Rate 1.5% 2.5% 1.0% 2.1% 1998-2002 2003-2010 USA Florida 4th largest gross state product 4th most populous state 4th largest labor force 8th largest economy in the western hemisphere 9
Slide 6: Florida East Coast Railway Overview
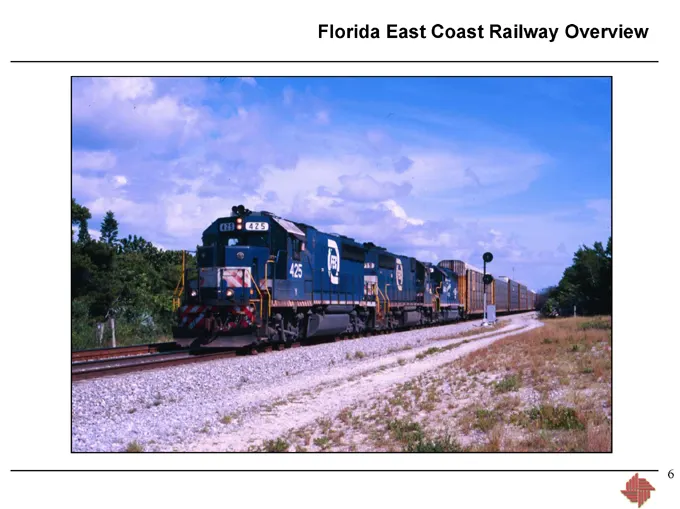
Florida East Coast Railway Overview
Slide 7: FECR's Competitive Advantages
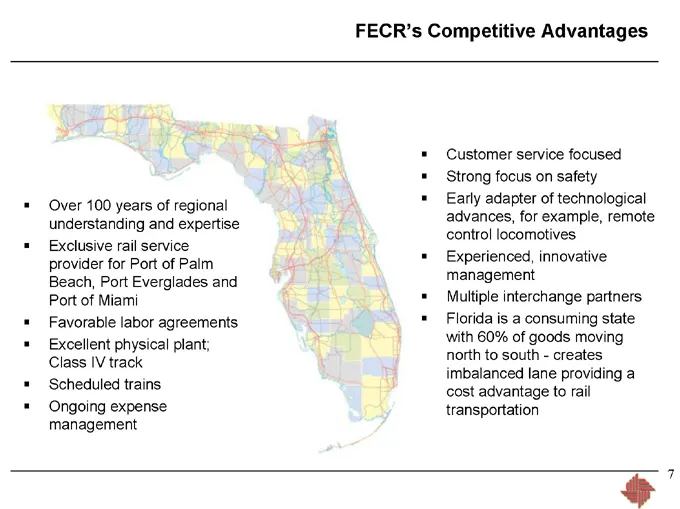
FECR’s Competitive Advantages Over 100 years of regional understanding and expertise Exclusive rail service provider for Port of Palm Beach, Port Everglades and Port of Miami Favorable labor agreements Excellent physical plant; Class IV track Scheduled trains Ongoing expense management Customer serv
Slide 8: FECR's Transportation Reach
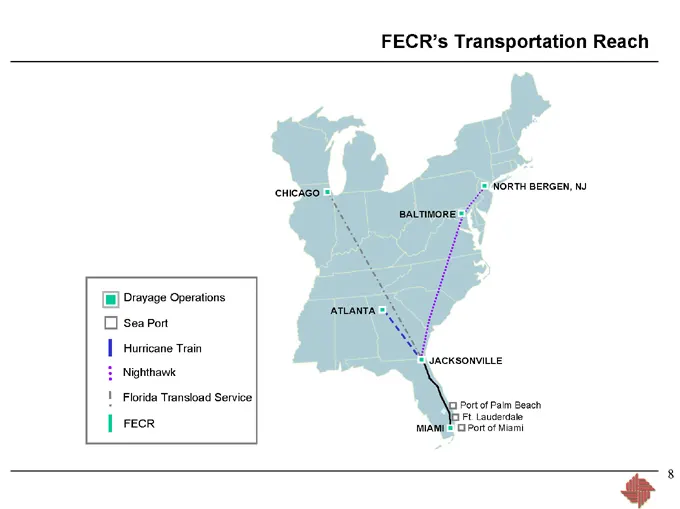
FECR’s Transportation Reach CHICAGO BALTIMORE NORTH BERGEN, NJ ATLANTA JACKSONVILLE Port of Palm Beach Ft. Lauderdale Port of Miami MIAMI Drayage Operations Sea Port Hurricane Train Nighthawk Florida Transload Service FECR
Slide 9: Segment Revenue
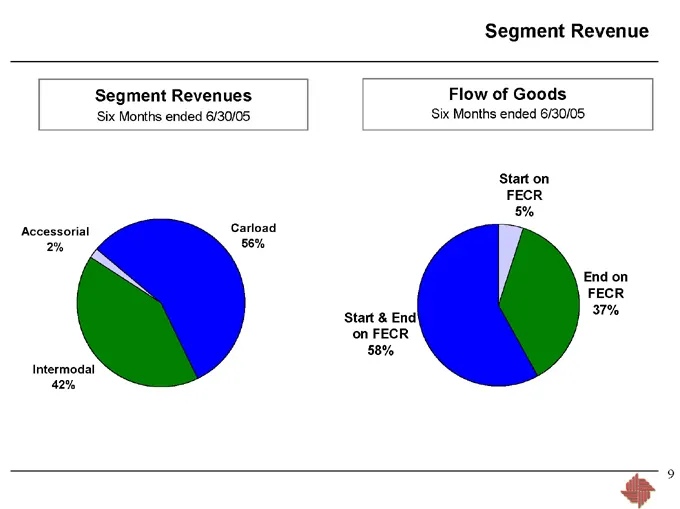
Segment Revenue Segment Revenues Six Months ended 6/30/05 Flow of Goods Six Months ended 6/30/05 Accessorial 2% Intermodal 42% Carload 56% Start & End on FECR 58% Start on FECR 5% End on FECR 37%
Slide 10: Major Commodity Detail
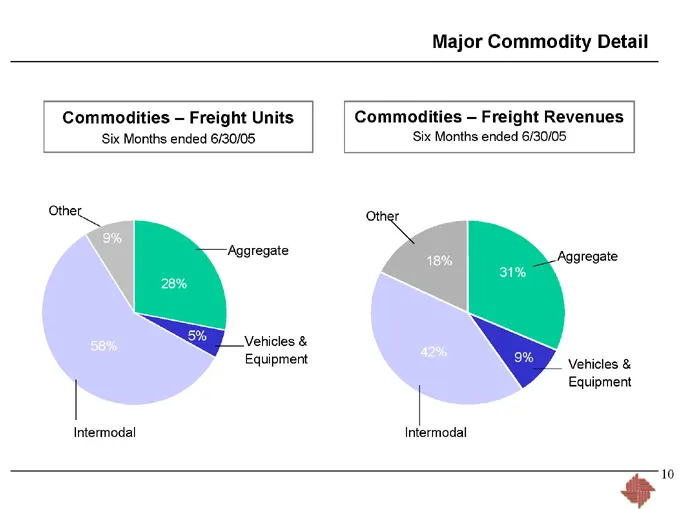
Major Commodity Detail Commodities – Freight Units Six Months ended 6/30/05 Commodities – Freight Revenues Six Months ended 6/30/05 Other 9% Aggregate 28% Vehicles & Equipment 5% Intermodal 58% Other 18% Aggregate 31% Vehicles & Equipment 9% Intermodal 42%
Slide 11: Valued Relationship
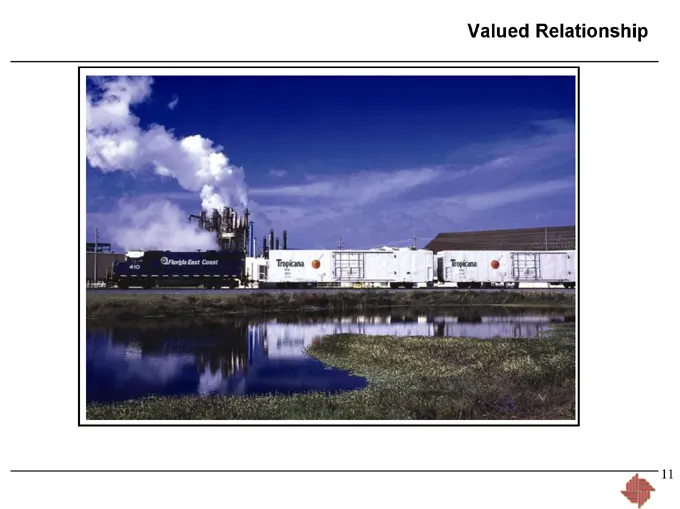
Valued Relationship ra
Slide 12: Carload Customers
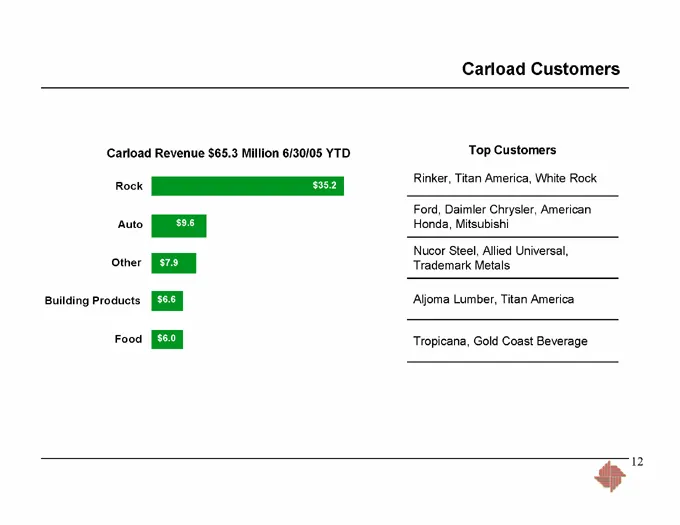
Carload Customers Carload Revenue $65.3 Million 6/30/05 YTD Rock $35.2 Auto $9.6 Other $7.9 Building Products $6.6 Food $6.0 Top Customers Rinker, Titan America, White Rock Ford, Daimler Chrysler, American Honda, Mitsubishi Nucor Steel, Allied Universal, Trademark Metals Aljoma Lumber, Titan America
Slide 13: Carload – Growth
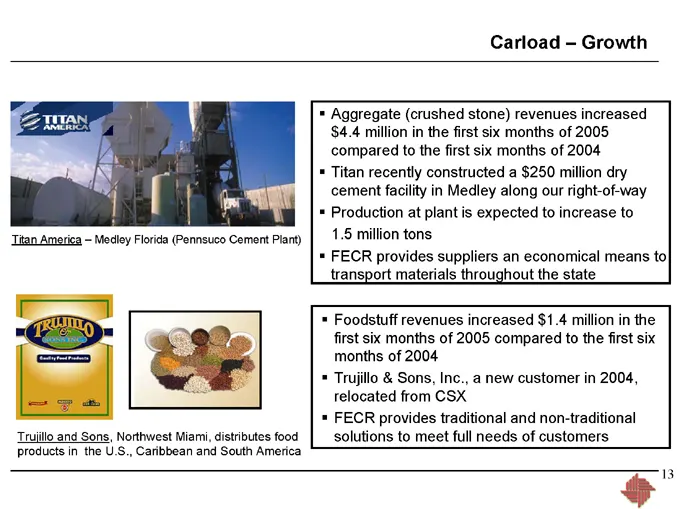
Carload – Growth Titan America – Medley Florida (Pennsuco Cement Plant) Aggregate (crushed stone) revenues increased $4.4 million in the first six months of 2005 compared to the first six months of 2004 Titan recently constructed a $250 million dry cement facility in Medley along our right-of-way Pr
Slide 14: Valued Relationship
Valued Relationship
Slide 15: Intermodal Customers
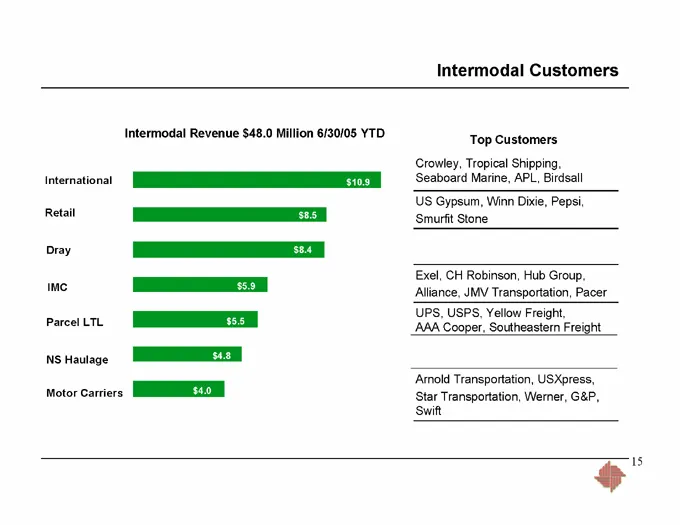
Intermodal Customers Intermodal Revenue $48.0 Million 6/30/05 YTD International $10.9 Retail $8.5 Dray $8.4 IMC $5.9 Parcel LTL $5.5 NS Haulage $4.8 Motor Carriers $4.0 Top Customers Crowley, Tropical Shipping, Seaboard Marine, APL, Birdsall US Gypsum, Winn Dixie, Pepsi, Smurfit Stone Exel, CH Robin
Slide 16: Intermodal—Growth
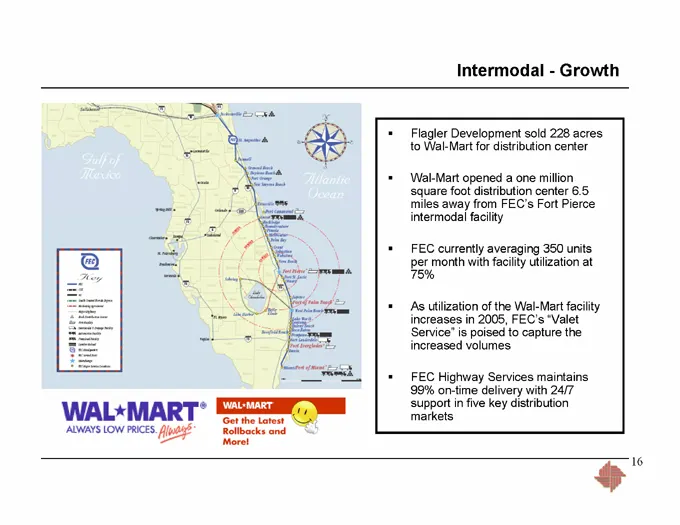
Intermodal—Growth Flagler Development sold 228 acres to Wal-Mart for distribution center Wal-Mart opened a one million square foot distribution center 6.5 miles away from FEC’s Fort Pierce intermodal facility FEC currently averaging 350 units per month with facility utilization only at 75% As utiliz
Slide 17: Second Quarter Financial Highlights
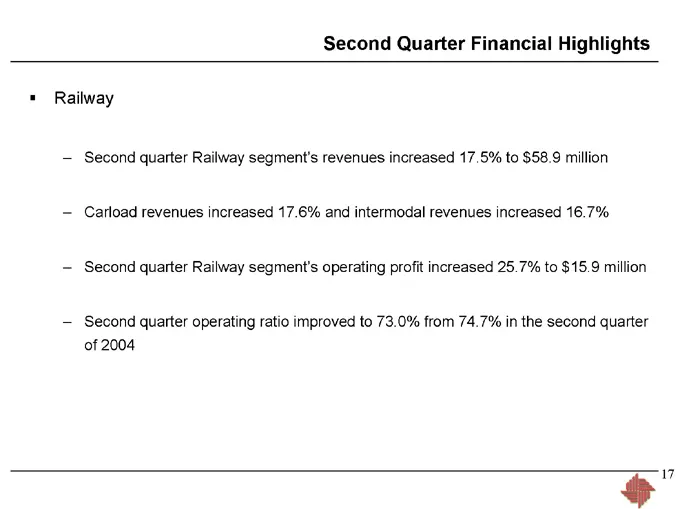
Second Quarter Financial Highlights Railway Second quarter Railway segment’s revenues increased 17.5% to $58.9 million Carload revenues increased 17.6% and intermodal revenues increased 16.7% Second quarter Railway segment’s operating profit increased 25.7% to $15.9 million Second quarter operating
Slide 18: Railway Segment Revenue and Operating Profit
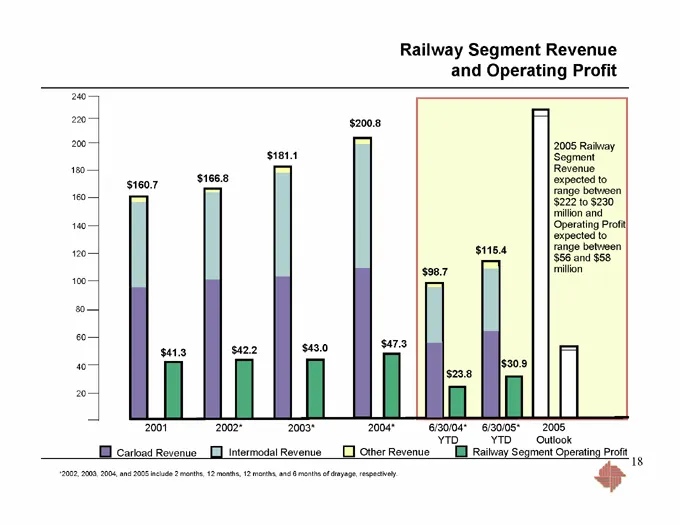
Railway Segment Revenue and Operating Profit 200 180 160 140 120 100 80 60 40 20 $160.7 $166.8 $181.1 $2 00.8 $98.7 $115.4 $43.0 $47.3 $41.3 $42.2 $30.9 $23.8 2005 Railway Segment Revenue expected to range between $222 to $230 million and Operating Profit expected to range between $56 and $58 millio
Slide 19: FECR's Operating Ratio is Second Best of Public Railroads
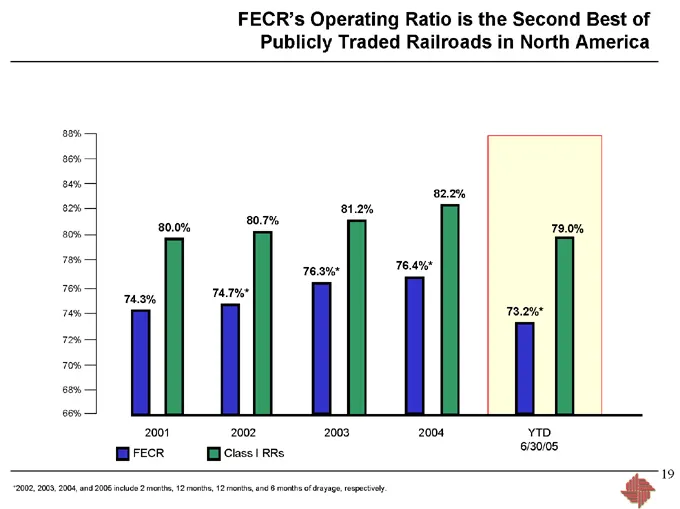
FECR’s Operating Ratio is the Second Best of Publicly Traded Railroads in North America 88% 86% 84% 82% 80% 78% 76% 74% 72% 70% 68% 66% 74.3% 80.0% 74.7%* 80.7% 76.3%* 81.2% 76.4%* 82.2% 73.2%* 79.0% YTD 6/30/05 FECR Class| RRS *2002, 2003, 2004, and 2005 include 2 months, 12 months, 12 months, and
Slide 20: Capital Expenditures
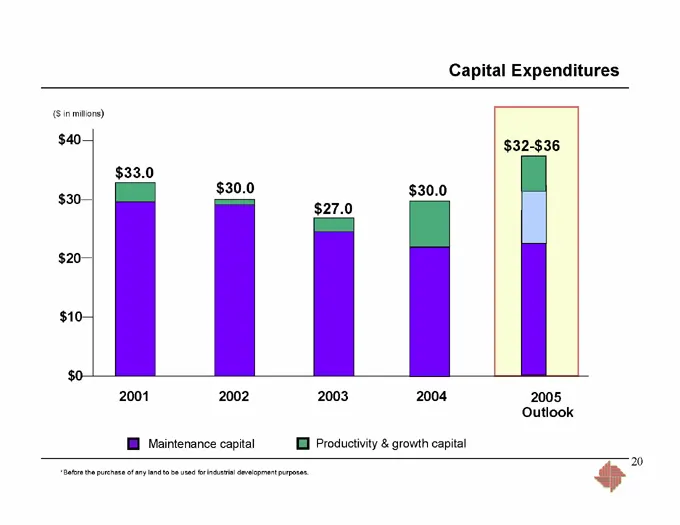
Capital Expenditures ($ in millions) $40 $30 $20 $10 $0 2001 2002 2003 2004 2005 Outlook $32-$36 $33.0 $30.0 $30.0 $27.0 Maintenance capital Productivity & growth capital *Before the purchase of any land to be used for industrial development purposes.
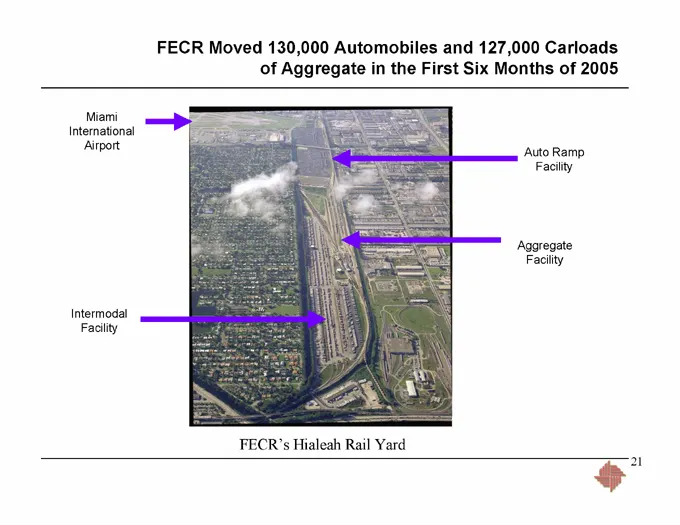
Slide 21: FECR Moved 130,000 Automobiles and 127,000 Carloads of Aggregate
FECR Moved 130,000 Automobiles and 127,000 Carloads of Aggregate in the First Six Months of 2005 Aggregate Facility Auto Ramp Facility Intermodal Facility N FECR’s Hialeah Rail Yard
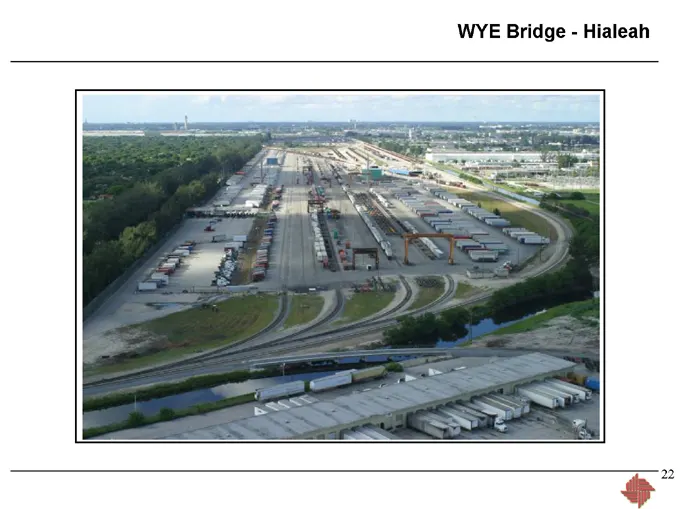
Slide 22: WYE Bridge—Hialeah
WYE Bridge—Hialeah
Slide 23: Summary—FECR
Summary—FECR Well-run scheduled railroad generating consistent cash flow Advantage is location, which cannot be duplicated today Focus to grow core carload and intermodal business Potential opportunities with connecting carriers Capital investments that enhance productivity and add capacity
Slide 24: Flagler Development Company Overview
Flagler Development Company Overview
Slide 25: Flagler Organization
Flagler Organization Development – Flagler can execute a full range of development including: Major infrastructure Suburban office & call center Warehouse, distribution & flex Leasing – Flagler performs leasing through in-house marketing teams and outside brokers throughout the state Management – Fl
Slide 26: Exceptional Assets in Florida's Strongest Markets
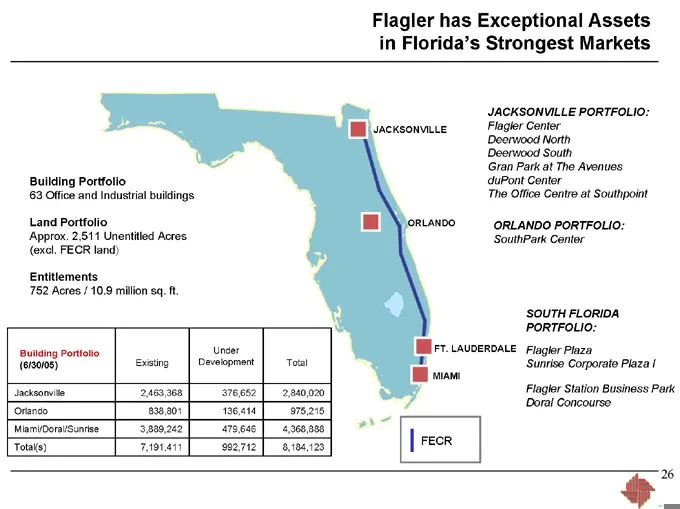
Flagler has Exceptional Assets in Florida’s Strongest Markets Building Portfolio 63 Office and Industrial buildings Land Portfolio Approx. 2,511 Unentitled Acres (excl. FECR land) Entitlements 752 Acres / 10.9 million sq. ft. Building Portfolio Under (6/30/05) Existing Development Total Jacksonville
Slide 27: Flagler Growth
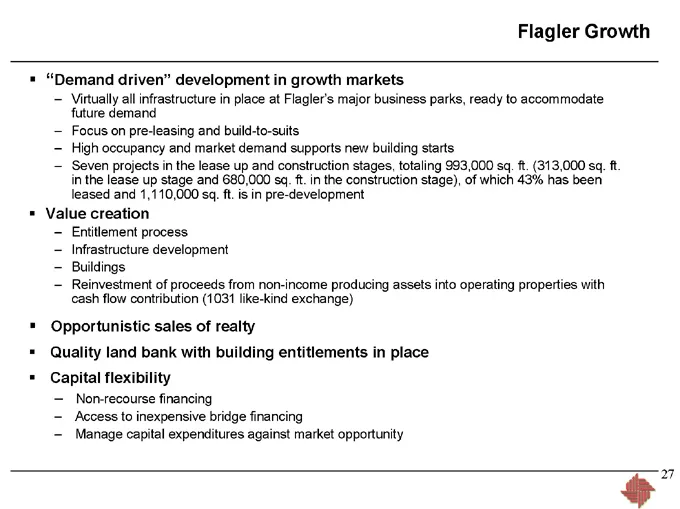
Flagler Growth “Demand driven” development in growth markets Virtually all infrastructure in place at Flagler’s major business parks, ready to accommodate future demand Focus on pre-leasing and build-to-suits High occupancy and market demand supports new building starts Seven projects in the lease u
Slide 28: Creating Value at Flagler Center in Jacksonville
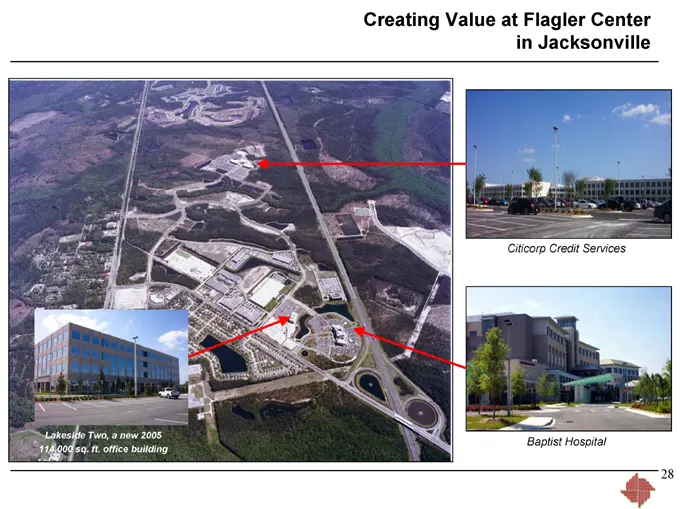
Creating Value at Flagler Center in Jacksonville Lakeside Two, a new 2005 114,000 sq. ft. office building Citicorp Credit Services Baptist Hospital
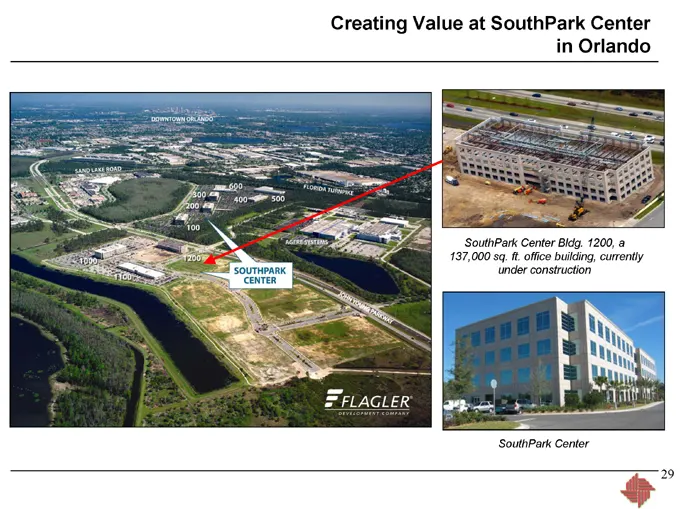
Slide 29: Creating Value at SouthPark Center in Orlando
Creating Value at SouthPark Center in Orlando DOWNTOWN ORLANDO SAND LAKE ROAD FLORIDA TURNPIKE AGERE SYSTEM JOHN YOUNG PARKWAY SOUTHPARK CENTRE SouthPark Center Bldg. 1200, a 137,000 sq. ft. office building, currently under construction SouthPark Center
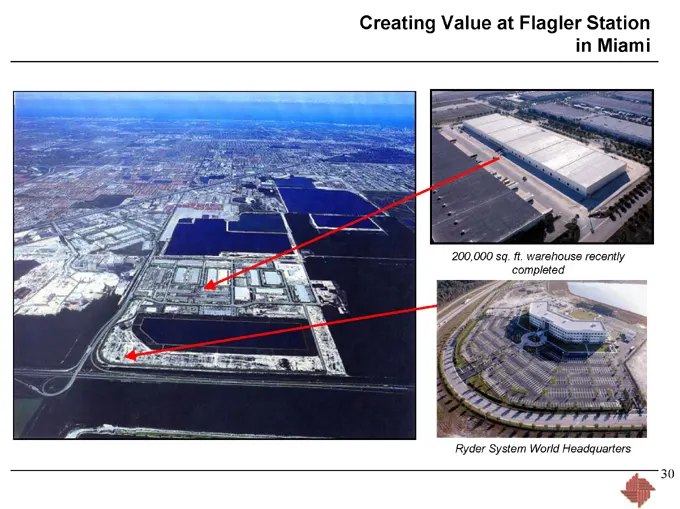
Slide 30: Creating Value at Flagler Station in Miami
Creating Value at Flagler Station in Miami 200,000 sq. ft. warehouse recently completed Ryder System World Headquarters
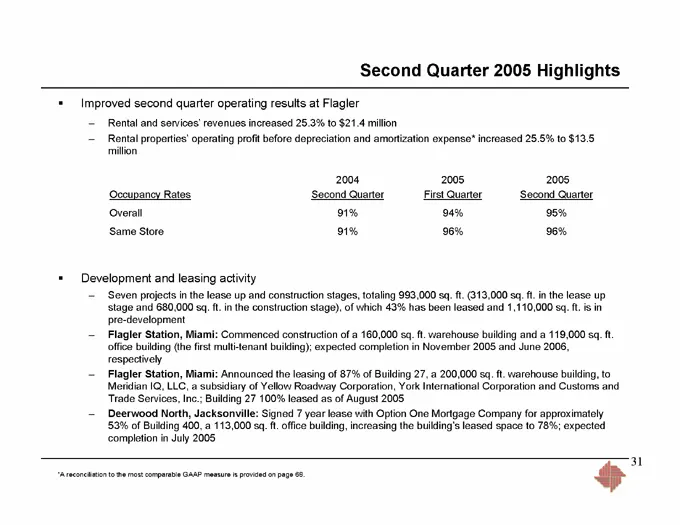
Slide 31: Second Quarter 2005 Highlights
Second Quarter 2005 Highlights Improved second quarter operating results at Flagler – Rental and services’ revenues increased 25.3% to $21.4 million – Rental properties’ operating profit before depreciation and amortization expense* increased 25.5% to $13.5 million Occupancy Rates Overall Same Store
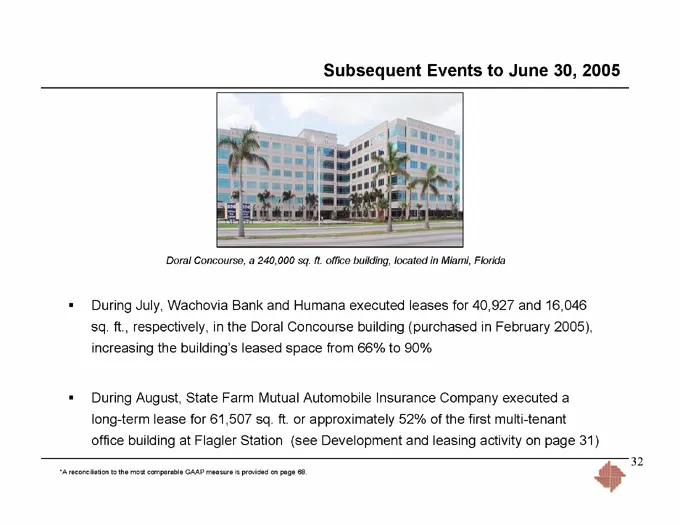
Slide 32: Subsequent Events to June 30, 2005
Subsequent Events to June 30, 2005 Doral Concourse, a 240,000 sq. ft. office building, located in Miami, Florida During July, Wachovia Bank and Humana executed leases for 40,927 and 16,046 sq. ft., respectively, in the Doral Concourse building (purchased in February 2005), increasing the building’s
Slide 33: Key Financial Metrics for Flagler
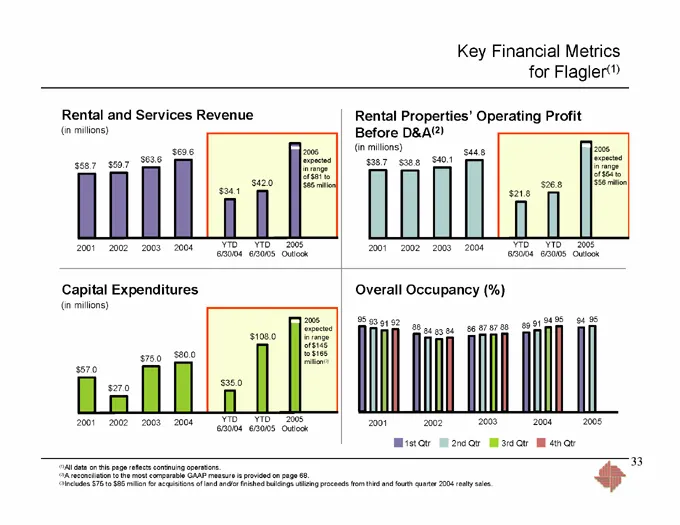
Key Financial Metrics for Flagler(1) Rental and Services Revenue (in millions) 2001 2002 2003 2004 YTD YTD 2005 6/30/04 6/30/05 Outlook $69.6 $63.6 $58.7 $59.7 $42.0 $34.1 2005 expected in range of $81 to $85 million Capital Expenditures (in millions) 2001 2002 2003 2004 YTD YTD 2005 6/30/04 6/30/05
Slide 34: 2005 Realty Purchases Utilizing Tax Deferred Sales Proceeds
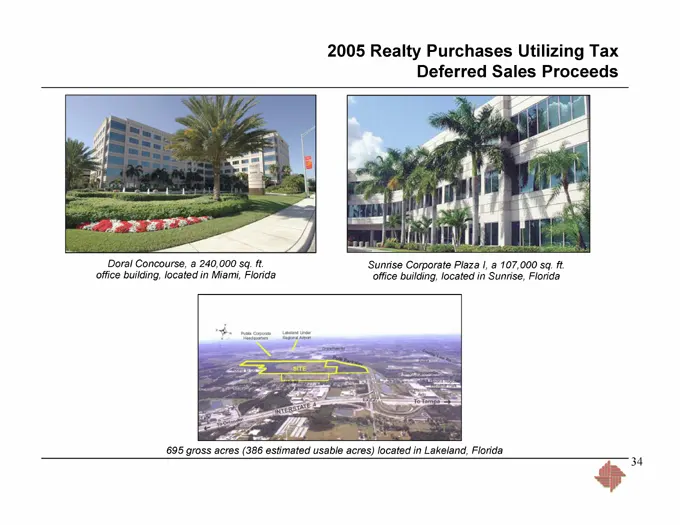
2005 Realty Purchases Utilizing Tax Deferred Sales Proceeds Doral Concourse, a 240,000 sq. ft. office building, located in Miami, Florida Sunrise Corporate Plaza I, a 107,000 sq. ft. office building, located in Sunrise, Florida 695 gross acres (386 estimated usable acres) located in Lakeland, Florid
Slide 35: Flagler's 2005 Capital Expenditure $145 to $165M
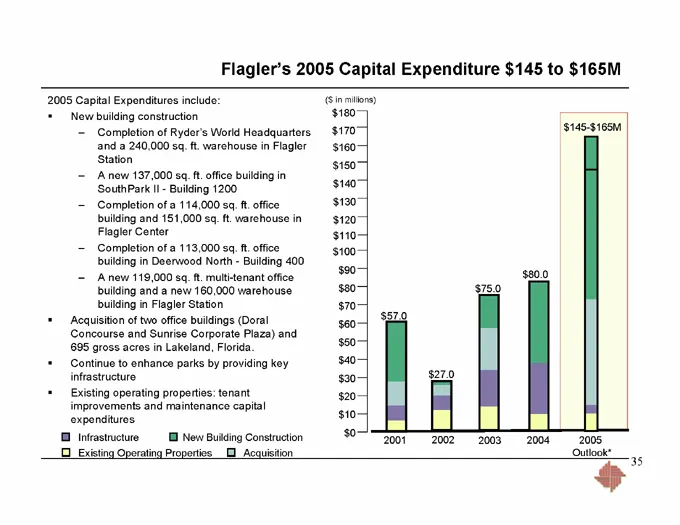
Flagler’s 2005 Capital Expenditure $145 to $165M 2005 Capital Expenditures include: New building construction – Completion of Ryder’s World Headquarters and a 240,000 sq. ft. warehouse in Flagler Station – A new 137,000 sq. ft. office building in SouthPark II - Building 1200 – Completion of a 114,00
Slide 36: Flagler has a Diversified Tenant Base
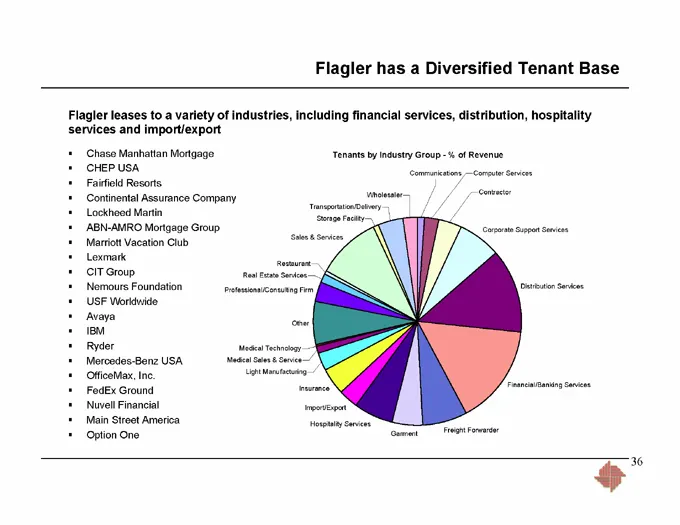
Flagler has a Diversified Tenant Base Flagler leases to a variety of industries, including financial services, distribution, hospitality services and import/export Chase Manhattan Mortgage CHEP USA Fairfield Resorts Continental Assurance Company Lockheed Martin ABN-AMRO Mortgage Group Marriott Vacat
Slide 37: Other FECI Activities
Other FECI Activities >’
Slide 38: FECR Legal Entity EBITDA
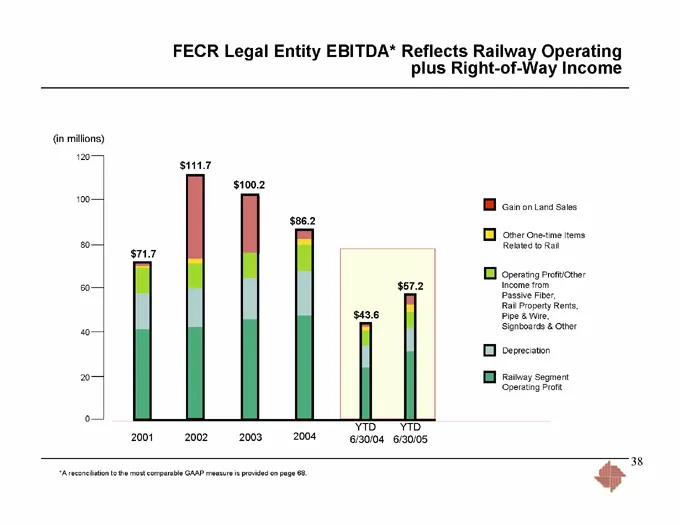
FECR Legal Entity EBITDA* Reflects Railway Operating plus Right-of-Way Income (in millions) 120 100 80 60 40 20 0 YTD YTD 2001 2002 2003 2004 6/30/04 6/30/05 $111.7 $100.2 $86.2 $71.7 $57.2 $43.6 Gain on Land Sales Other One-time Items Related to Rail Operating Profit/Other Income from Passive Fiber
Slide 39: Rail Corridor Opportunity
Rail Corridor Opportunity The FECR corridor has the long-term potential to provide passenger train service in South Florida – In October 2002, Tri-Rail commissioned consultants to provide a report outlining a process to acquire the FECR corridor (draft completed in 2003) – The South Florida Regional
Slide 40: Realty and Land Sales Activity
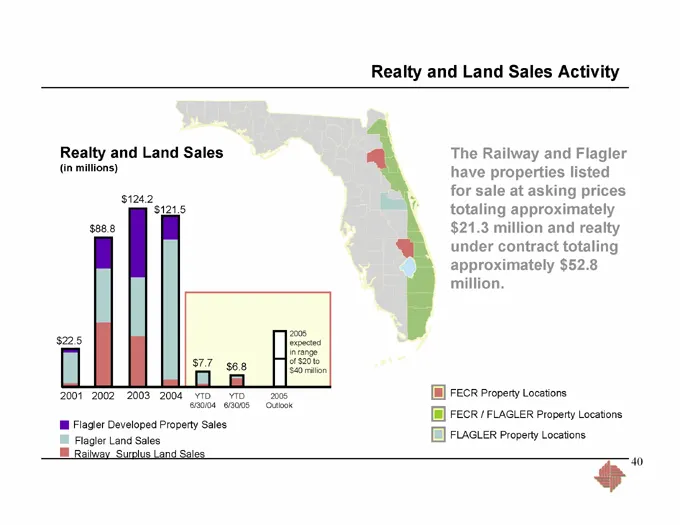
Realty and Land Sales Activity Realty and Land Sales (in millions) 2001 2002 2003 2004 YTD YTD 2005 6/30/04 6/30/05 Outlook $124.2 $121.5 $88.8 $22.5 $7.7 $6.8 2005 expected in range of $20 to $40 million The Railway and Flagler have properties listed for sale at asking prices totaling approximately
Slide 41: Key Investment Points
Key Investment Points Strong competitive advantages in core transportation and real estate businesses Hold diverse assets that cannot be duplicated today Regional benefits – Florida’s population is growing at twice the national average – Established understanding of flow of goods, infrastructure and
Slide 42: Flagler Properties: Jacksonville Portfolio
Flagler Properties Jacksonville Portfolio
Slide 43: Jacksonville Portfolio
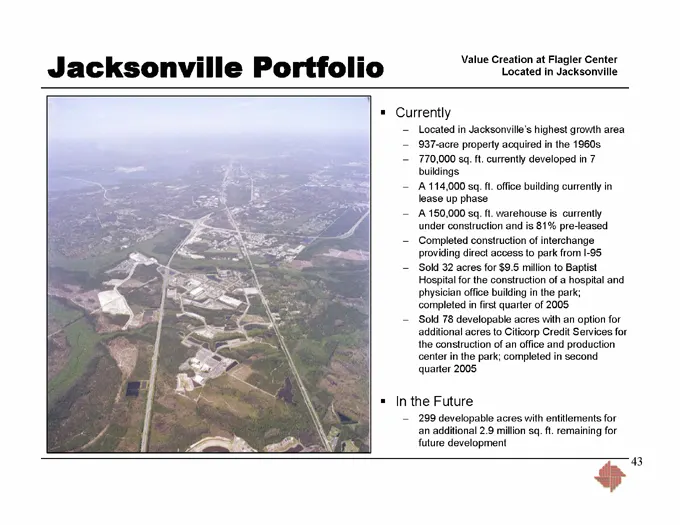
Jacksonville Portfolio Value Creation at Flagler Center Located in Jacksonville Currently – Located in Jacksonville’s highest growth area – 937-acre property acquired in the 1960s – 770,000 sq. ft. currently developed in 7 buildings – A 114,000 sq. ft. office building currently in lease up phase – A
Slide 44: Creating Value at Flagler Center in Jacksonville
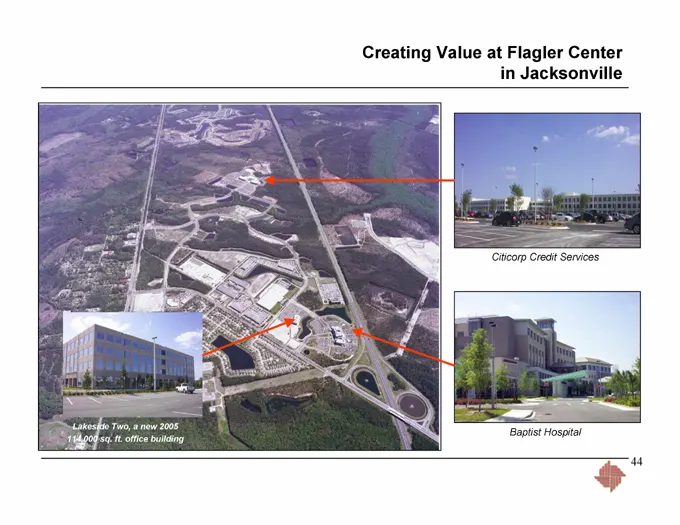
Creating Value at Flagler Center in Jacksonville Citicorp Credit Services Baptist Hospital Lakeside Two, a new 2005 114,000 sq. ft. office building
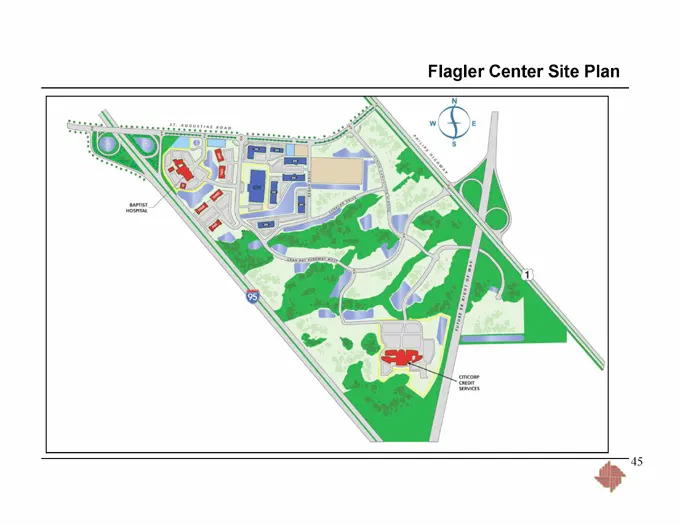
Slide 45: Flagler Center Site Plan
Flagler Center Site Plan
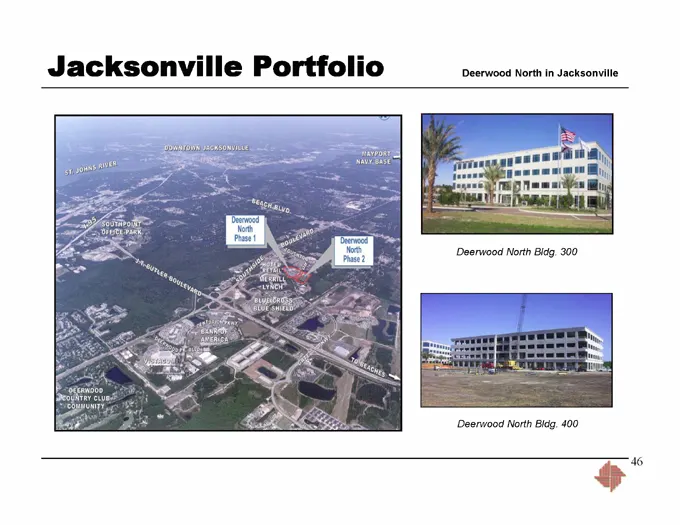
Slide 46: Deerwood North in Jacksonville
Jacksonville Portfolio Deerwood North in Jacksonville Deerwood North Bldg. 300 Deerwood North Bldg. 400
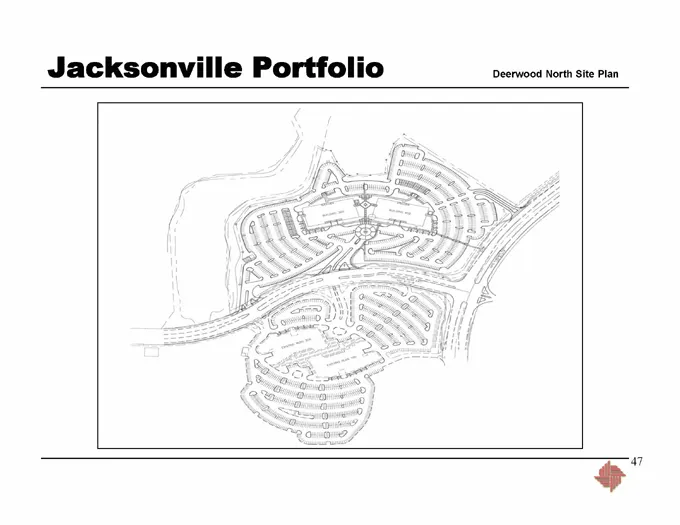
Slide 47: Deerwood North Site Plan
Jacksonville Portfolio Deerwood North Site Plan
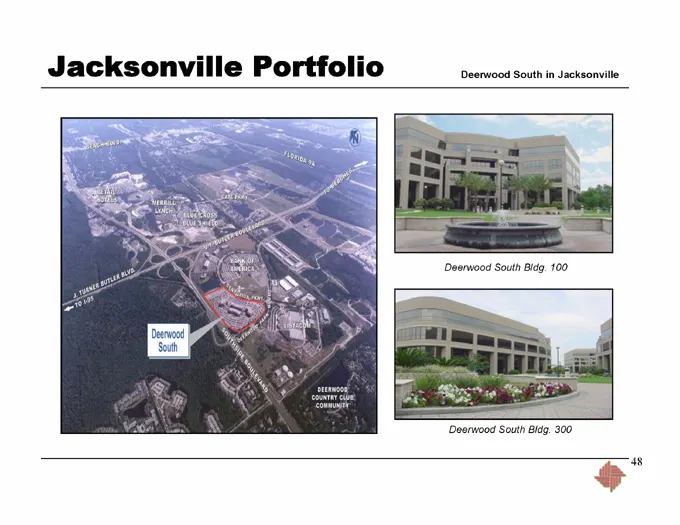
Slide 48: Deerwood South in Jacksonville
Jacksonville Portfolio Deerwood South in Jacksonville Deerwood South Bldg. 100 Deerwood South Bldg. 300
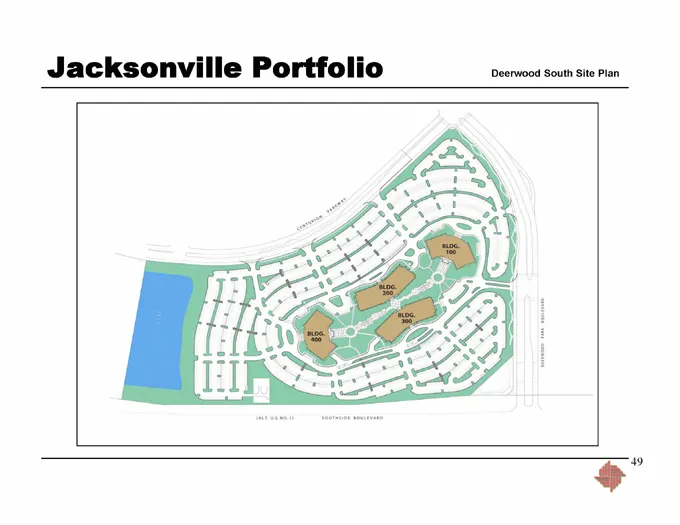
Slide 49: Deerwood South Site Plan
Jacksonville Portfolio Deerwood South Site Plan
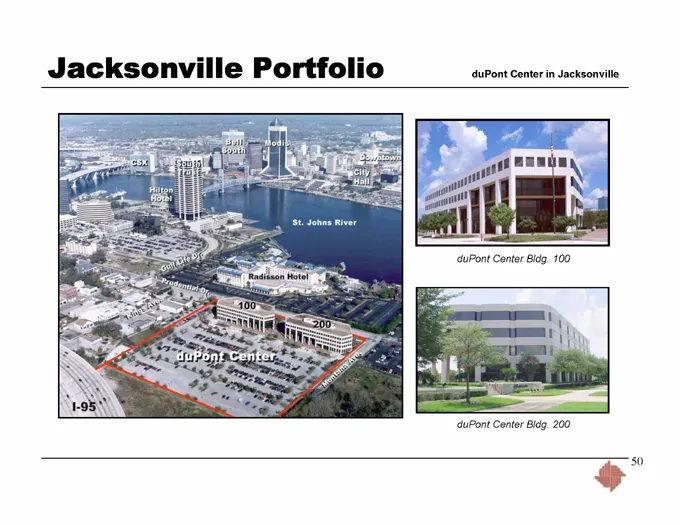
Slide 50: duPont Center in Jacksonville
Jacksonville Portfolio duPont Center in Jacksonville duPont Center Bldg. 100 duPont Center Bldg. 200
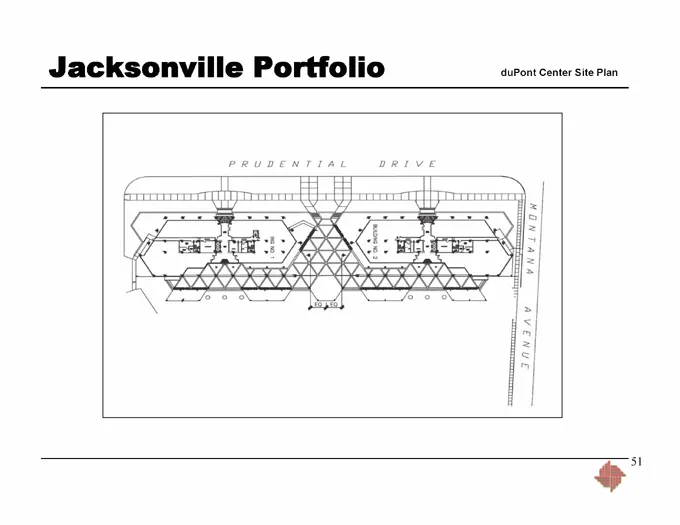
Slide 51: duPont Center Site Plan
Jacksonville Portfolio duPont Center Site Plan
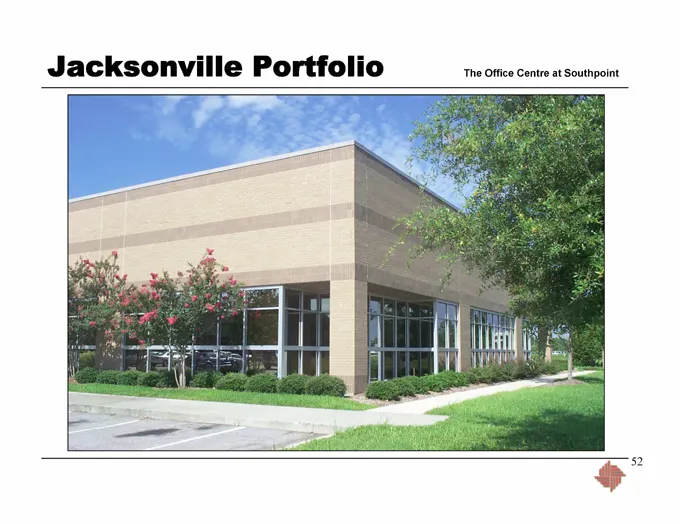
Slide 52: The Office Centre at Southpoint
Jacksonville Portfolio The Office Centre at Southpoint
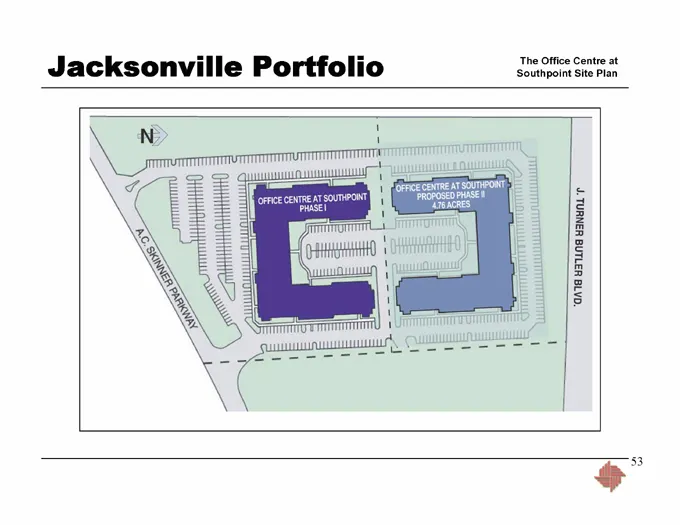
Slide 53: The Office Centre at Southpoint Site Plan
Jacksonville Portfolio The Office Centre at Southpoint Site Plan
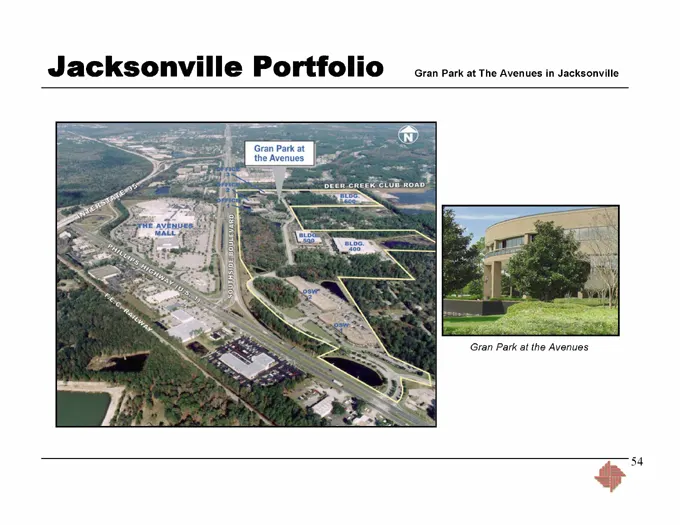
Slide 54: Gran Park at The Avenues in Jacksonville
Jacksonville Portfolio Gran Park at The Avenues in Jacksonville Gran Park at the Avenues
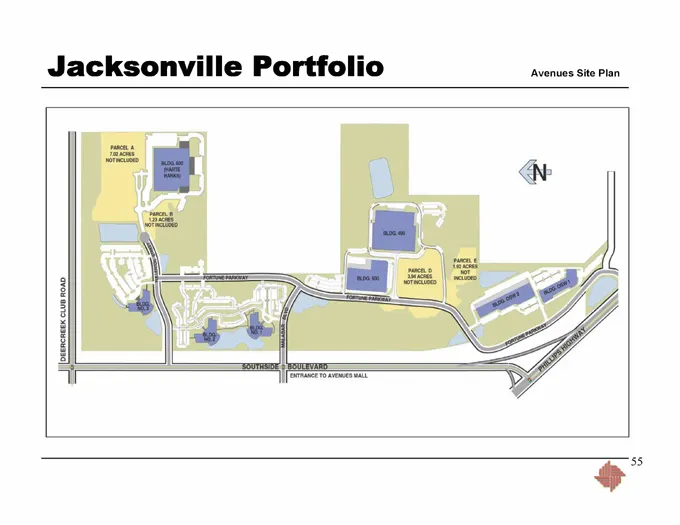
Slide 55: Avenues Site Plan
Jacksonville Portfolio Avenues Site Plan
Slide 56: Flagler Properties: Orlando Portfolio
Flagler Properties Orlando Portfolio
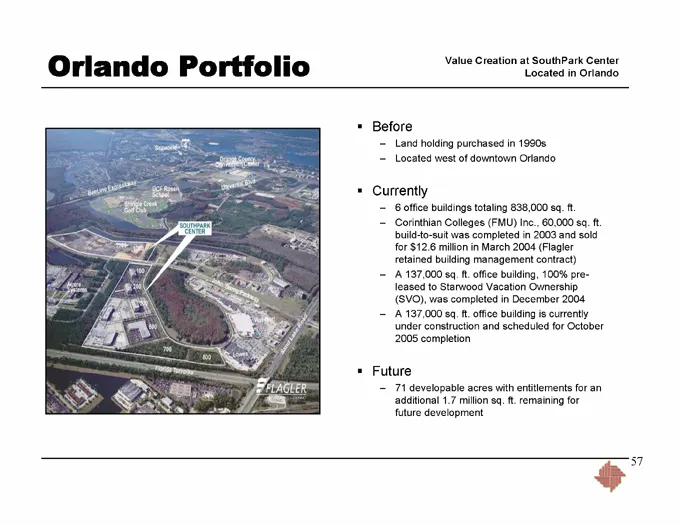
Slide 57: Orlando Portfolio: Value Creation at SouthPark Center
Orlando Portfolio Value Creation at SouthPark Center Located in Orlando Before – Land holding purchased in 1990s – Located west of downtown Orlando Currently – 6 office buildings totaling 838,000 sq. ft. – Corinthian Colleges (FMU) Inc., 60,000 sq. ft. build-to-suit was completed in 2003 and sold fo
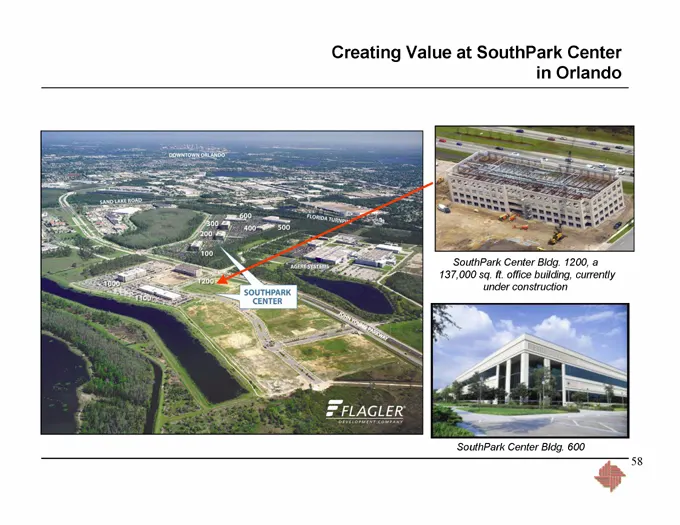
Slide 58: Creating Value at SouthPark Center in Orlando
Creating Value at SouthPark Center in Orlando SouthPark Center Bldg. 1200, a 137,000 sq. ft. office building, currently under construction SouthPark Center Bldg. 600
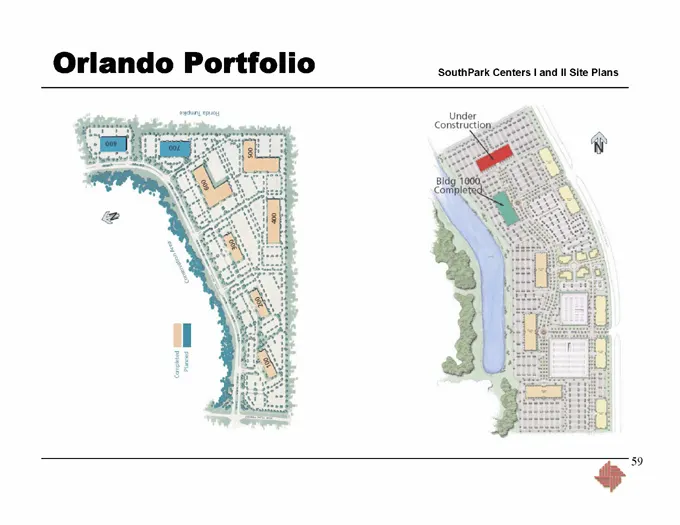
Slide 59: SouthPark Centers I and II Site Plans
Orlando Portfolio SouthPark Centers I and II Site Plans
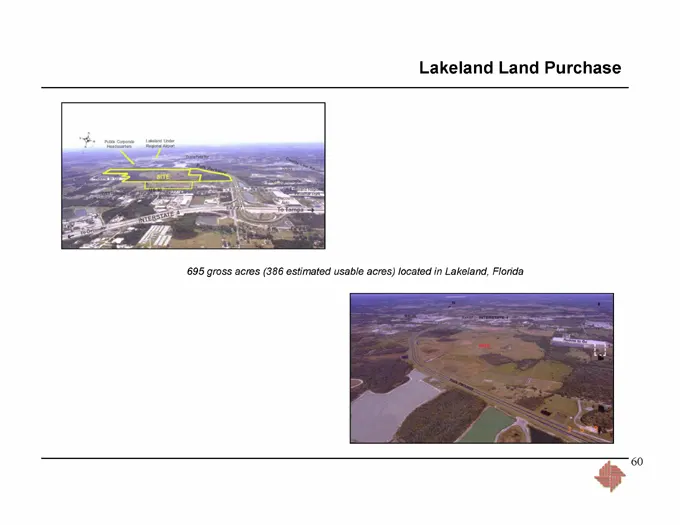
Slide 60: Lakeland Land
Lakeland Land Purchase 695 gross acres (386 estimated usable acres) located in Lakeland, Florida
Slide 61: Flagler Properties: South Florida Portfolio
Flagler Properties South Florida Portfolio
Slide 62: South Florida Portfolio: Creating Value at Flagler Station
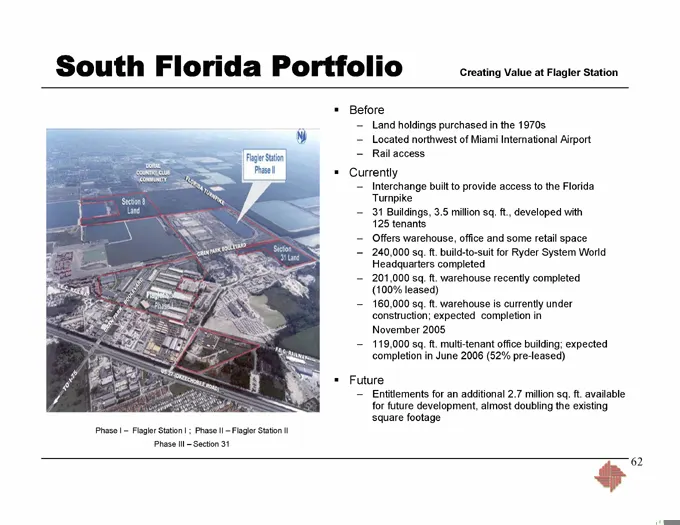
South Florida Portfolio Creating Value at Flagler Station Before – Land holdings purchased in the 1970s – Located northwest of Miami International Airport – Rail access Currently – Interchange built to provide access to the Florida Turnpike – 31 Buildings, 3.5 million sq. ft., developed with 125 ten
Slide 63: Creating Value at Flagler Station in Miami
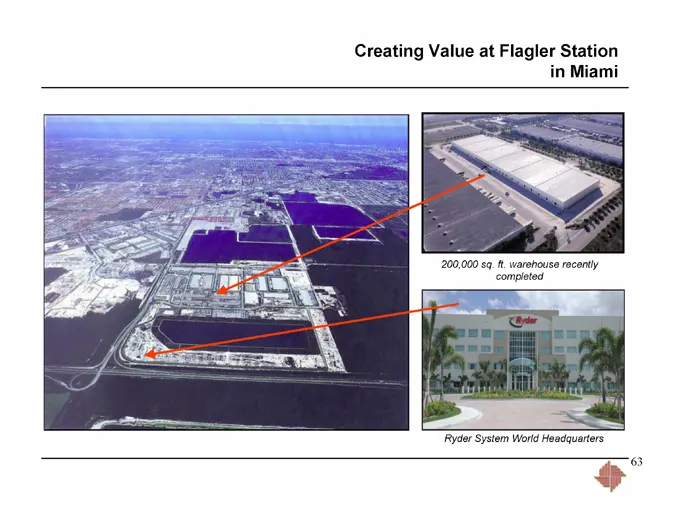
Creating Value at Flagler Station in Miami 200,000 sq. ft. warehouse recently completed Ryder System World Headquarters
Slide 64: Flagler Station Site Plan
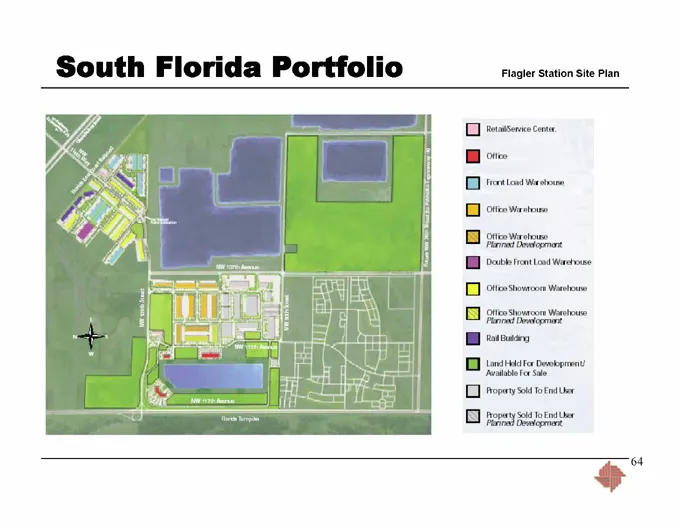
South Florida Portfolio Flagler Station Site Plan
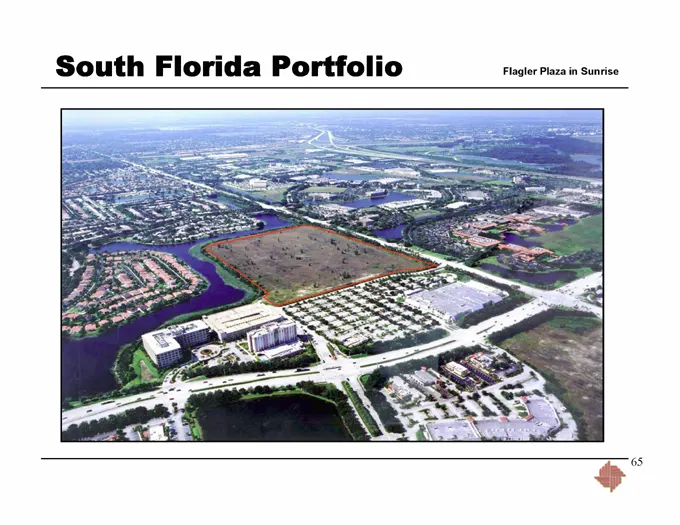
Slide 65: Flagler Plaza in Sunrise
South Florida Portfolio Flagler Plaza in Sunrise
Slide 66: Doral Concourse and Sunrise Corporate Plaza I
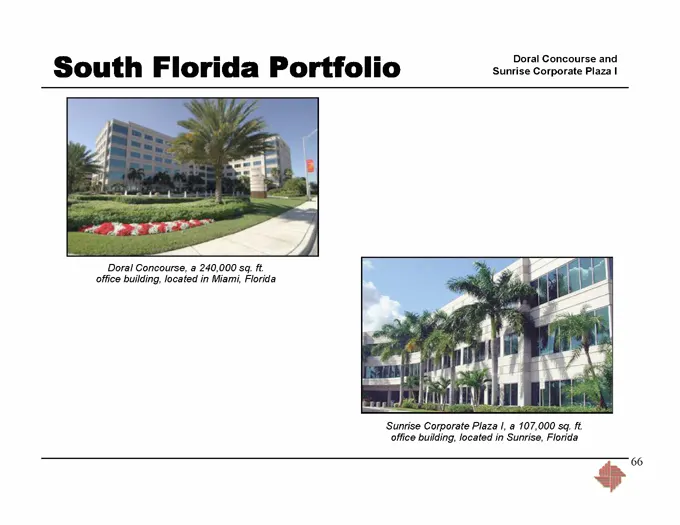
South Florida Portfolio Doral Concourse and Sunrise Corporate Plaza I Doral Concourse, a 240,000 sq. ft. office building, located in Miami, Florida Sunrise Corporate Plaza I, a 107,000 sq. ft. office building, located in Sunrise, Florida
Slide 67: Miami CDB
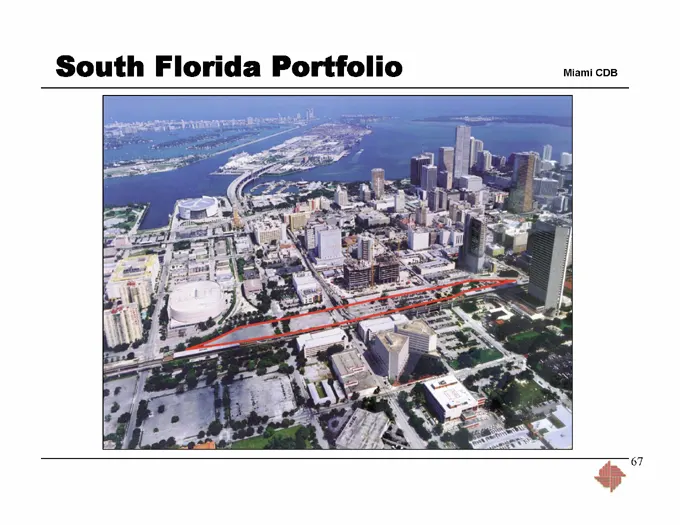
South Florida Portfolio Miami CDB
Slide 68: Reconciliation of Non-GAAP to GAAP Measures
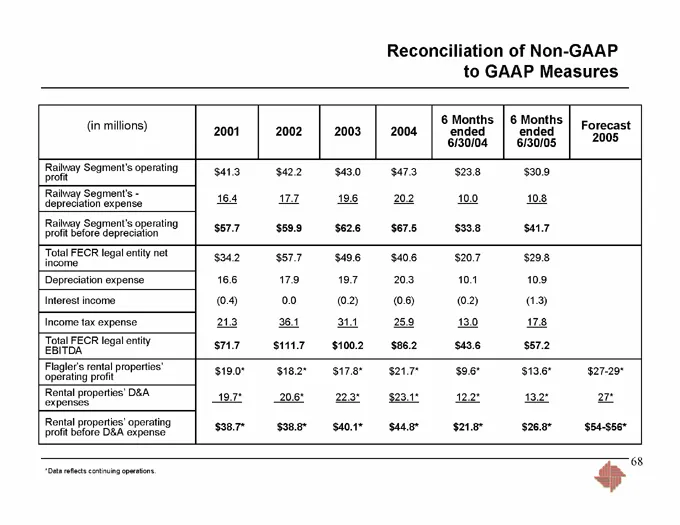
Reconciliation of Non-GAAP to GAAP Measures 6 Months 6 Months (in millions) Forecast 2001 2002 2003 2004 ended ended 6/30/04 6/30/05 2005 Railway Segment’s operating profit Railway Segment’s -depreciation expense Railway Segment’s operating profit before depreciation Total FECR legal entity net inco
Source: SEC EDGAR · 8-K filed Sep 7, 2005
More decks from Florida East Coast Industries Inc
 Merger or Acquisition (May 2007)15 slides · May 31, 2007
 Q1 2007 Earnings Presentation26 slides · May 9, 2007
 Q4 2006 Earnings Presentation39 slides · Feb 15, 2007
 Q3 2006 Earnings Presentation36 slides · Nov 2, 2006
 Ryan Beck Investor Event (September 2006)80 slides · Sep 13, 2006
 Morgan Keegan 2006 Equity Conference30 slides · Sep 7, 2006