Florida East Coast Industries Inc
Florida East Coast Industries — Morgan Keegan 2006 Equity Conference
30 slides from Florida East Coast Industries's conference presentation, Sep 7, 2006
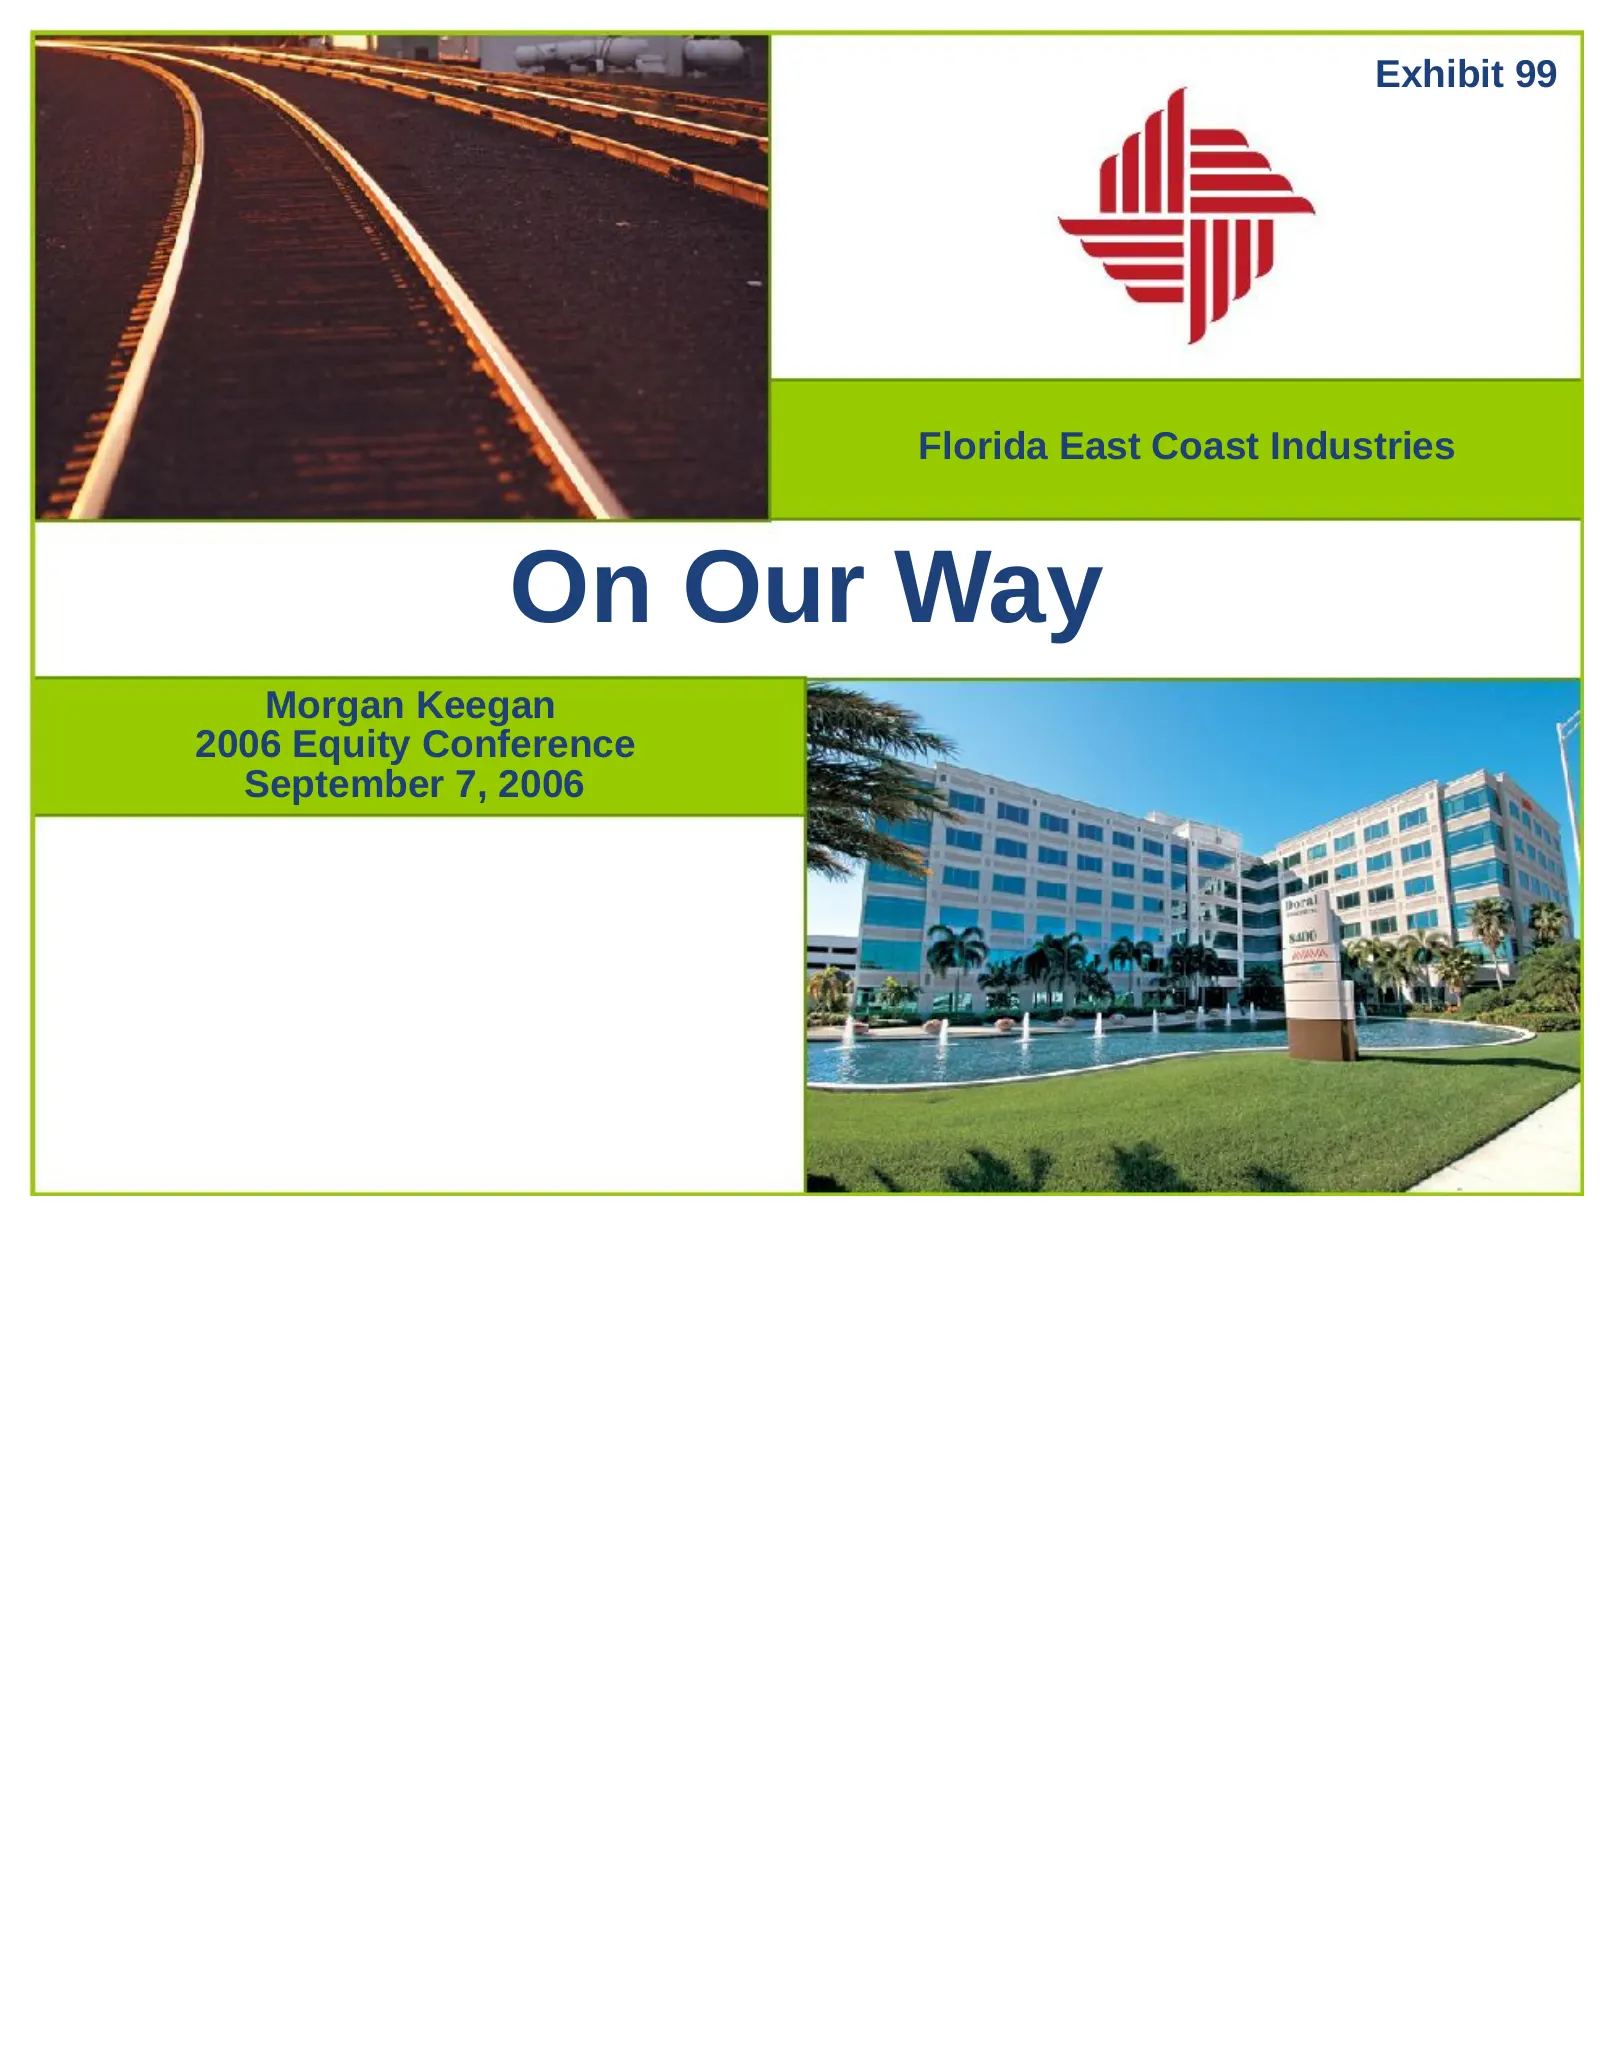
Slide 1: On Our Way
Exhibit 99 Florida East Coast Industries On Our Way Morgan Keegan 2006 Equity Conference September 7, 2006
Slide 2: Forward-Looking Statements
Forward-Looking Statements This presentation contains forward-looking statements within the meaning of Section 27A of the Securities Act of 1933, as amended, and Section 21E of the Securities Exchange Act of 1934, as amended. These forward-looking statements include the Company's present expectation
Slide 3: Florida East Coast Industries Overview
Florida East Coast Industries Overview • Operates through two wholly-owned subsidiaries • Florida East Coast Railway (FECR): regional freight railroad that operates 351 miles of main line track with the most direct route from Jacksonville to Miami • Flagler Development Group (Flagler): real estate d
Slide 4: Fundamental Business Drivers
Florida East Coast Industries Fundamental Business Drivers • Outstanding results • Track directly with Florida economy • Florida’s economic growth is among the most robust in the U.S. • Advantage is strategic location, which cannot be replicated today • Premier real estate and transportation company
Slide 5: Florida Market Opportunity Growing at Twice the National Average
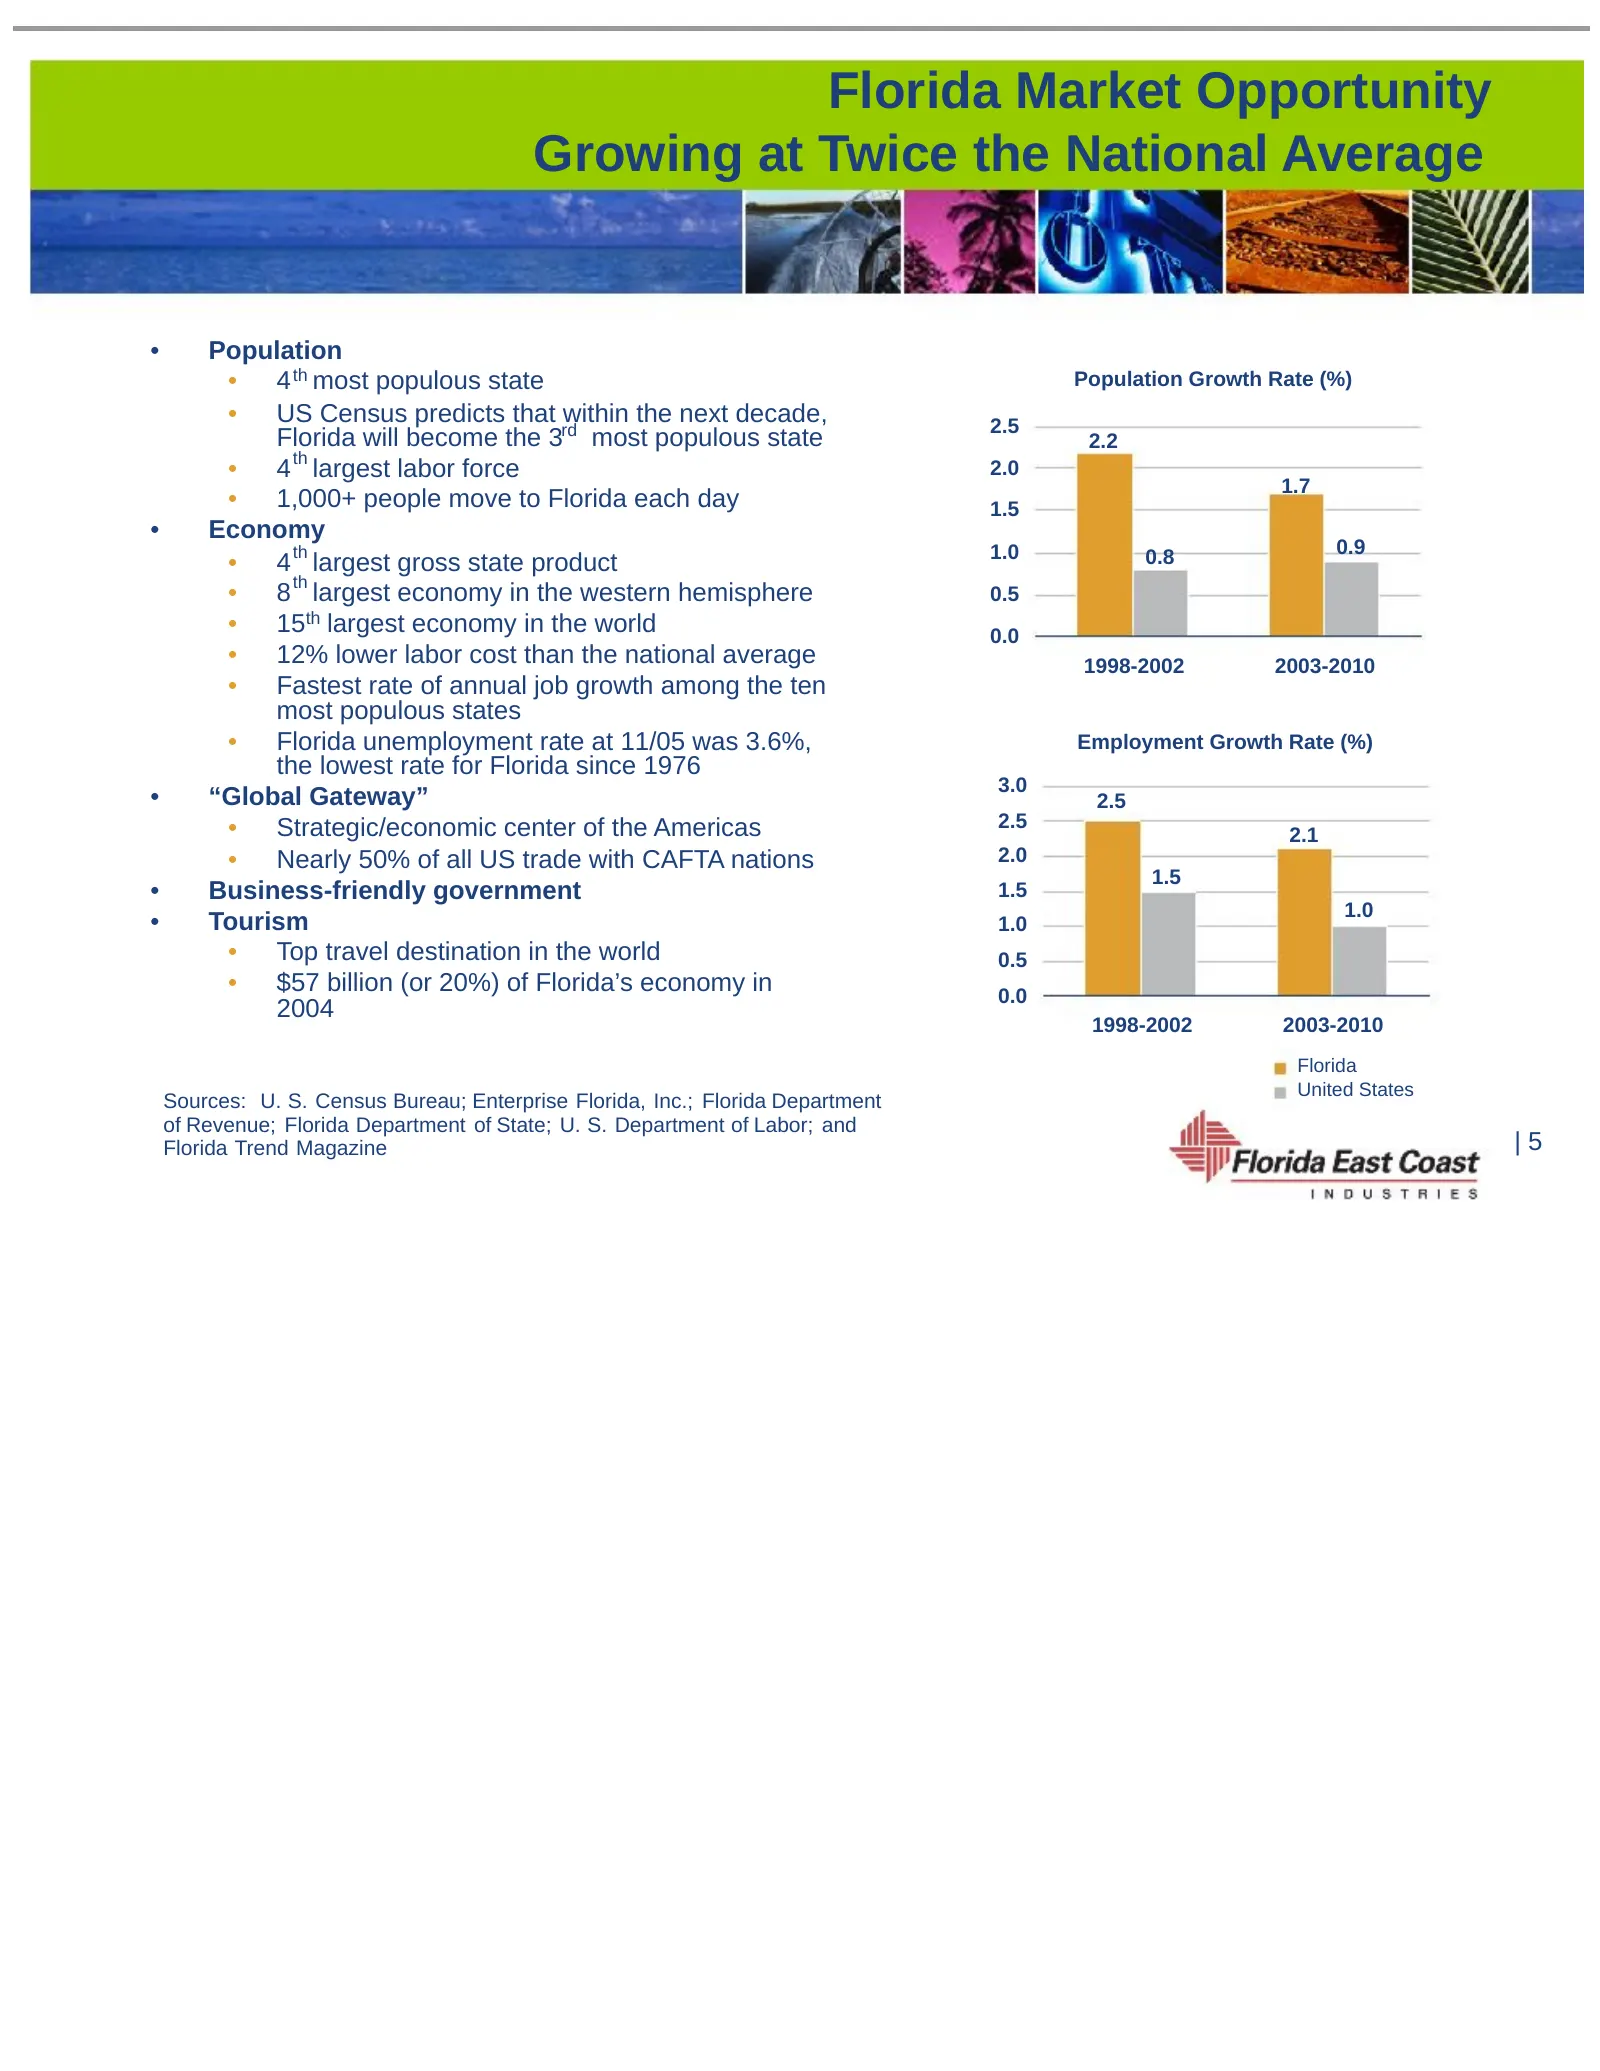
Florida Market Opportunity Growing at Twice the National Average • Population • 4 th most populous state Population Growth Rate (%) • US Census predicts that within the next decade, 2.5 Florida will become the 3rd most populous state 2.2 th • 4 largest labor force 2.0 1.7 • 1,000+ people move to Flo
Slide 6: Florida East Coast Railway
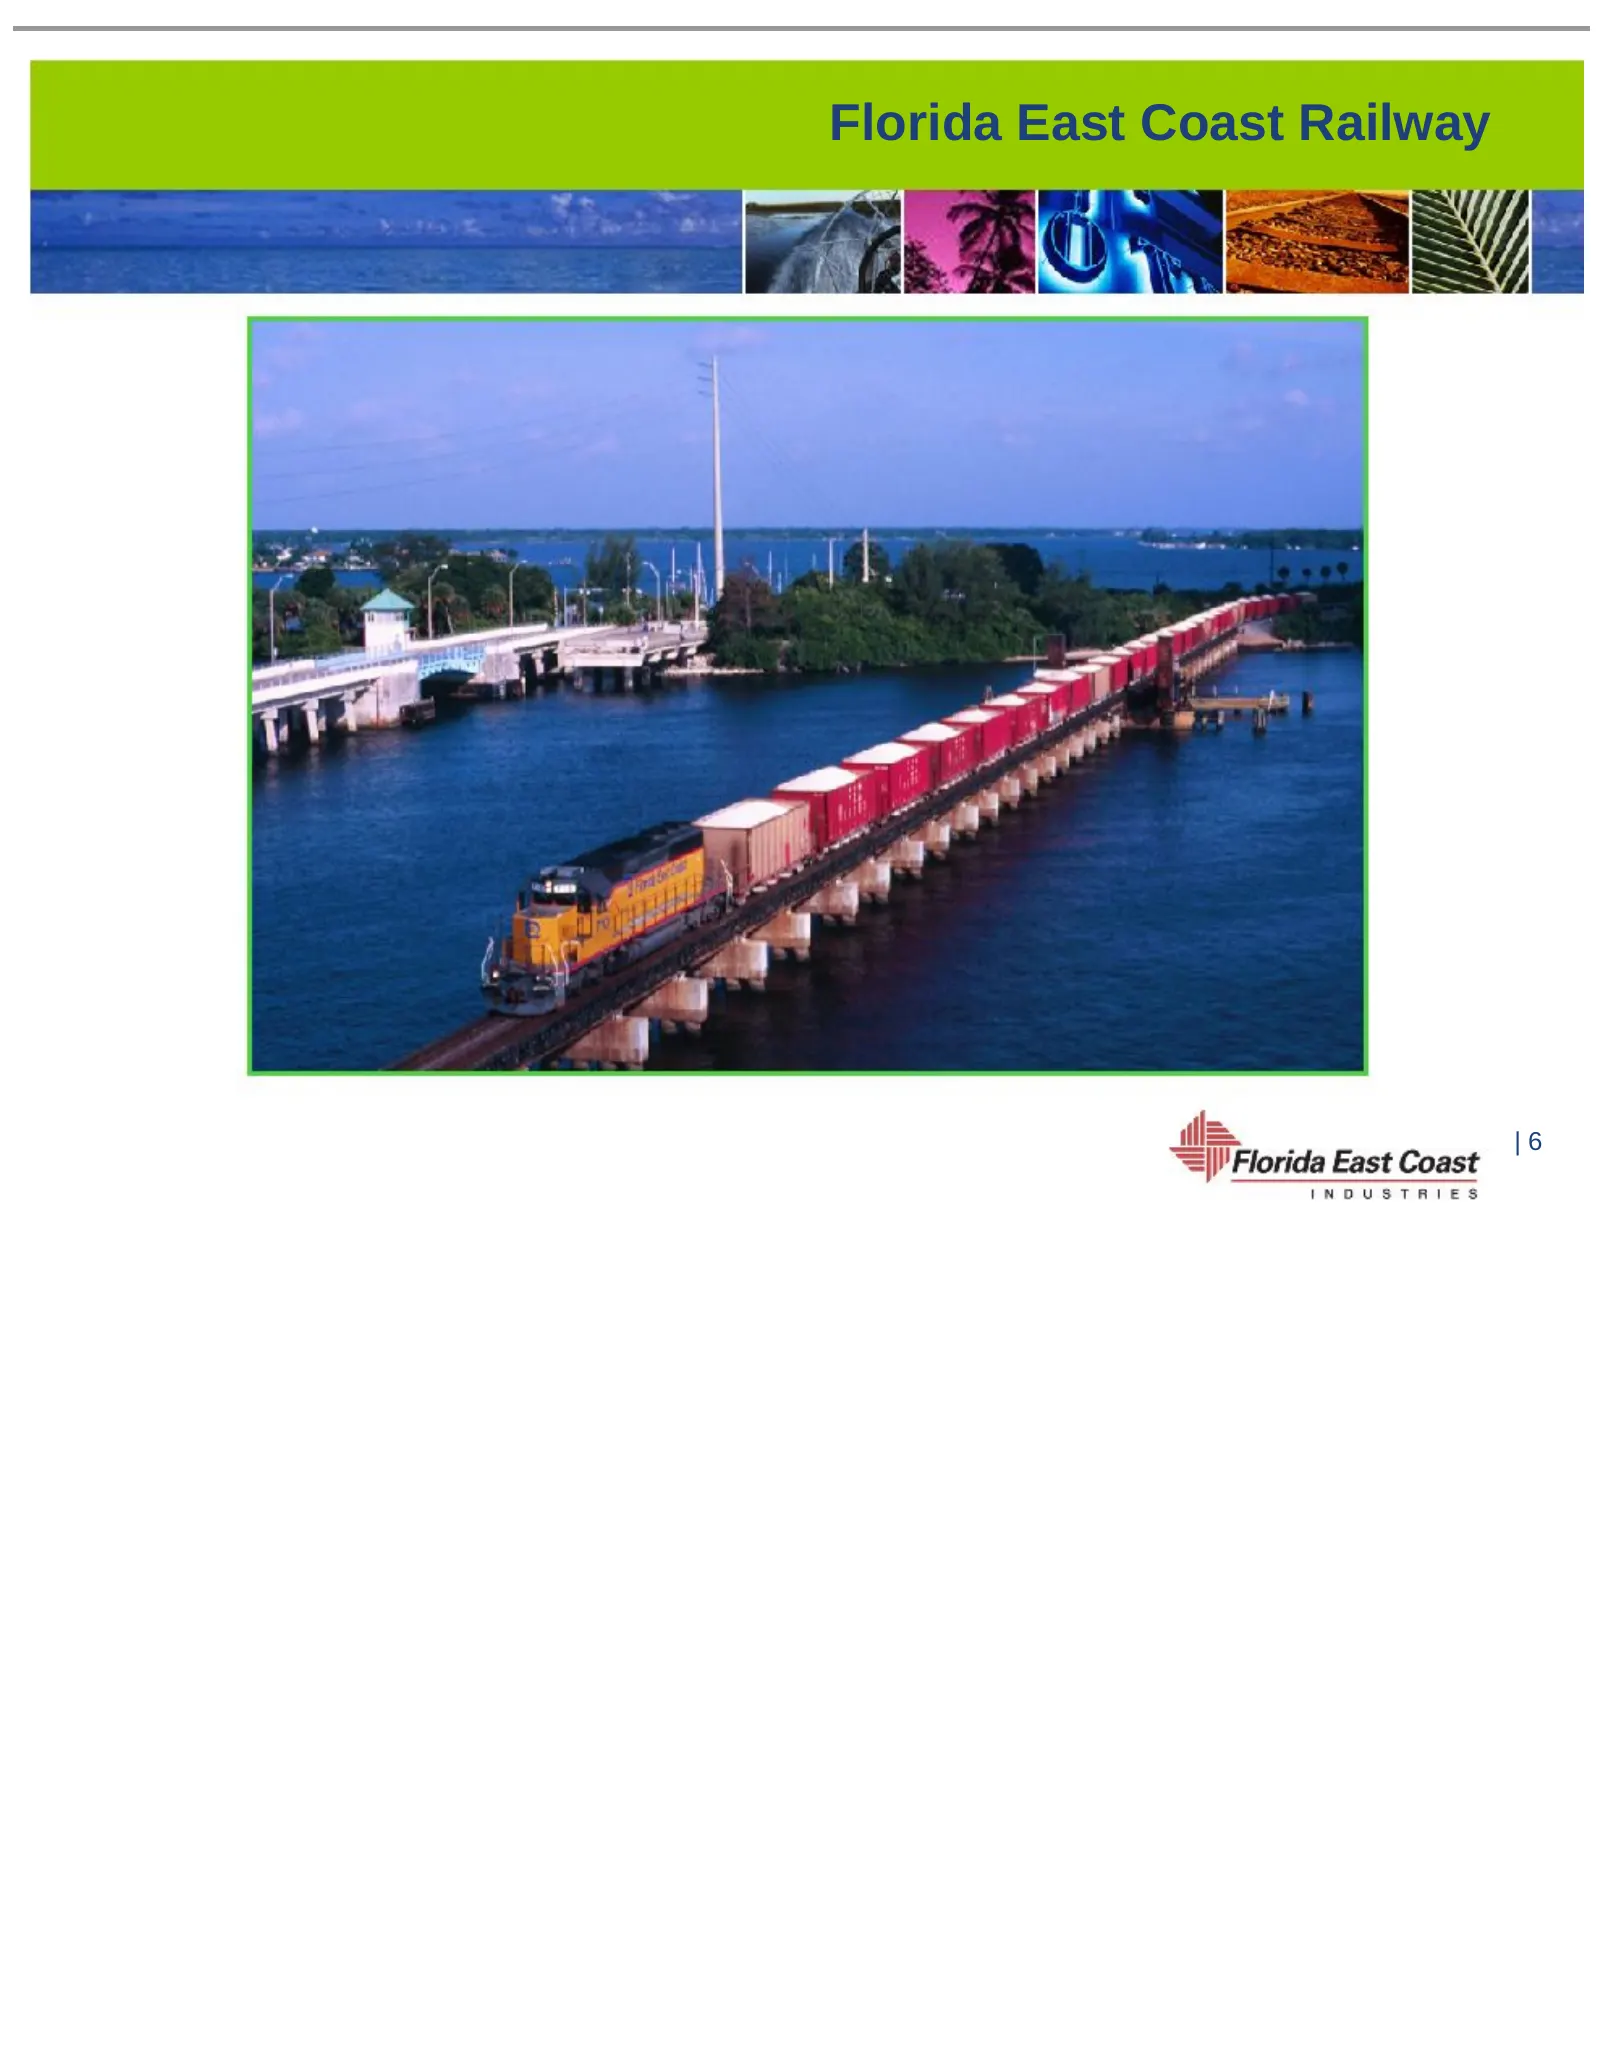
Florida East Coast Railway |6
Slide 7: FECR Overview
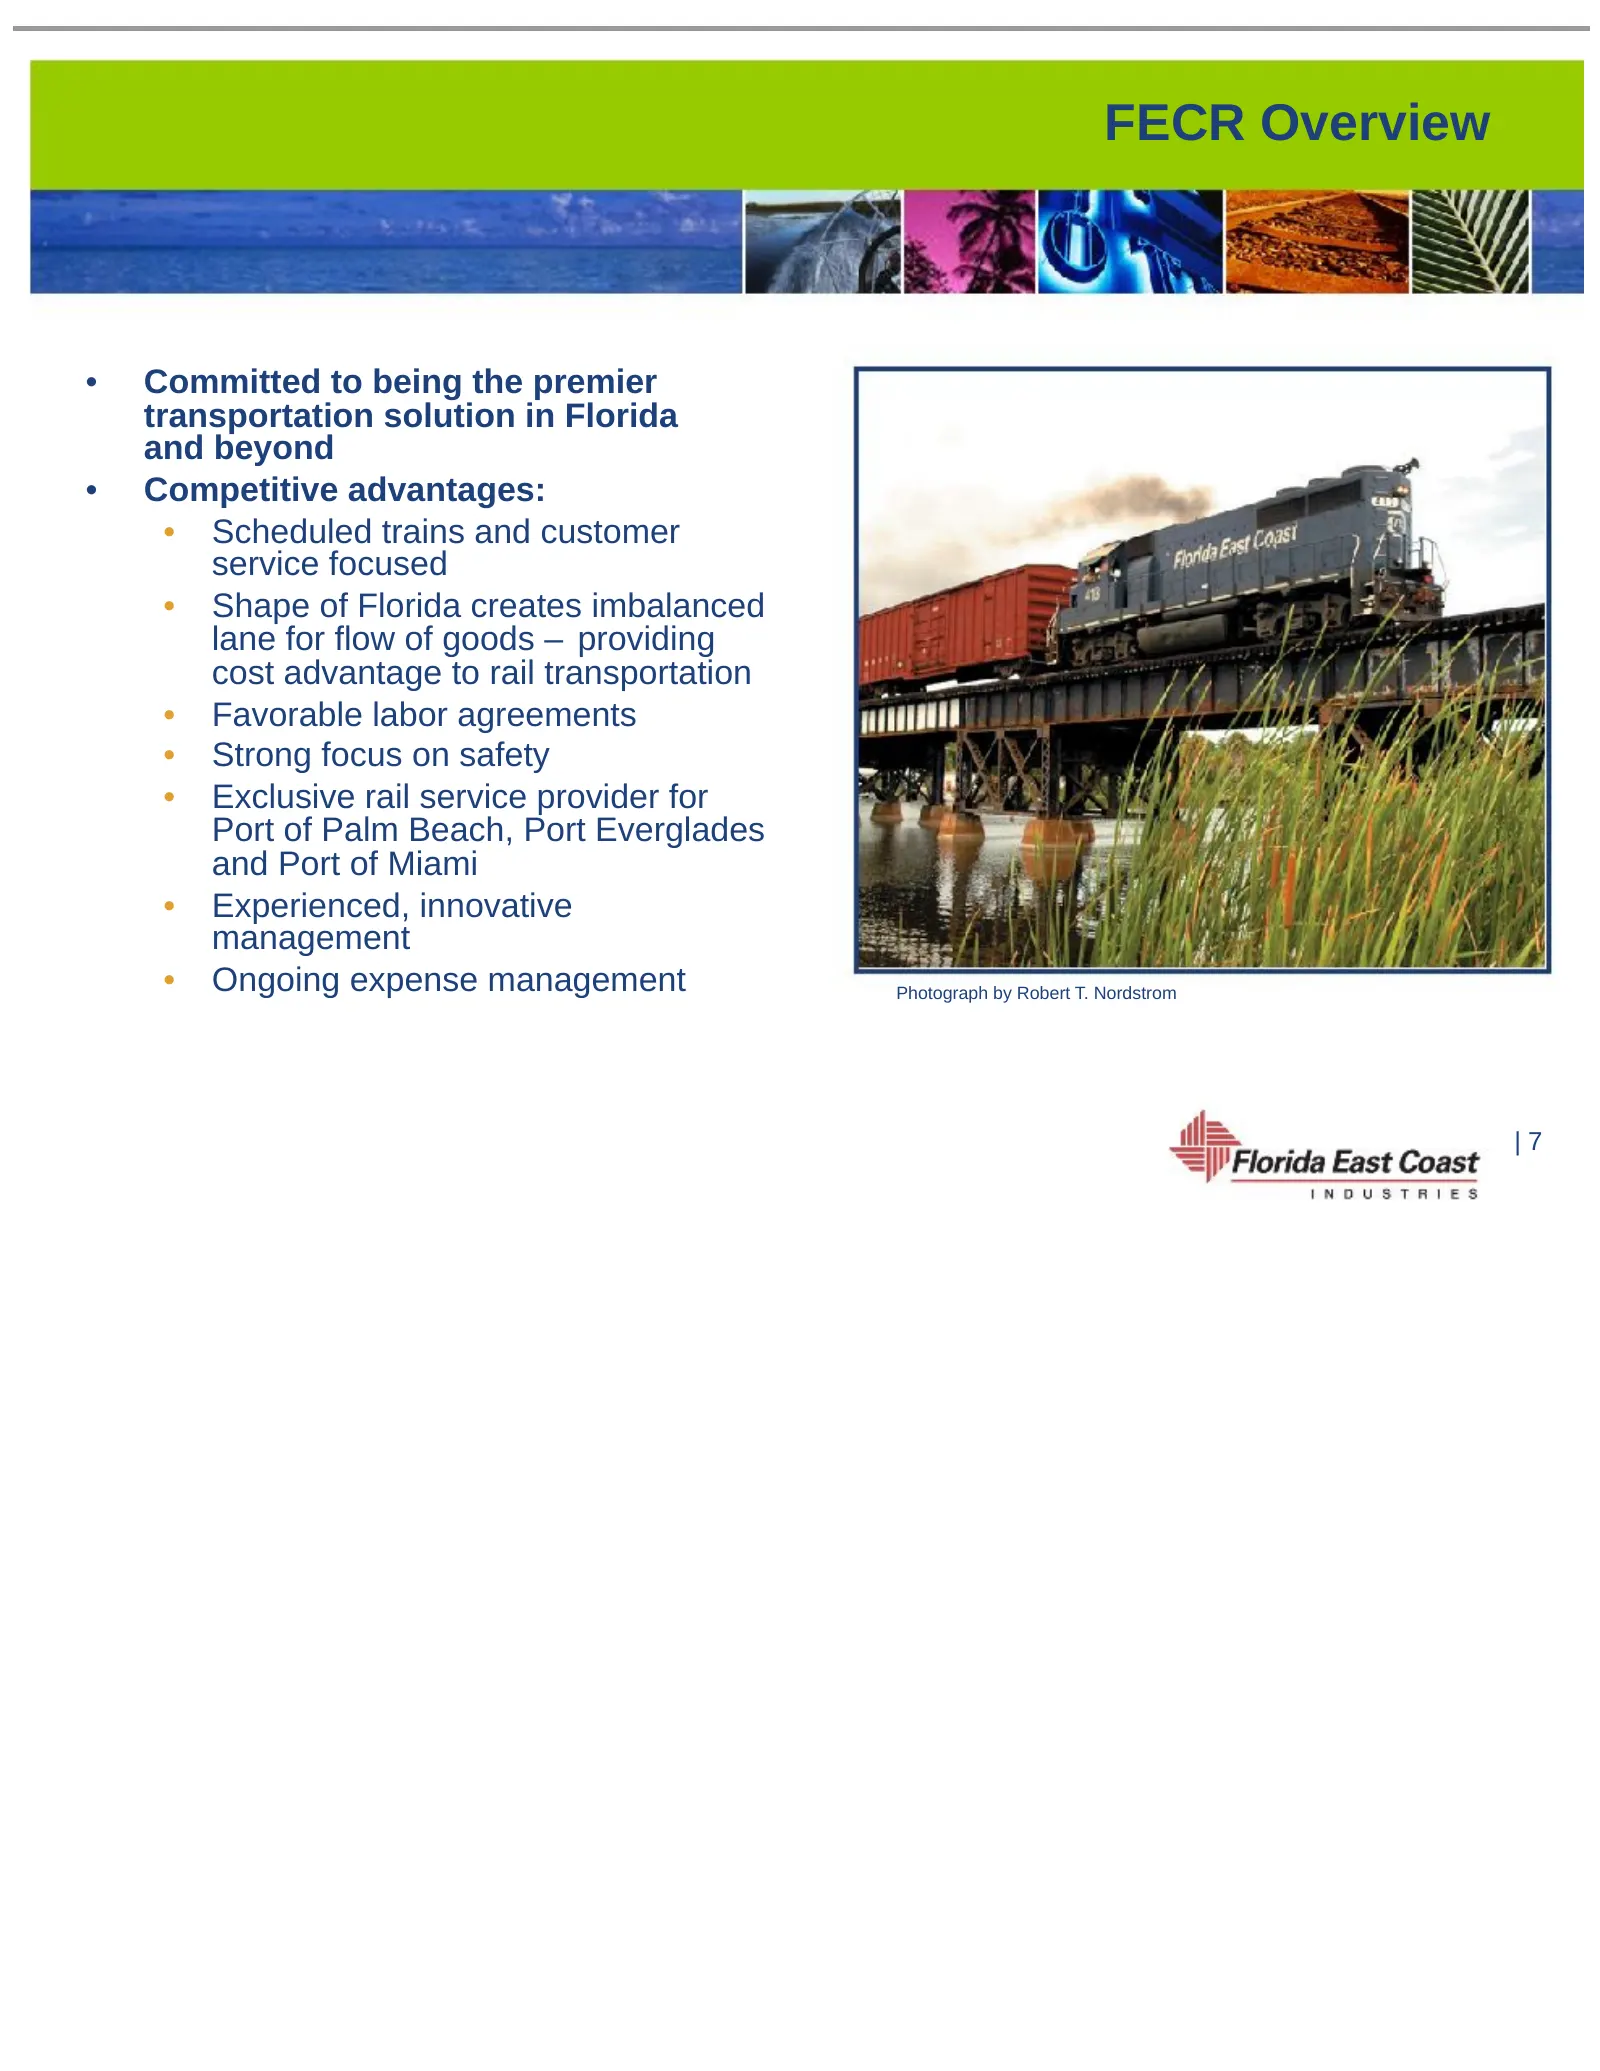
FECR Overview • Committed to being the premier transportation solution in Florida and beyond • Competitive advantages: • Scheduled trains and customer service focused • Shape of Florida creates imbalanced lane for flow of goods – providing cost advantage to rail transportation • Favorable labor agre
Slide 8: FECR Physical Plant
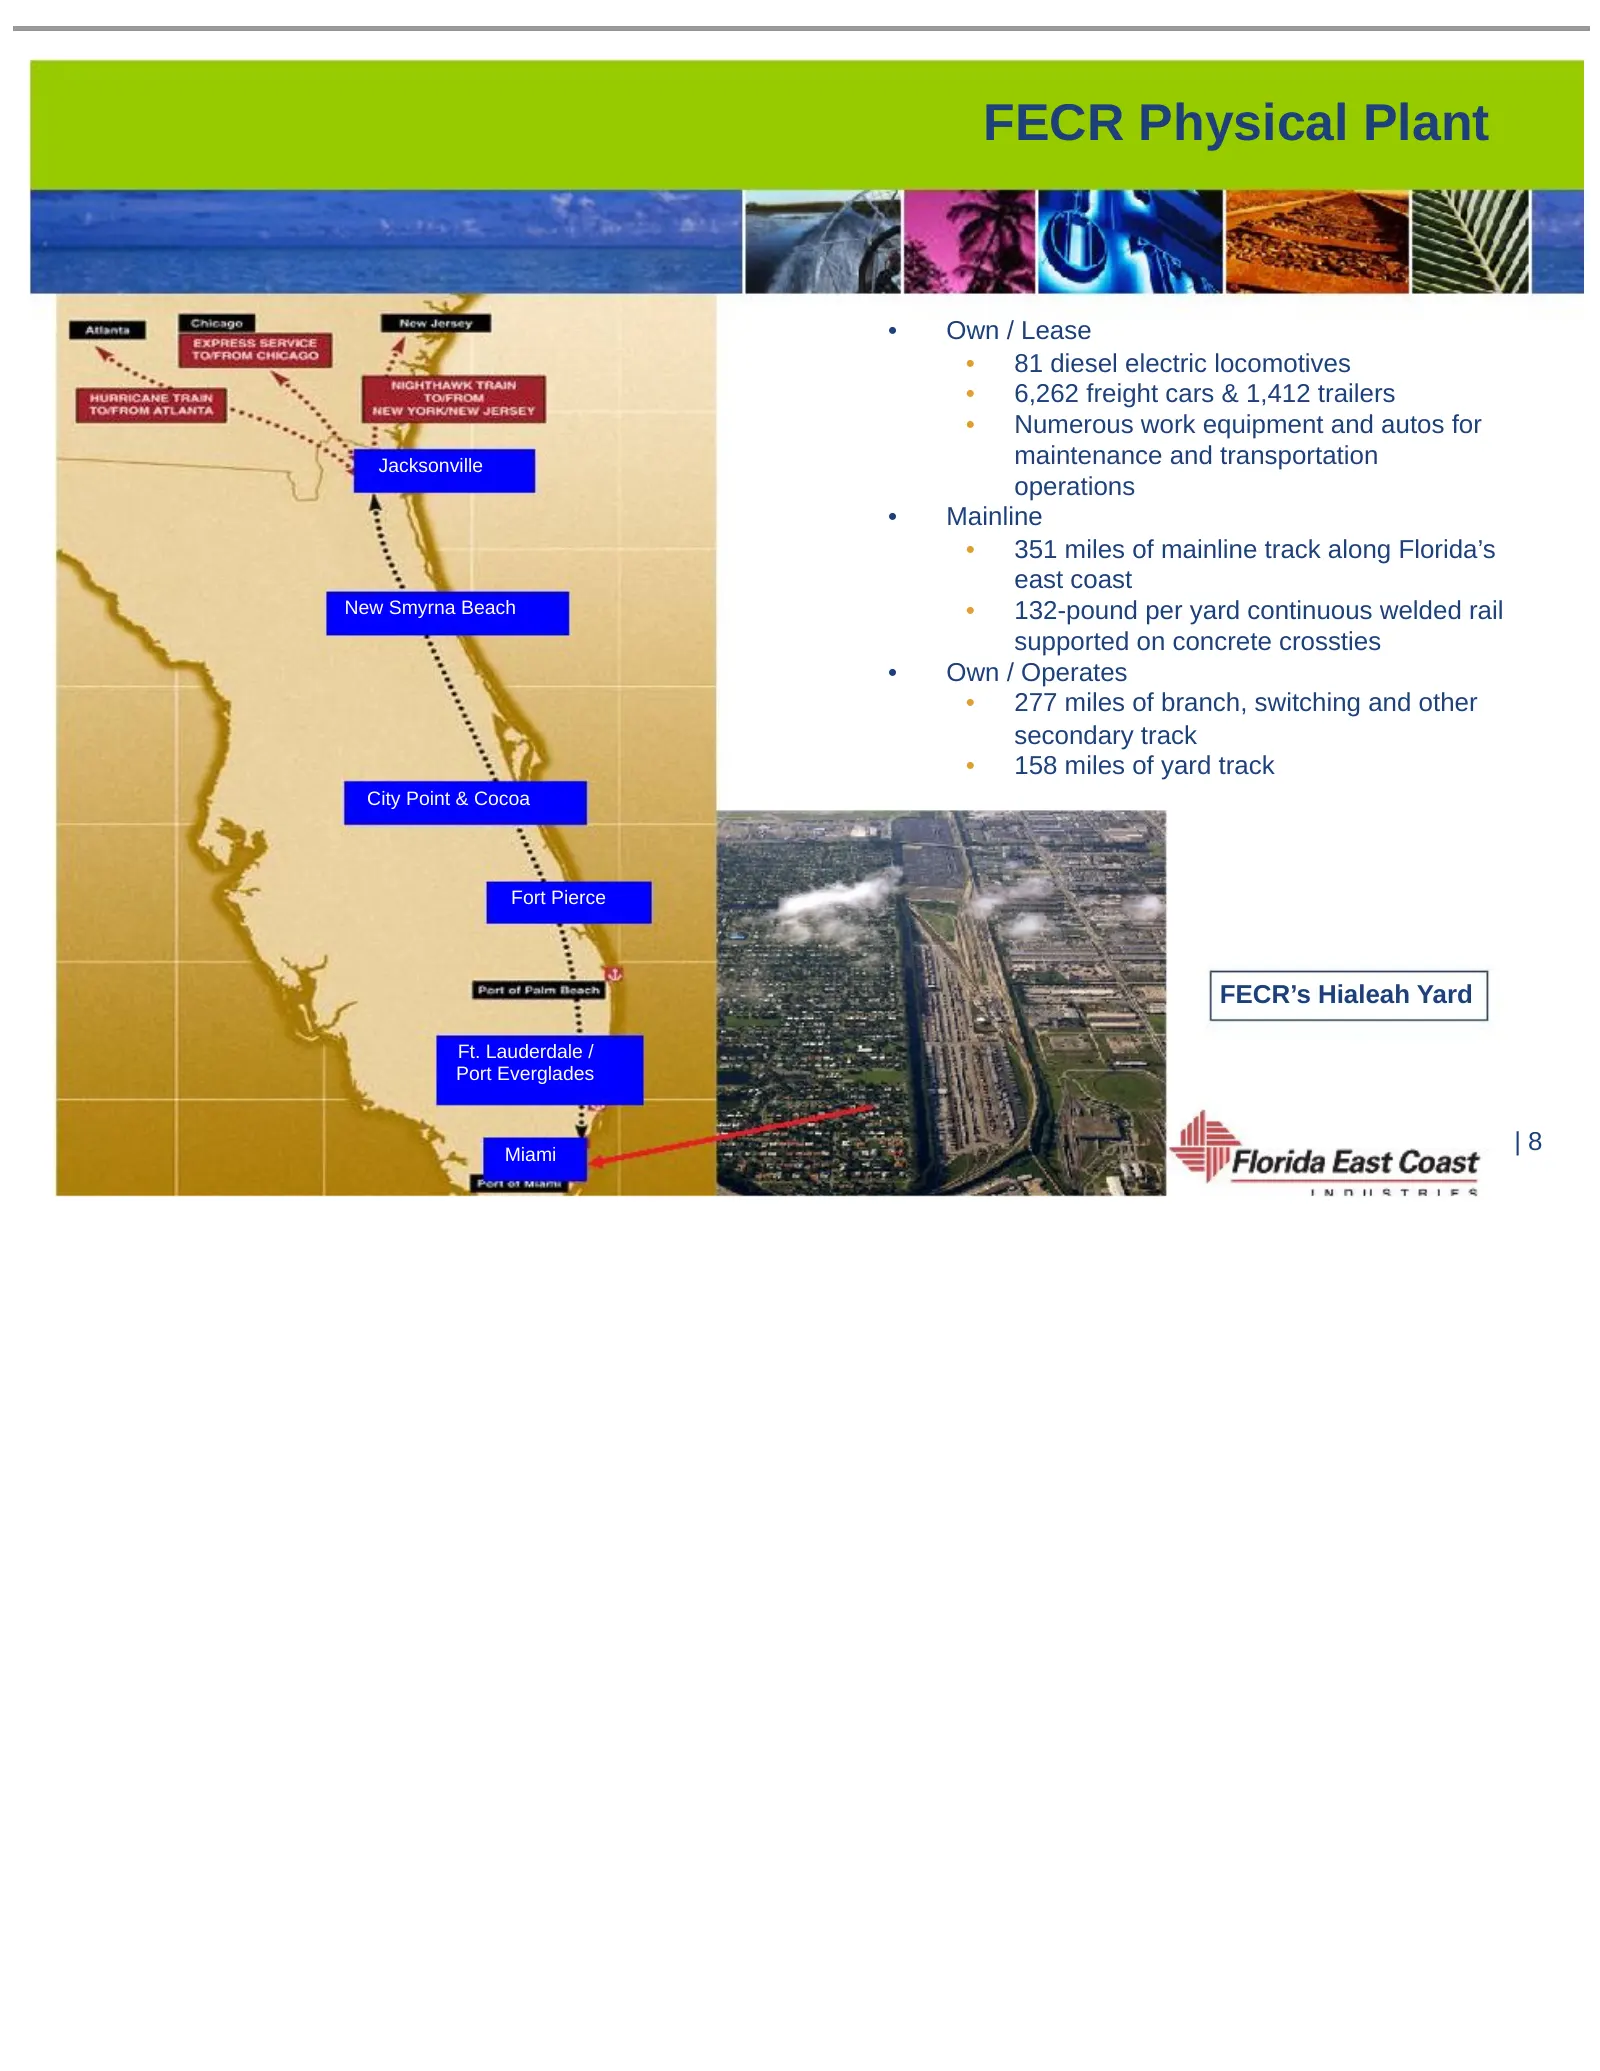
FECR Physical Plant • Own / Lease • 81 diesel electric locomotives • 6,262 freight cars & 1,412 trailers • Numerous work equipment and autos for Jacksonville maintenance and transportation operations • Mainline • 351 miles of mainline track along Florida’s east coast New Smyrna Beach • 132-pound per
Slide 9: FECR Key Financial Data
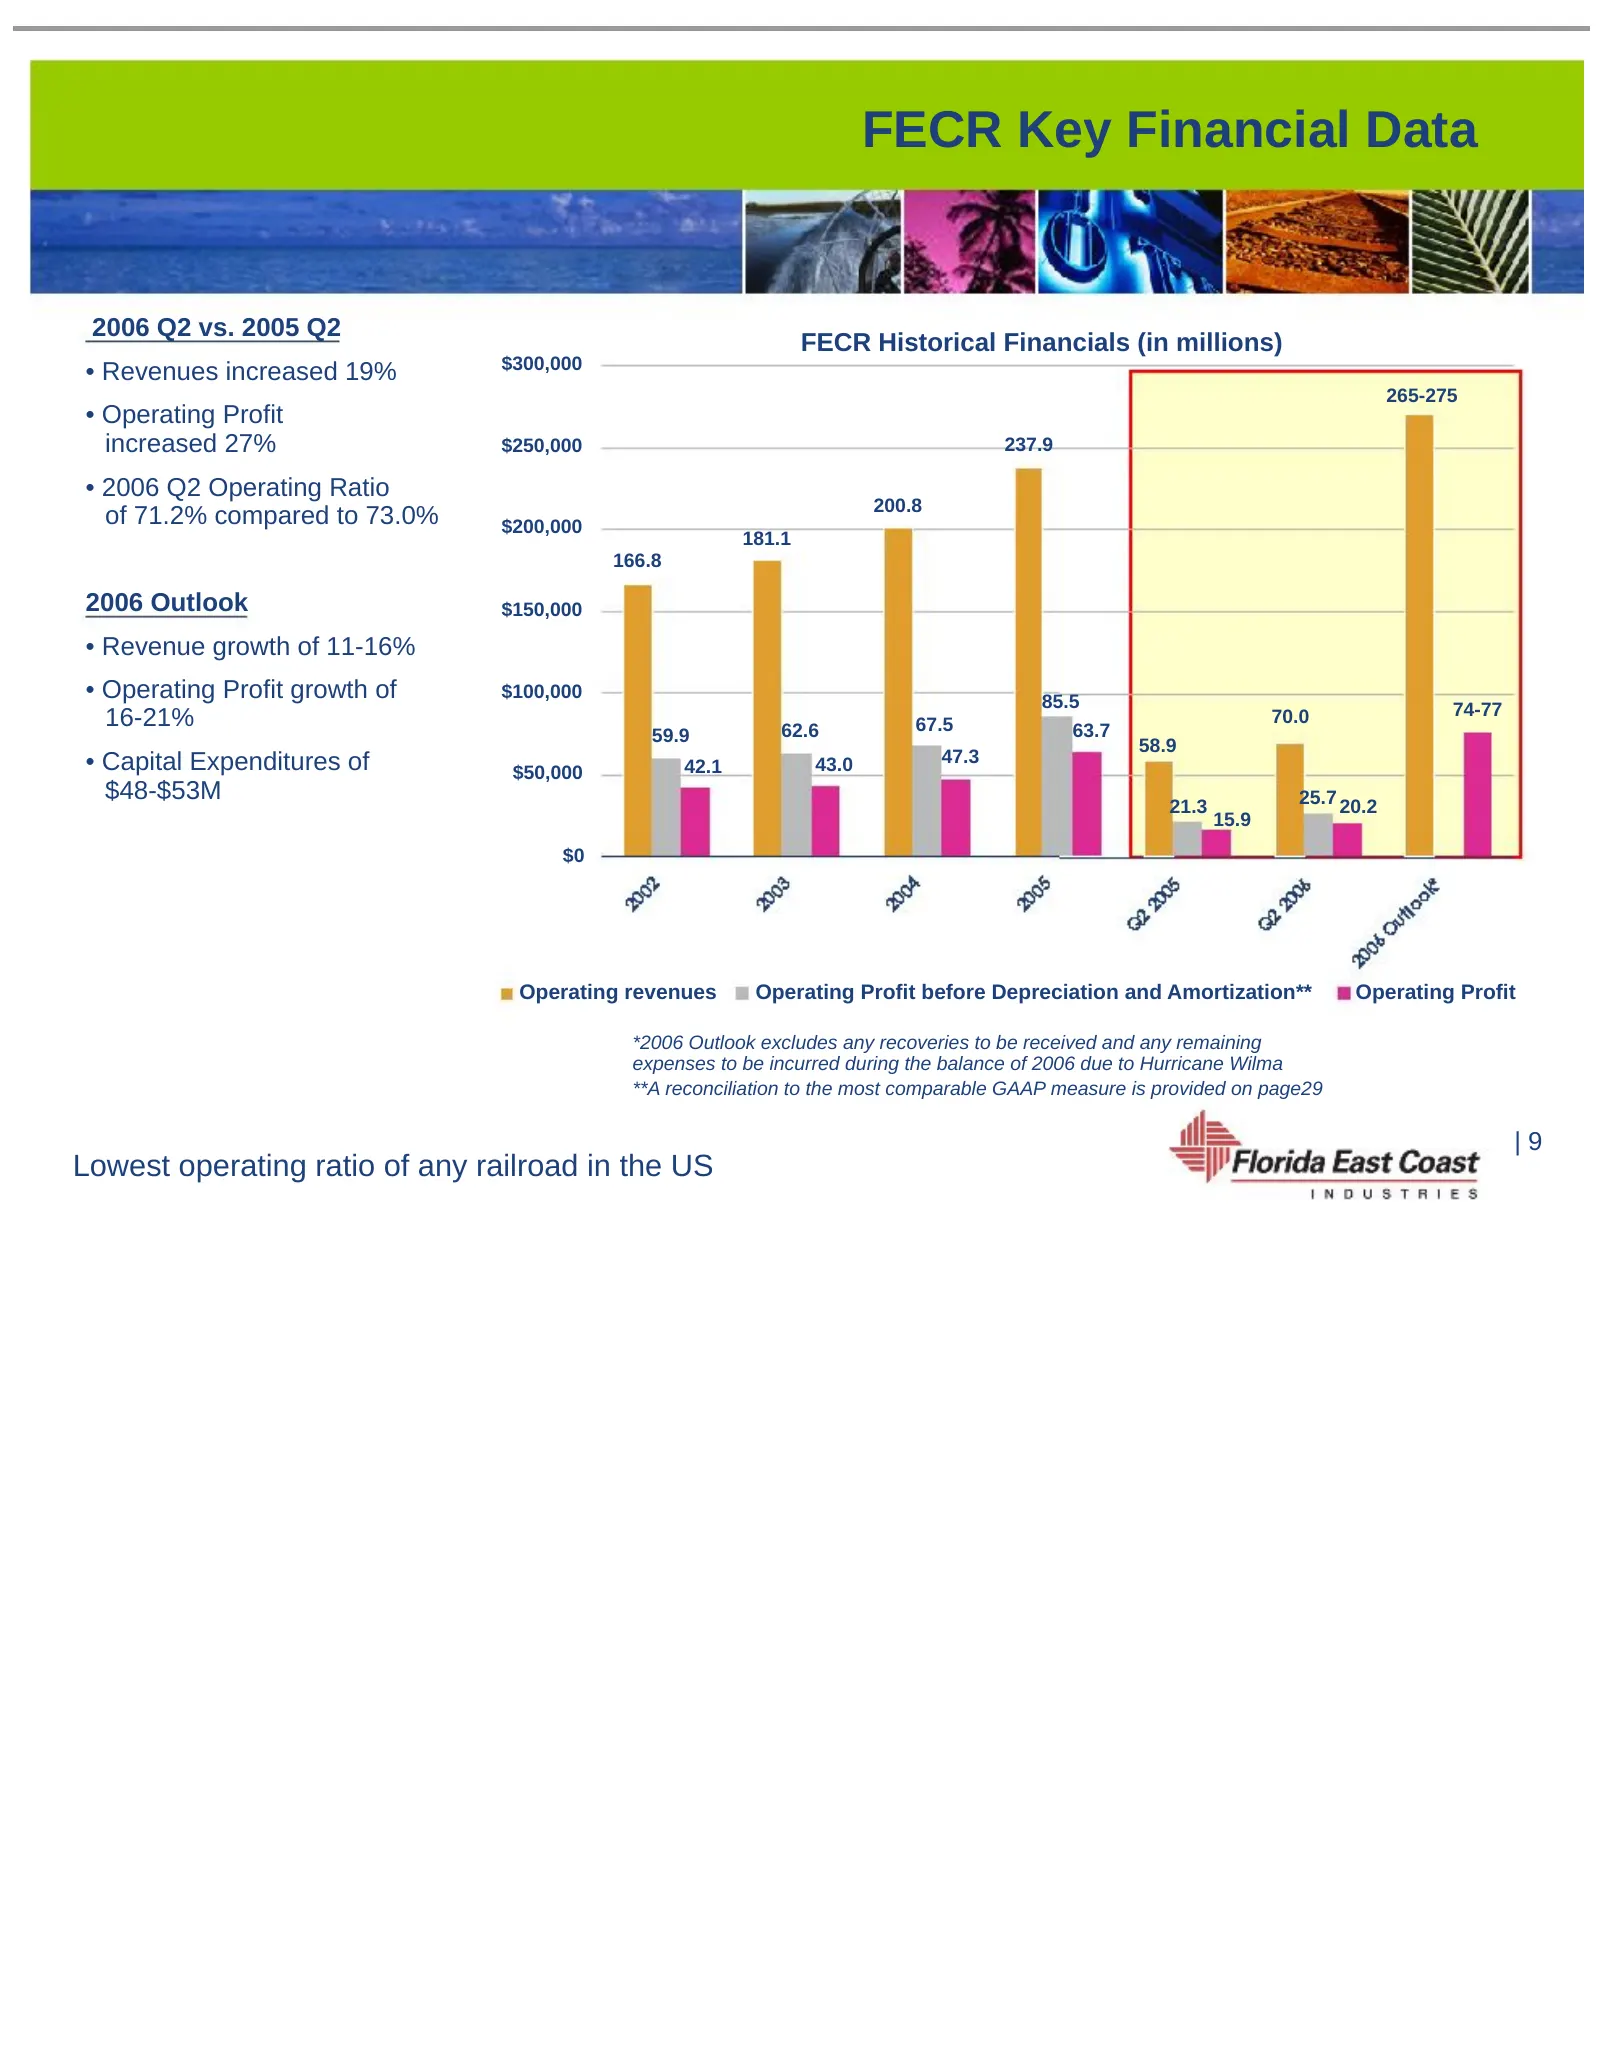
FECR Key Financial Data 2006 Q2 vs. 2005 Q2 FECR Historical Financials (in millions) $300,000 • Revenues increased 19% 265-275 • Operating Profit increased 27% $250,000 237.9 • 2006 Q2 Operating Ratio 200.8 of 71.2% compared to 73.0% $200,000 181.1 166.8 2006 Outlook $150,000 • Revenue growth of 11-
Slide 10: Major Commodity Detail
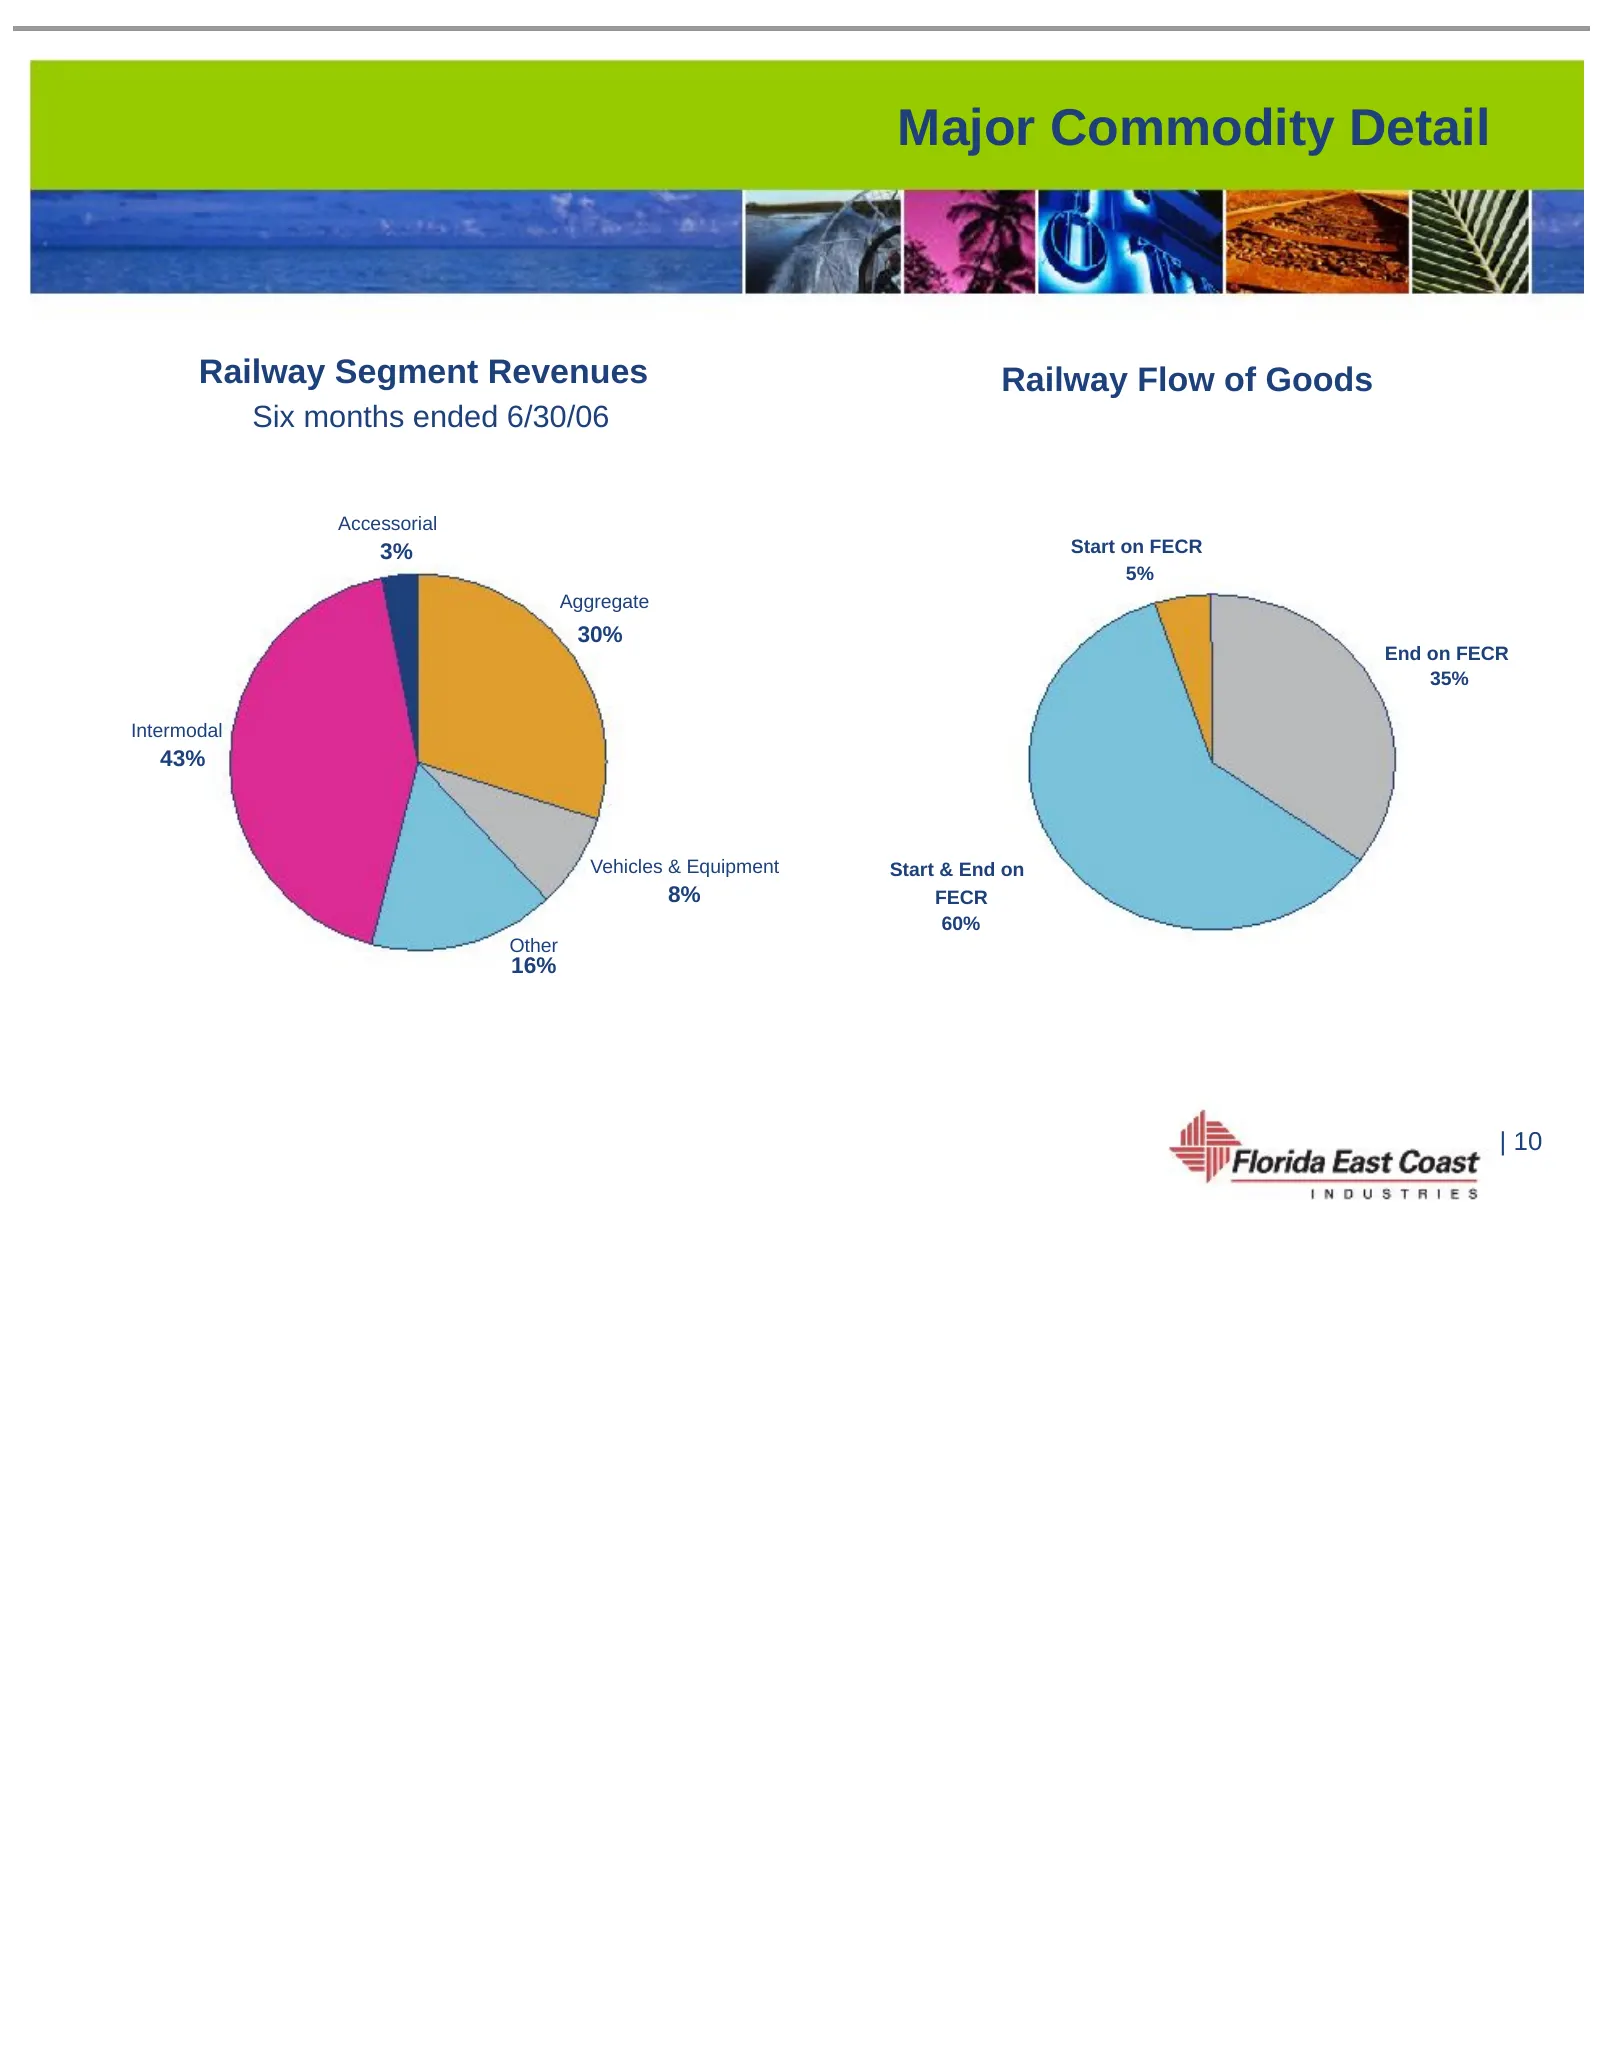
Major Commodity Detail Railway Segment Revenues Railway Flow of Goods Six months ended 6/30/06 Accessorial 3% Start on FECR 5% Aggregate 30% End on FECR 35% Intermodal 43% Vehicles & Equipment Start & End on 8% FECR 60% Other 16% | 10
Slide 11: Railway – Increased Aggregate Volumes and Revenues
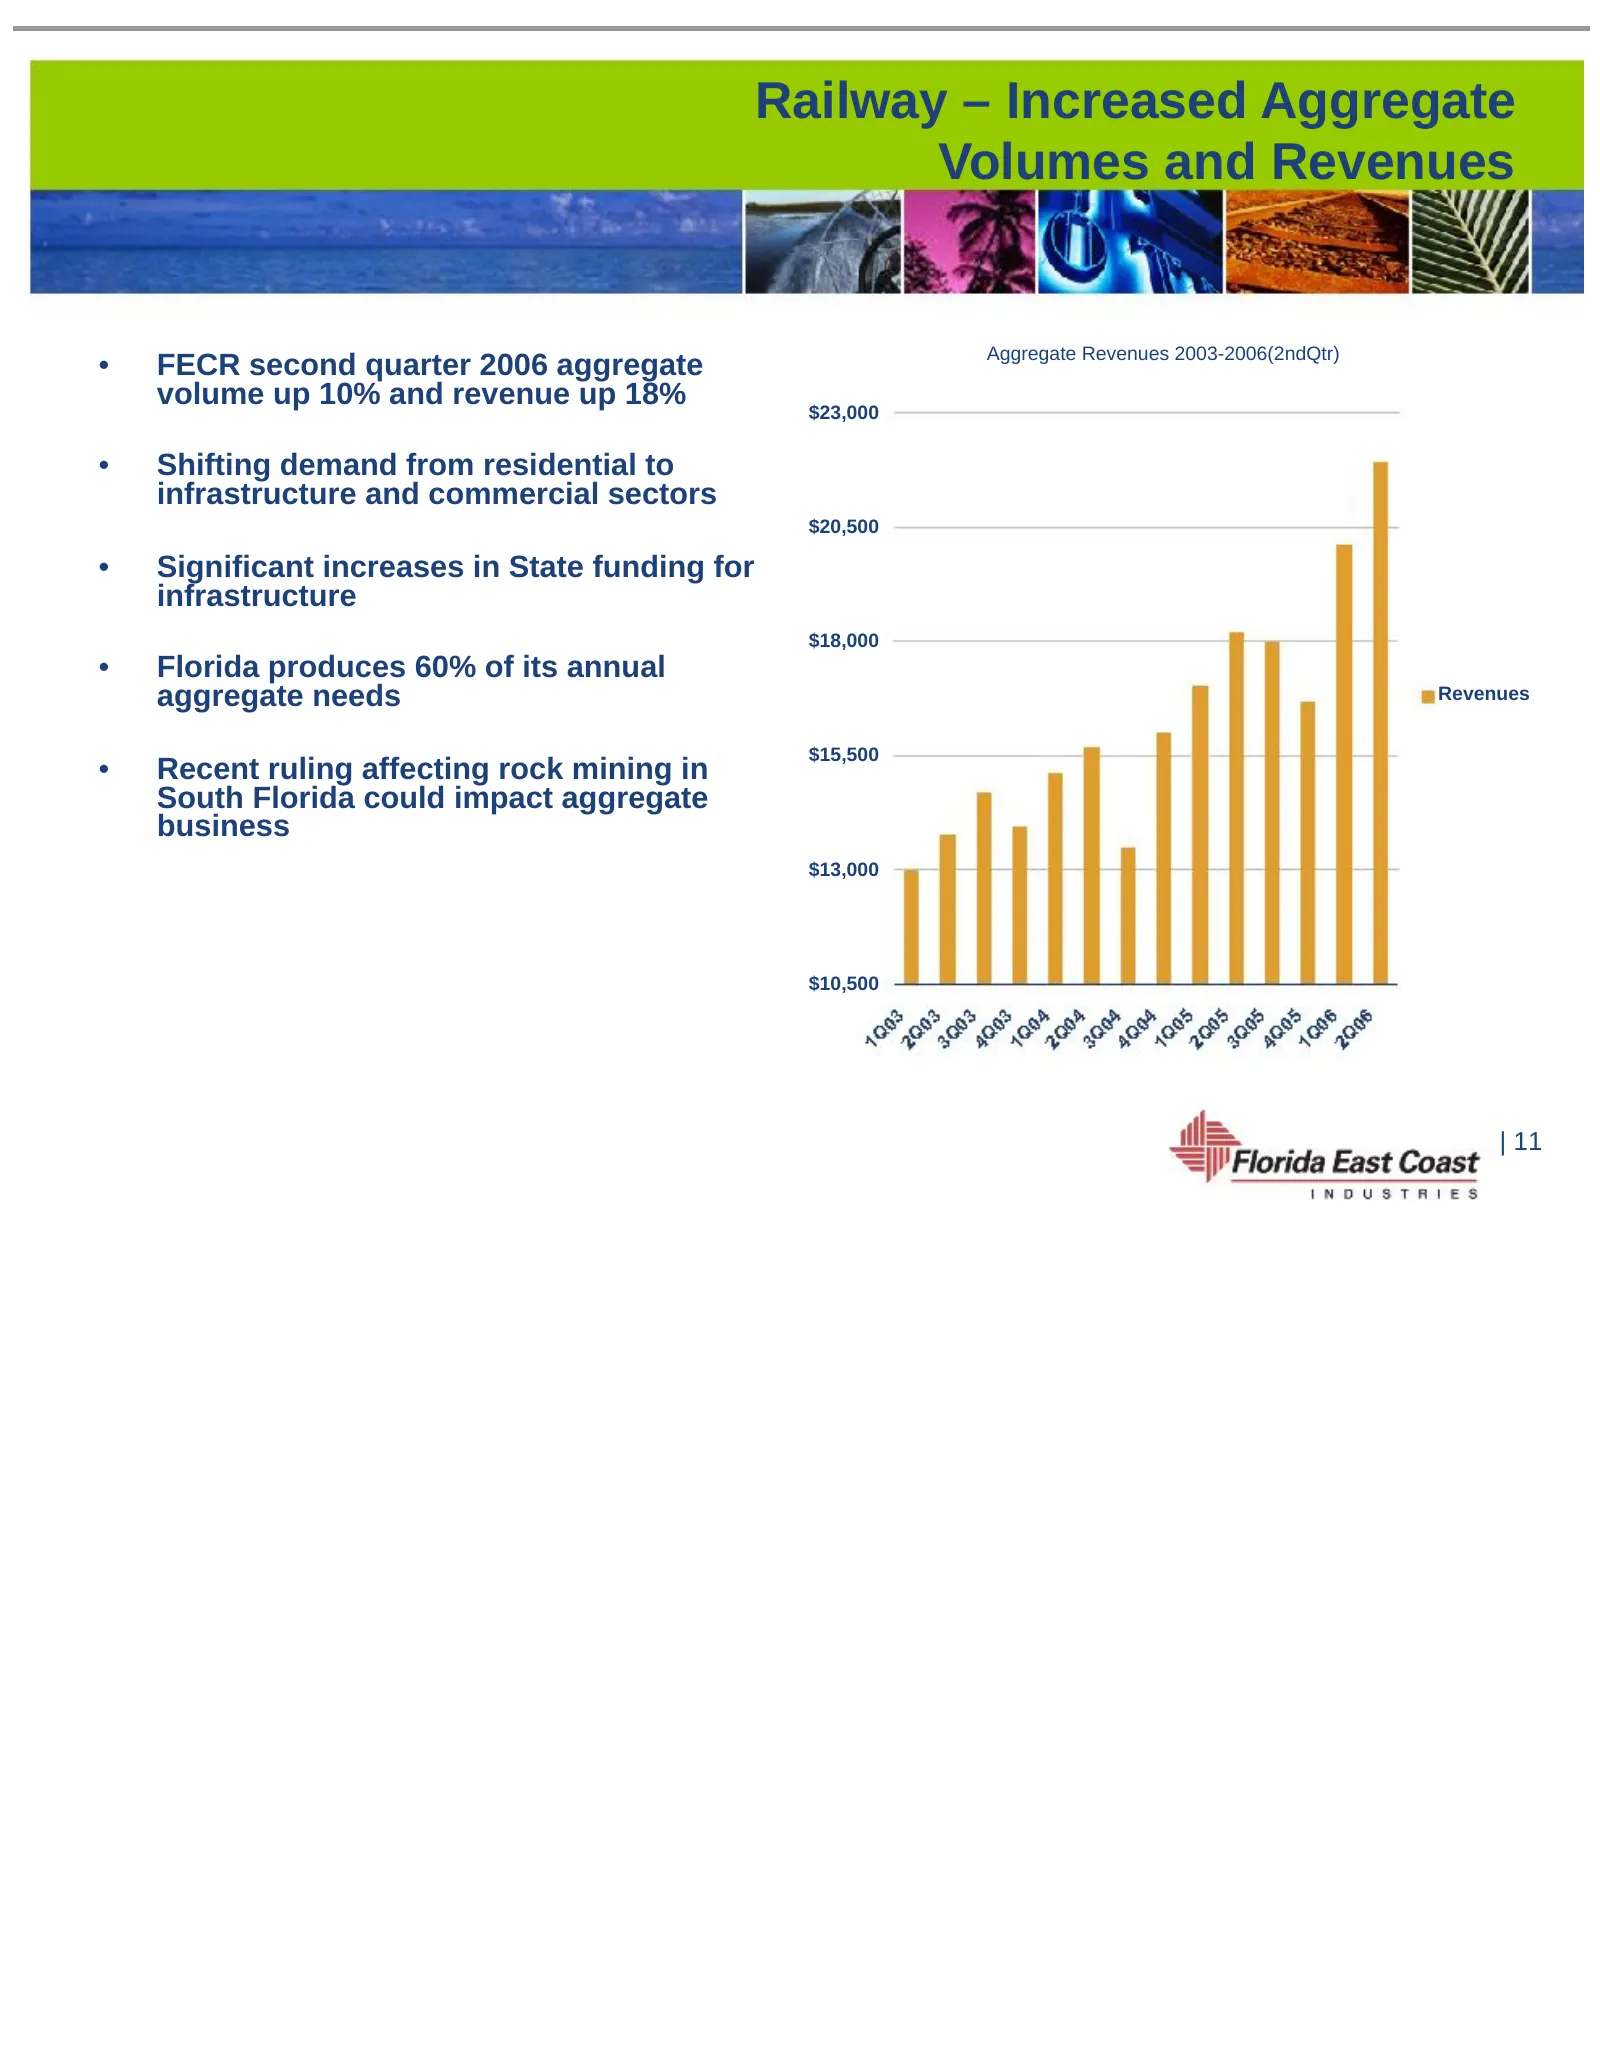
Railway – Increased Aggregate Volumes and Revenues Aggregate Revenues 2003-2006(2ndQtr) • FECR second quarter 2006 aggregate volume up 10% and revenue up 18% $23,000 • Shifting demand from residential to infrastructure and commercial sectors $20,500 • Significant increases in State funding for infra
Slide 12: Railway – Continued Intermodal Growth
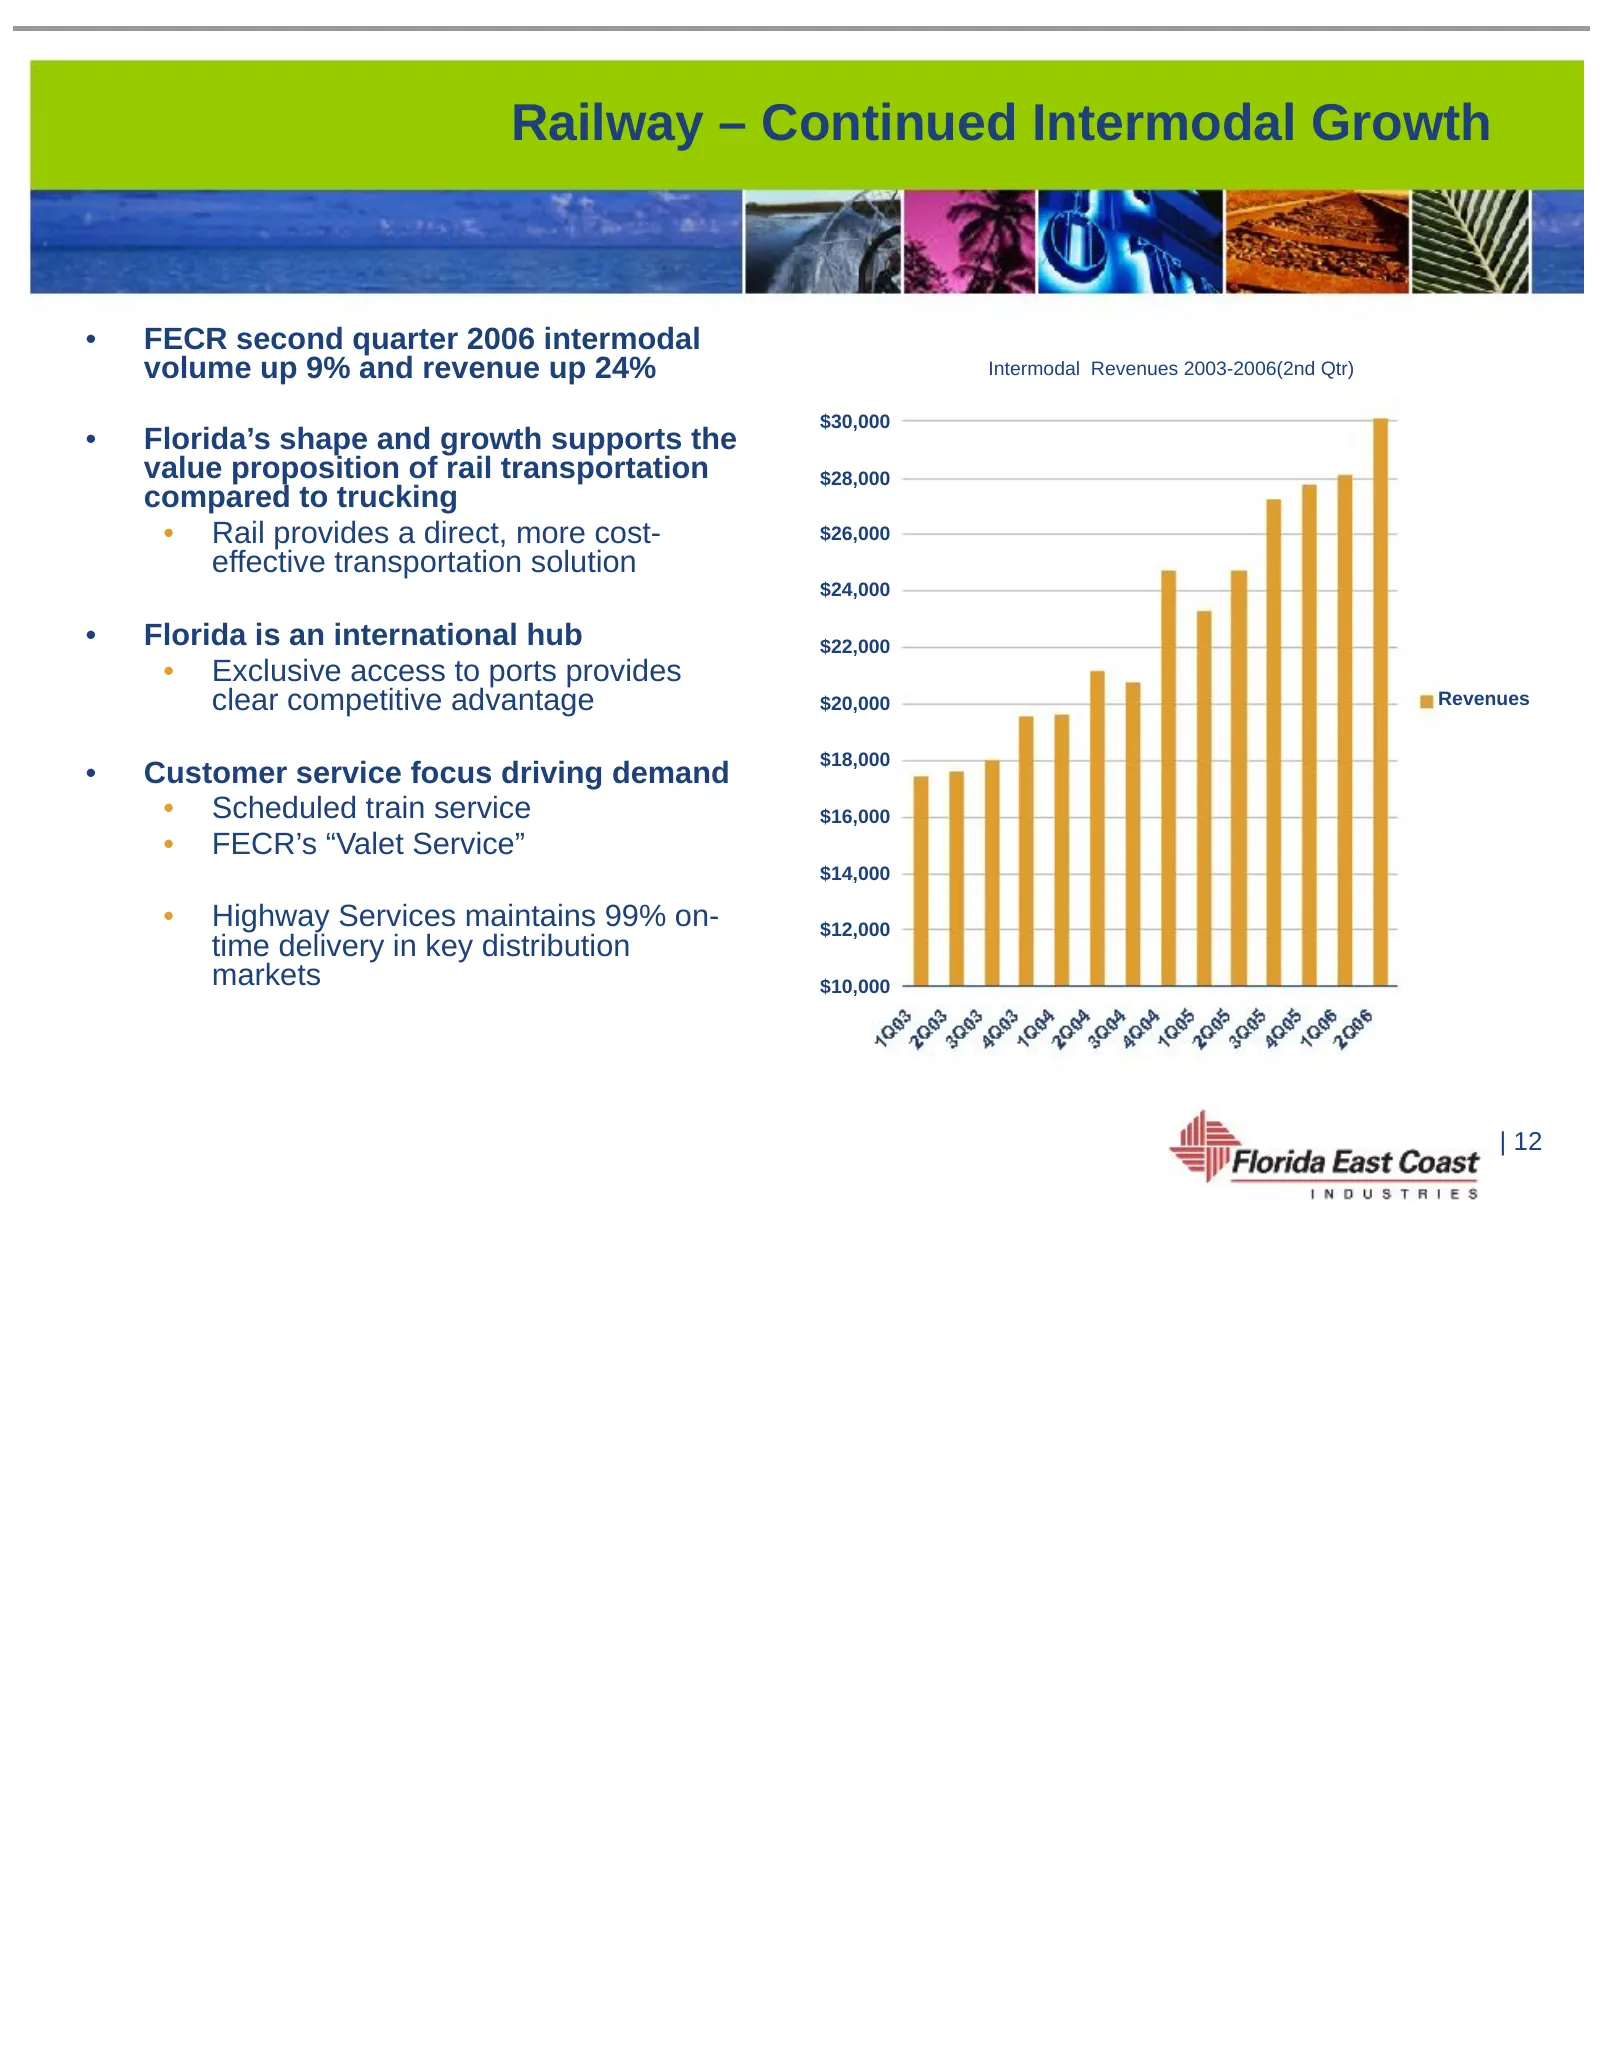
Railway – Continued Intermodal Growth • FECR second quarter 2006 intermodal volume up 9% and revenue up 24% Intermodal Revenues 2003-2006(2nd Qtr) $30,000 • Florida’s shape and growth supports the value proposition of rail transportation $28,000 compared to trucking • Rail provides a direct, more co
Slide 13: Florida's Dynamics are Driving Growth for FECR
Florida’s Dynamics are Driving Growth for FECR • Florida’s population growth fuels aggregate growth • Need for new road construction and infrastructure upgrades • Additional federal and state dollars have been allocated • Commercial construction • Recent hurricanes have prompted changes in building
Slide 14: Investing for Future Growth
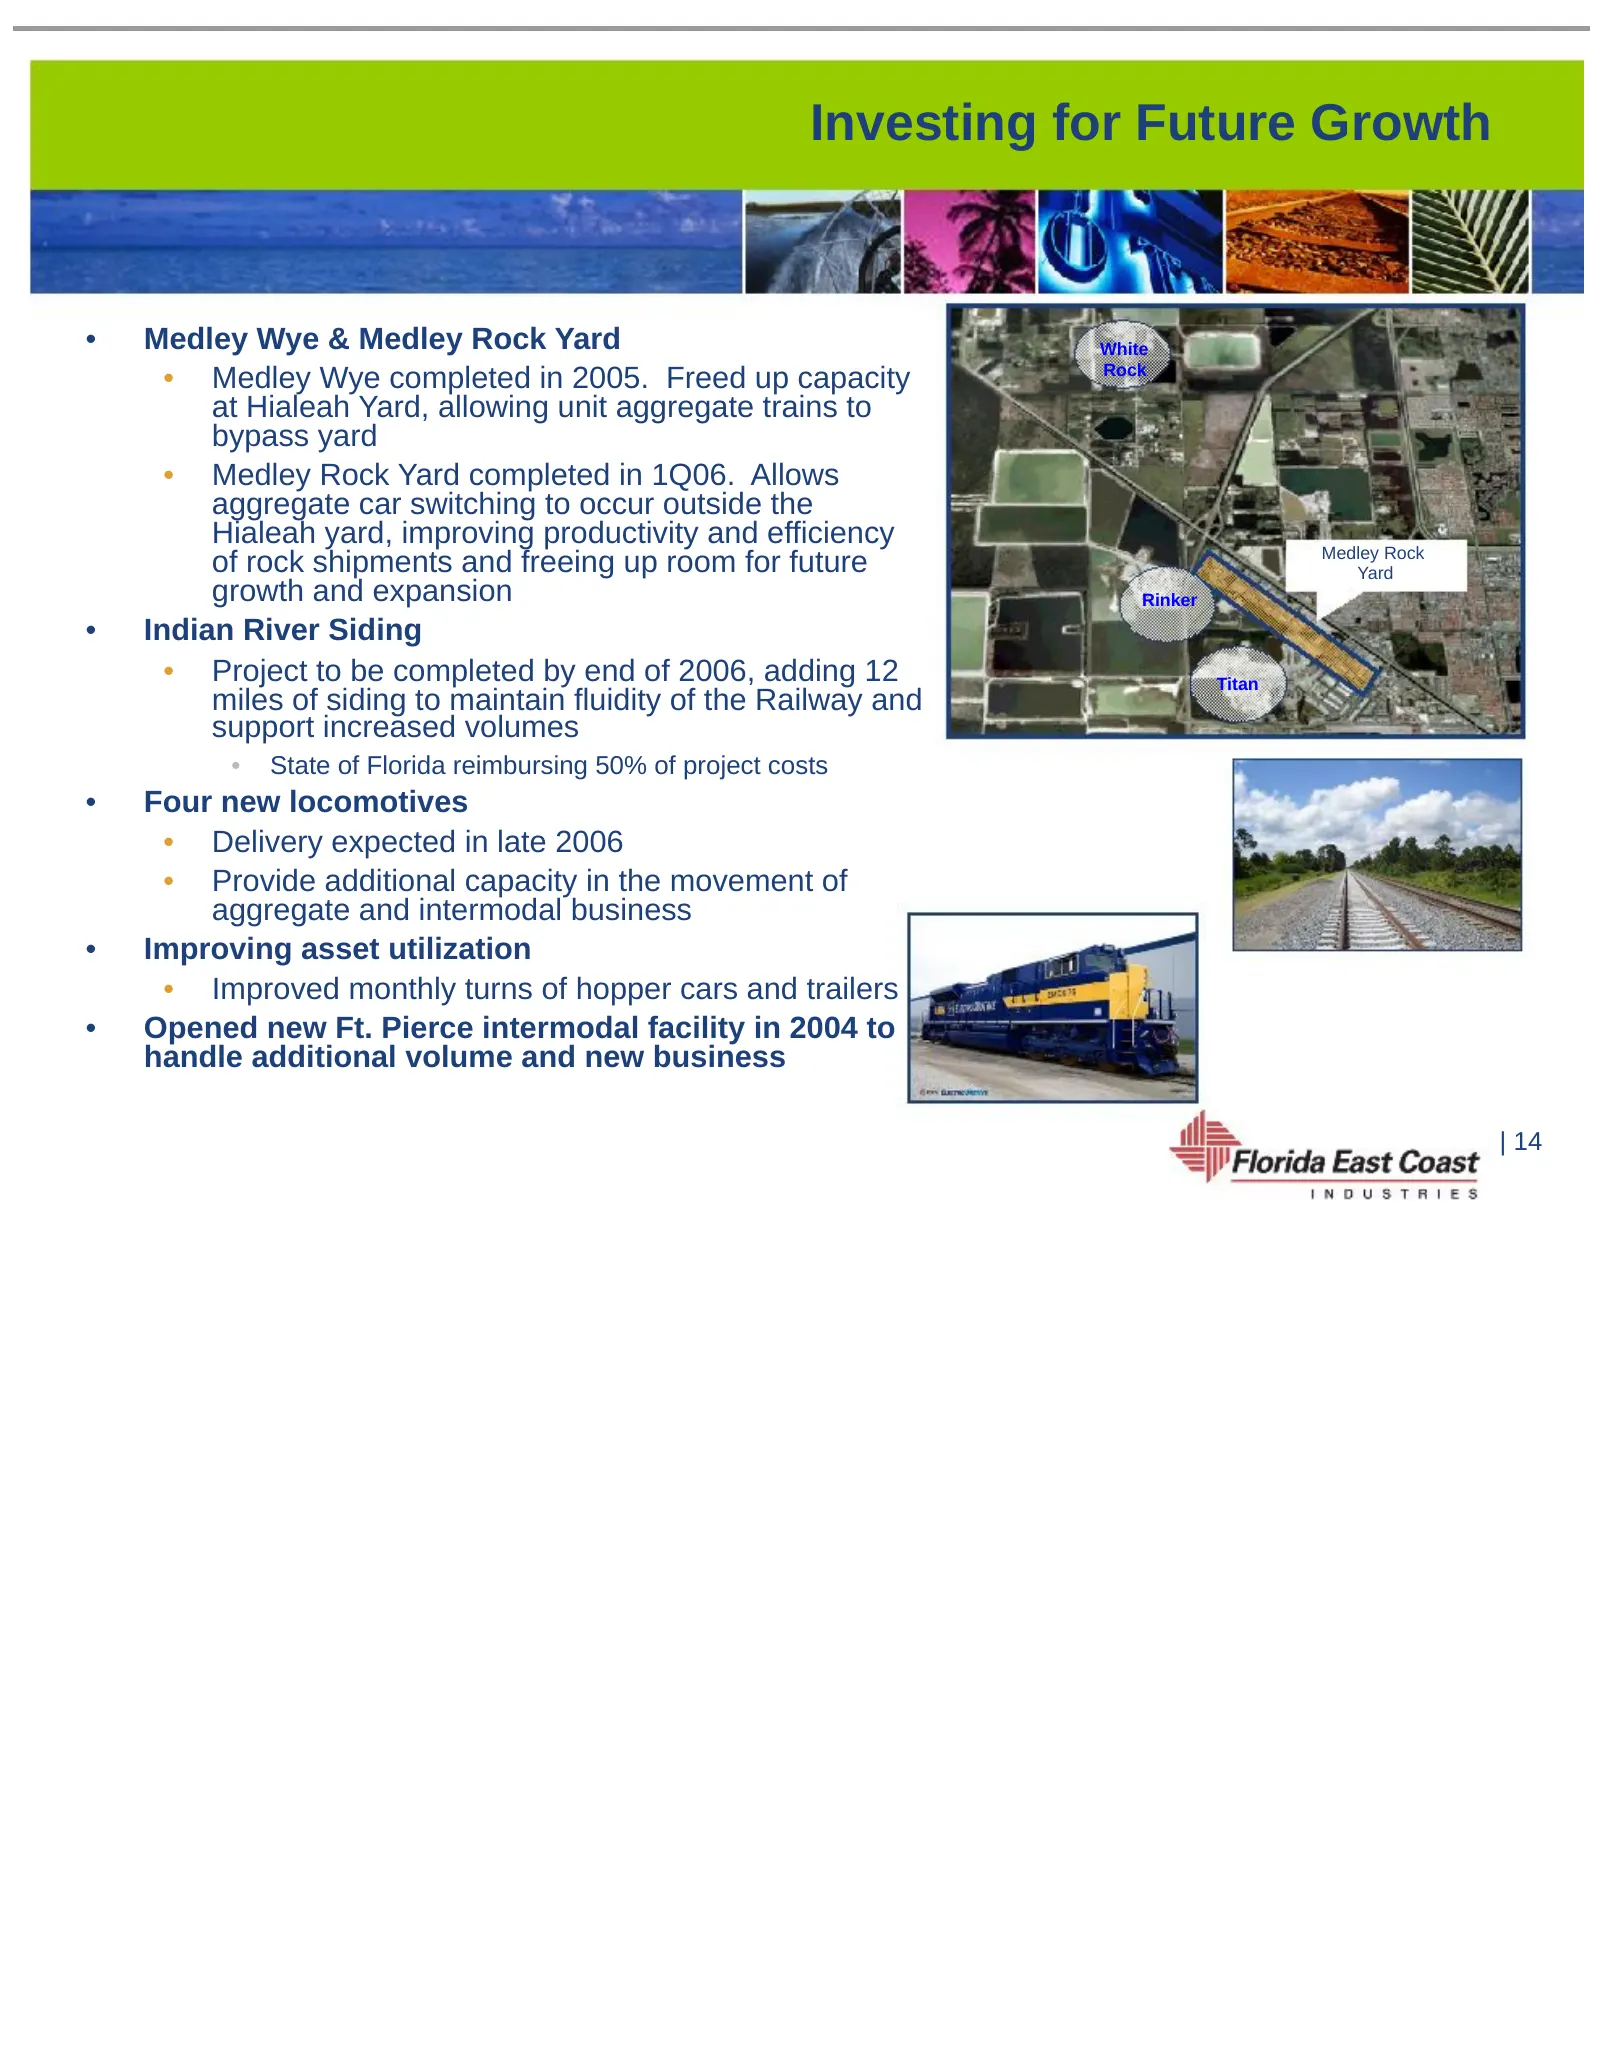
Investing for Future Growth • Medley Wye & Medley Rock Yard White • Medley Wye completed in 2005. Freed up capacity Rock at Hialeah Yard, allowing unit aggregate trains to bypass yard • Medley Rock Yard completed in 1Q06. Allows aggregate car switching to occur outside the Hialeah yard, improving pr
Slide 15: Real Estate – Flagler Development Group
Real Estate – Flagler Development Group | 15
Slide 16: Flagler Growth Drivers
Flagler Growth Drivers • Exceptional assets in Florida’s strongest markets – Jacksonville, Orlando/Lakeland and South Florida • Combined expertise will allow for management of projects from conception through completion • Consulting- Zoning and Entitlement • Development (Land and Building) – major i
Slide 17: Flagler has Exceptional Assets in Florida's Strongest Markets
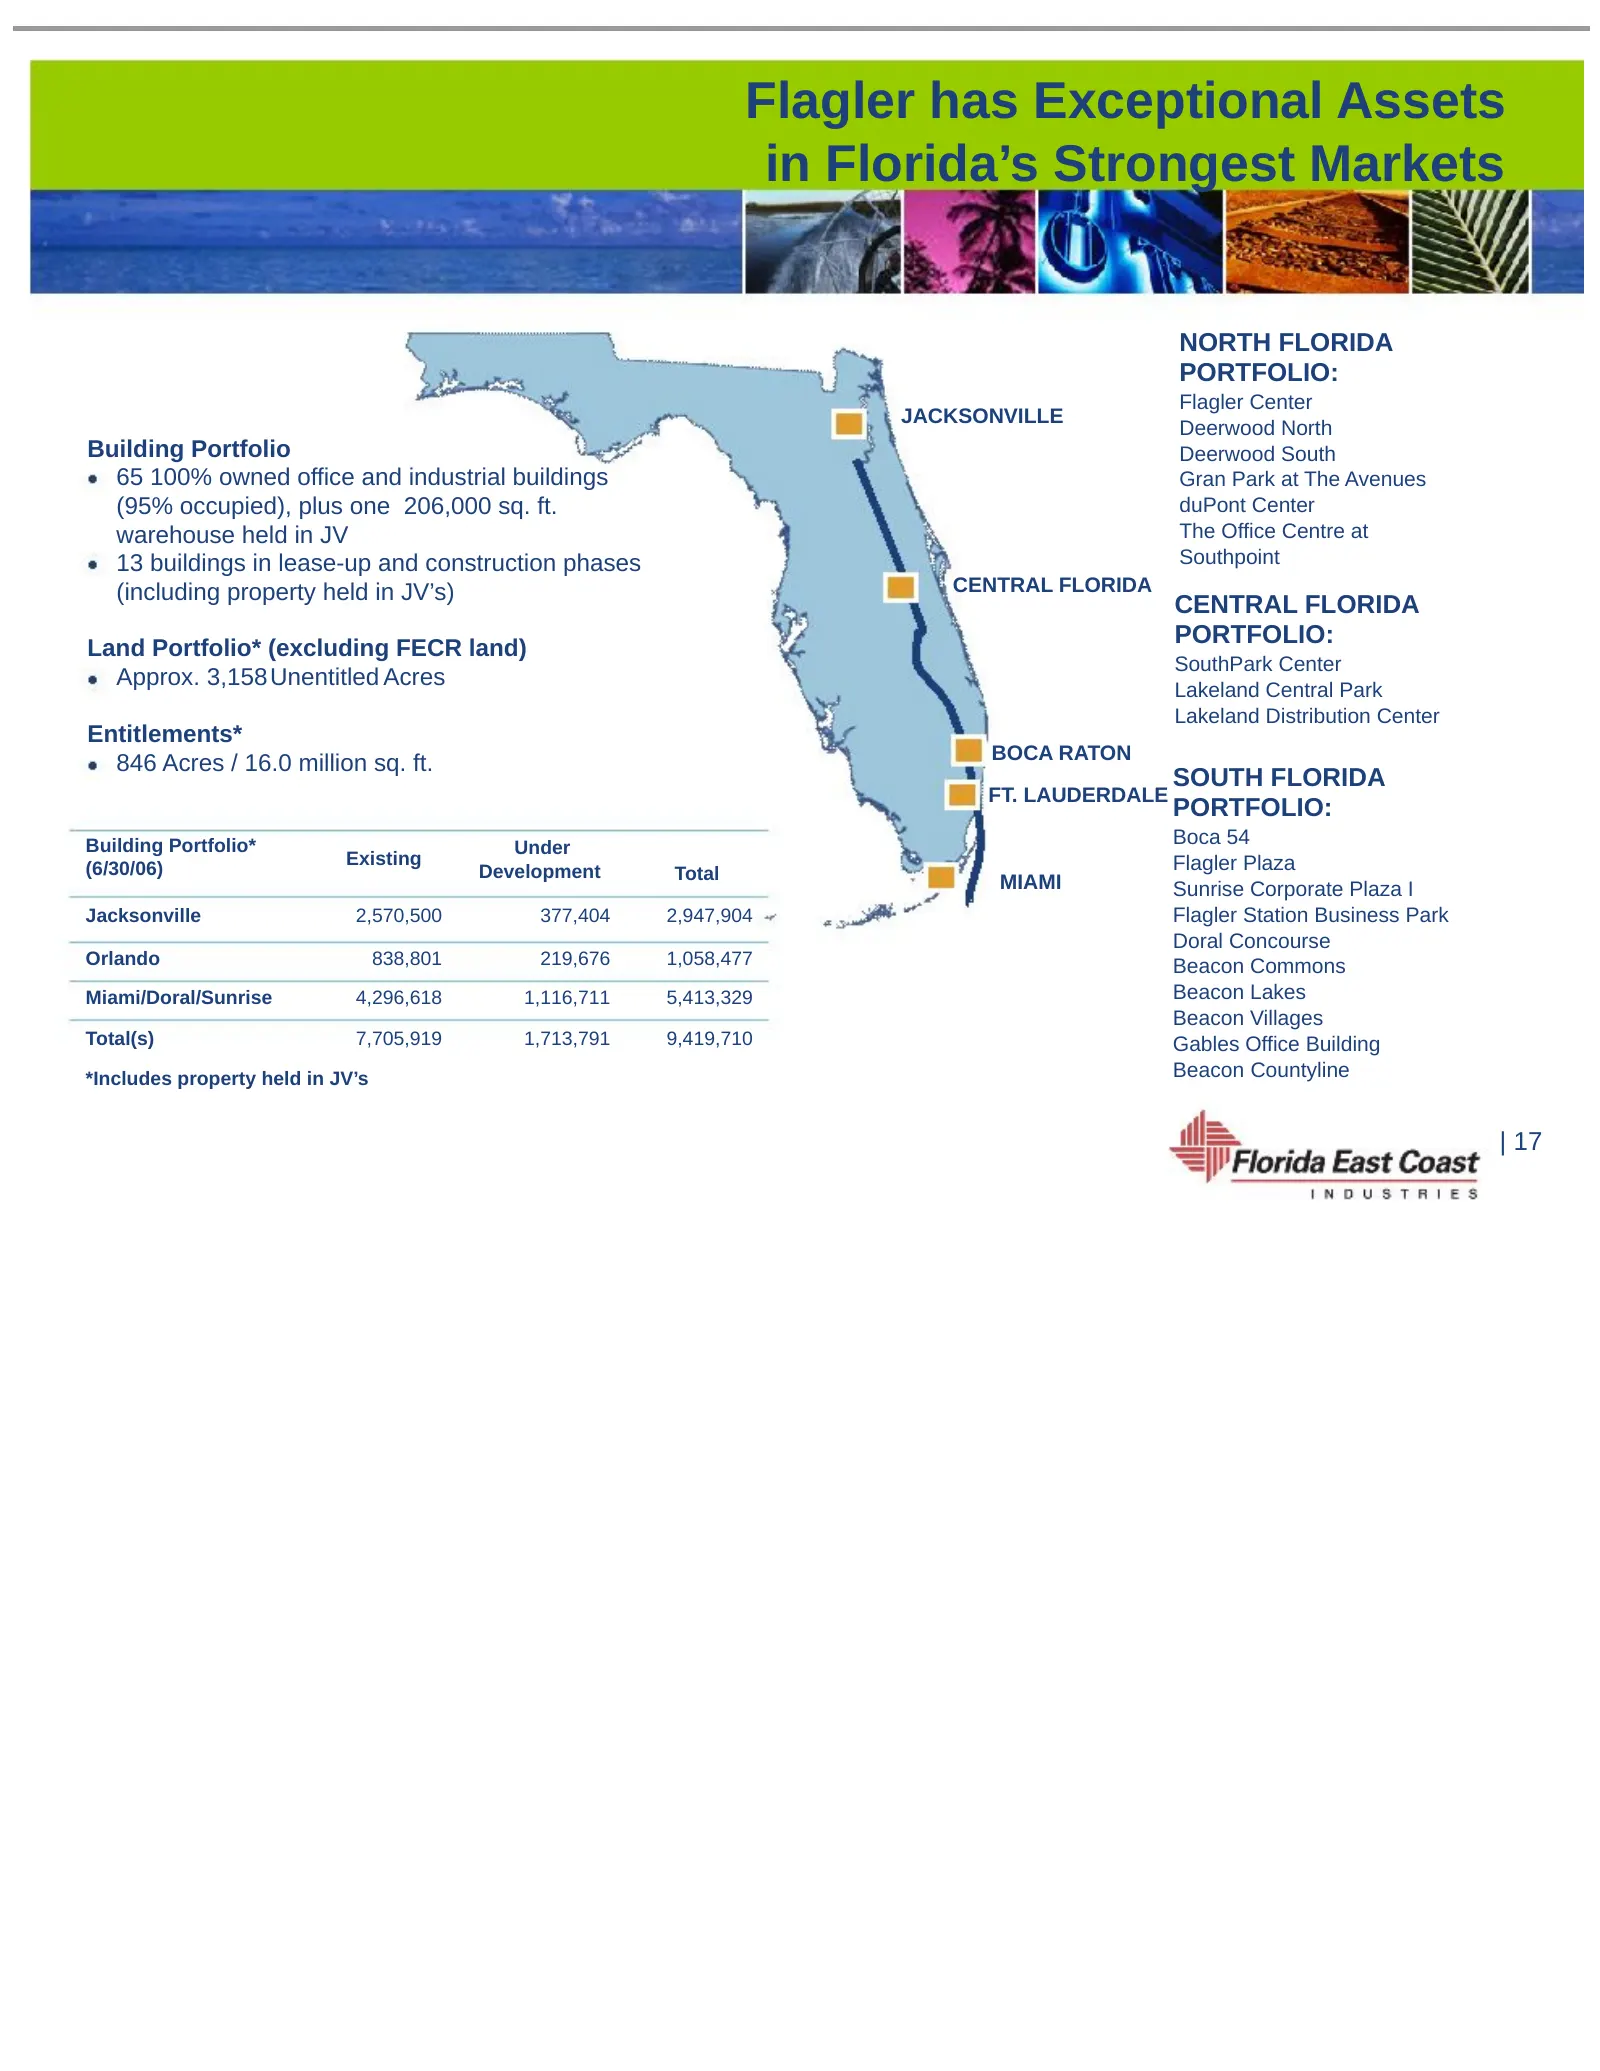
Flagler has Exceptional Assets in Florida’s Strongest Markets NORTH FLORIDA PORTFOLIO: Flagler Center JACKSONVILLE Deerwood North Building Portfolio Deerwood South 65 100% owned office and industrial buildings Gran Park at The Avenues (95% occupied), plus one 206,000 sq. ft. duPont Center warehouse
Slide 18: Flagler Development Group Key Financial Data
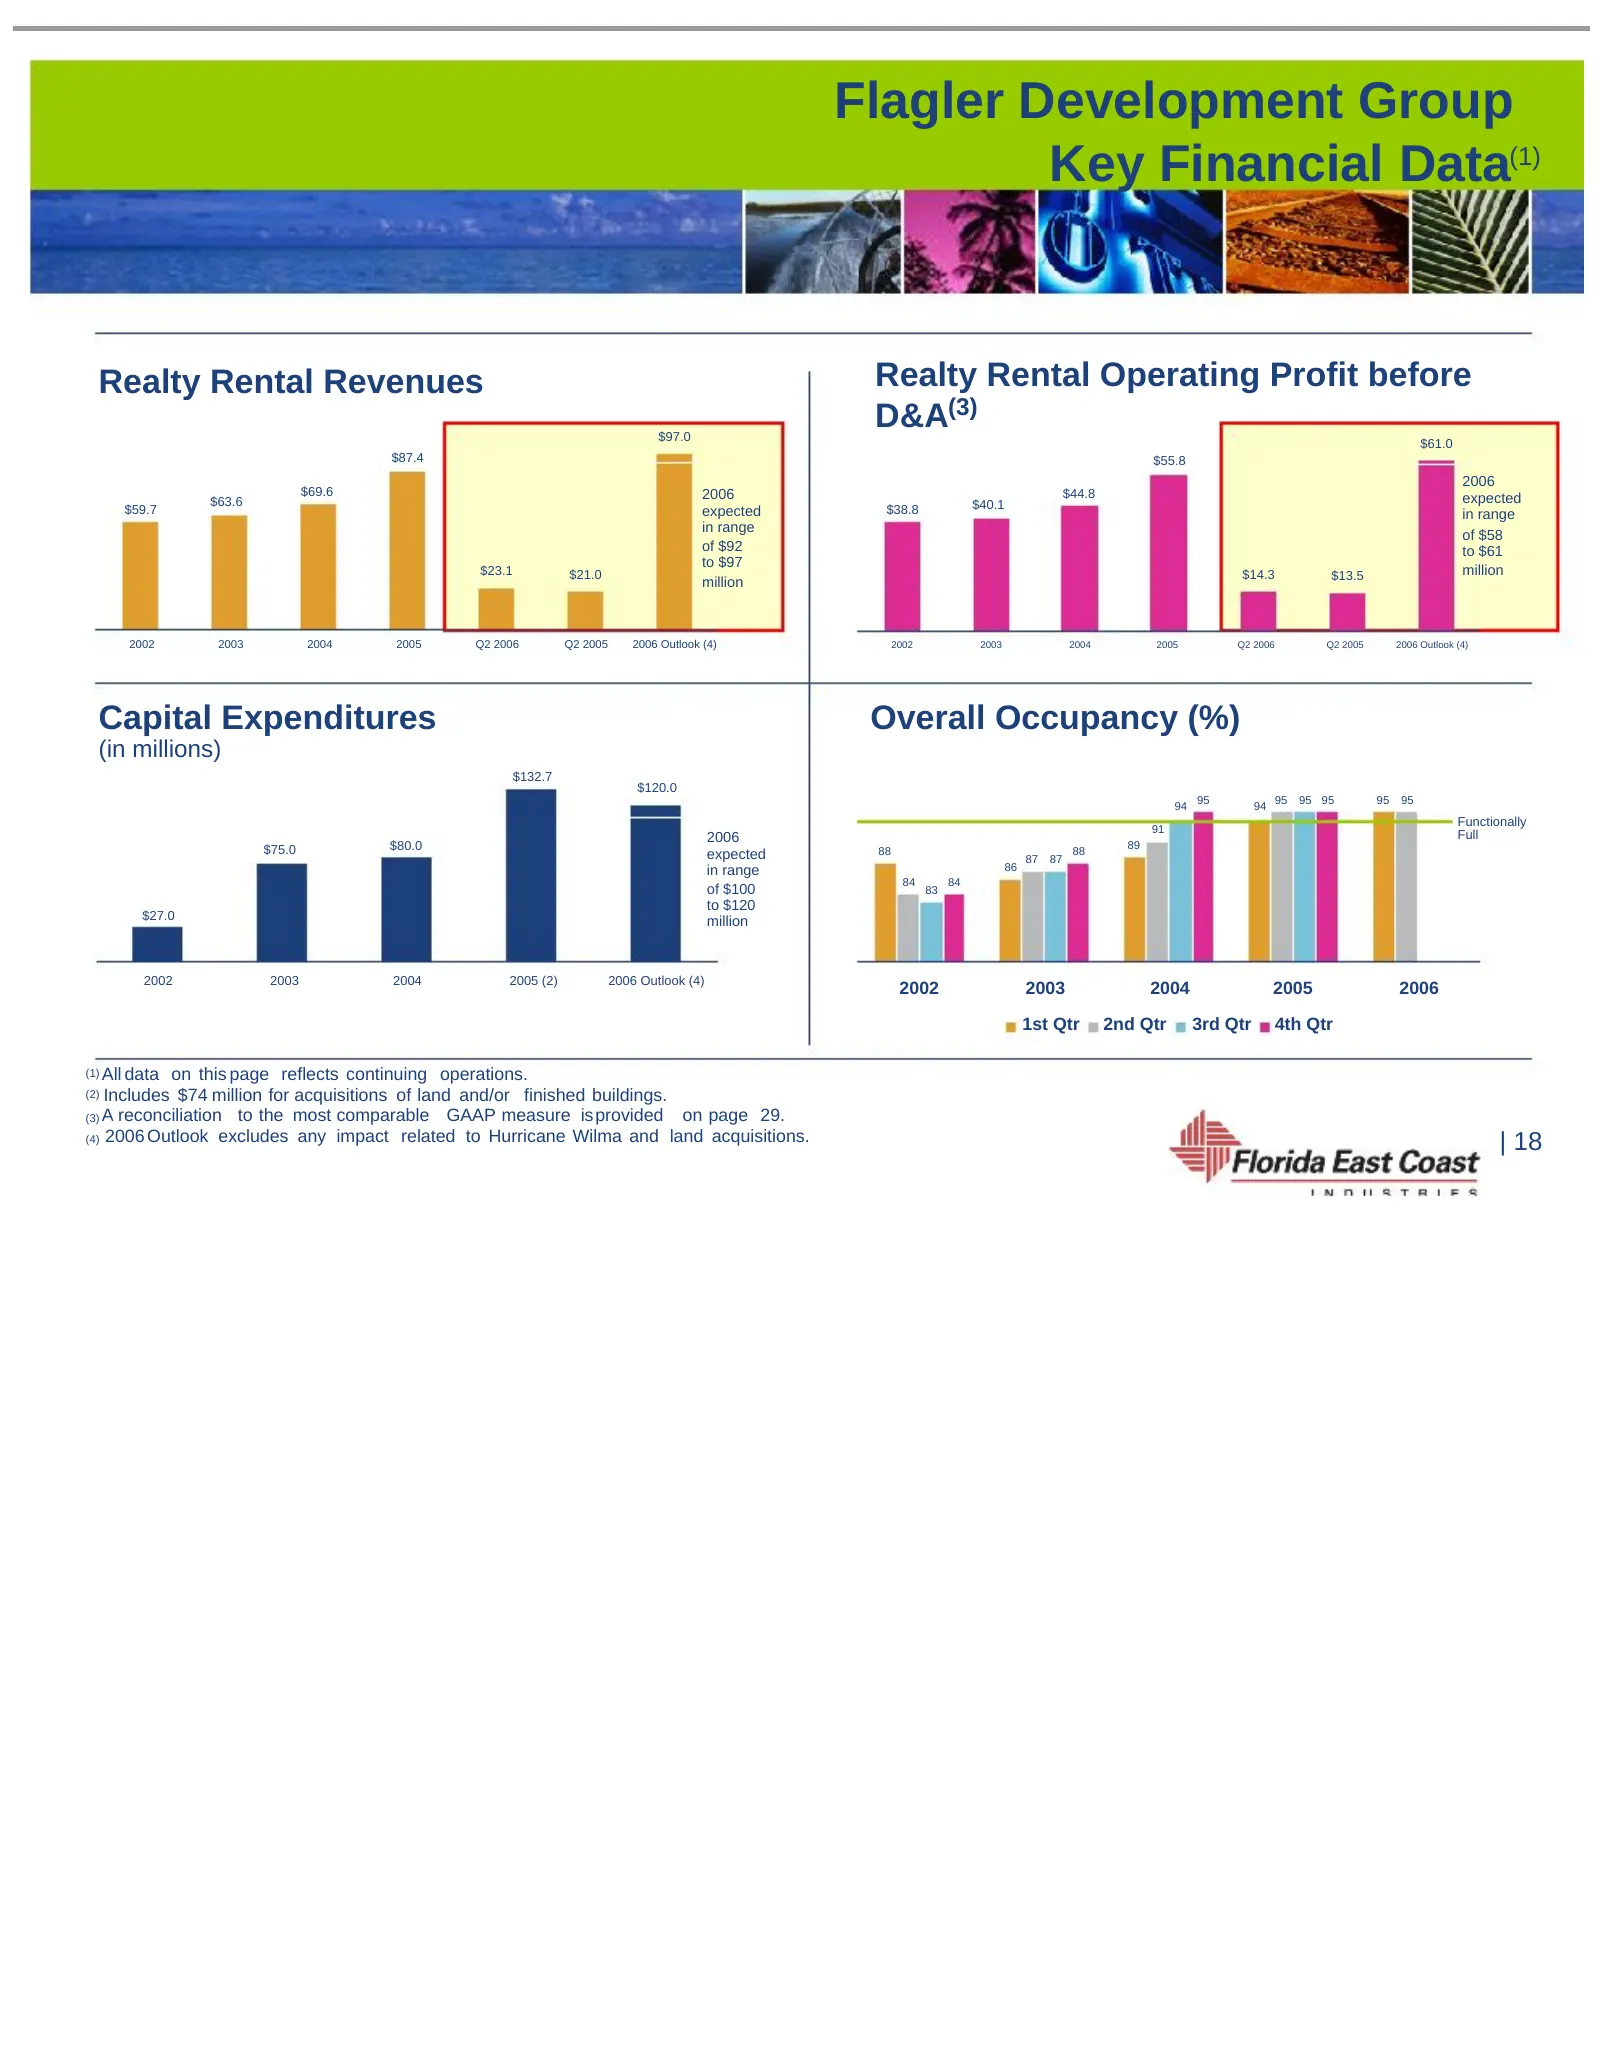
Flagler Development Group Key Financial Data(1) Realty Rental Revenues Realty Rental Operating Profit before $97.0 D&A(3) $61.0 $87.4 $55.8 2006 $69.6 2006 $44.8 $63.6 $40.1 expected $59.7 expected $38.8 in range in range of $58 of $92 to $61 to $97 $23.1 $21.0 $14.3 $13.5 million million 2002 2003
Slide 19: South Florida Industrial Market Historical Overview
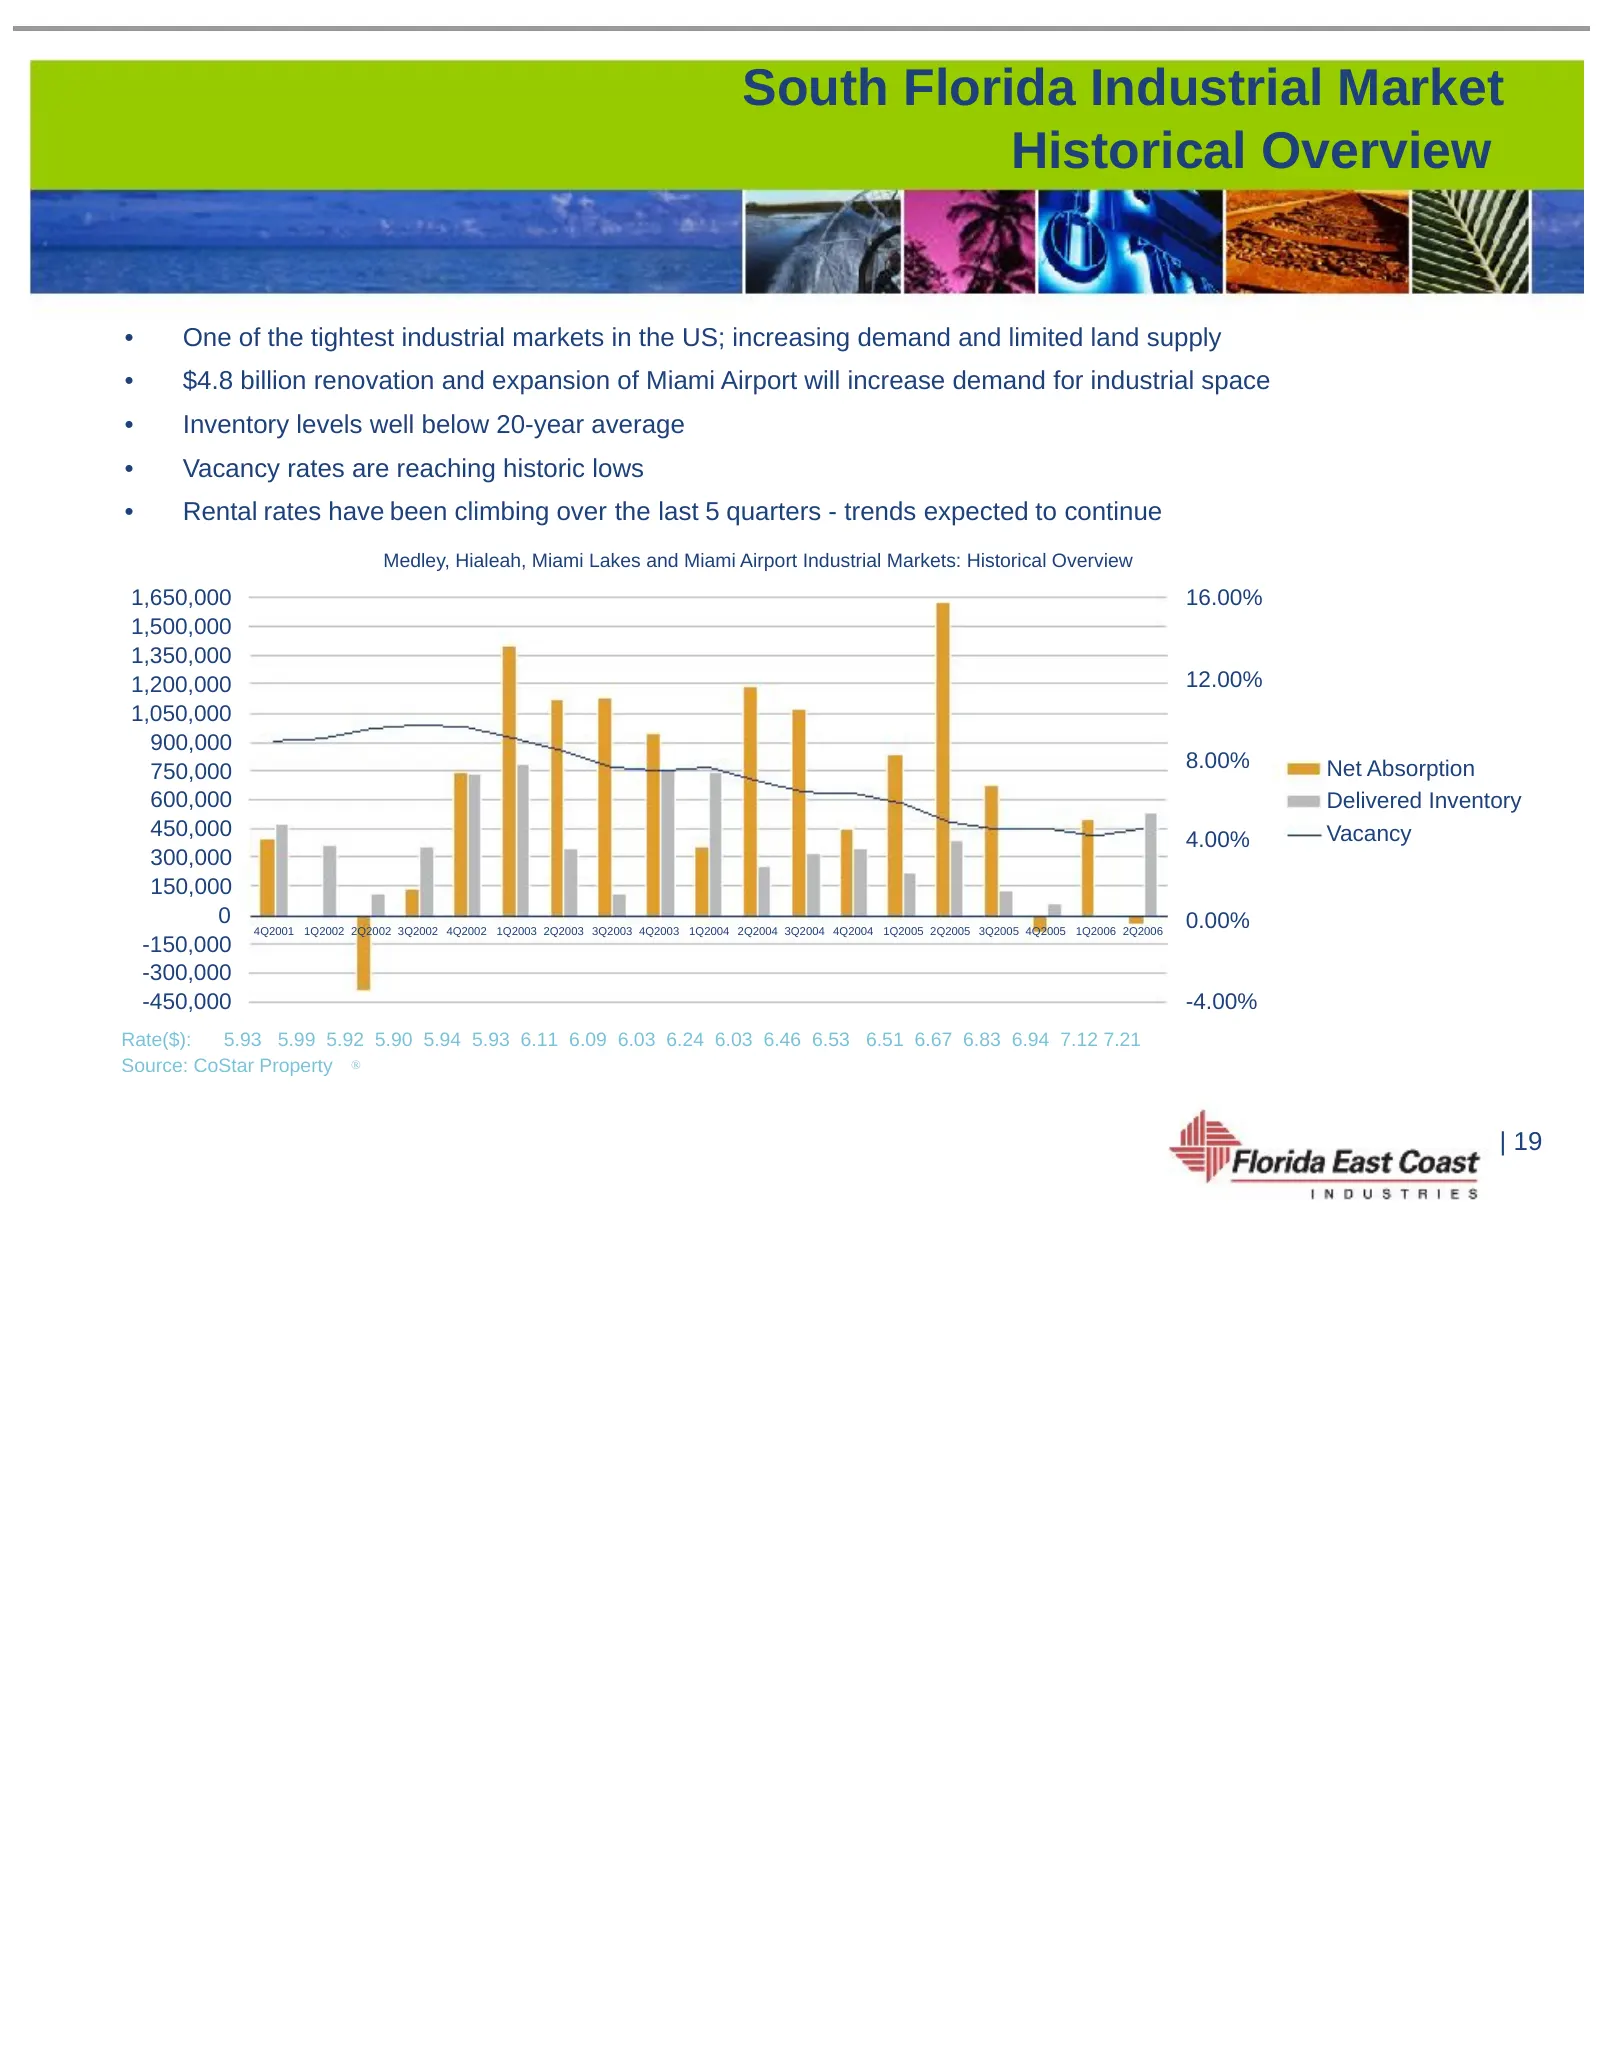
South Florida Industrial Market Historical Overview • One of the tightest industrial markets in the US; increasing demand and limited land supply • $4.8 billion renovation and expansion of Miami Airport will increase demand for industrial space • Inventory levels well below 20-year average • Vacancy
Slide 20: South Florida Office Market Historical Overview
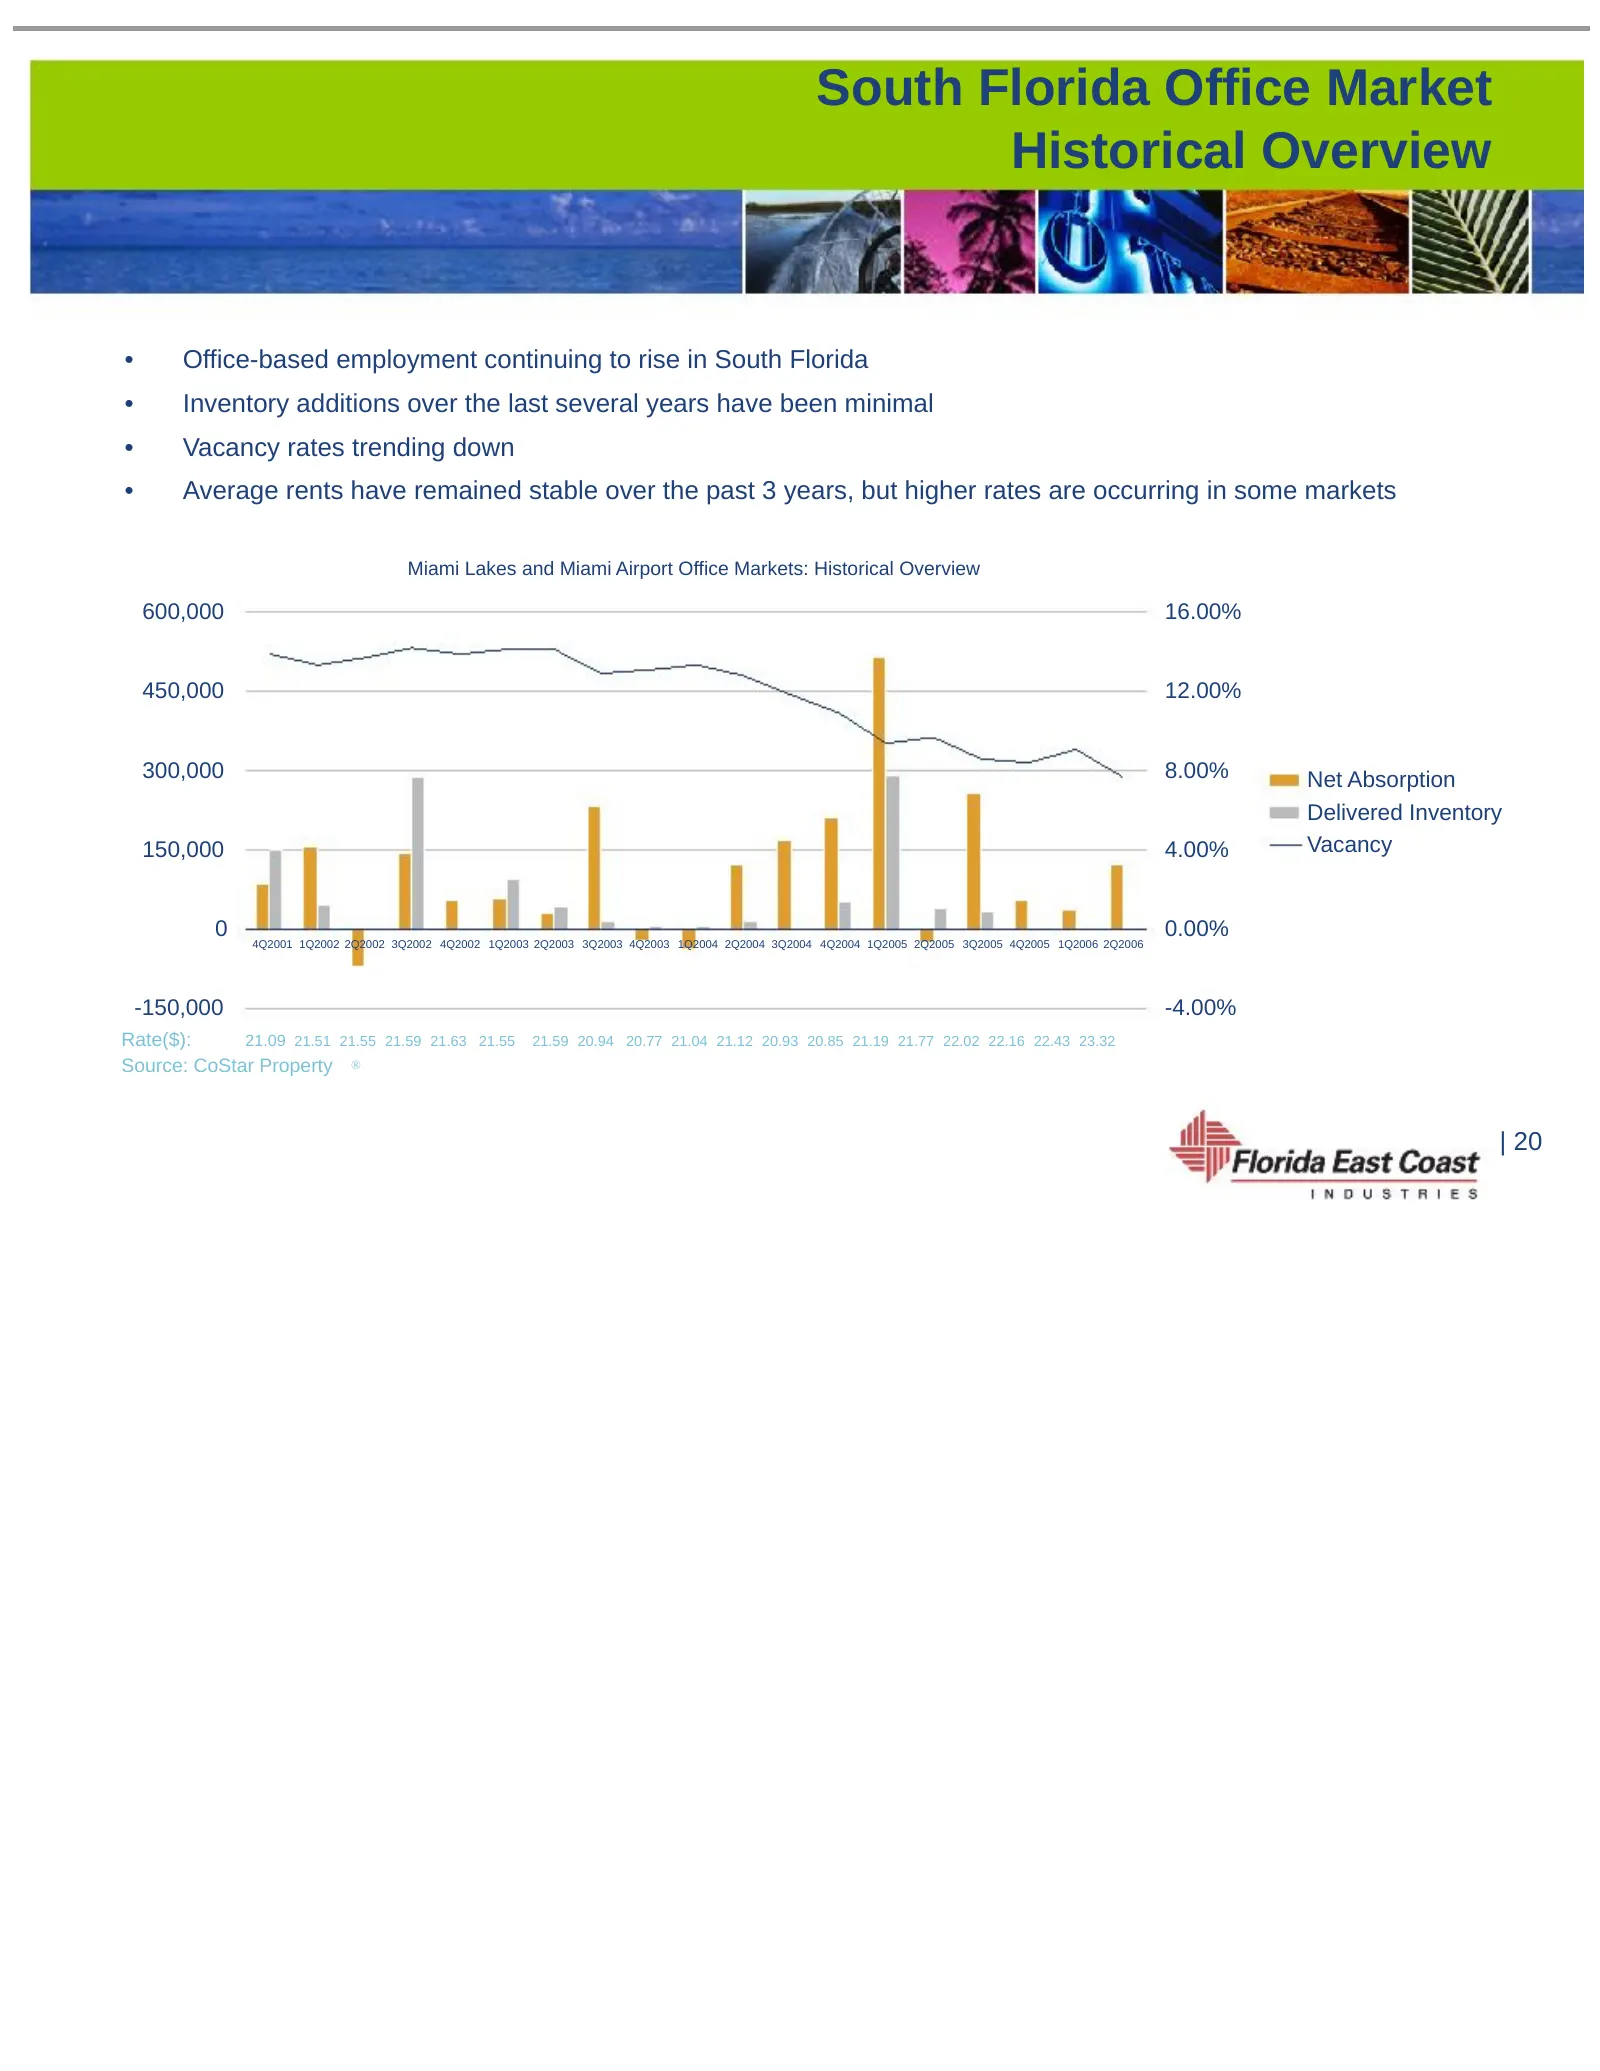
South Florida Office Market Historical Overview • Office-based employment continuing to rise in South Florida • Inventory additions over the last several years have been minimal • Vacancy rates trending down • Average rents have remained stable over the past 3 years, but higher rates are occurring i
Slide 21: Flagler Assets in South Florida
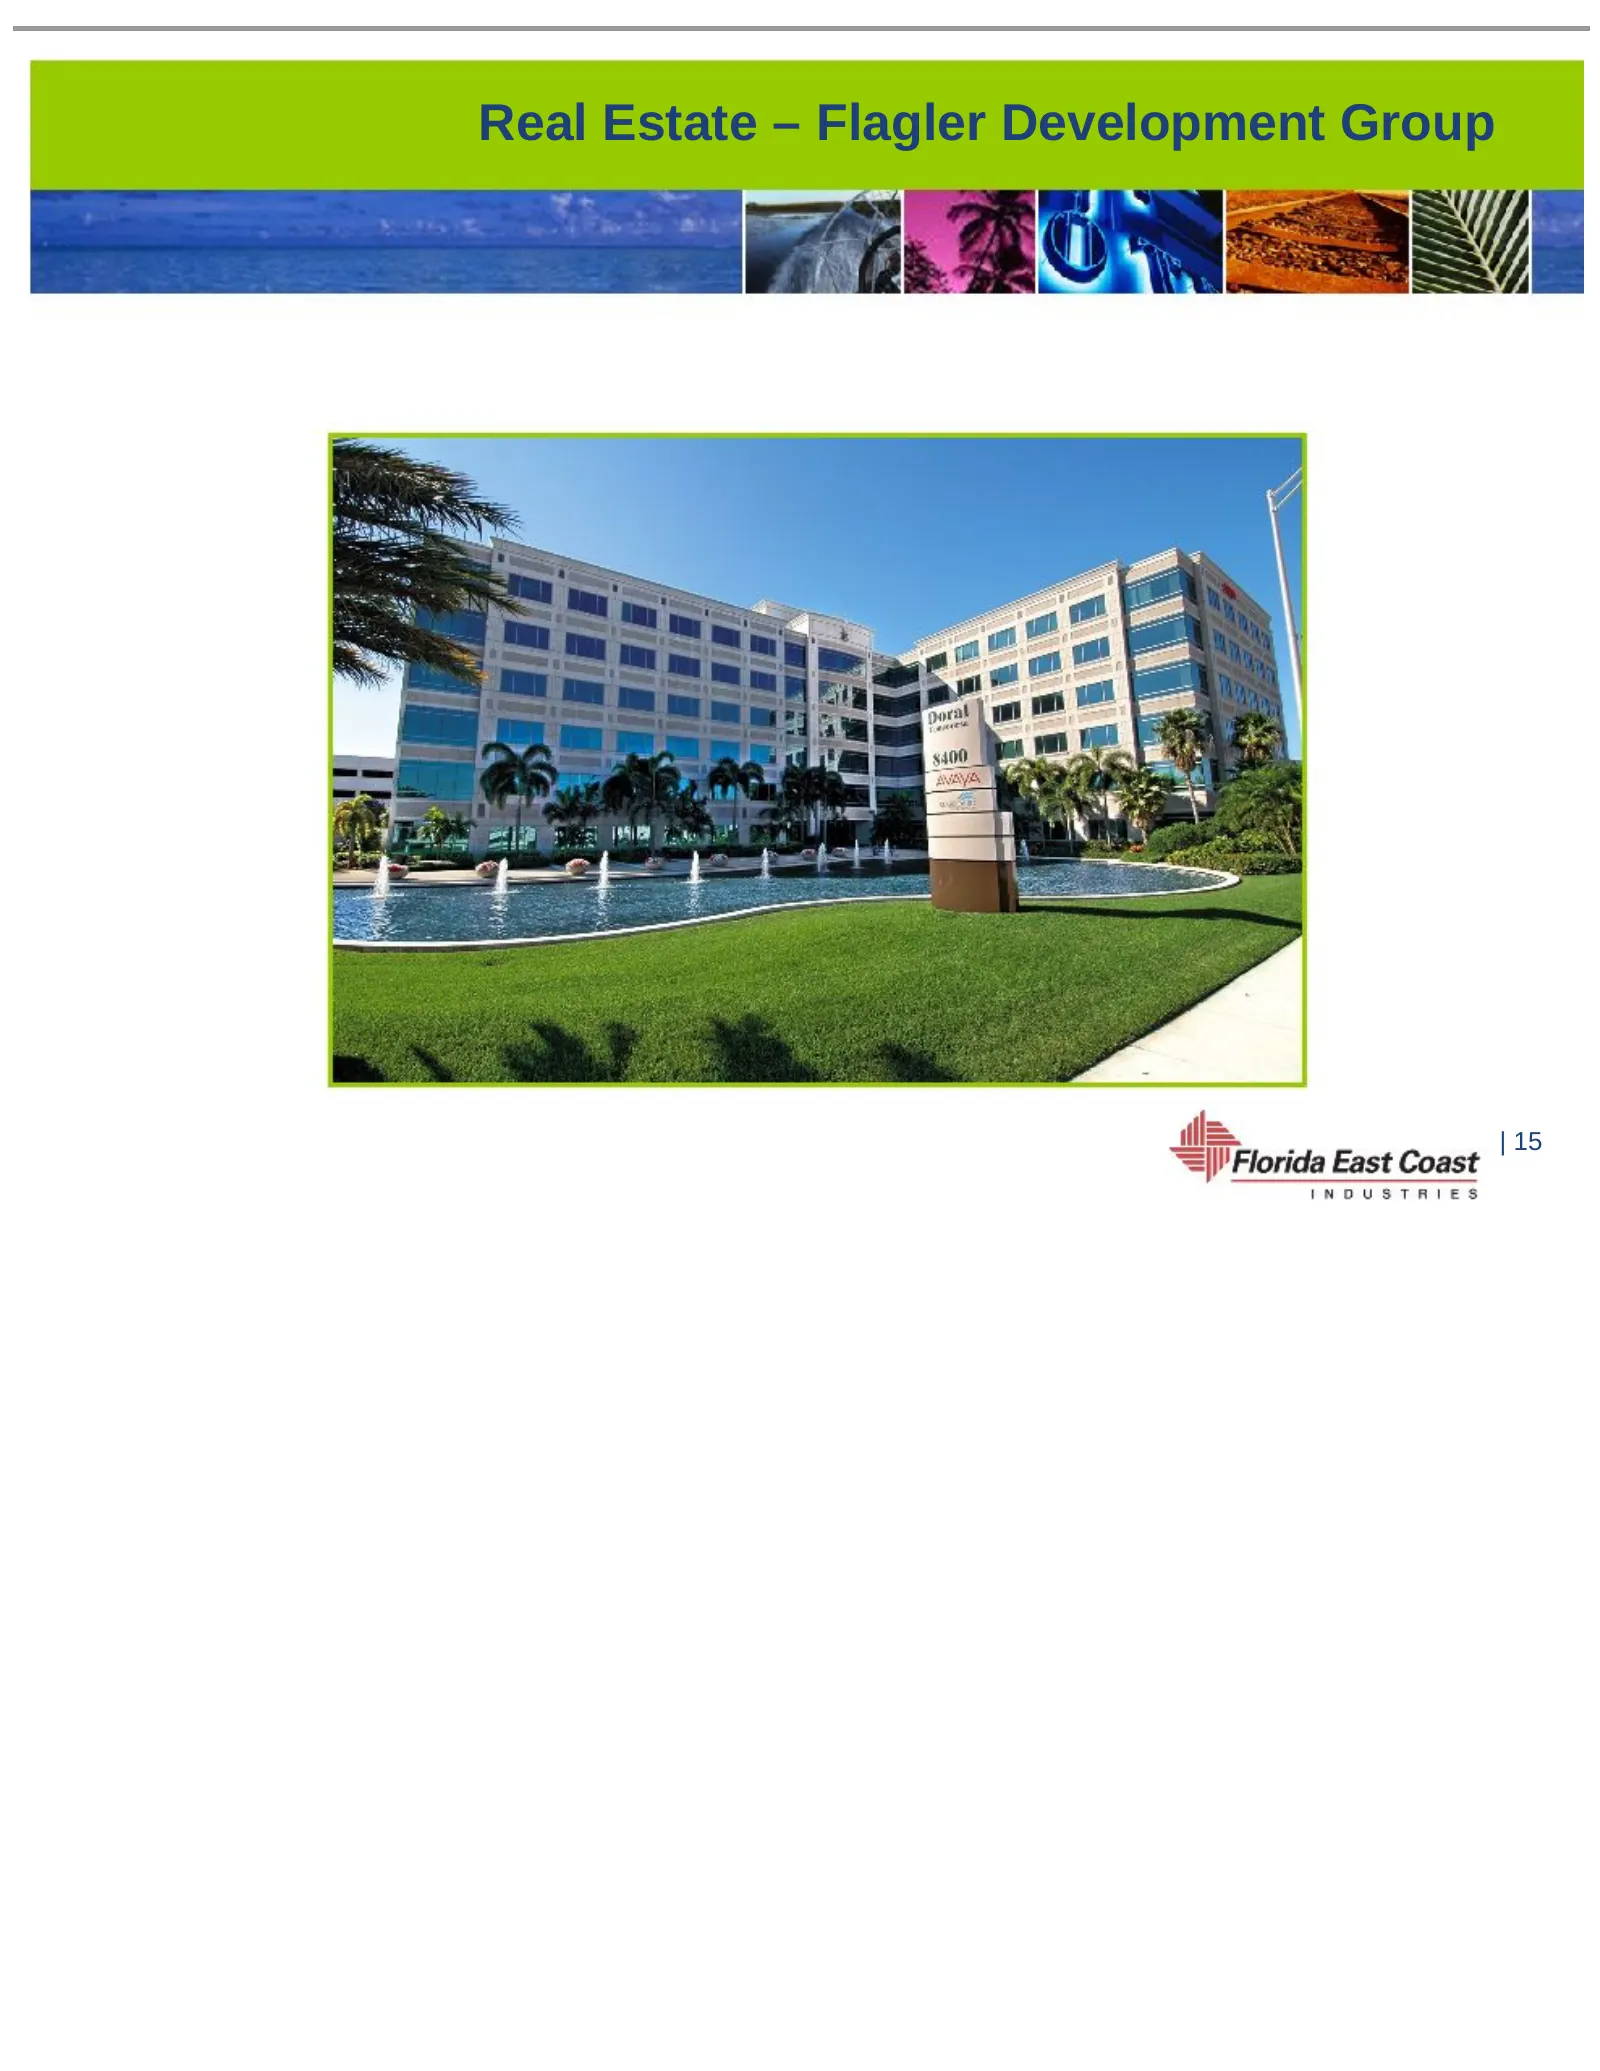
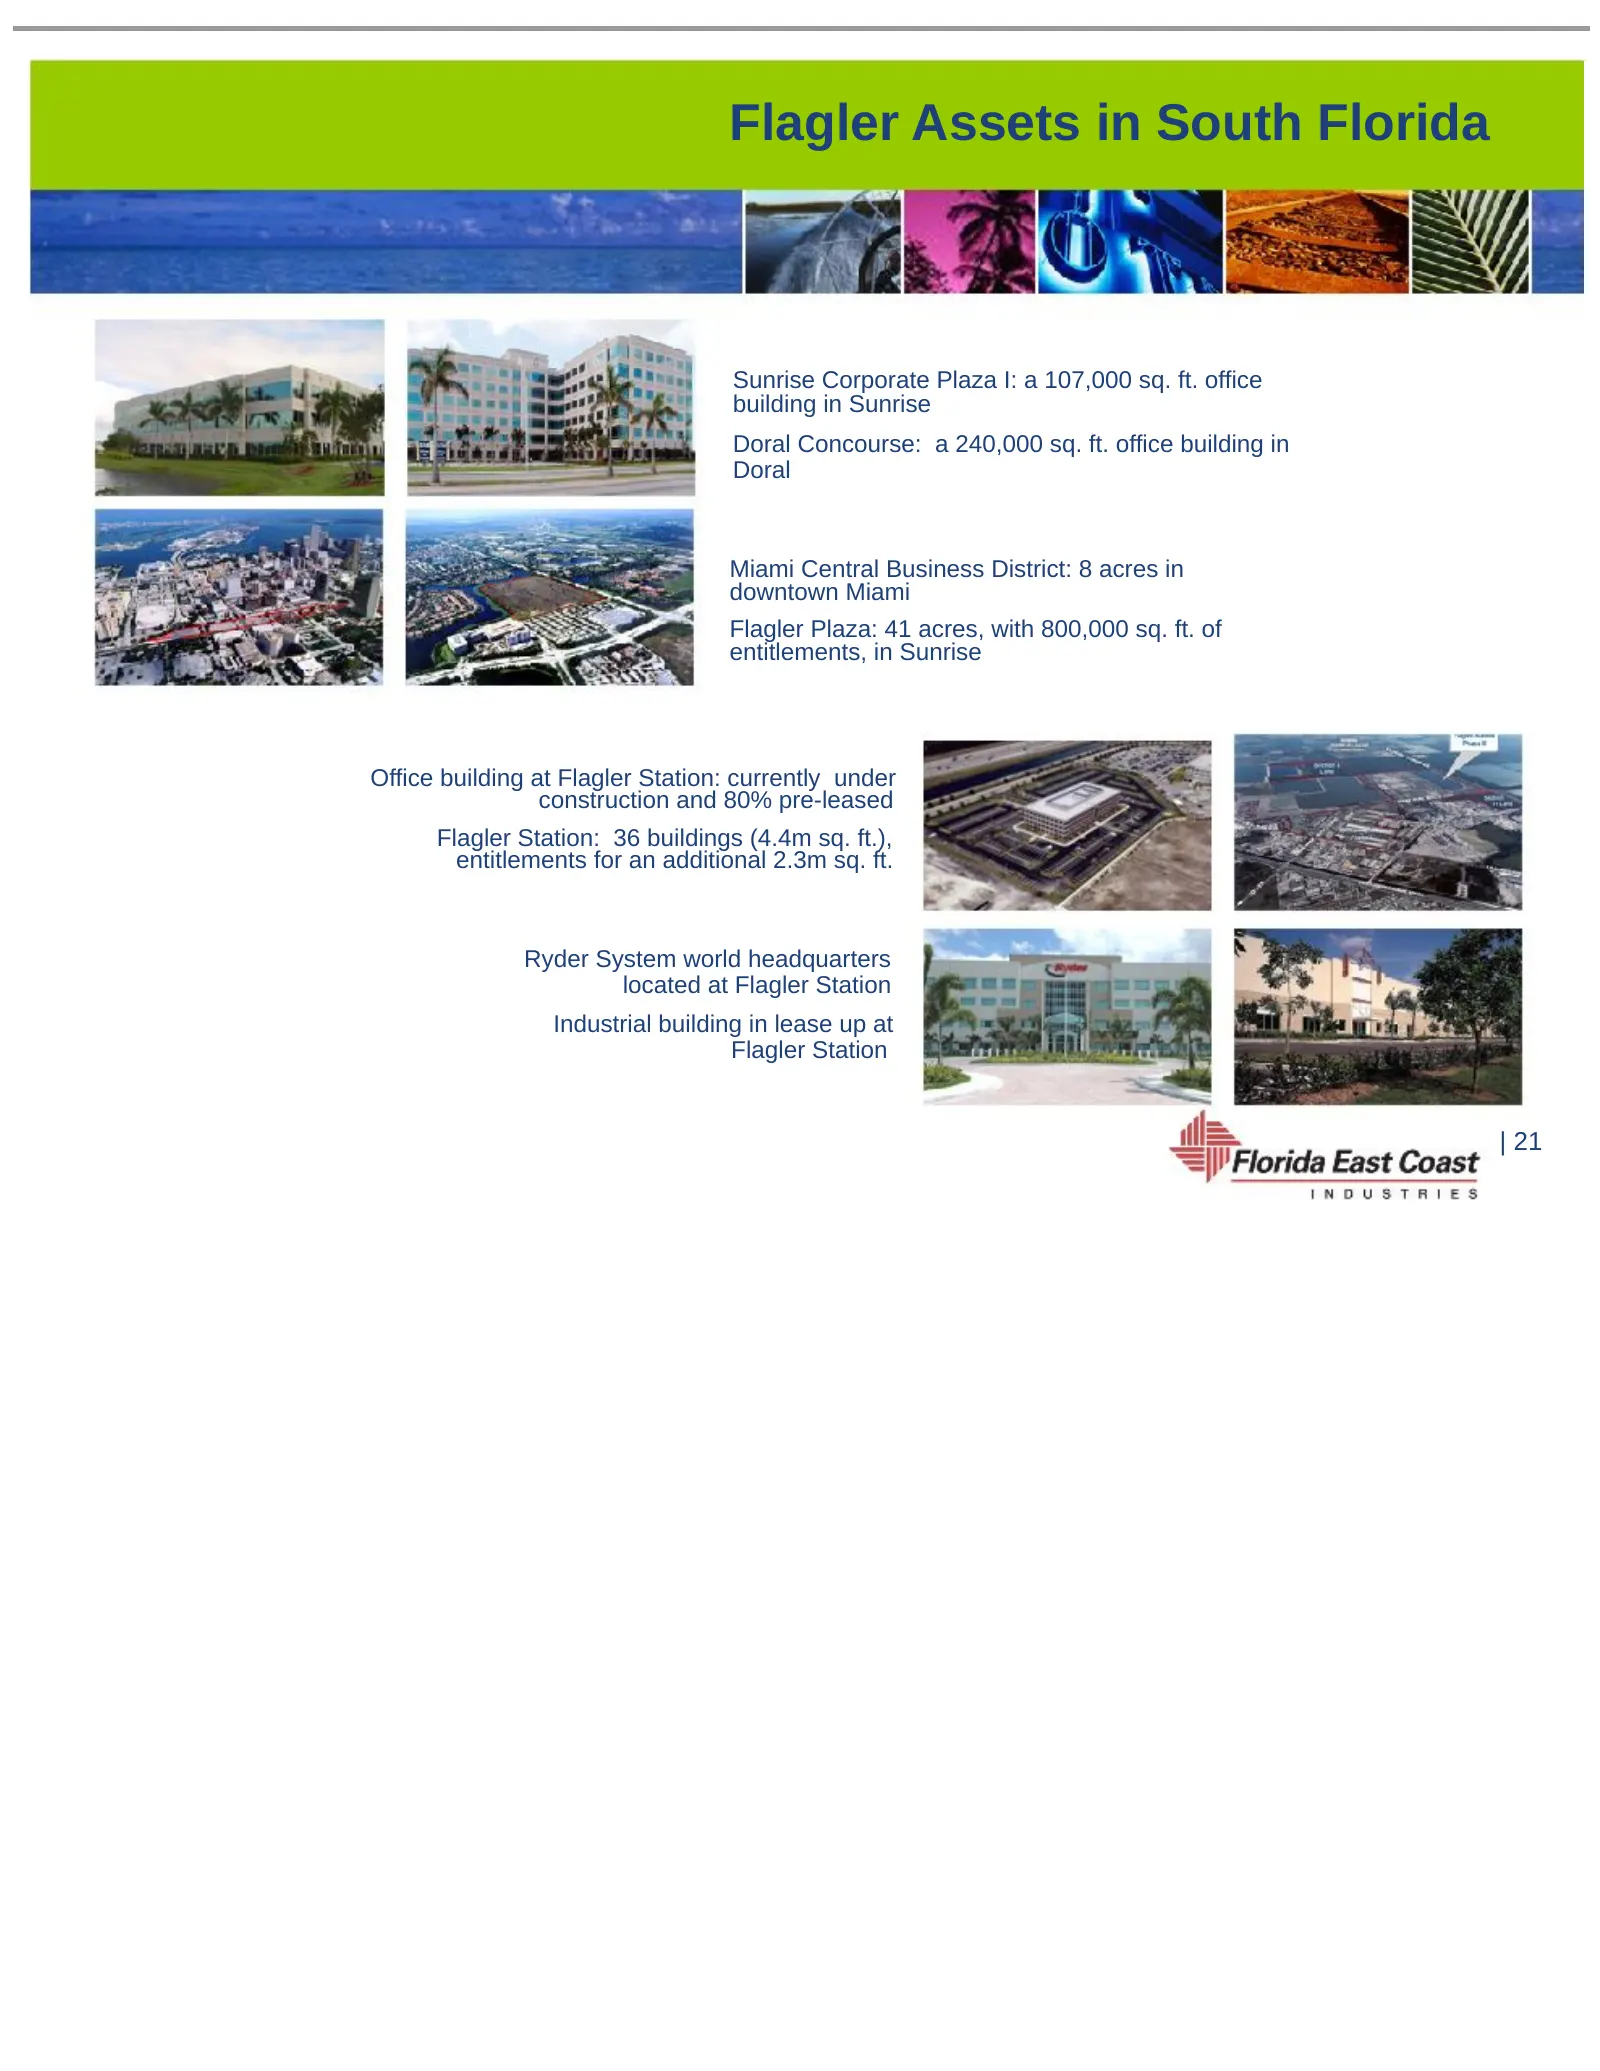
Flagler Assets in South Florida Sunrise Corporate Plaza I: a 107,000 sq. ft. office building in Sunrise Doral Concourse: a 240,000 sq. ft. office building in Doral Miami Central Business District: 8 acres in downtown Miami Flagler Plaza: 41 acres, with 800,000 sq. ft. of entitlements, in Sunrise Off
Slide 22: Acquired Codina Assets in South Florida
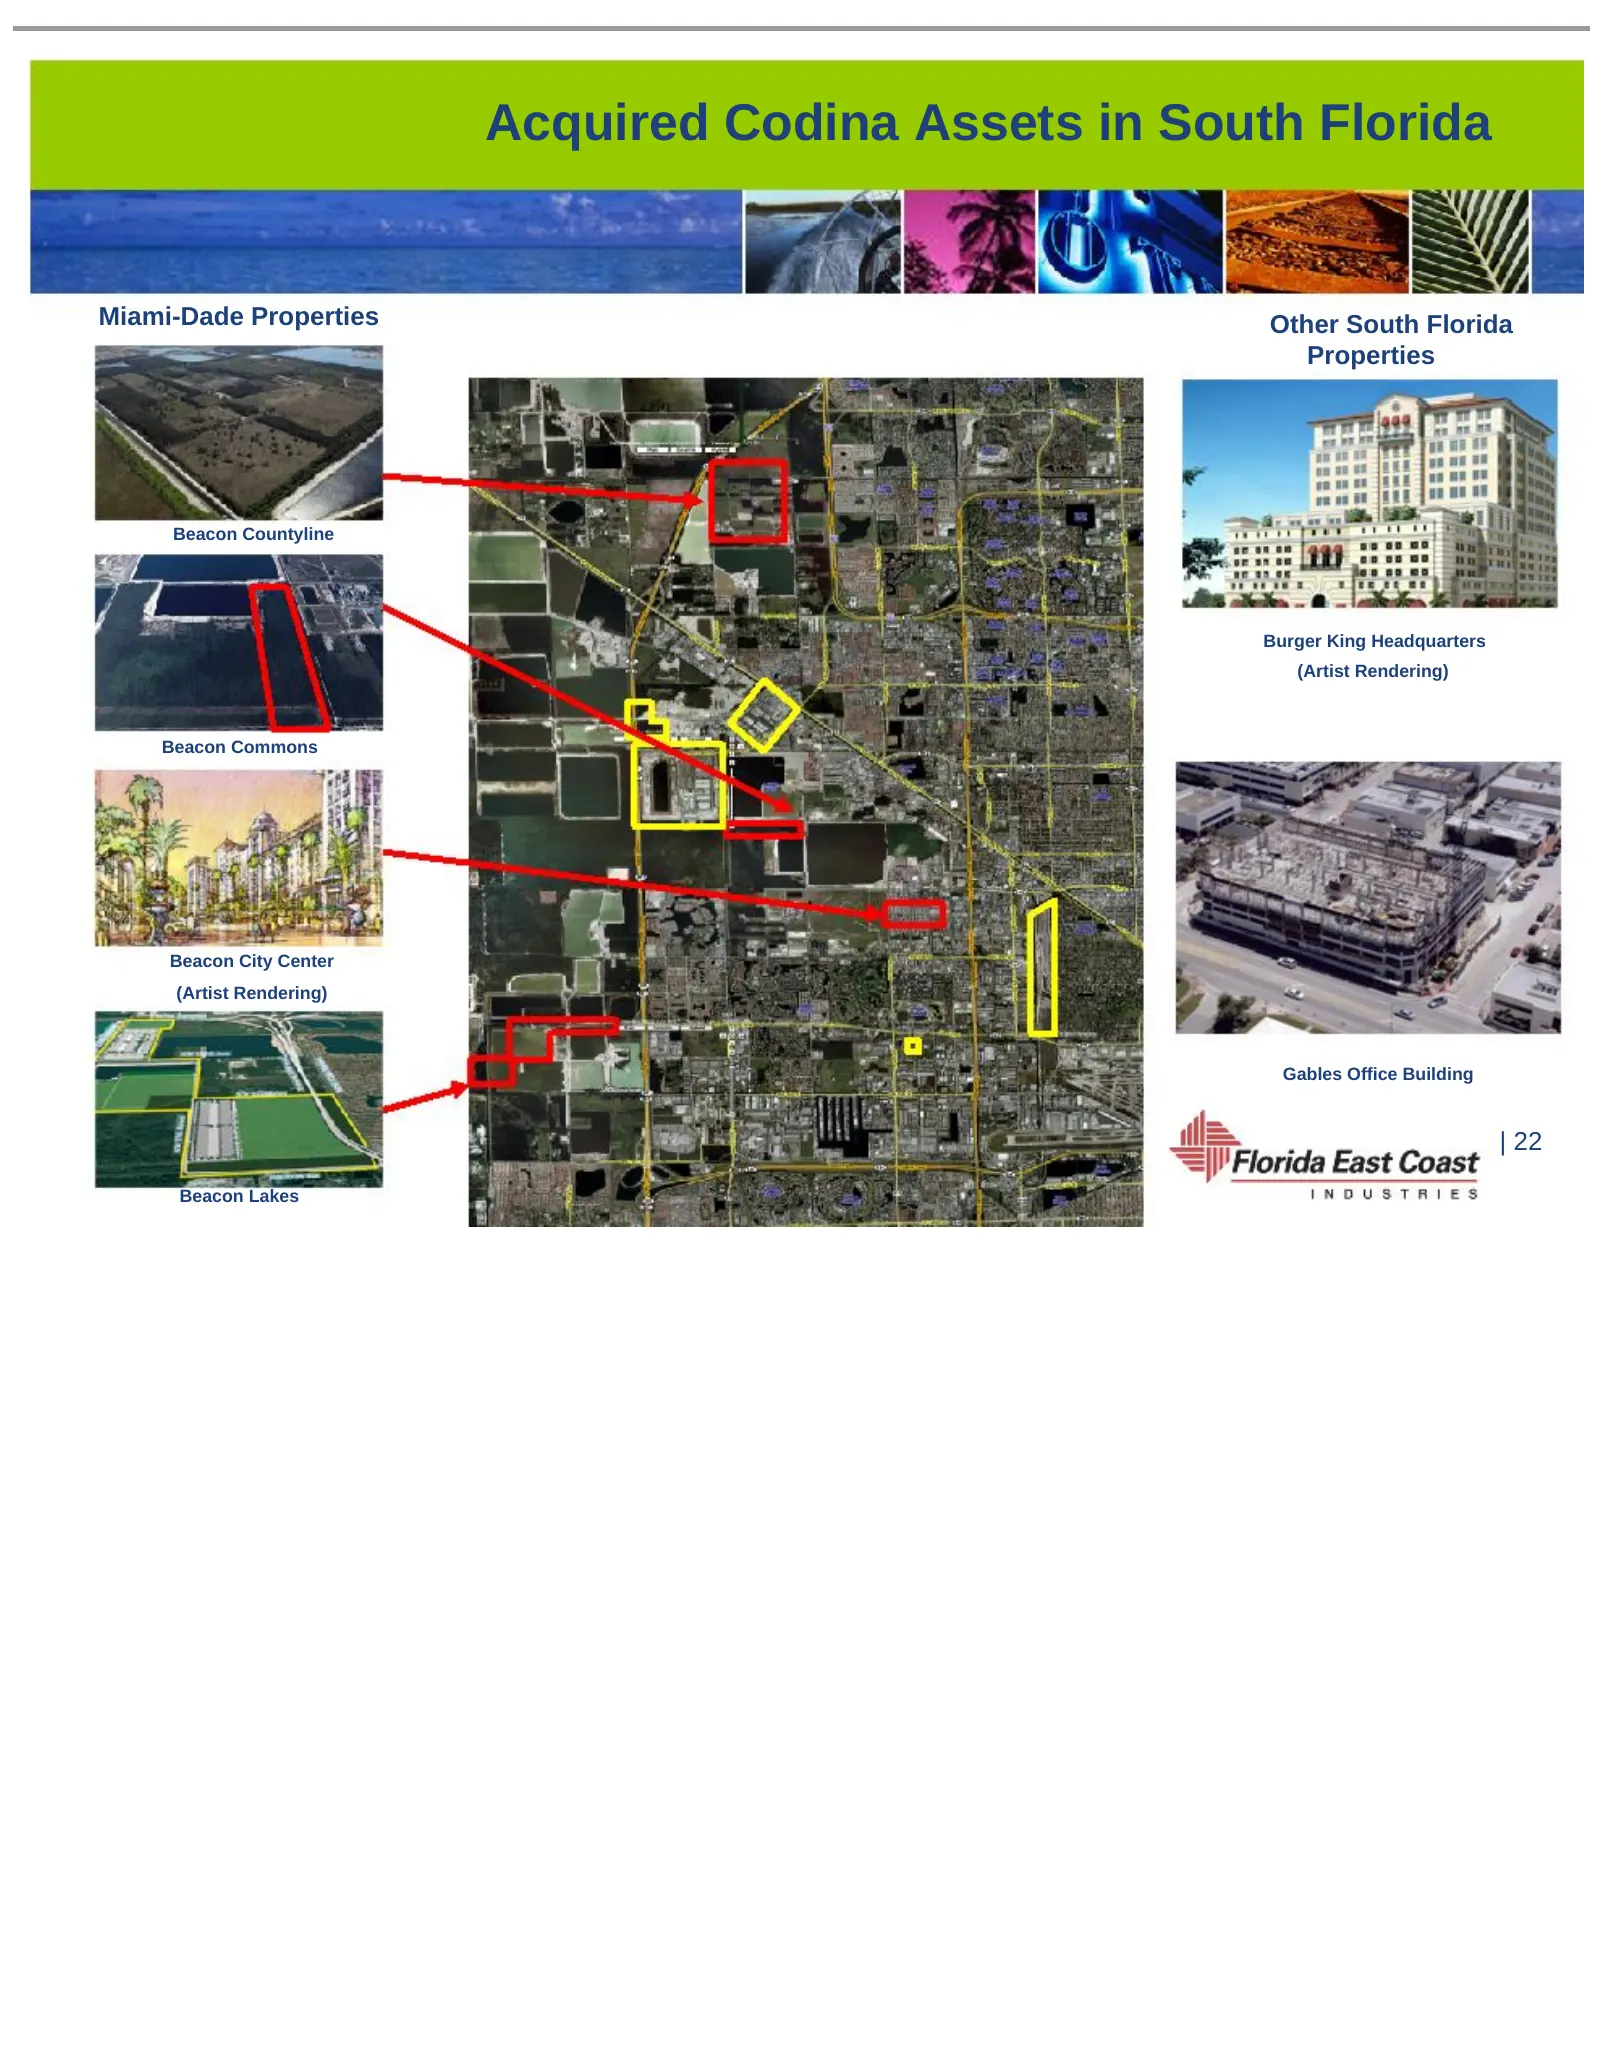
Acquired Codina Assets in South Florida Miami-Dade Properties Other South Florida Properties Beacon Countyline Burger King Headquarters (Artist Rendering) Beacon Commons Beacon City Center (Artist Rendering) Gables Office Building | 22 Beacon Lakes
Slide 23: Orlando Office Market Historical Overview
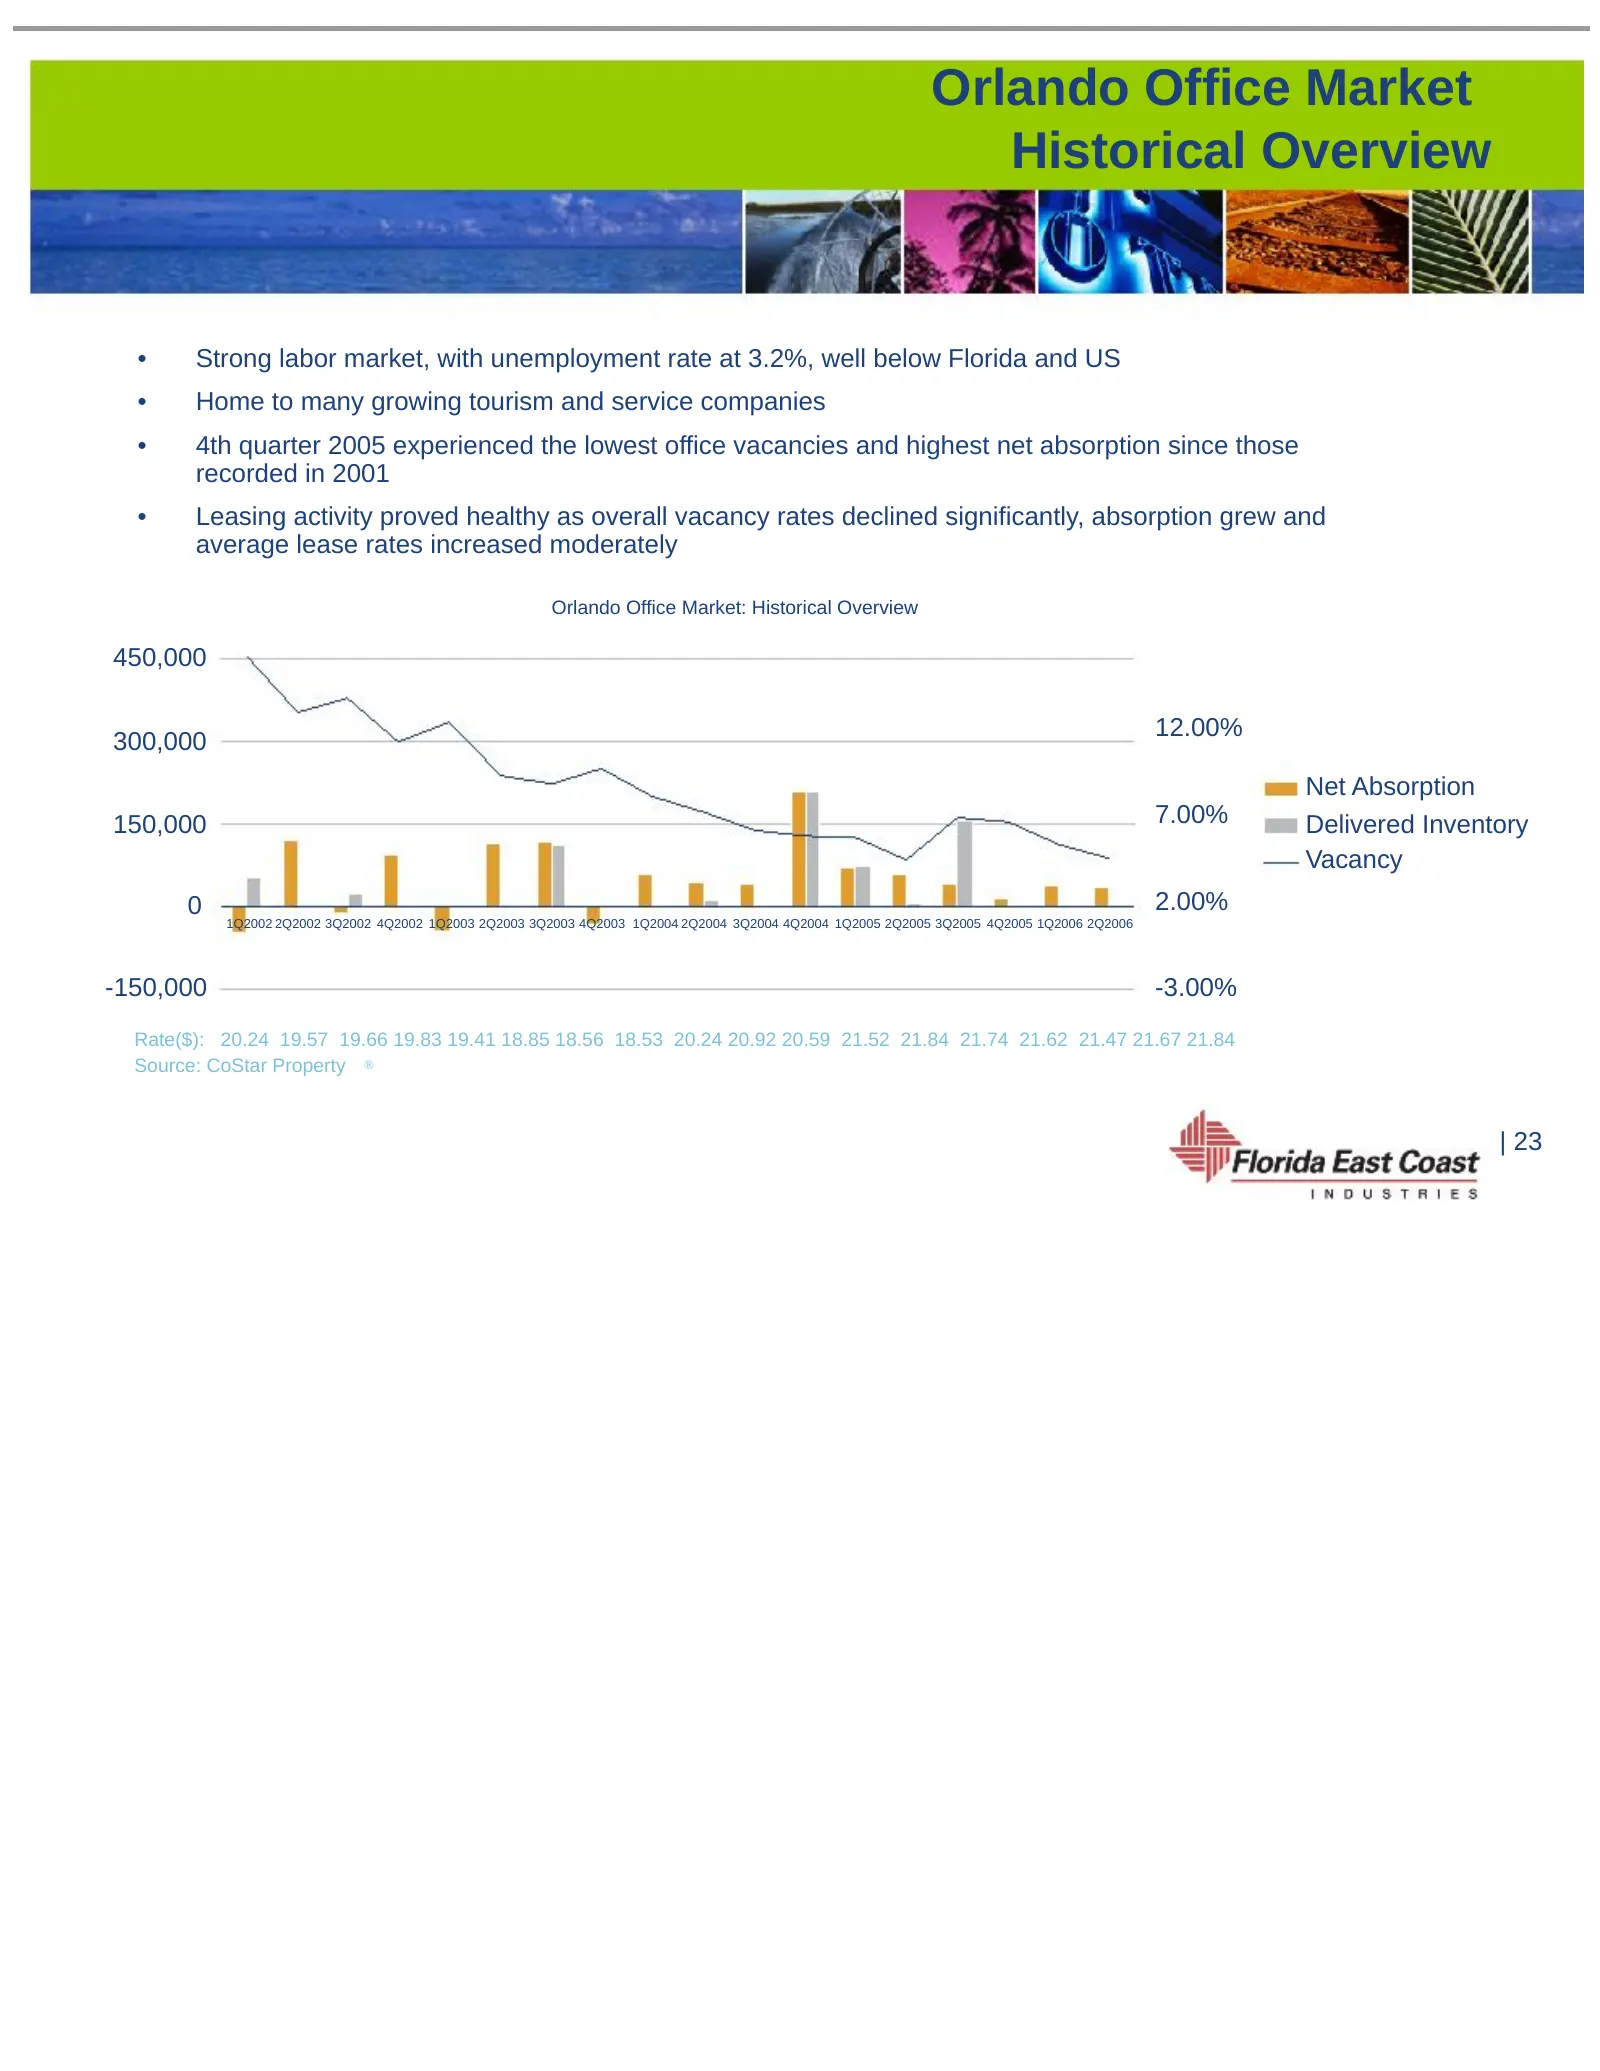
Orlando Office Market Historical Overview • Strong labor market, with unemployment rate at 3.2%, well below Florida and US • Home to many growing tourism and service companies • 4th quarter 2005 experienced the lowest office vacancies and highest net absorption since those recorded in 2001 • Leasing
Slide 24: Flagler Assets in Central Florida
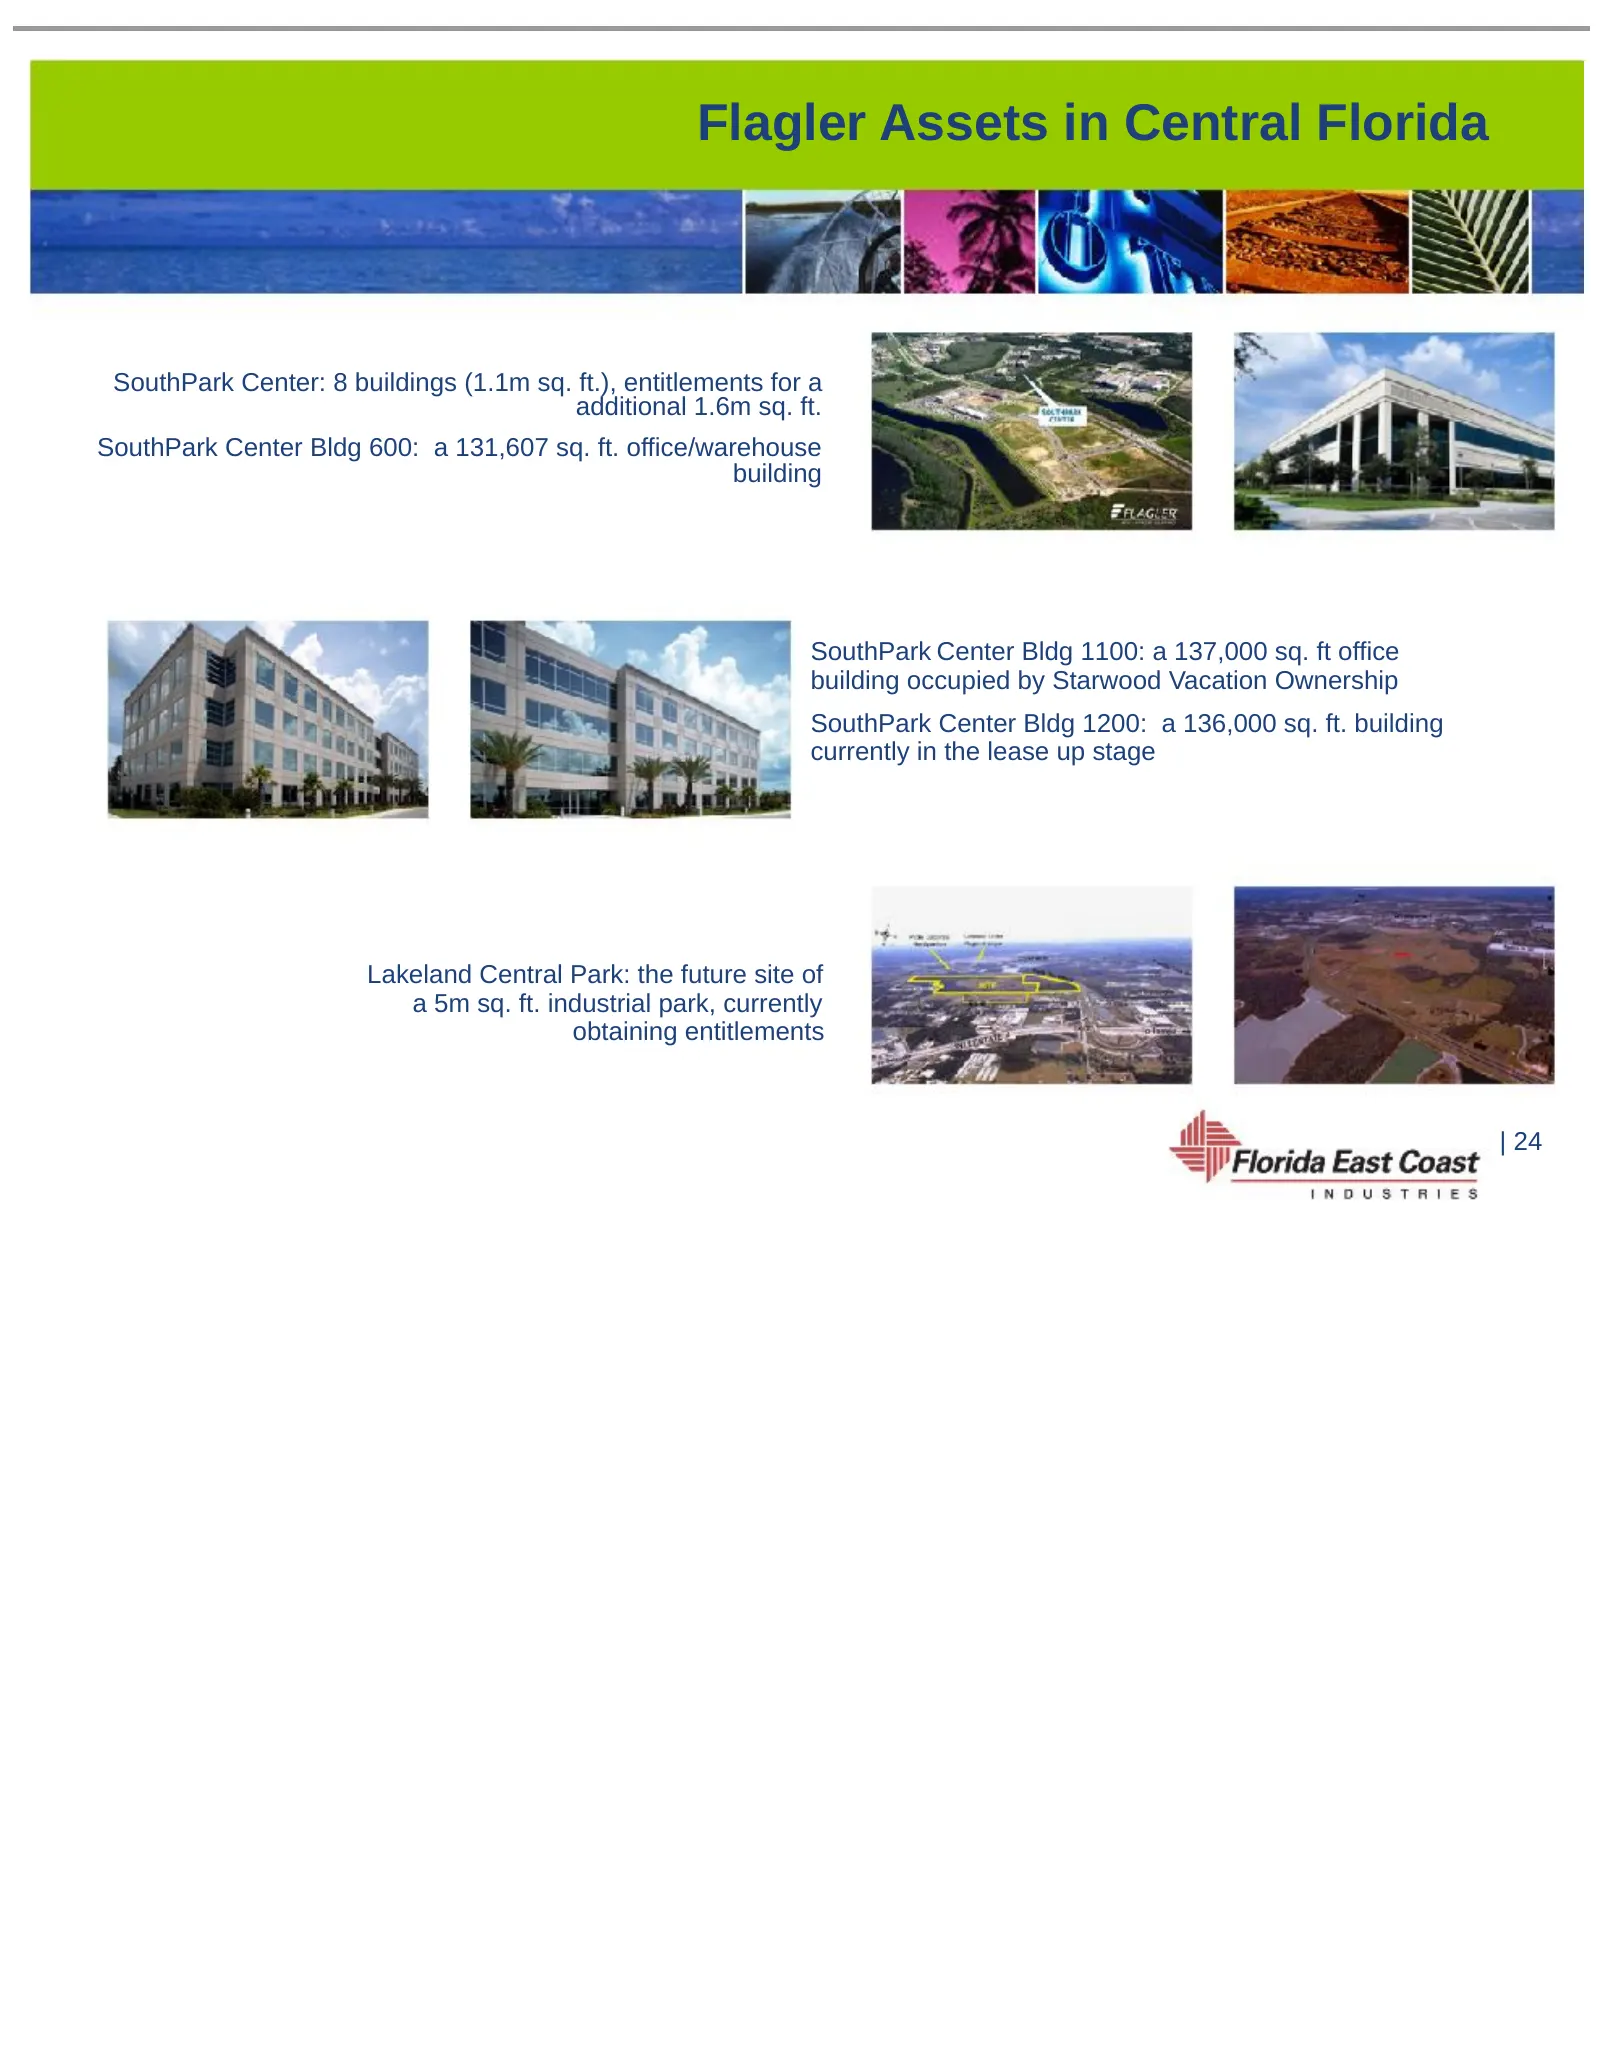
Flagler Assets in Central Florida SouthPark Center: 8 buildings (1.1m sq. ft.), entitlements for a additional 1.6m sq. ft. SouthPark Center Bldg 600: a 131,607 sq. ft. office/warehouse building SouthPark Center Bldg 1100: a 137,000 sq. ft office building occupied by Starwood Vacation Ownership South
Slide 25: North Florida Office Market Historical Overview
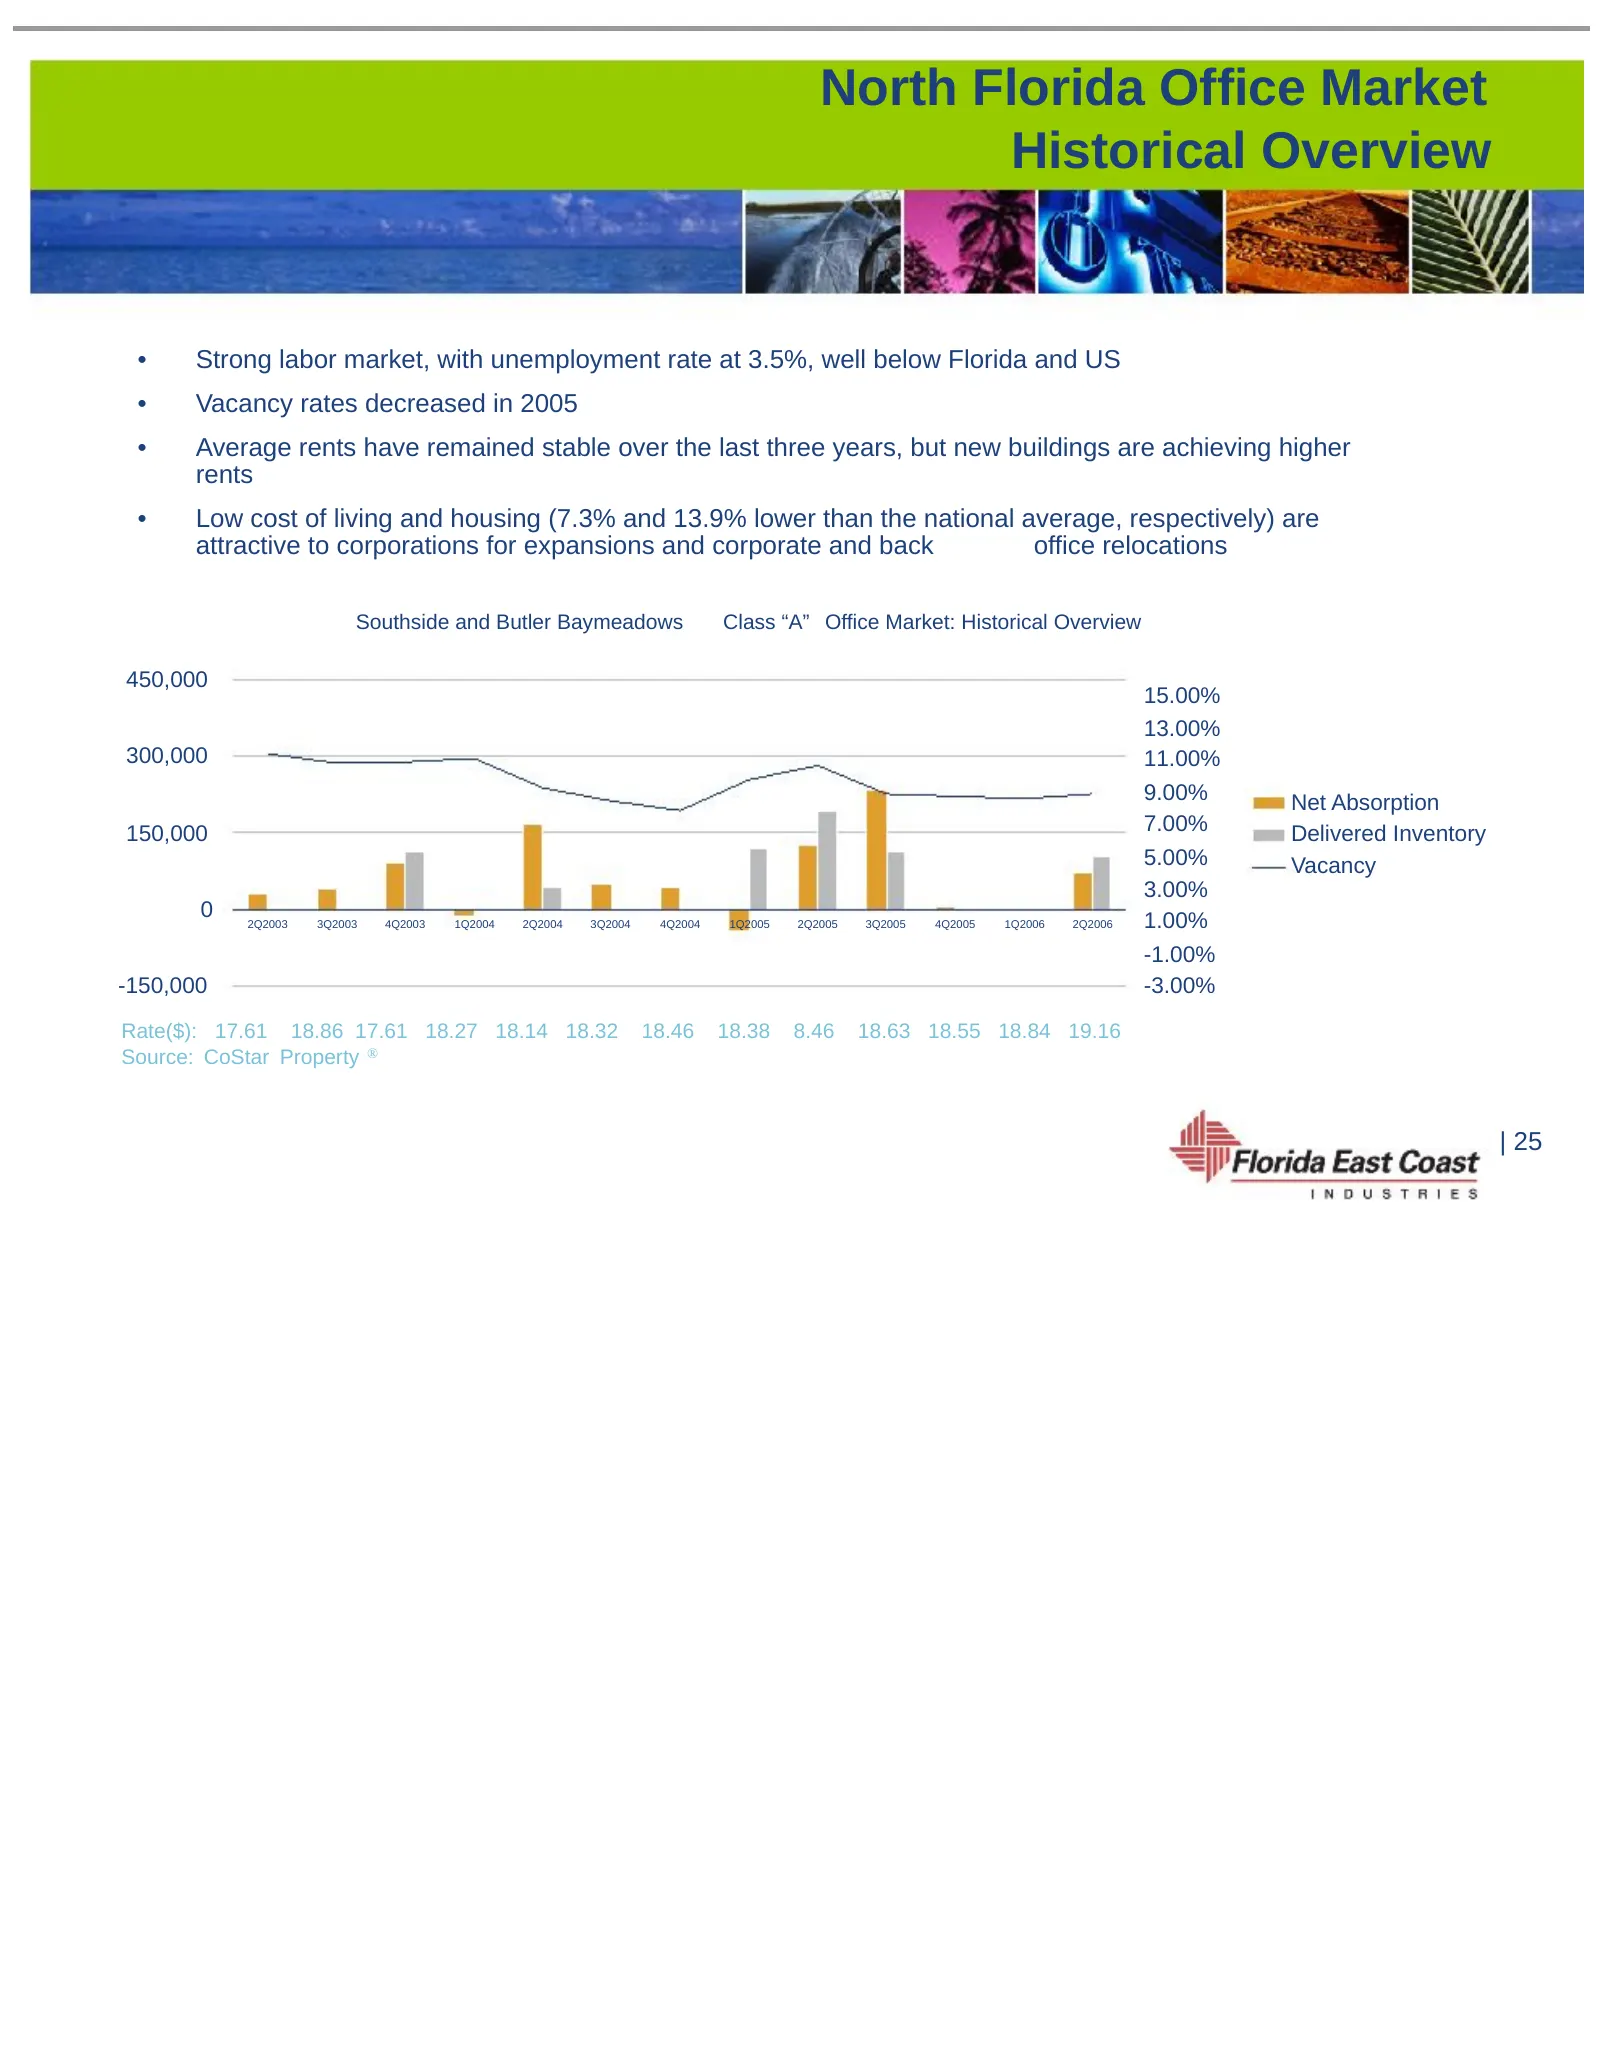
North Florida Office Market Historical Overview • Strong labor market, with unemployment rate at 3.5%, well below Florida and US • Vacancy rates decreased in 2005 • Average rents have remained stable over the last three years, but new buildings are achieving higher rents • Low cost of living and hou
Slide 26: Flagler Assets in North Florida
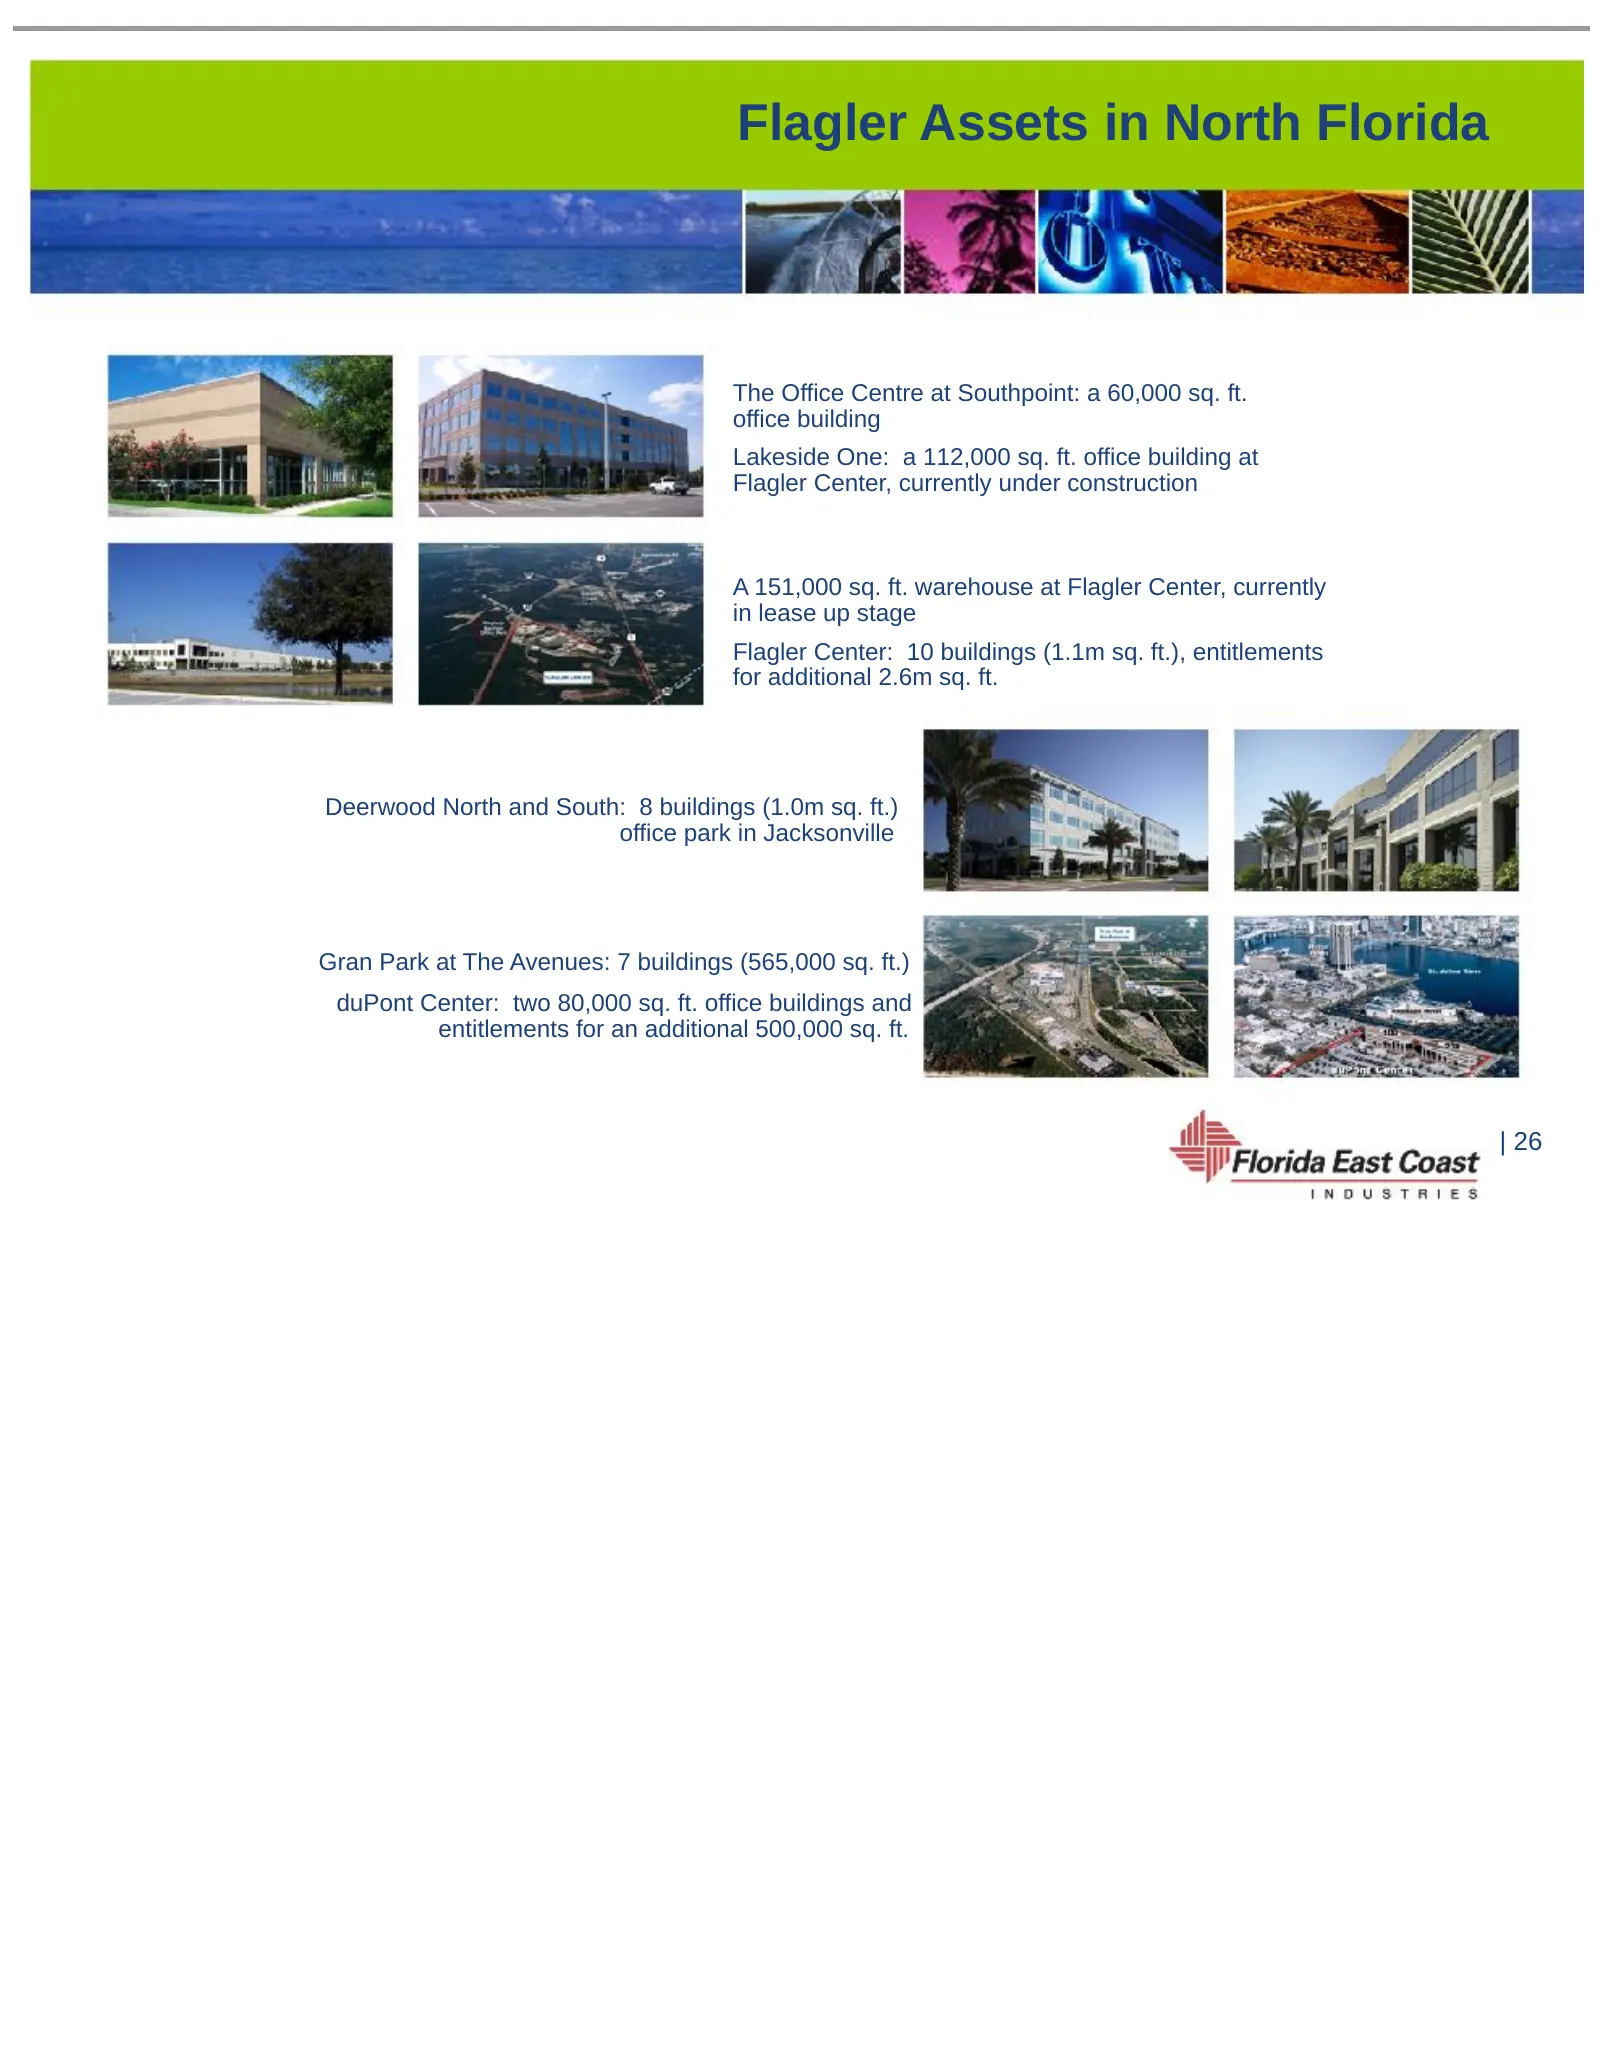
Flagler Assets in North Florida The Office Centre at Southpoint: a 60,000 sq. ft. office building Lakeside One: a 112,000 sq. ft. office building at Flagler Center, currently under construction A 151,000 sq. ft. warehouse at Flagler Center, currently in lease up stage Flagler Center: 10 buildings (1
Slide 27: Florida's Dynamics are Driving Growth for Flagler
Florida’s Dynamics are Driving Growth for Flagler • Overall Florida economy is the fastest-growing among the 10 largest states • Leading the US in job creation – added over 250,000 jobs in 2005 • Population growth is driving demand for infrastructure • Office/retail development follow new residents
Slide 28: Investment Proposition
Investment Proposition • Strategic position in Florida provides strong competitive advantages for FECI • Population growth driving demand for infrastructure, increased flow of goods and economic development activities • Diverse set of assets cannot be duplicated today • FECR services the entire east
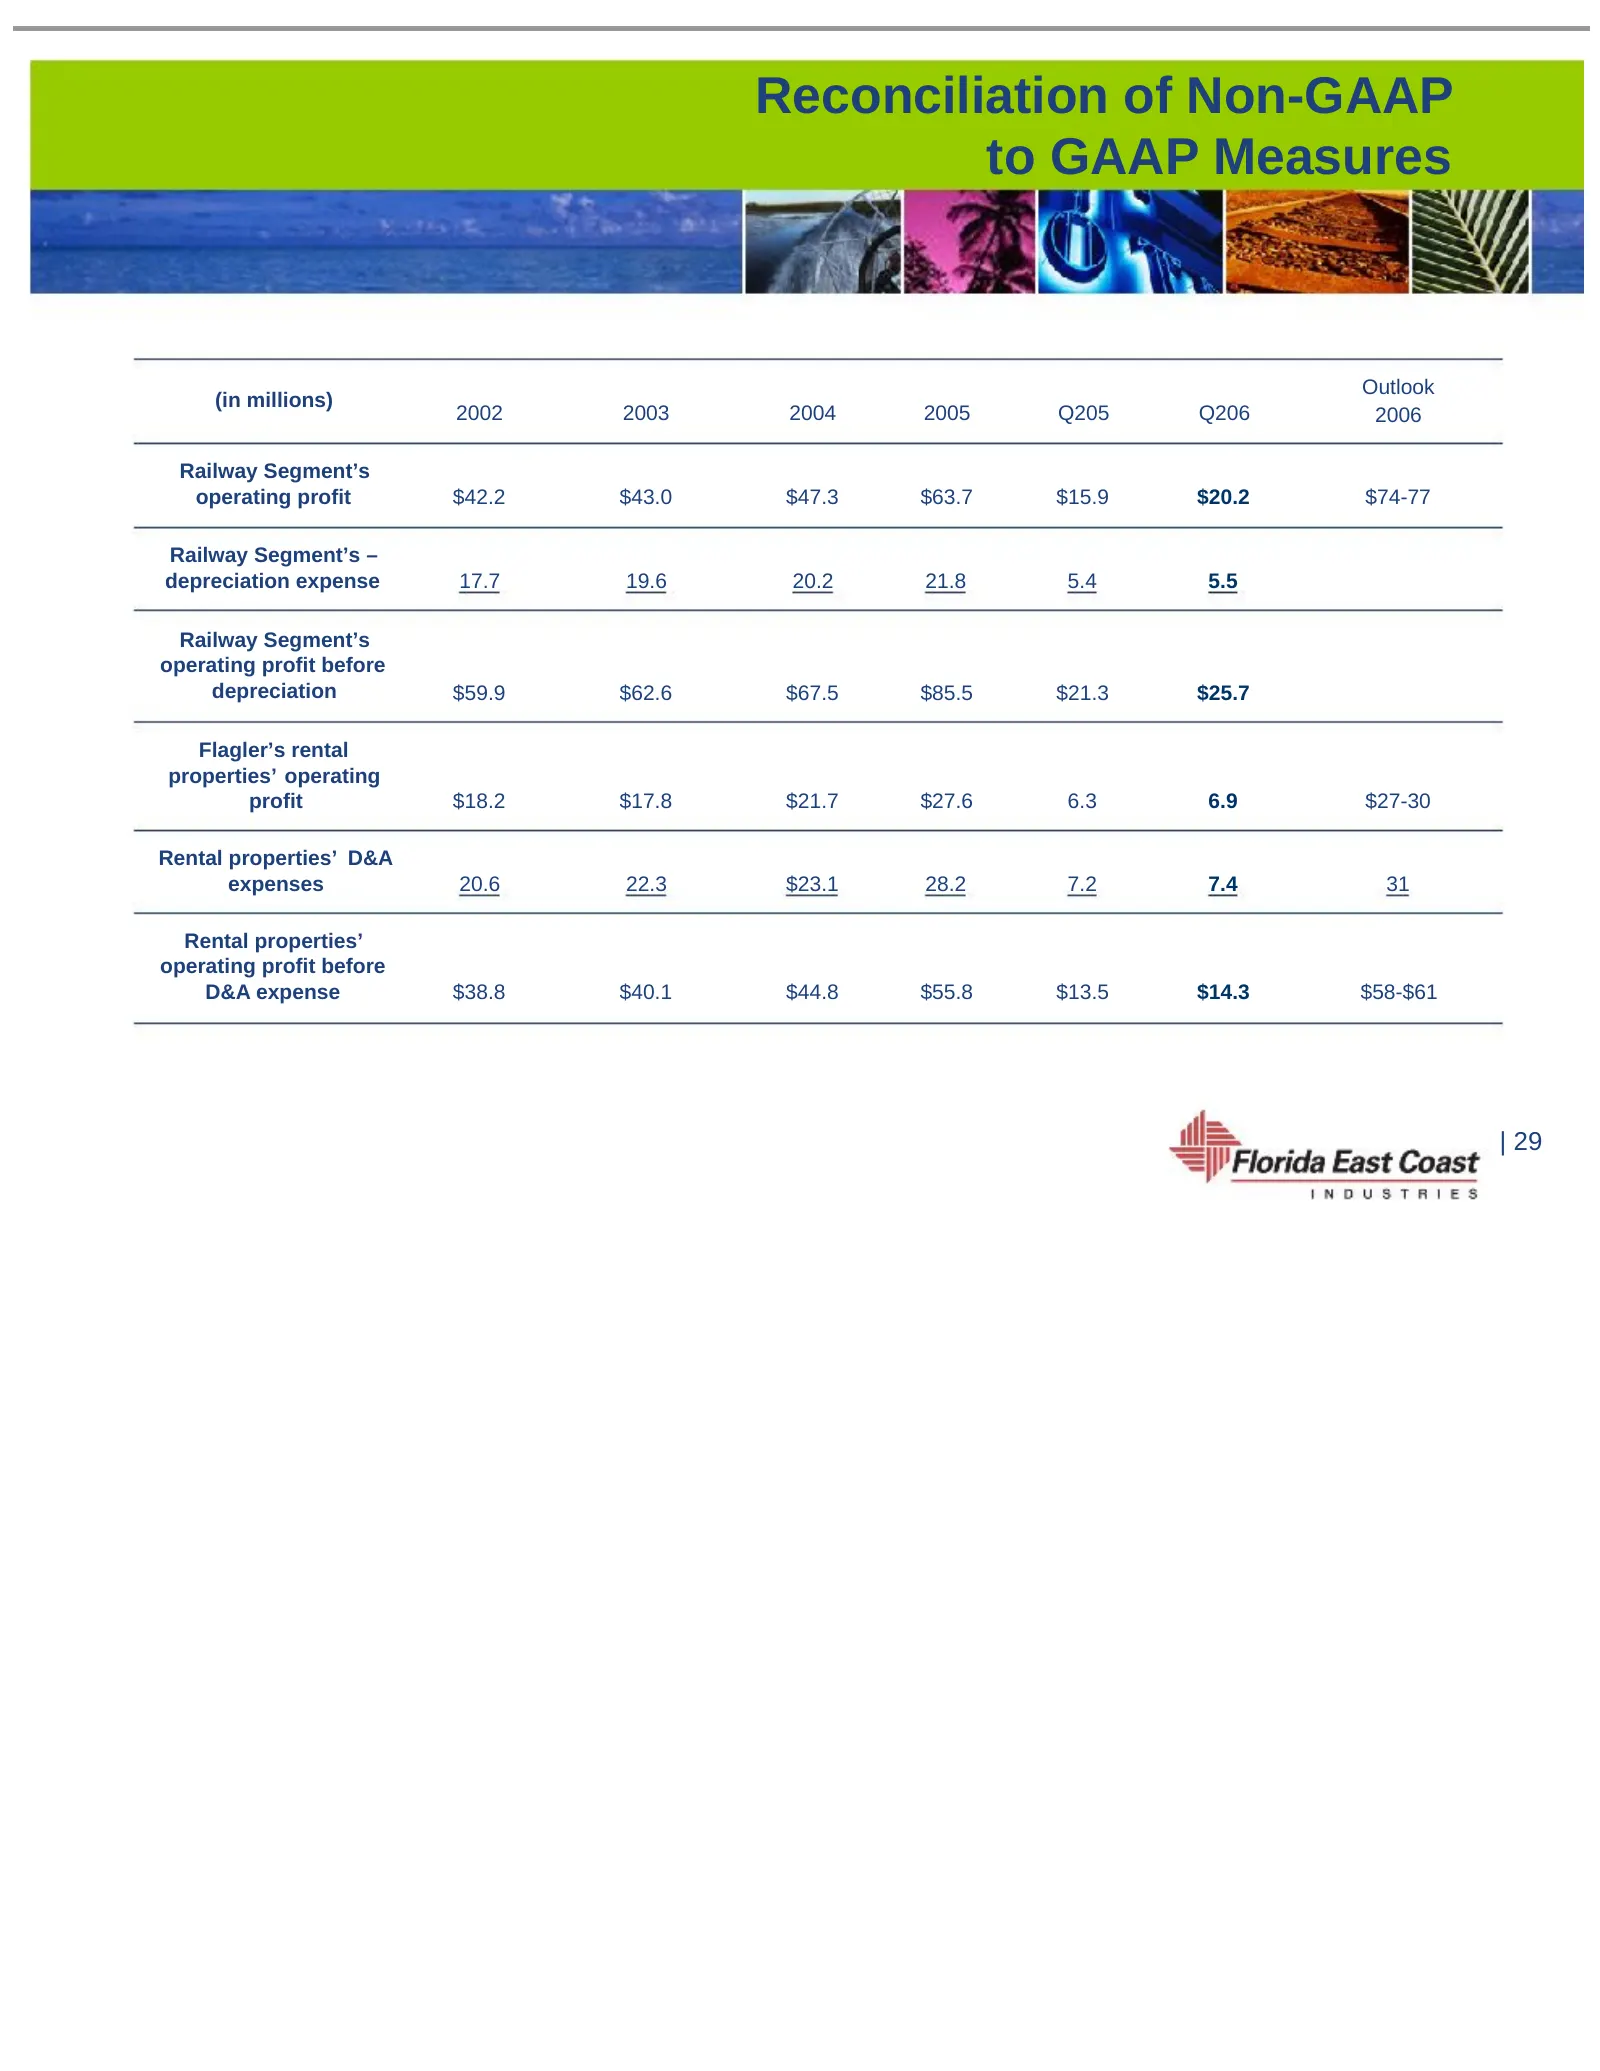
Slide 29: Reconciliation of Non-GAAP to GAAP Measures
Reconciliation of Non-GAAP to GAAP Measures Outlook (in millions) 2002 2003 2004 2005 Q205 Q206 2006 Railway Segment’s operating profit $42.2 $43.0 $47.3 $63.7 $15.9 $20.2 $74-77 Railway Segment’s – depreciation expense 17.7 19.6 20.2 21.8 5.4 5.5 Railway Segment’s operating profit before depreciati
Slide 30: On Our Way
Florida East Coast Industries On Our Way Morgan Keegan 2006 Equity Conference September 7, 2006
Source: SEC EDGAR · 8-K filed Sep 7, 2006
More decks from Florida East Coast Industries Inc
 Merger or Acquisition (May 2007)15 slides · May 31, 2007
 Q1 2007 Earnings Presentation26 slides · May 9, 2007
 Q4 2006 Earnings Presentation39 slides · Feb 15, 2007
 Q3 2006 Earnings Presentation36 slides · Nov 2, 2006
 Ryan Beck Investor Event (September 2006)80 slides · Sep 13, 2006
 Q2 2006 Earnings Presentation36 slides · Aug 3, 2006