Aspen Insurance Holdings Ltd · NYSE:AHL/PE
Aspen Insurance — UBS Global Financial Services Conference 2011
32 slides from Aspen Insurance's conference presentation, May 10, 2011
Slide 1: Aspen Insurance Holdings Limited – UBS Global Financial Services Conference
Aspen Insurance Holdings Limited Chris O'Kane, Chief Executive Officer Mario Vitale, President U.S. Insurance UBS Global Financial Services Conference May 10, 2011
Slide 2: Safe Harbor Disclosure
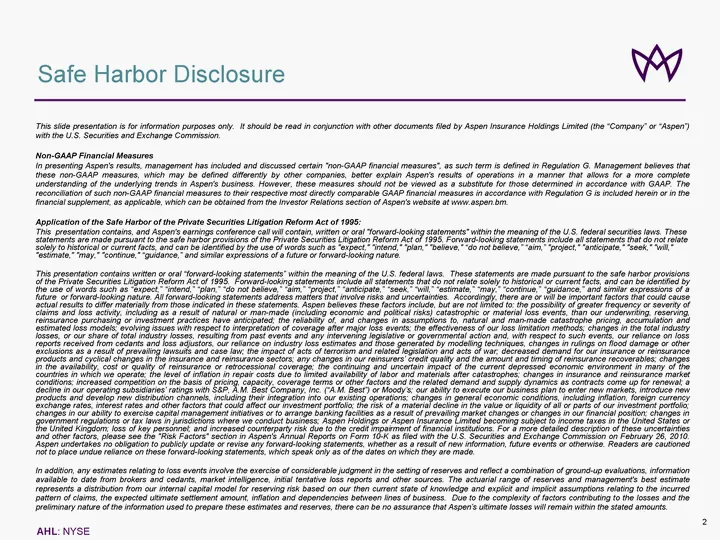
Safe Harbor Disclosure This slide presentation is for information purposes only. It should be read in conjunction with other documents filed by Aspen Insurance Holdings Limited (the "Company" or "Aspen") with the U.S. Securities and Exchange Commission. Non-GAAP Financial Measures In presenting Aspe
Slide 3: Contents
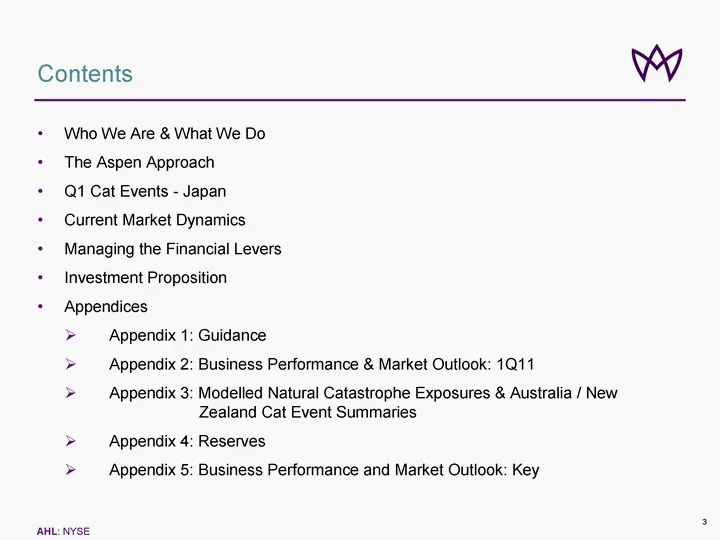
Contents Who We Are & What We Do The Aspen Approach Q1 Cat Events - Japan Current Market Dynamics Managing the Financial Levers Investment Proposition Appendices ? Appendix 1: Guidance ? Appendix 2: Business Performance & Market Outlook: 1Q11 ? Appendix 3: Modelled Natural Catastrophe Exposures & Au
Slide 4: Who We Are
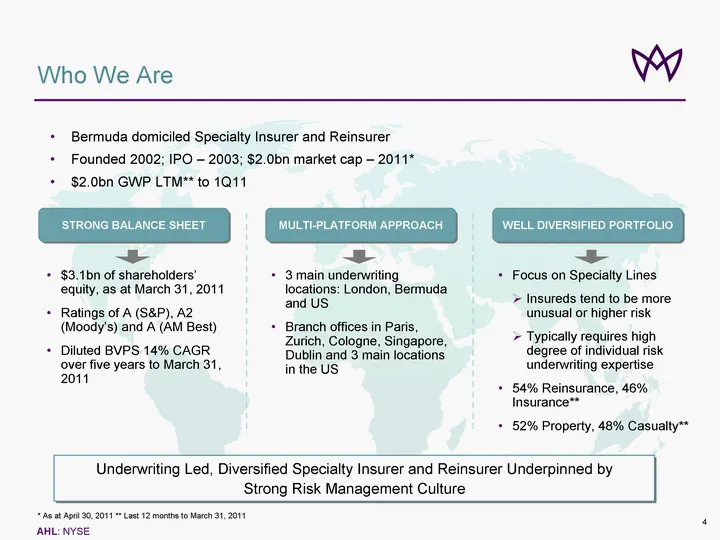
Who We Are STRONG BALANCE SHEET WELL DIVERSIFIED PORTF OLIO MULTI-PLATFORM APPROACH $3.1bn of shareholders' equity, as at March 31, 2011 Ratings of A (S&P), A2 (Moody's) and A (AM Best) Diluted BVPS 14% CAGR over five years to March 31, 2011 Focus on Specialty Lines ? Insureds tend to be more unusua
Slide 5: What We Do: Strategy
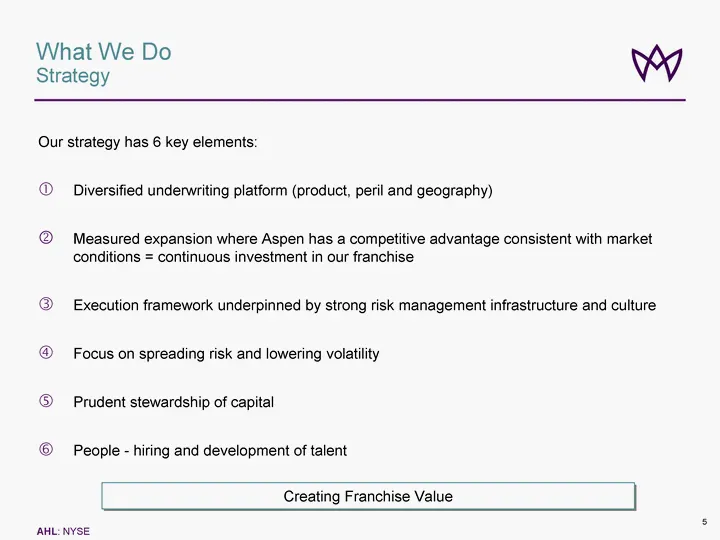
Our strategy has 6 key elements: Diversified underwriting platform (product, peril and geography) Measured expansion where Aspen has a competitive advantage consistent with market conditions = continuous investment in our franchise Execution framework underpinned by strong risk management infrastruc
Slide 6: What We Do: Return Objective
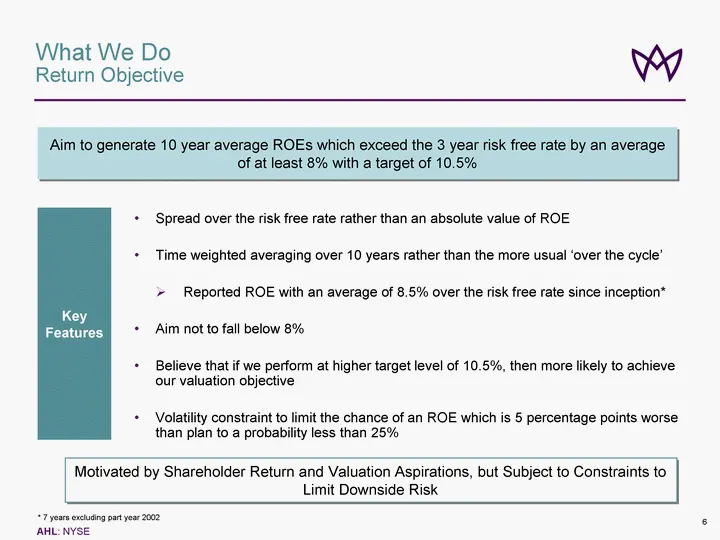
What We Do Return Objective Aim to generate 10 year average ROEs which exceed the 3 year risk free rate by an average of at least 8% with a target of 10.5% Motivated by Shareholder Return and Valuation Aspirations, but Subject to Constraints to Limit Downside Risk Key Features Spread over the risk f
Slide 7: Value in the 'Specialty' Approach
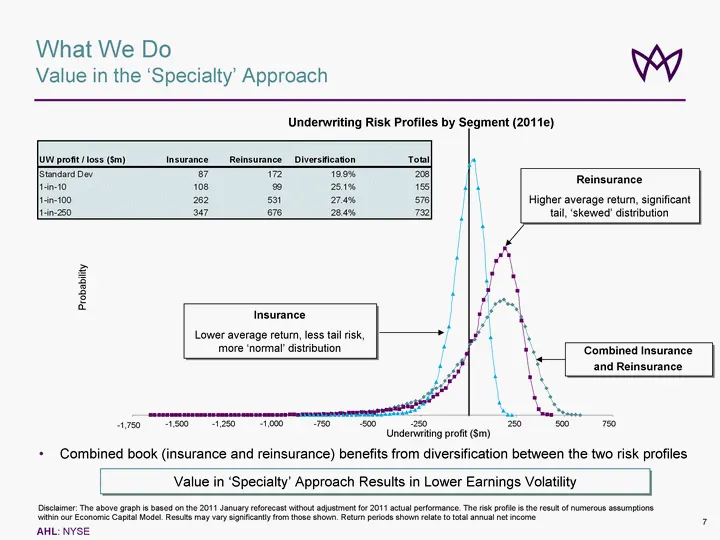
What We Do Value in the 'Specialty' Approach Value in 'Specialty' Approach Results in Lower Earnings Volatility Combined book (insurance and reinsurance) benefits from diversification between the two risk profiles Probability Insurance Lower average return, less tail risk, more 'normal' distribution
Slide 8: Reinsurance: Overview and Strategy
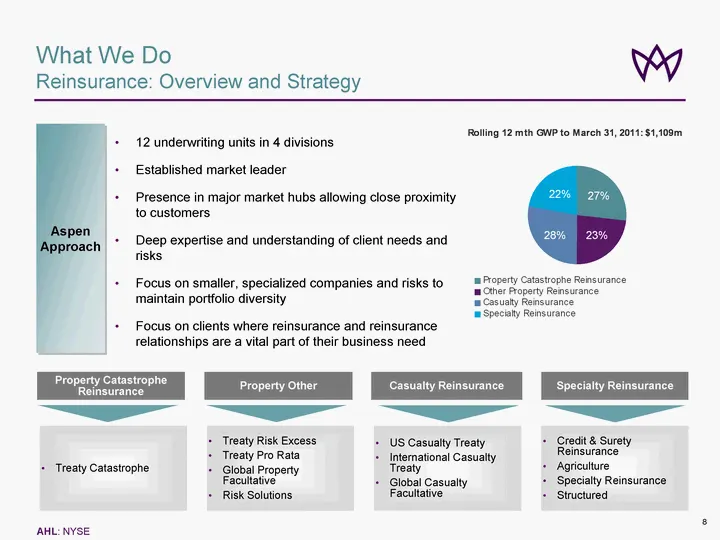
What We Do Reinsurance: Overview and Strategy Aspen Approach Property Catastrophe Reinsurance Property Other Casualty Reinsurance Specialty Reinsurance Credit & Surety Reinsurance Agriculture Specialty Reinsurance Structured US Casualty Treaty International Casualty Treaty Global Casualty Facultativ
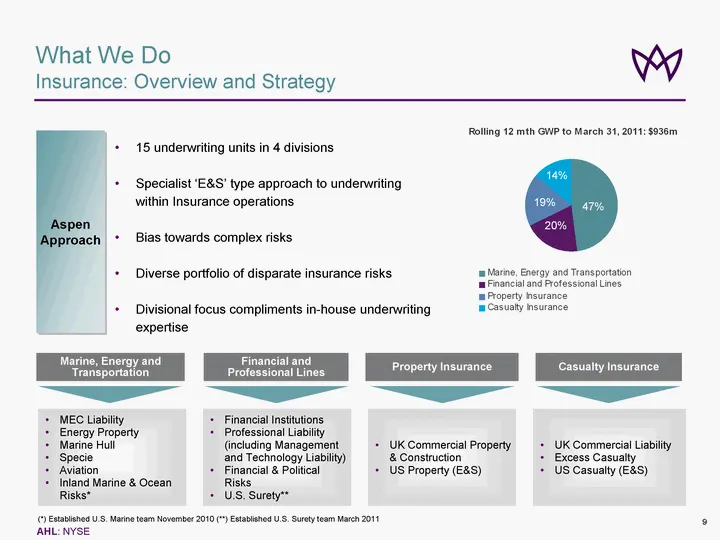
Slide 9: Insurance: Overview and Strategy
13 underwriting units in 4 divisions Specialist 'E&S' type approach to underwriting within Insurance operations Bias towards complex risks Diverse portfolio of disparate insurance risks Divisional focus compliments in-house underwriting expertise Marine, Energy and Transportation Financial and Profe
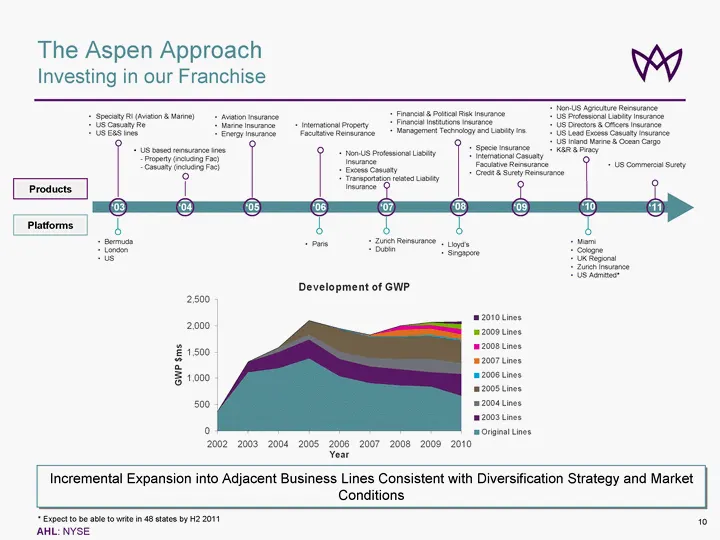
Slide 10: The Aspen Approach: Investing in our Franchise
Miami Cologne UK Regional Zurich Insurance US Admitted* '06 '07 '08 '09 '10 The Aspen Approach Investing in our Franchise '03 '04 '05 Specialty RI (Aviation & Marine) US Casualty Re US E&S lines Aviation Insurance Marine Insurance Energy Insurance International Property Facultative Reinsurance Non-U
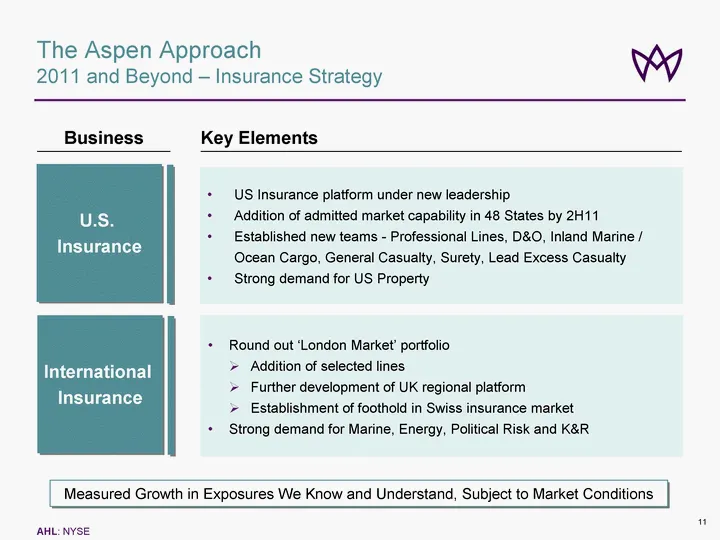
Slide 11: 2011 and Beyond - Insurance Strategy
The Aspen Approach 2011 and Beyond - Insurance Strategy U.S. Insurance US Insurance platform under new leadership Addition of admitted market capability in 48 States by 2H11 Established new teams - Professional Lines, D&O, Inland Marine / Ocean Cargo, General Casualty, Surety, Lead Excess Casualty S
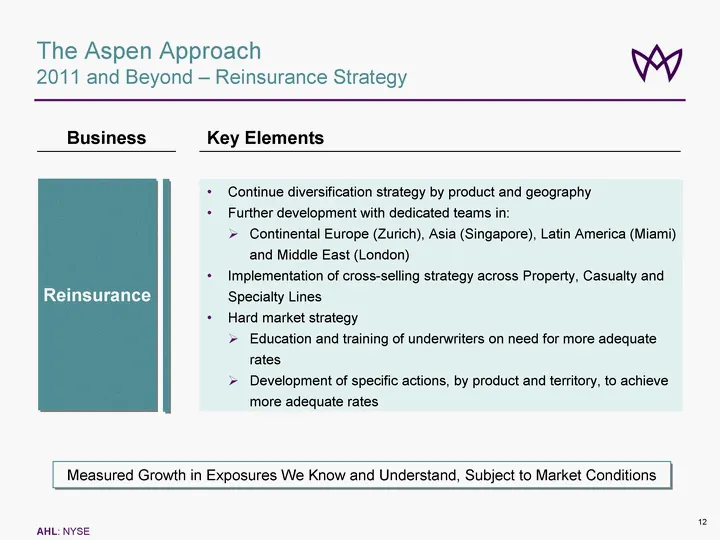
Slide 12: 2011 and Beyond - Reinsurance Strategy
The Aspen Approach 2011 and Beyond - Reinsurance Strategy Reinsurance Key Elements Business Measured Growth in Exposures We Know and Understand, Subject to Market Conditions Continue diversification strategy by product and geography Further development with dedicated teams in: ? Continental Europe (
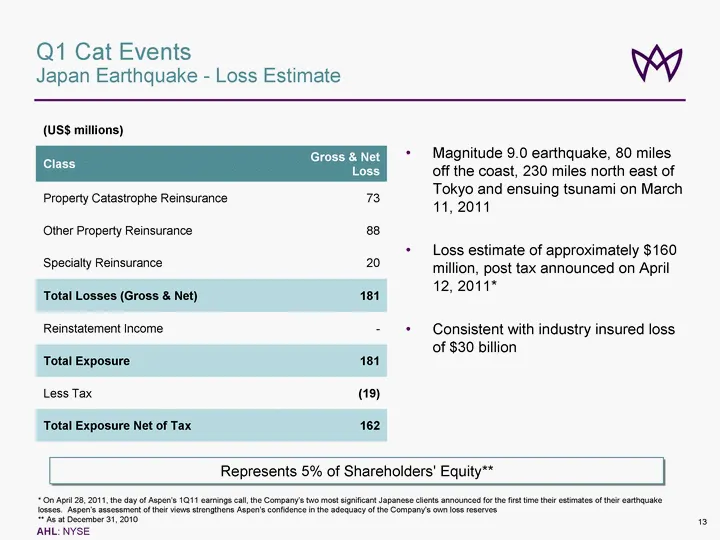
Slide 13: Q1 Cat Events: Japan Earthquake Loss Estimate
Q1 Cat Events Japan Earthquake - Loss Estimate Magnitude 9.0 earthquake, 80 miles off the coast, 230 miles north east of Tokyo and ensuing tsunami on March 11, 2011 Loss estimate of approximately $160 million, post tax announced on April 12, 2011* Consistent with industry insured loss of $30 billion
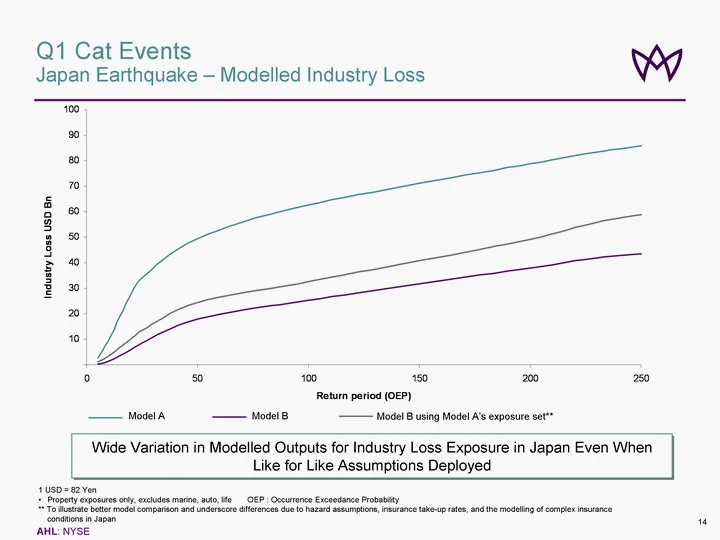
Slide 14: Japan Earthquake - Modelled Industry Loss
Q1 Cat Events Japan Earthquake - Modelled Industry Loss 1 USD = 82 Yen Property exposures only, excludes marine, auto, life OEP : Occurrence Exceedance Probability ** To illustrate better model comparison and underscore differences due to hazard assumptions, insurance take-up rates, and the modellin
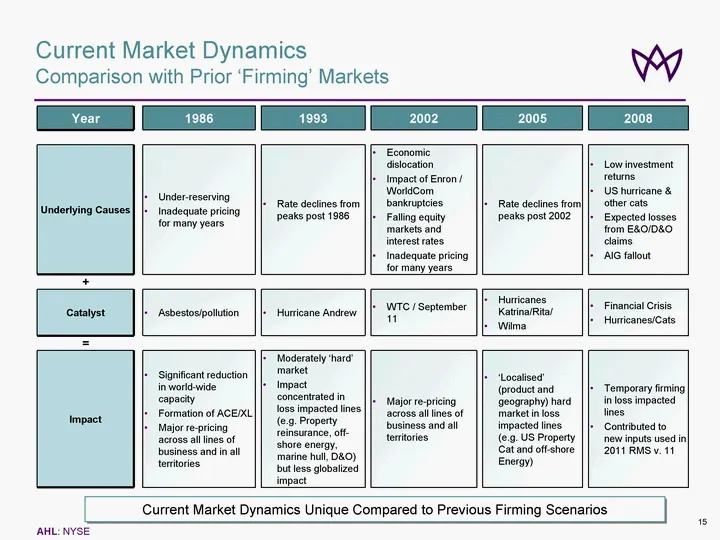
Slide 15: Current Market Dynamics: Comparison with Prior Firming Markets
Current Market Dynamics Comparison with Prior 'Firming' Markets Year 1986 1993 2002 2005 2008 Underlying Causes Under-reserving Inadequate pricing for many years Rate declines from peaks post 1986 Economic dislocation Impact of Enron / WorldCom bankruptcies Falling equity markets and interest rates
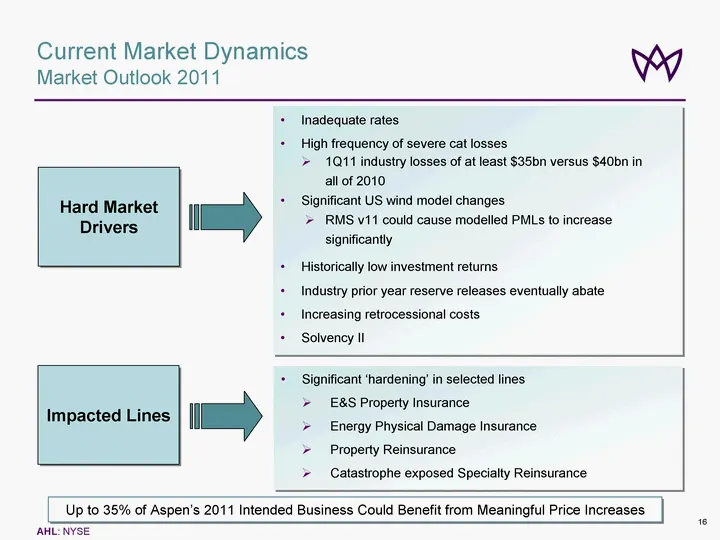
Slide 16: Hard Market Drivers and Impacted Lines
Hard Market Drivers Impacted Lines Inadequate rates High frequency of severe cat losses ? 1Q11 industry losses of at least $35bn versus $40bn in all of 2010 Significant US wind model changes ? RMS v11 could cause modelled PMLs to increase significantly Historically low investment returns Industry pr
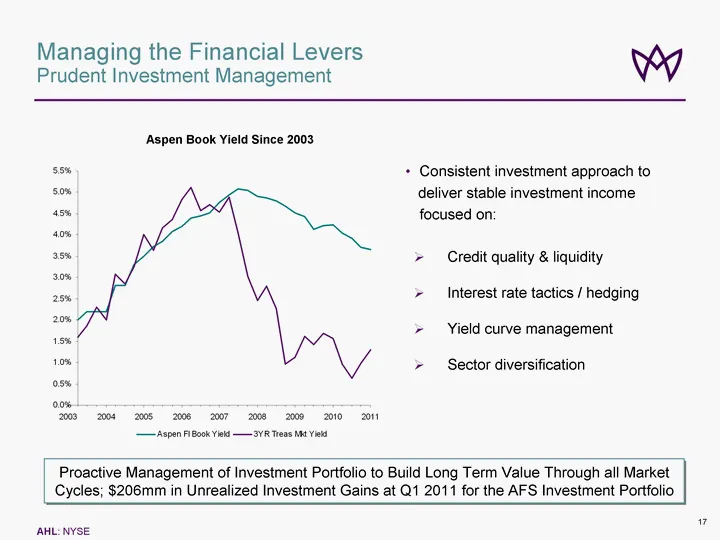
Slide 17: Managing the Financial Levers: Prudent Investment Management
Managing the Financial Levers Prudent Investment Management Aspen Book Yield Since 2003 Proactive Management of Investment Portfolio to Build Long Term Value Through all Market Cycles; $206mm in Unrealized Investment Gains at Q1 2011 for the AFS Investment Portfolio Consistent investment approach to
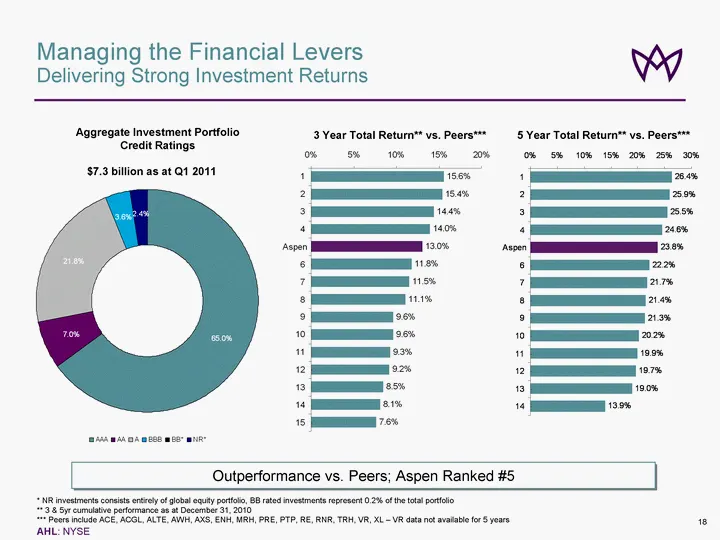
Slide 18: Delivering Strong Investment Returns
3 Year Total Return** vs. Peers*** 4% 7% Managing the Financial Levers Delivering Strong Investment Returns Aggregate Investment Portfolio Credit Ratings Outperformance vs. Peers; Aspen Ranked #5 $7.3 billion as at Q1 2011 * NR investments consists entirely of global equity portfolio ** 3 & 5yr cumu
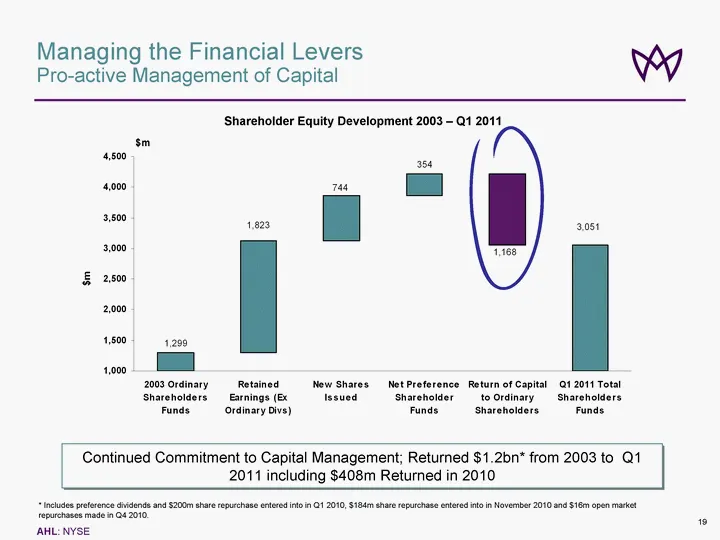
Slide 19: Pro-active Management of Capital
Managing the Financial Levers Pro-active Management of Capital * Includes preference dividends and $200m share repurchase entered into in Q1 2010, $184m share repurchase entered into in November 2010 and $16m open market repurchases made in Q4 2010. Shareholder Equity Development 2003 - Q1 2011 Cont
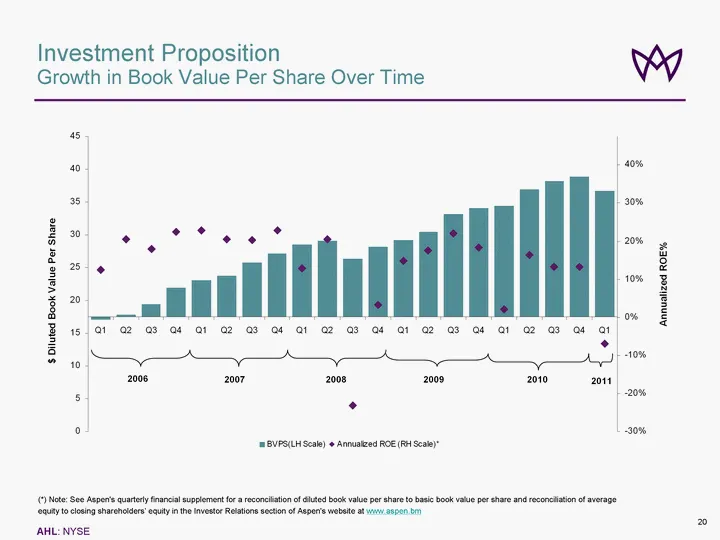
Slide 20: Investment Proposition: Growth in Book Value Per Share
Investment Proposition Growth in Book Value Per Share Over Time (*) Note: See Aspen's quarterly financial supplement for a reconciliation of diluted book value per share to basic book value per share and reconciliation of average equity to closing shareholders' equity in the Investor Relations secti
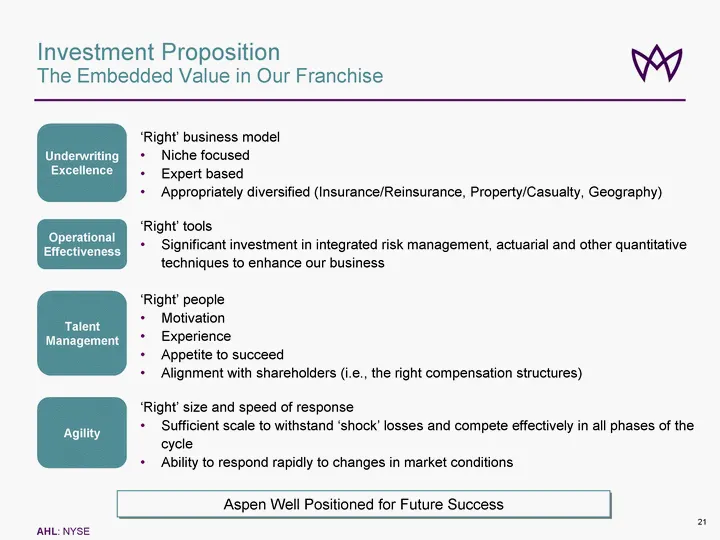
Slide 21: The Embedded Value in Our Franchise
Investment Proposition The Embedded Value in Our Franchise 'Right' business model Niche focused Expert based Appropriately diversified (Insurance/Reinsurance, Property/Casualty, Geography) 'Right' tools Significant investment in integrated risk management, actuarial and other quantitative techniques
Slide 22: Appendices
Appendices AHL: NYSE
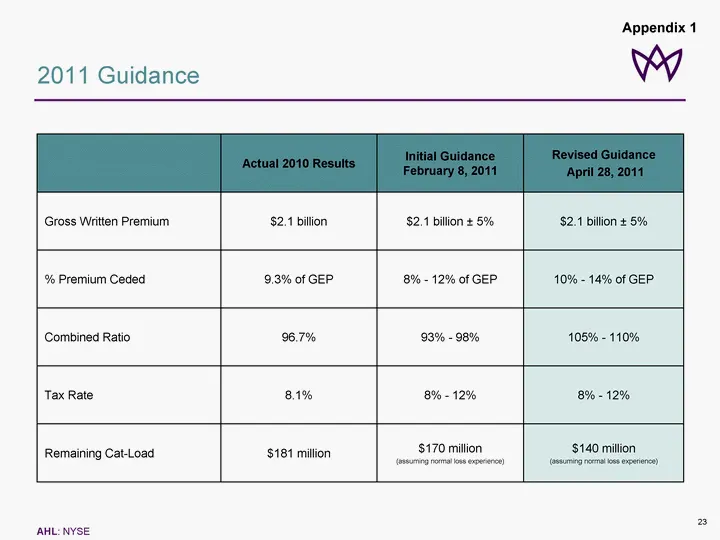
Slide 23: 2011 Guidance
2011 Guidance Actual 2010 Results Initial Guidance February 8, 2011 Revised Guidance April 28, 2011 Gross Written Premium $2.1 billion $2.1 billion +- 5% $2.1 billion +- 5% % Premium Ceded 9.3% of GEP 8% - 12% of GEP 10% - 14% of GEP Combined Ratio 96.7% 93% - 98% 105% - 110% Tax Rate 8.1% 8% - 12%
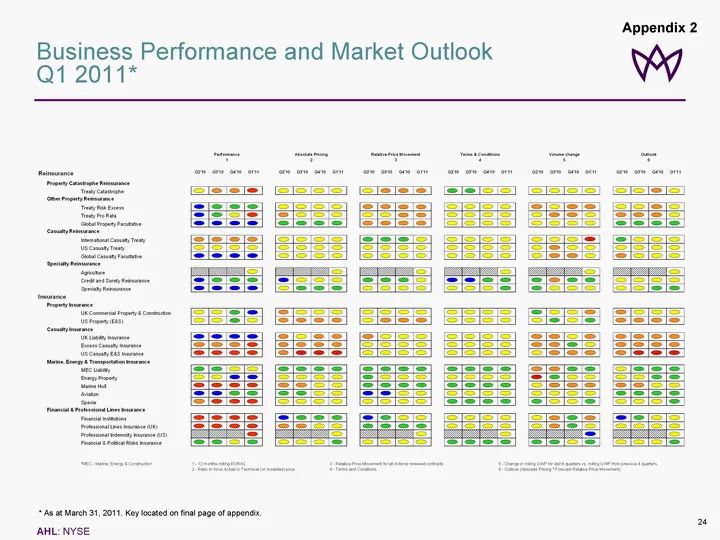
Slide 24: Business Performance and Market Outlook Q1 2011
Business Performance and Market Outlook Q1 2011* * As at March 31, 2011. Key located on final page of appendix. * As at March 31, 2011. Key located on final page of appendix. Appendix 2
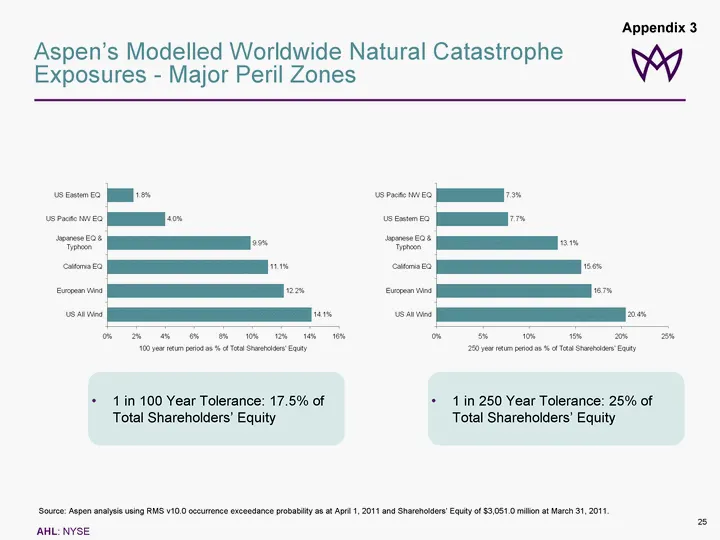
Slide 25: Modelled Worldwide Natural Catastrophe Exposures
Aspen's Modelled Worldwide Natural Catastrophe Exposures - Major Peril Zones Source: Aspen analysis using RMS v10.0 occurrence exceedance probability as at April 1, 2011 and Shareholders' Equity of $3,051.0 million at March 31, 2011. 1 in 100 Year Tolerance: 17.5% of Total Shareholders' Equity 1 in
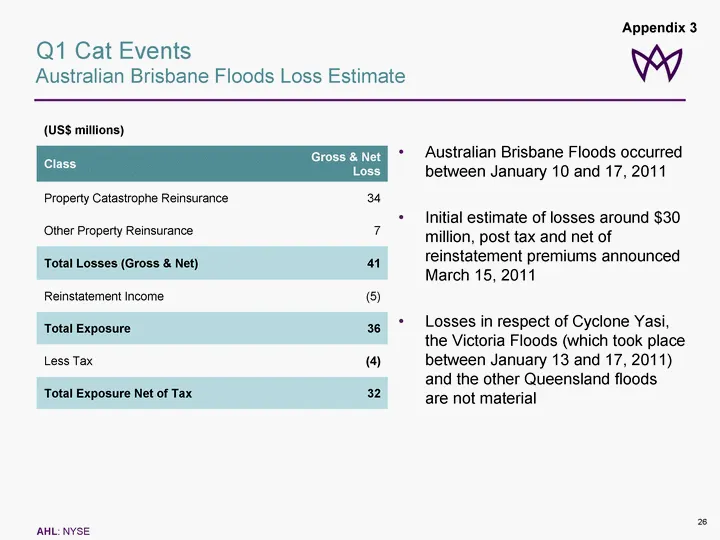
Slide 26: Australian Brisbane Floods Loss Estimate
Australian Brisbane Floods occurred between January 10 and 17, 2011 Initial estimate of losses around $30 million, post tax and net of reinstatement premiums announced March 15, 2011 Losses in respect of Cyclone Yasi, the Victoria Floods (which took place between January 13 and 17, 2011) and the oth
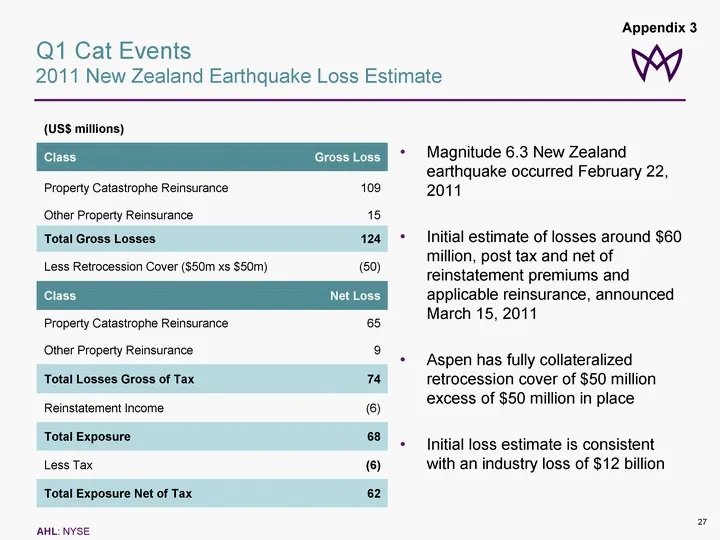
Slide 27: 2011 New Zealand Earthquake Loss Estimate
Magnitude 6.3 New Zealand earthquake occurred February 22, 2011 Initial estimate of losses around $60 million, post tax and net of reinstatement premiums and applicable reinsurance, announced March 15, 2011 Aspen has fully collateralized retrocession cover of $50 million excess of $50 million in pla
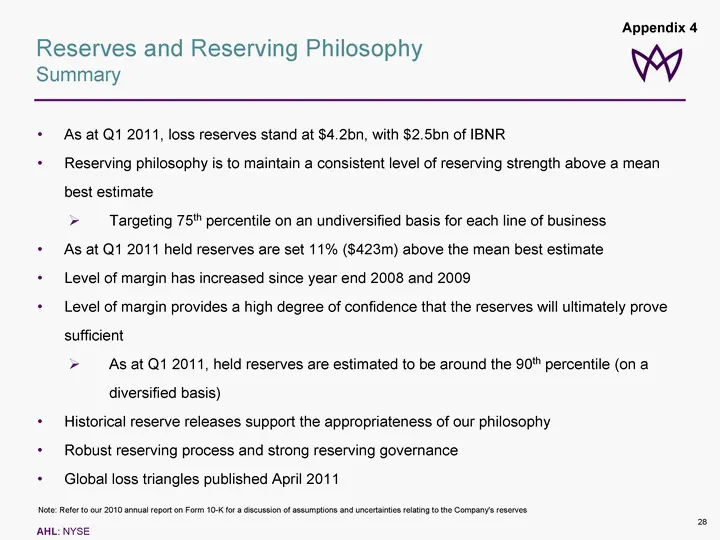
Slide 28: Reserves and Reserving Philosophy Summary
Reserves and Reserving Philosophy Summary As at Q1 2011, loss reserves stand at $4.2bn, with $2.5bn of IBNR Reserving philosophy is to maintain a consistent level of reserving strength above a mean best estimate ? Targeting 75th percentile on an undiversified basis for each line of business As at Q1
Slide 29: Consistent Levels of Reserve Adequacy
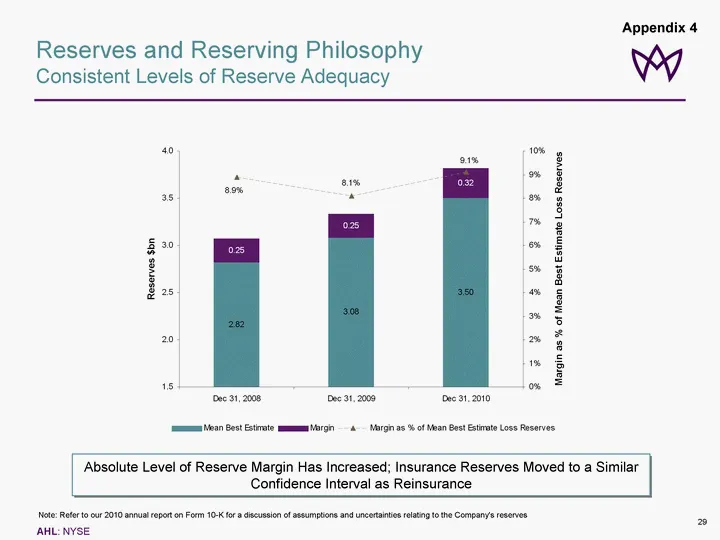
Reserves and Reserving Philosophy Consistent Levels of Reserve Adequacy Absolute Level of Reserve Margin Has Increased; Insurance Reserves Moved to a Similar Confidence Interval as Reinsurance Note: Refer to our 2010 annual report on Form 10-K for a discussion of assumptions and uncertainties relati
Slide 30: Confidence in Reserves
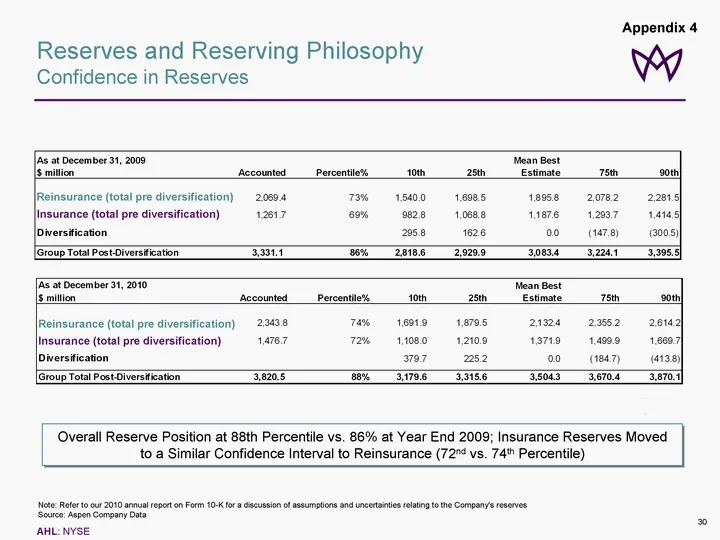
Reserves and Reserving Philosophy Confidence in Reserves Overall Reserve Position at 88th Percentile vs. 86% at Year End 2009; Insurance Reserves Moved to a Similar Confidence Interval to Reinsurance (72nd vs. 74th Percentile) Note: Refer to our 2010 annual report on Form 10-K for a discussion of as
Slide 31: Case and IBNR
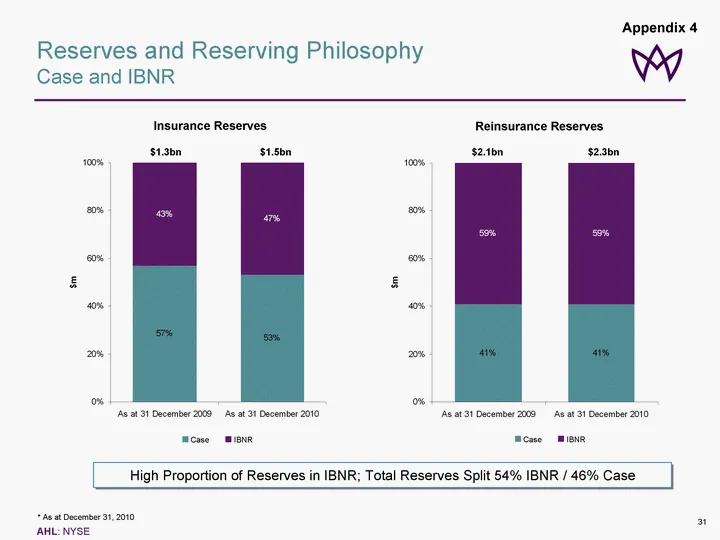
Reserves and Reserving Philosophy Case and IBNR High Proportion of Reserves in IBNR; Total Reserves Split 54% IBNR / 46% Case * As at December 31, 2010 Insurance Reserves Reinsurance Reserves $1.3bn $1.5bn $2.1bn $2.3bn Case IBNR Case IBNR Appendix 4
Slide 32: Business Performance and Market Outlook: Key
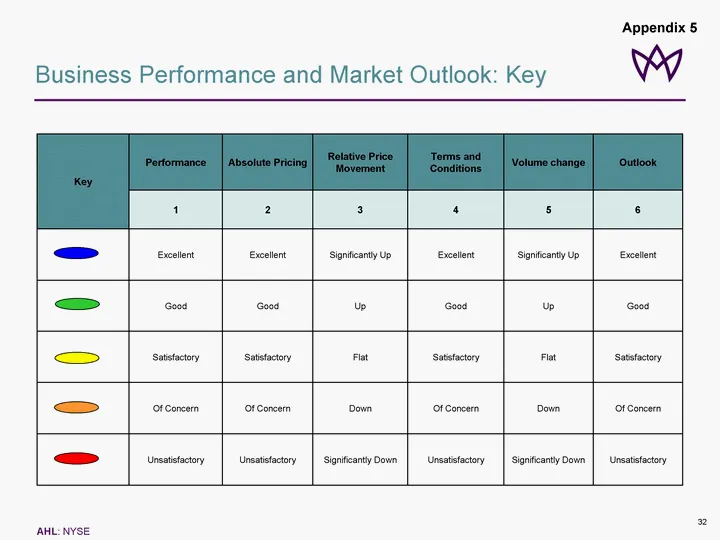
Business Performance and Market Outlook: Key Key Performance Absolute Pricing Relative Price Movement Terms and Conditions Volume change Outlook Key 1 2 3 4 5 6 Excellent Excellent Significantly Up Excellent Significantly Up Excellent Good Good Up Good Up Good Satisfactory Satisfactory Flat Satisfac
Source: SEC EDGAR · 8-K filed May 10, 2011
More decks from Aspen Insurance Holdings Ltd
 Q1 2018 Earnings Presentation13 slides · May 2, 2018
 Q3 2017 Earnings Presentation20 slides · Nov 15, 2017
 Q2 2017 Earnings Presentation20 slides · Jul 26, 2017
 Q1 2017 Earnings Presentation20 slides · Apr 26, 2017
 Q4 2016 Earnings Presentation16 slides · Feb 14, 2017
 Q3 2016 Earnings Presentation16 slides · Oct 26, 2016