Navistar International Corporation
Navistar International — 35th Annual Gabelli Aftermarket Symposium 2011
32 slides from Navistar International's conference presentation, Oct 31, 2011
Slide 1: Gabelli 35th Annual Aftermarket Symposium
Exhibit 99.1 Gabelli Aftermarket October For More35th 31st, than Symposium Annual 2011 175 years Automotive we’vethe move 1NYSE:been NAV goods helping thatpeople move the from welfare every of corner entireofnations. the world
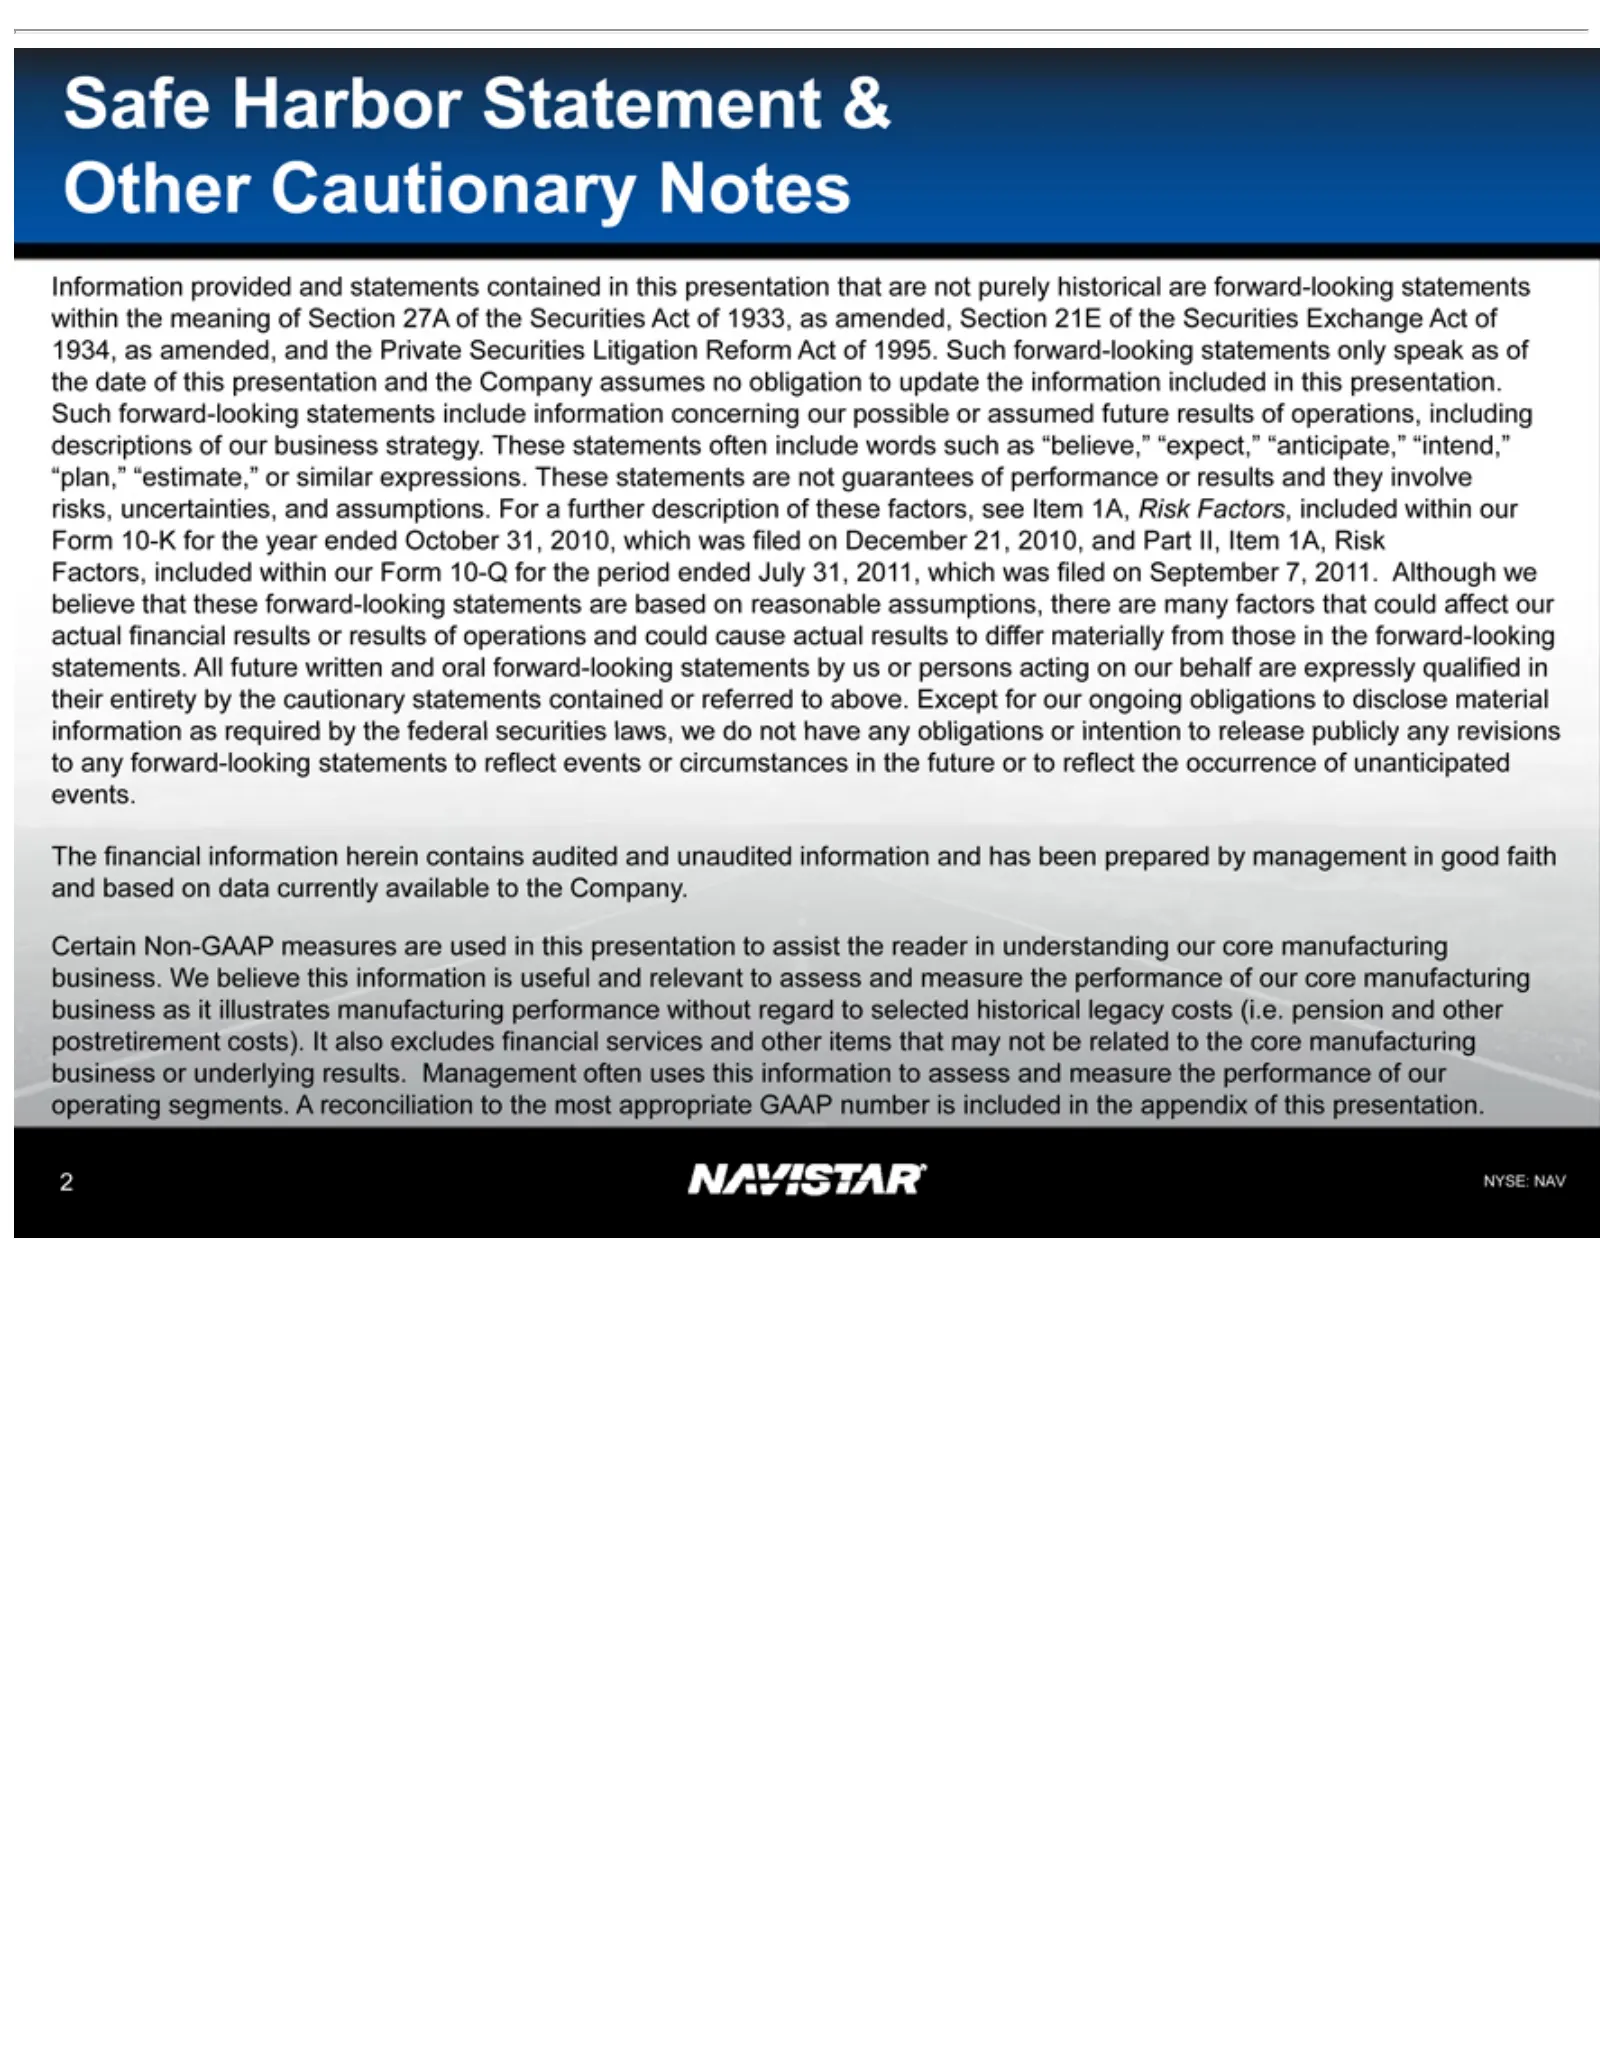
Slide 2: Safe Harbor Statement and Non-GAAP Information
Safe Information Section Company descriptions which forward-looking in to looking The Certain performance services reconciliation 2N YSE: thefinancial above. Harbor forward-looking was NAV Non-GAAP 21E statements and Except assumes filed provided of Statement other or of information toour the result
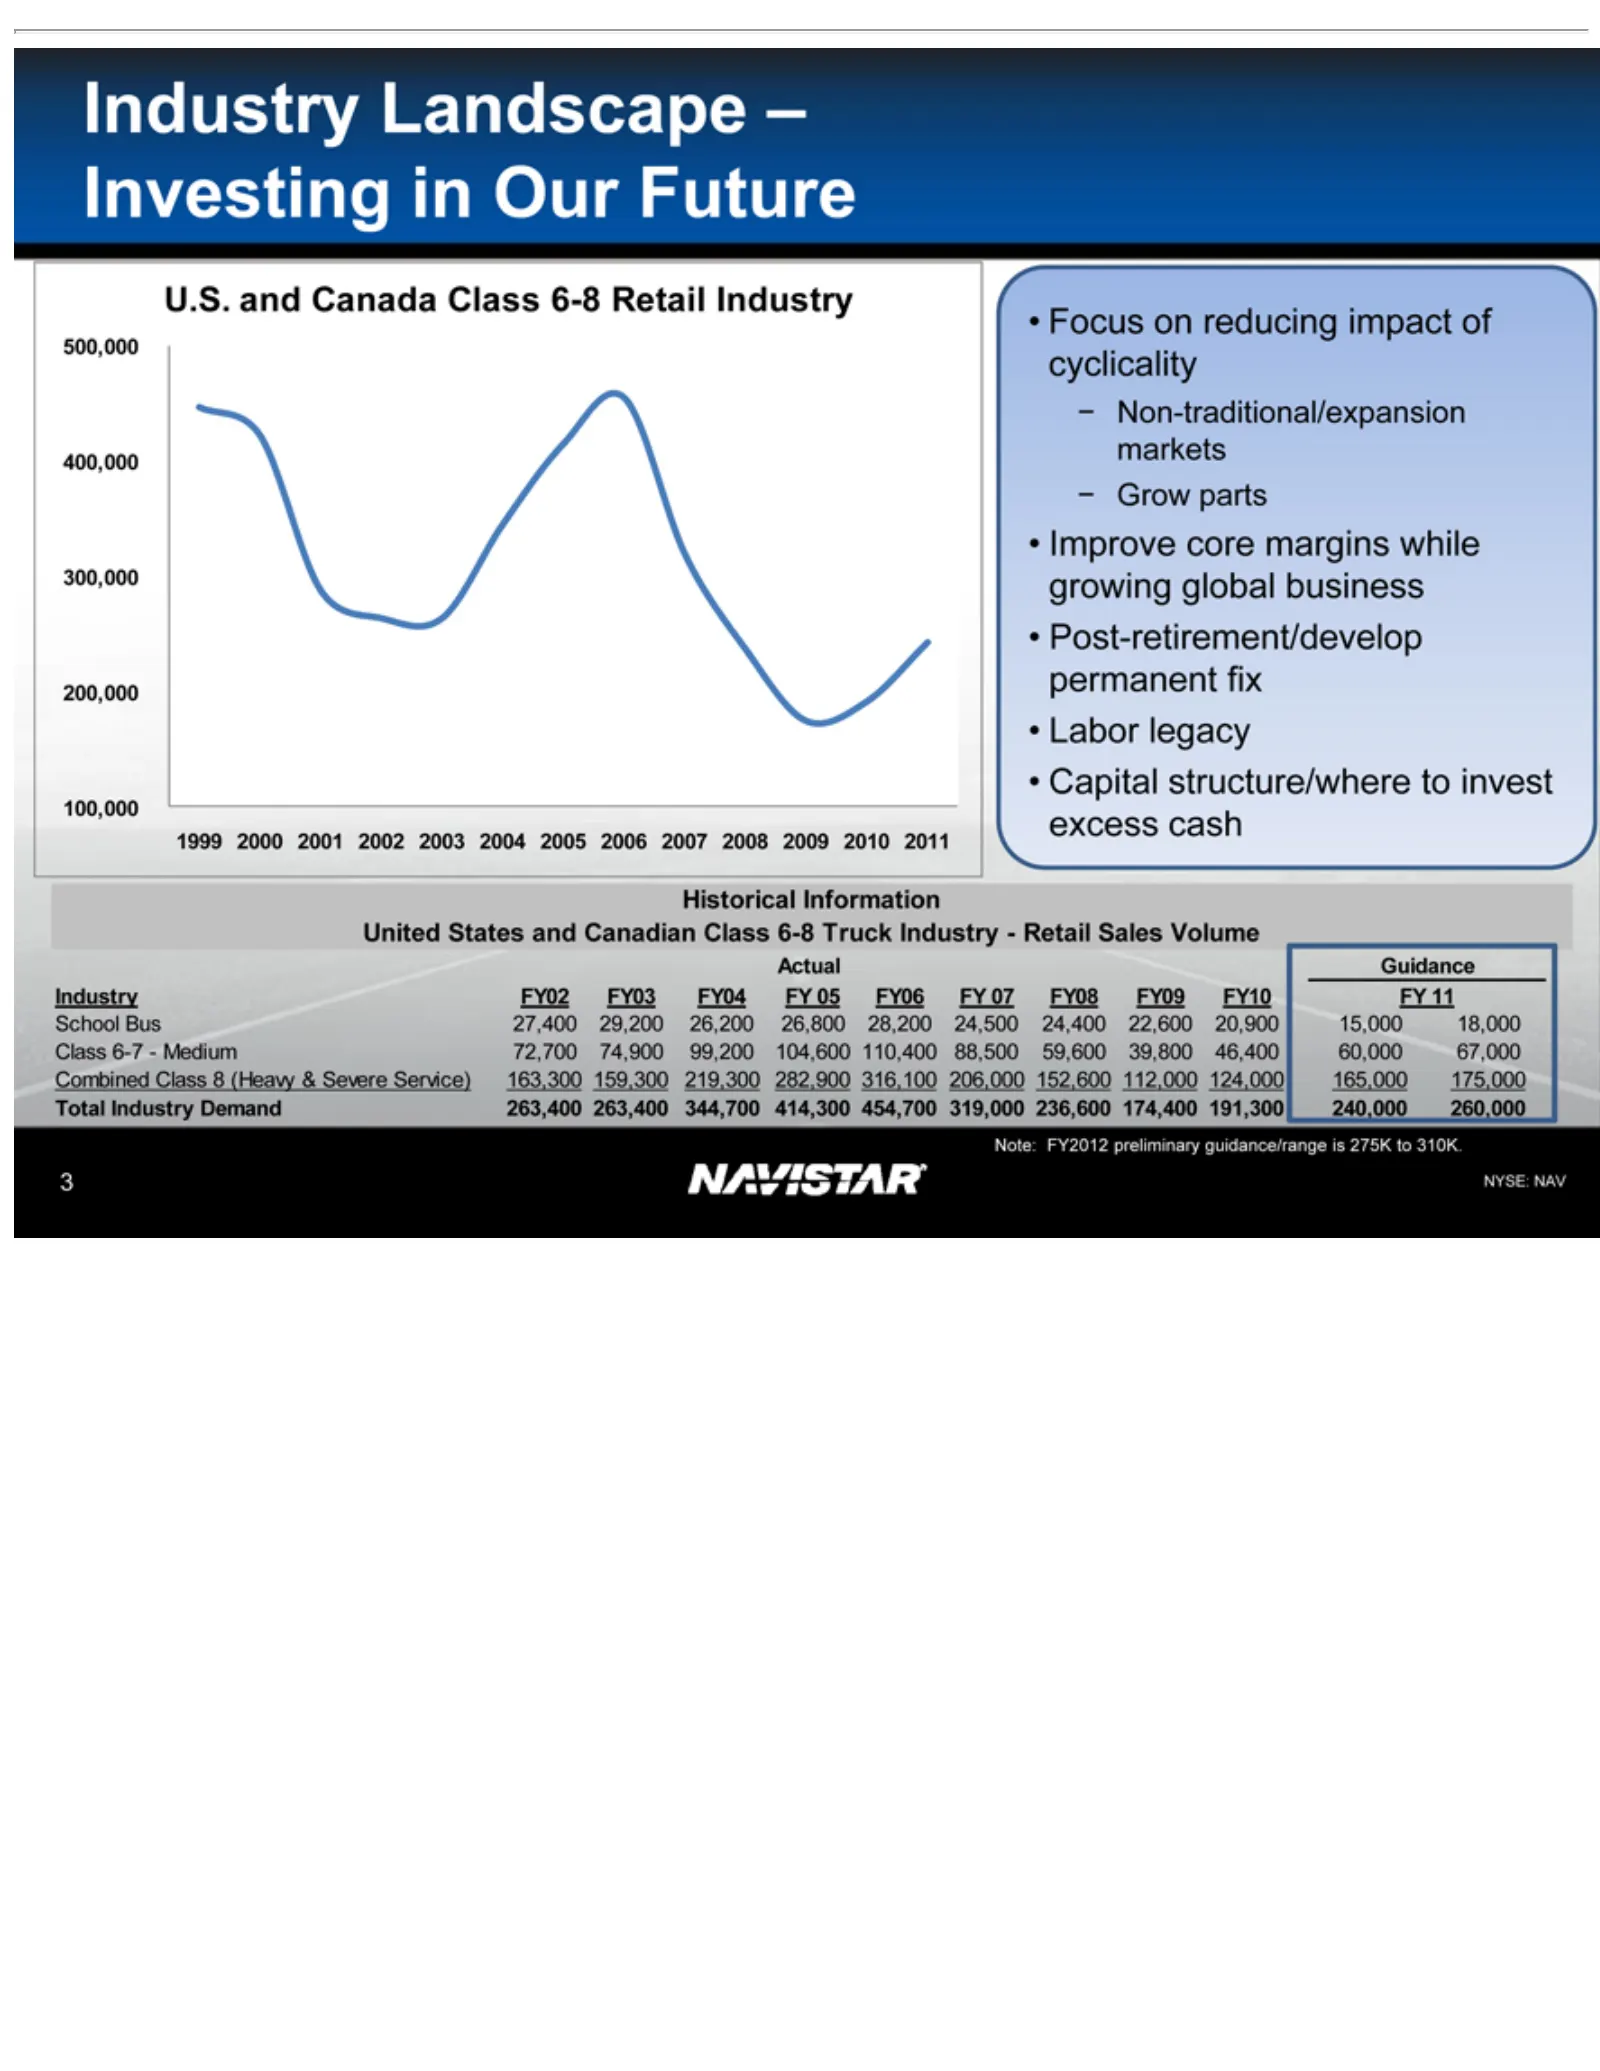
Slide 3: U.S. and Canada Historical Industry Landscape
U.S. 500,000 •–1999 Historical United Actual Industry School Class Combined Total Note: 3NYSE: Focus Improve Post-retirement/develop Labor Capital Non-traditional/expansion Grow and 2000 Industry 6-7 FY2012 Guidance States Bus NAV legacy on parts 400,000 Landscape FY02 Canada structure/where -Inform
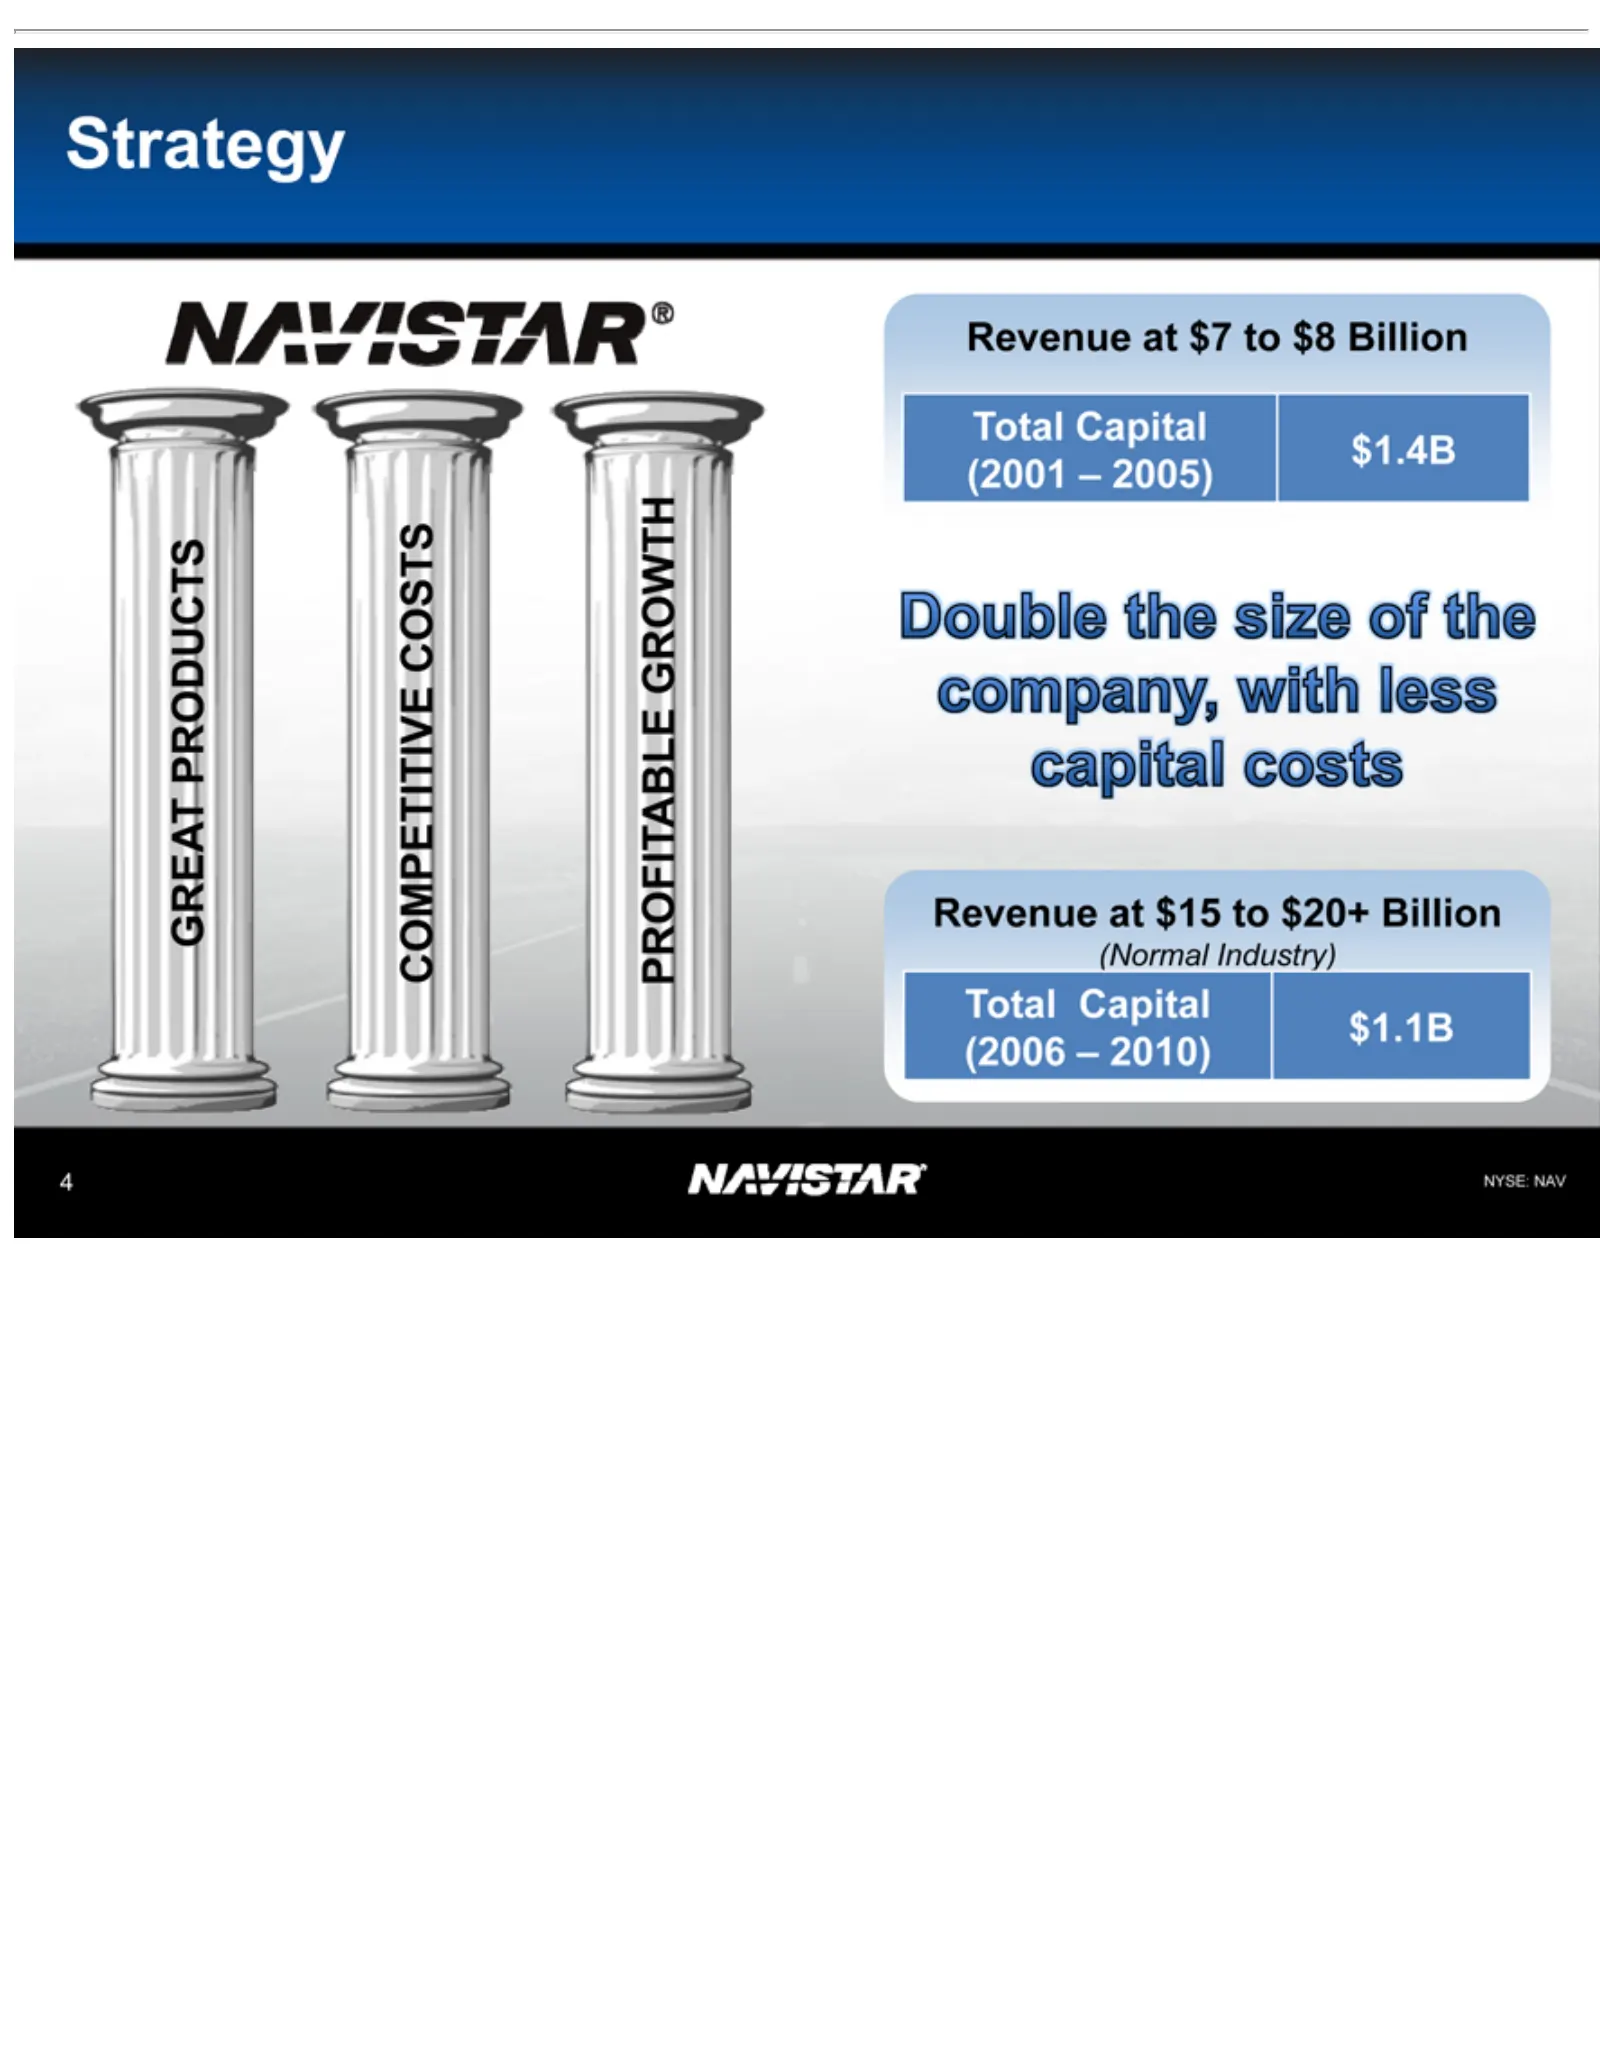
Slide 4: Great Products, Competitive Costs, Profitable Growth Strategy
GREAT Strategy COMPETITIVE PROFITABLE (2001 Double Revenue (Normal Total (2006 4N YSE: Capital – NAV the 2005) 2010) PRODUCTS Industry) at Size $7$1.1B $15 $1.4B to GROWTH to of COSTS $8$20+ the Billion company, Billion with less capital costs
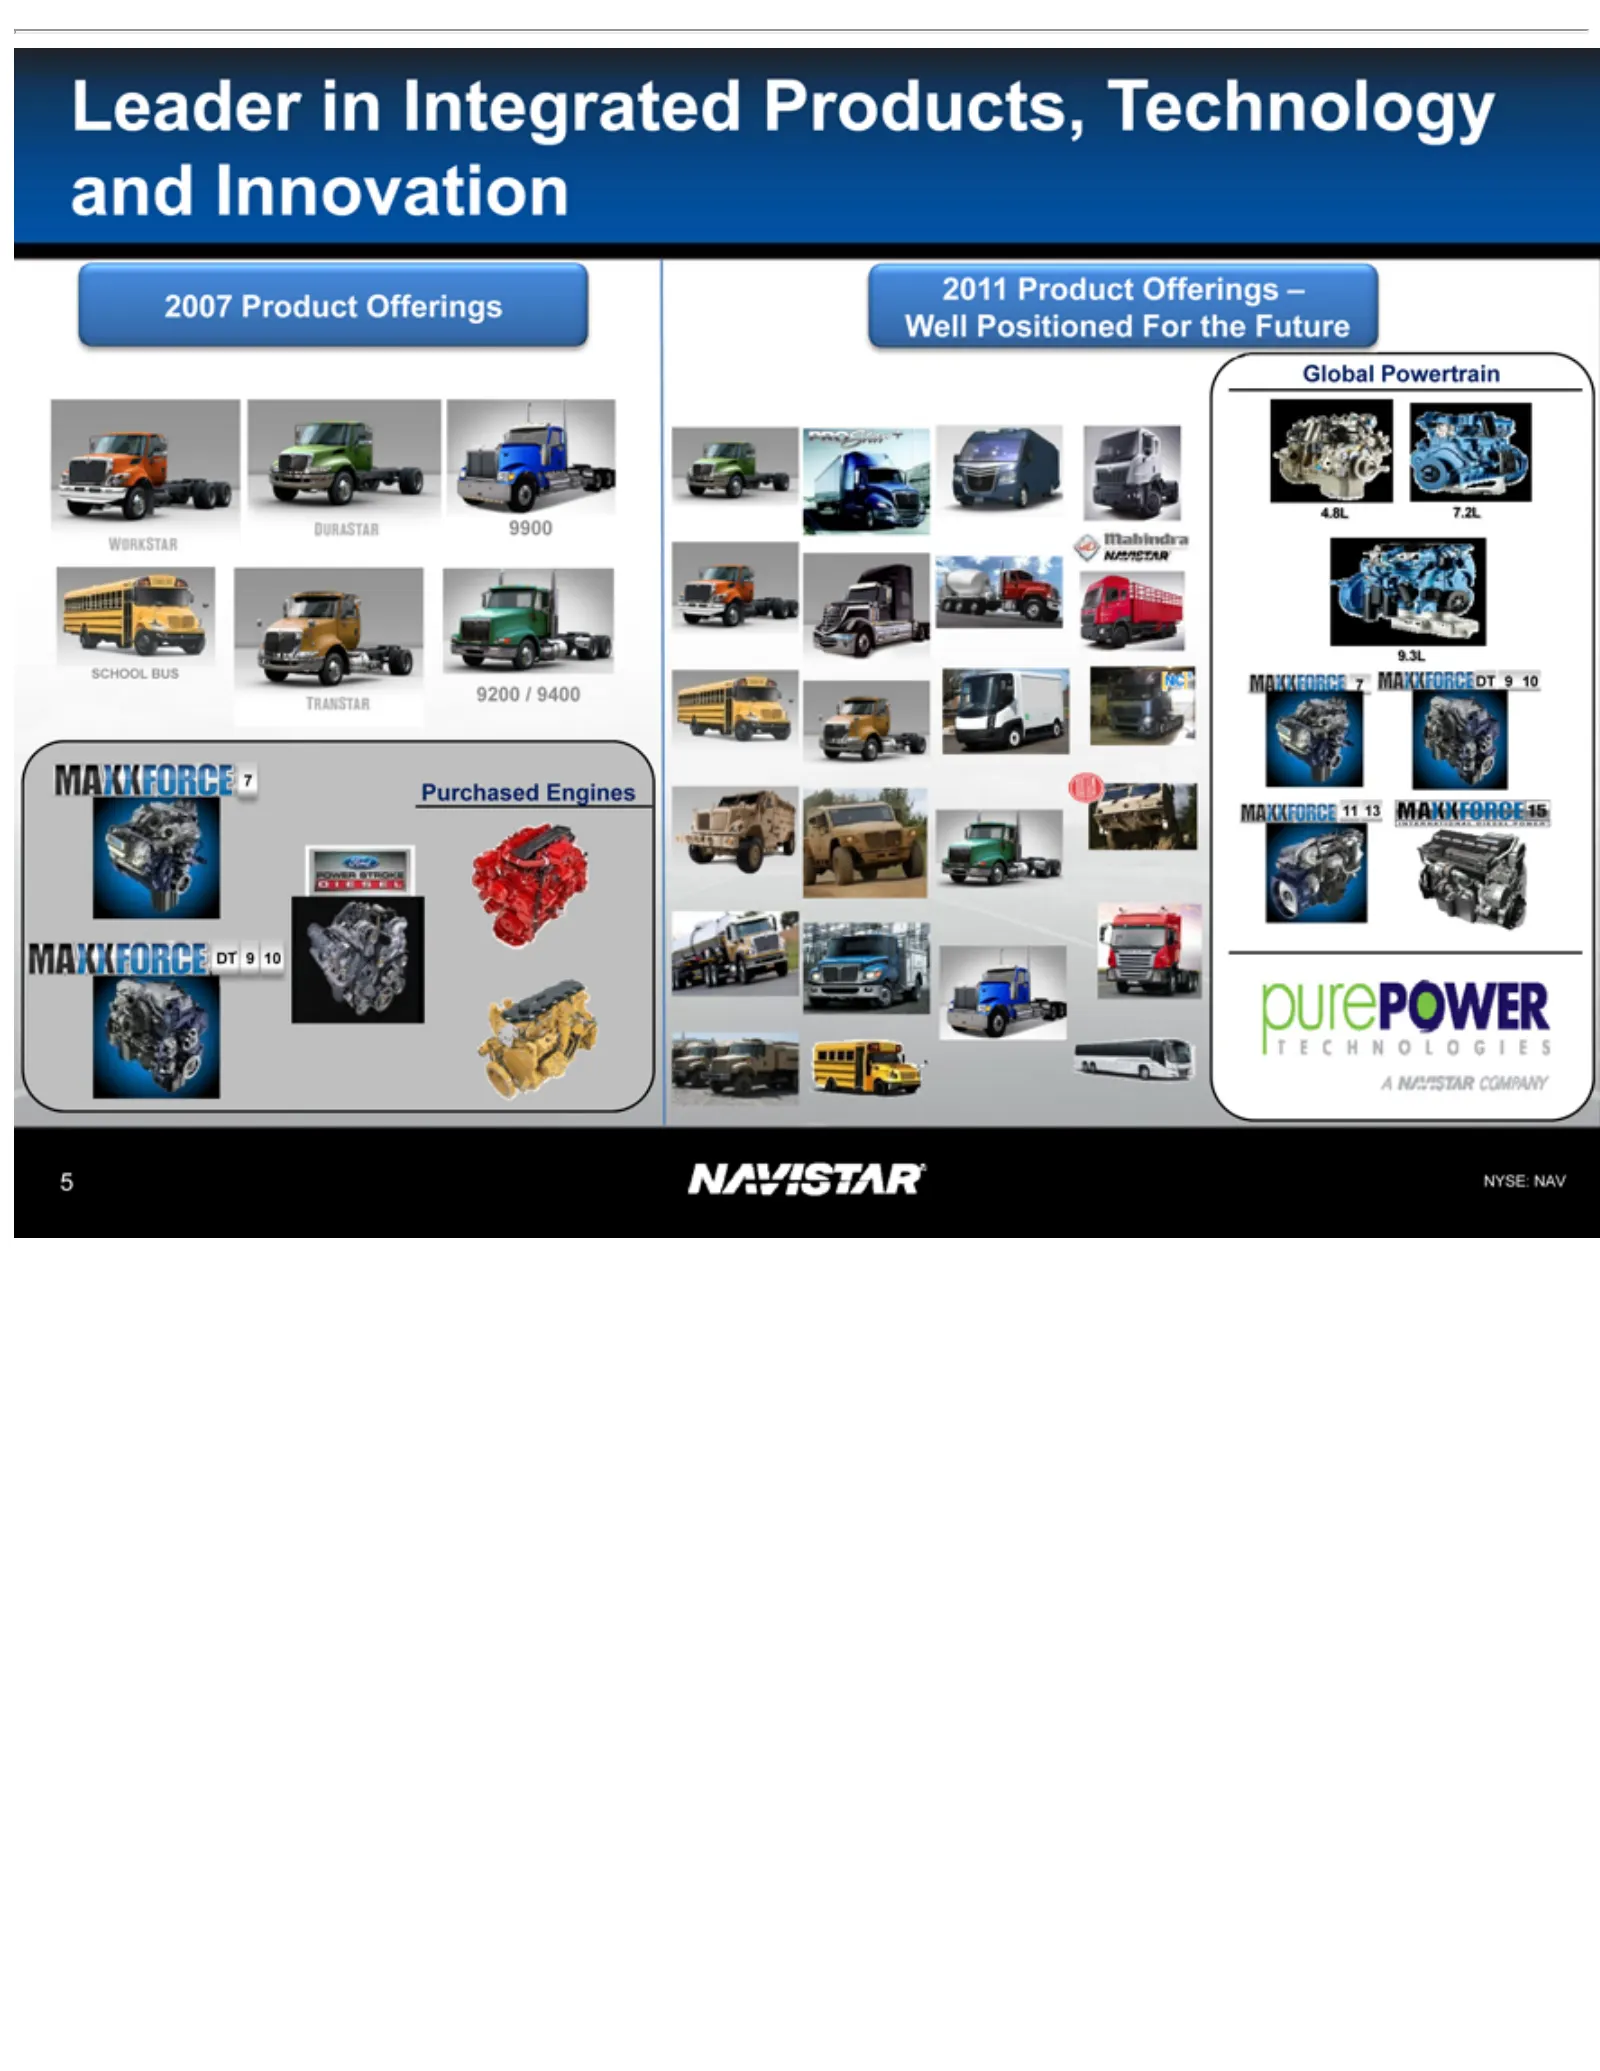
Slide 5: Global Leader in Powertrain: Well Positioned for the Future
Leader 2007 P DT 2011 Global 7D 9.3L 7.2L 4.8L 11 5Nurchased T13 YSE: 9 Product 10Powertrain in NAVIntegrated Engines Offerings Products, –Well Positioned TechnologyFor andthe Innovation Future
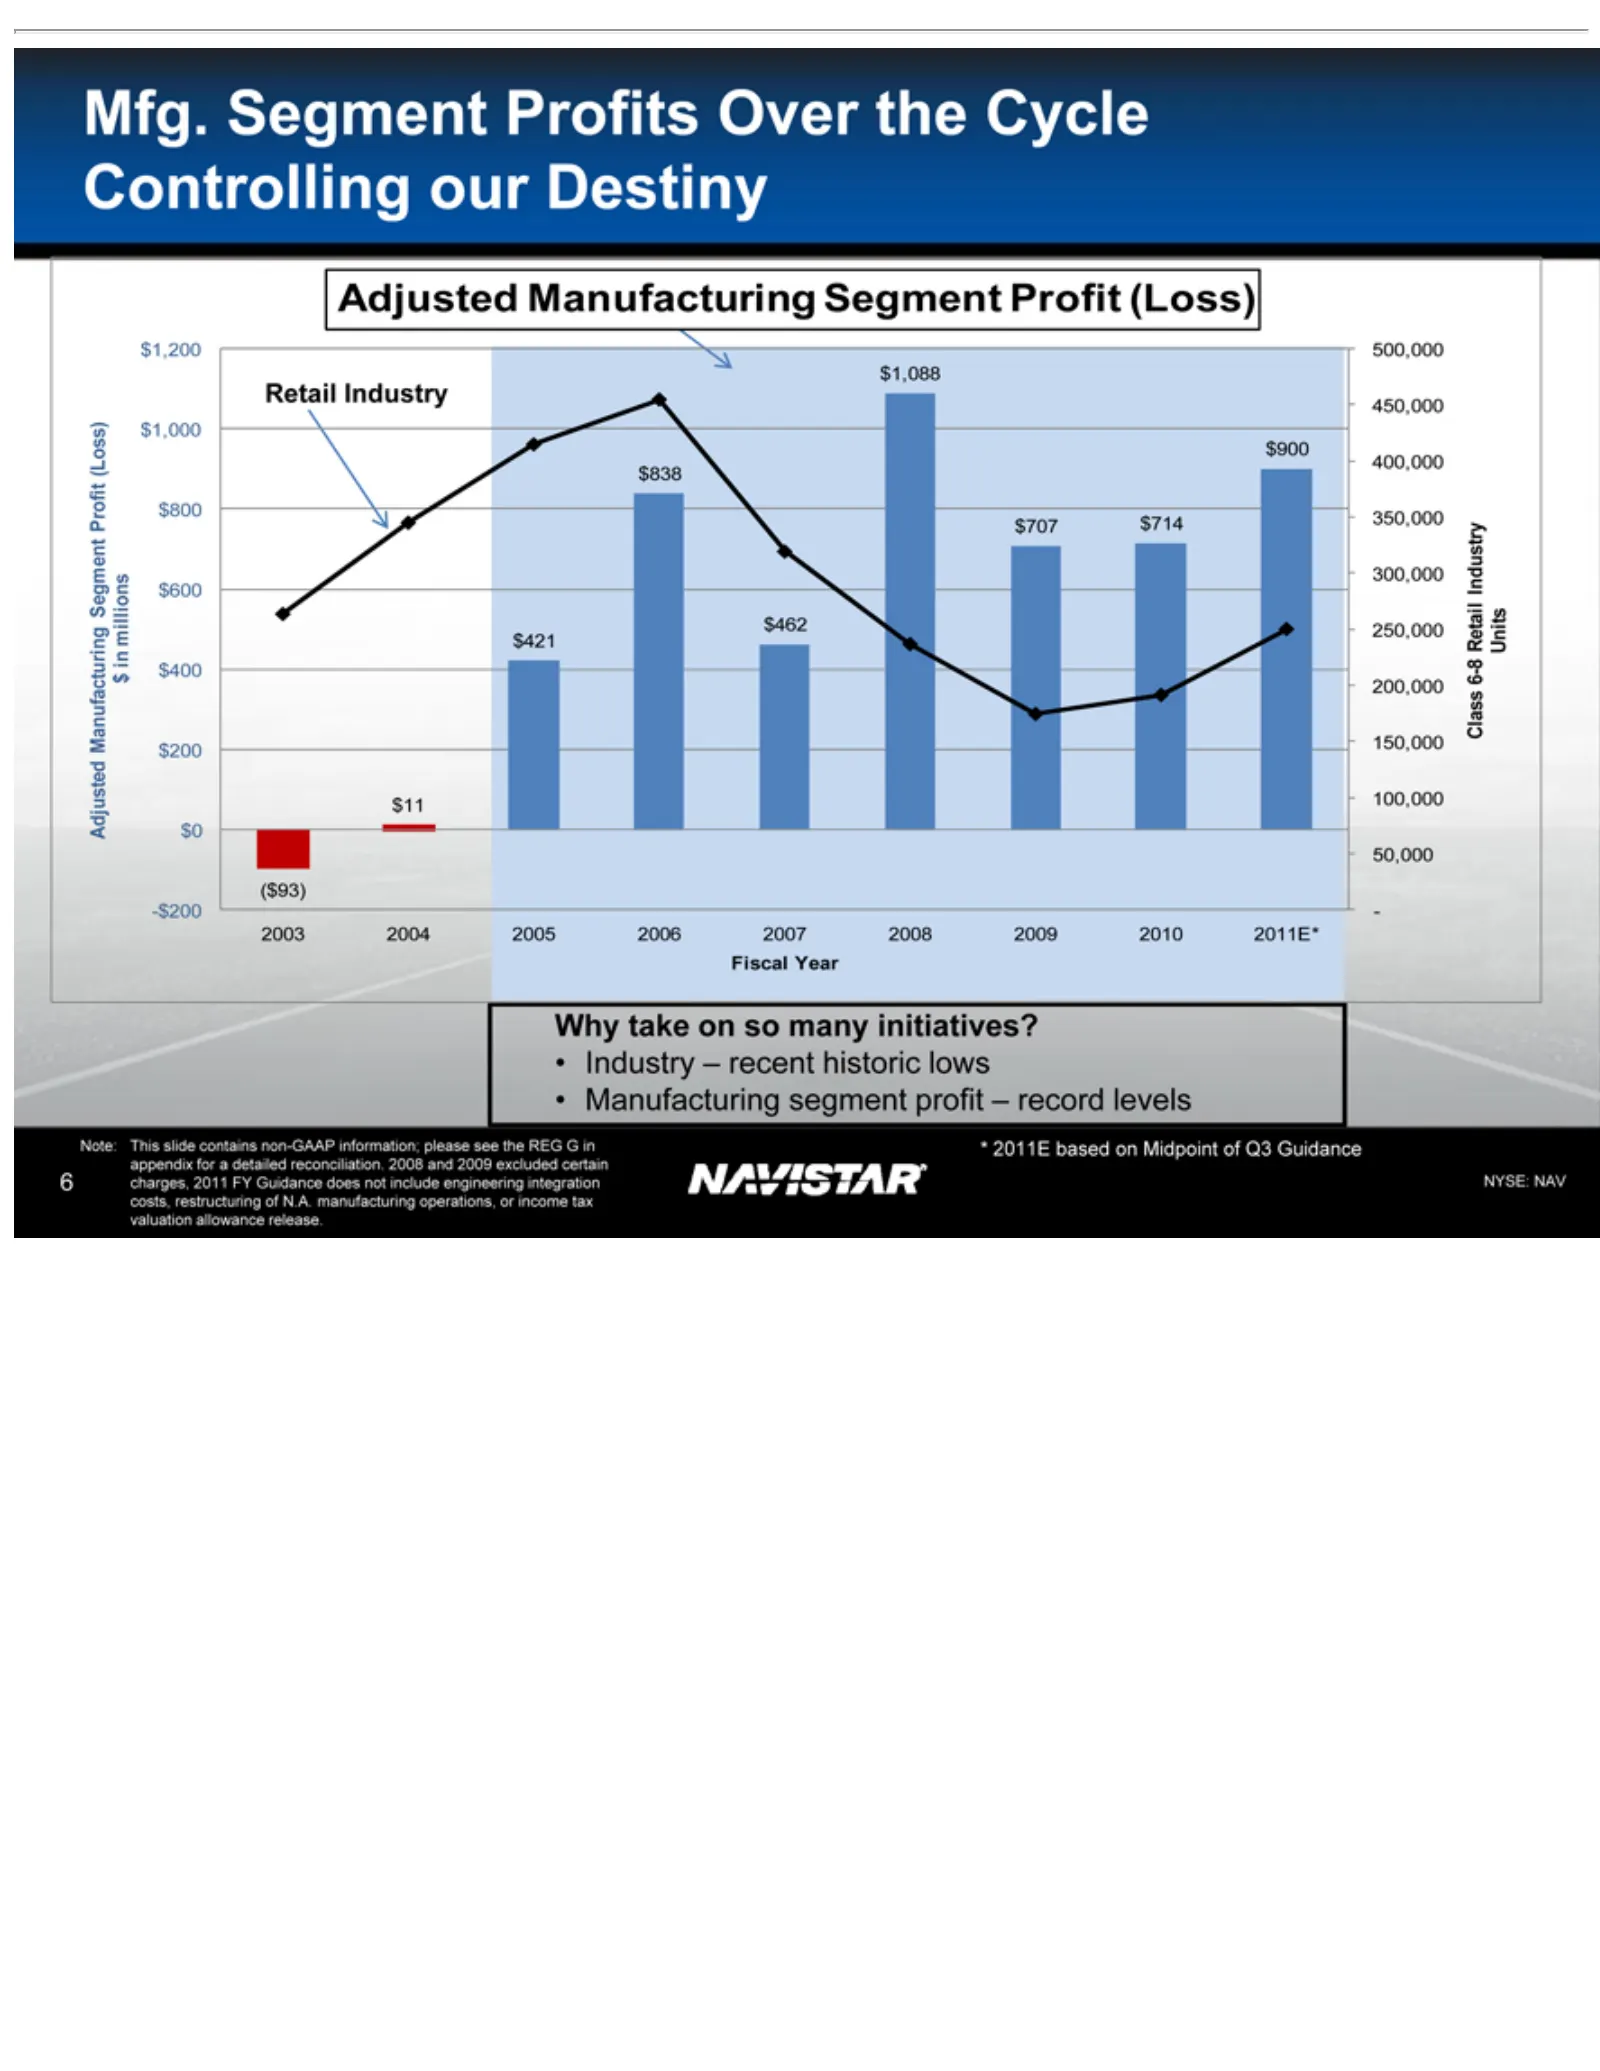
Slide 6: Manufacturing Adjusted Segment Profit and Retail
Mfg. Adjusted $1,200 Retail -$200 2003 $900 $714 $707 $1,088 $462 $838 $421 $11 ($93) Fiscal 500,000 Class •Why 6N *costs, NYSE: Industry Manufacturing ote: 2011E take Segment 2004 6-8 This restructuring Year Industry $1,000 NAV 450,000 based Manufacturing Retail on –slide 2005 recent soProfits $800
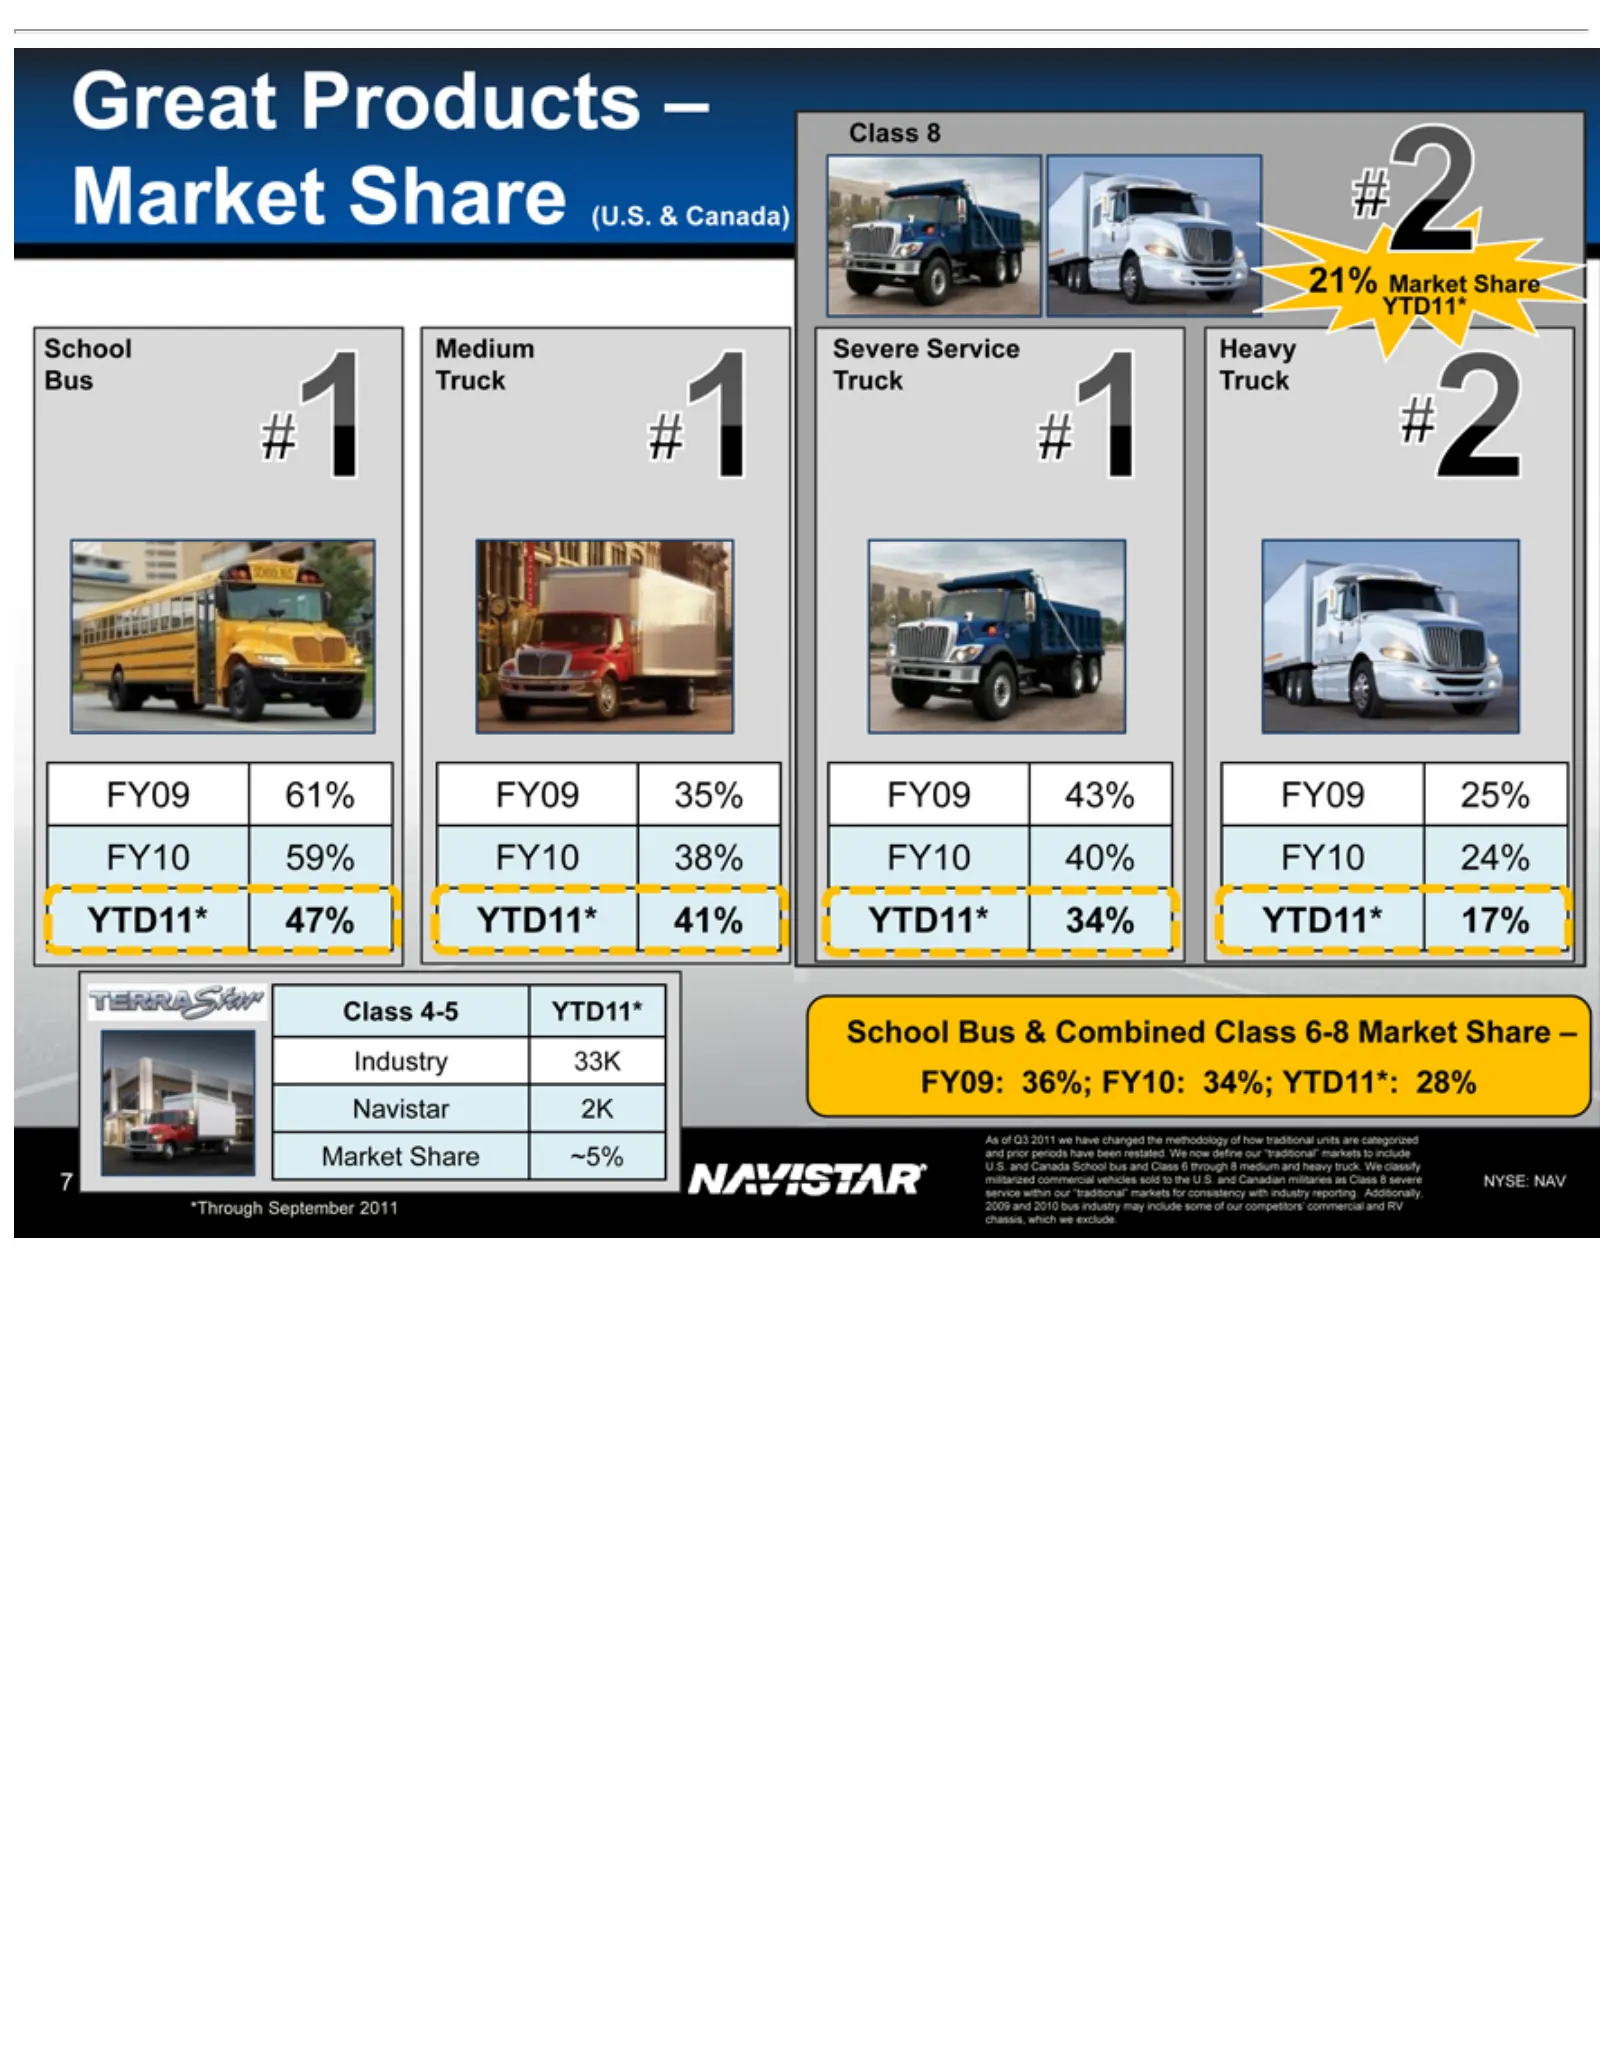
Slide 7: Market Share in Medium, Heavy and School Bus
Great 21% Medium Severe Heavy FY09 FY10 YTD11* Industry Navistar Market 7*School As Class militarized include NYSE: Through ofYTD11* 8Q3 4-5 6Products 61% 59% 35% 38% 43% 40% 25% 24% Truck Service Bus Share NAV through some 33K Truck 2K 47% 41% 34% 17% 2011 YTD11* September commercial &of (U.S. ~5%
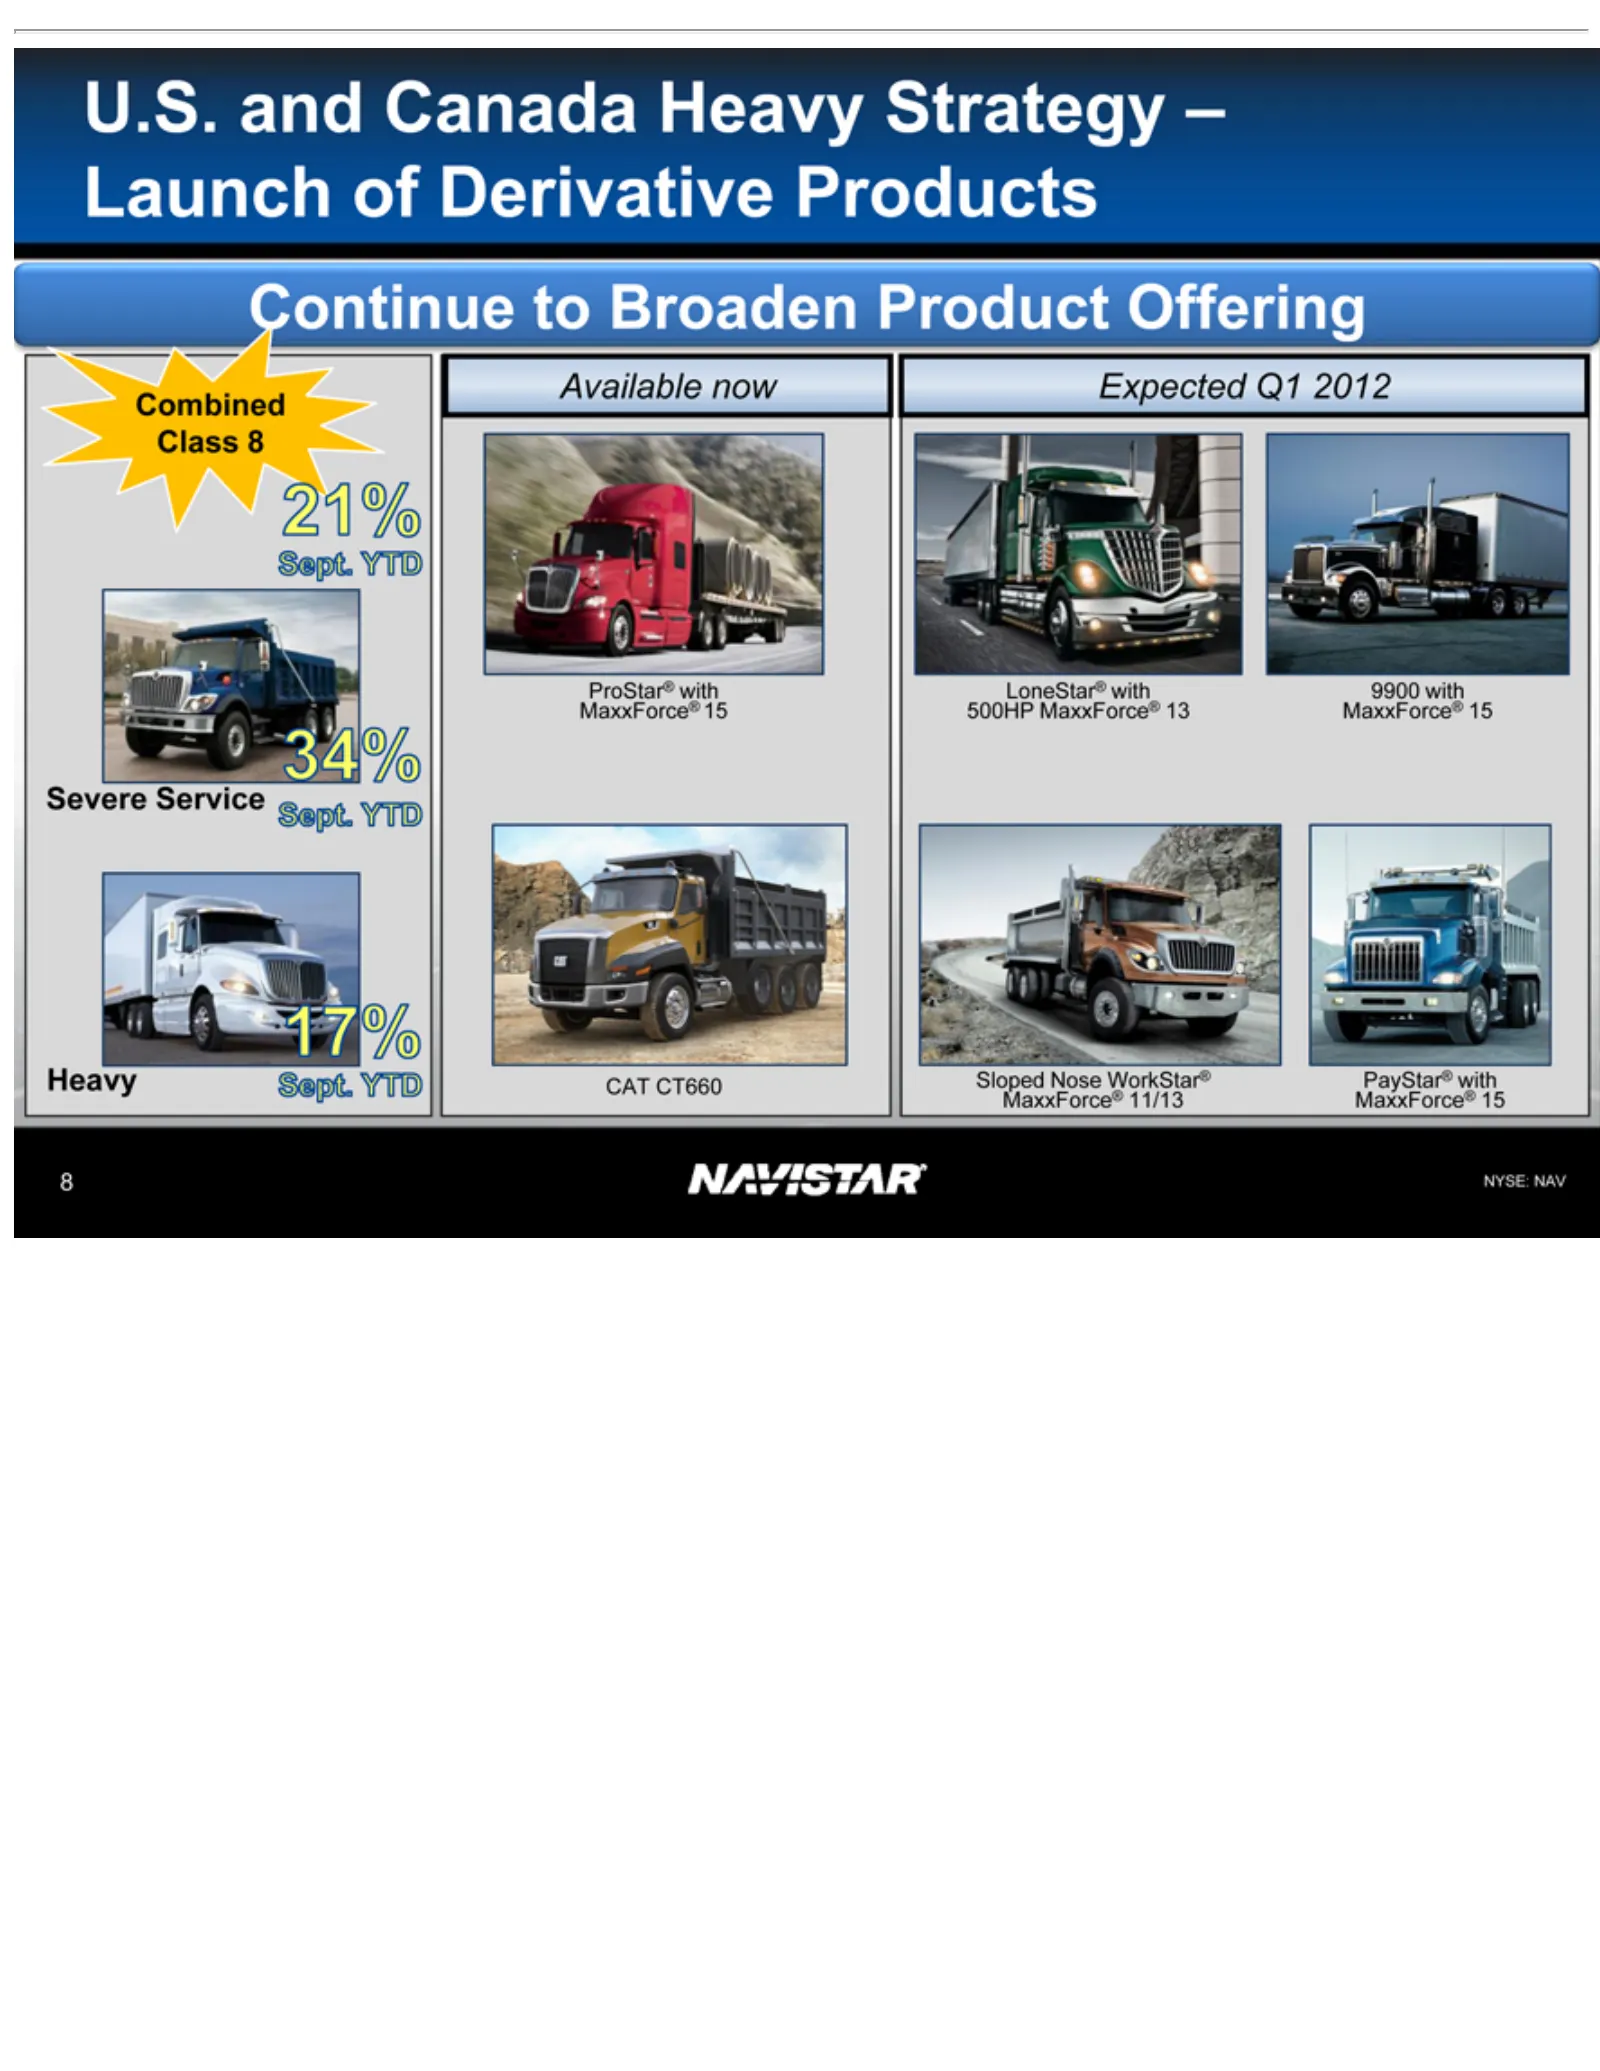
Slide 8: Continue to Broaden Product Offering
U.S. Continue Combined Severe Available Heavy Expected ProStar® LoneStar® MaxxForce CAT Sloped PayStar® 8N YSE: and CT660 Service Nose NAV Canada to Q1 with now with Class with 9900 Broaden WorkStar® 2012 MaxxForce® MaxxForce® 500HP 8Heavy withProduct ®MaxxForce® Strategy MaxxForce® 15 15 15 Offerin
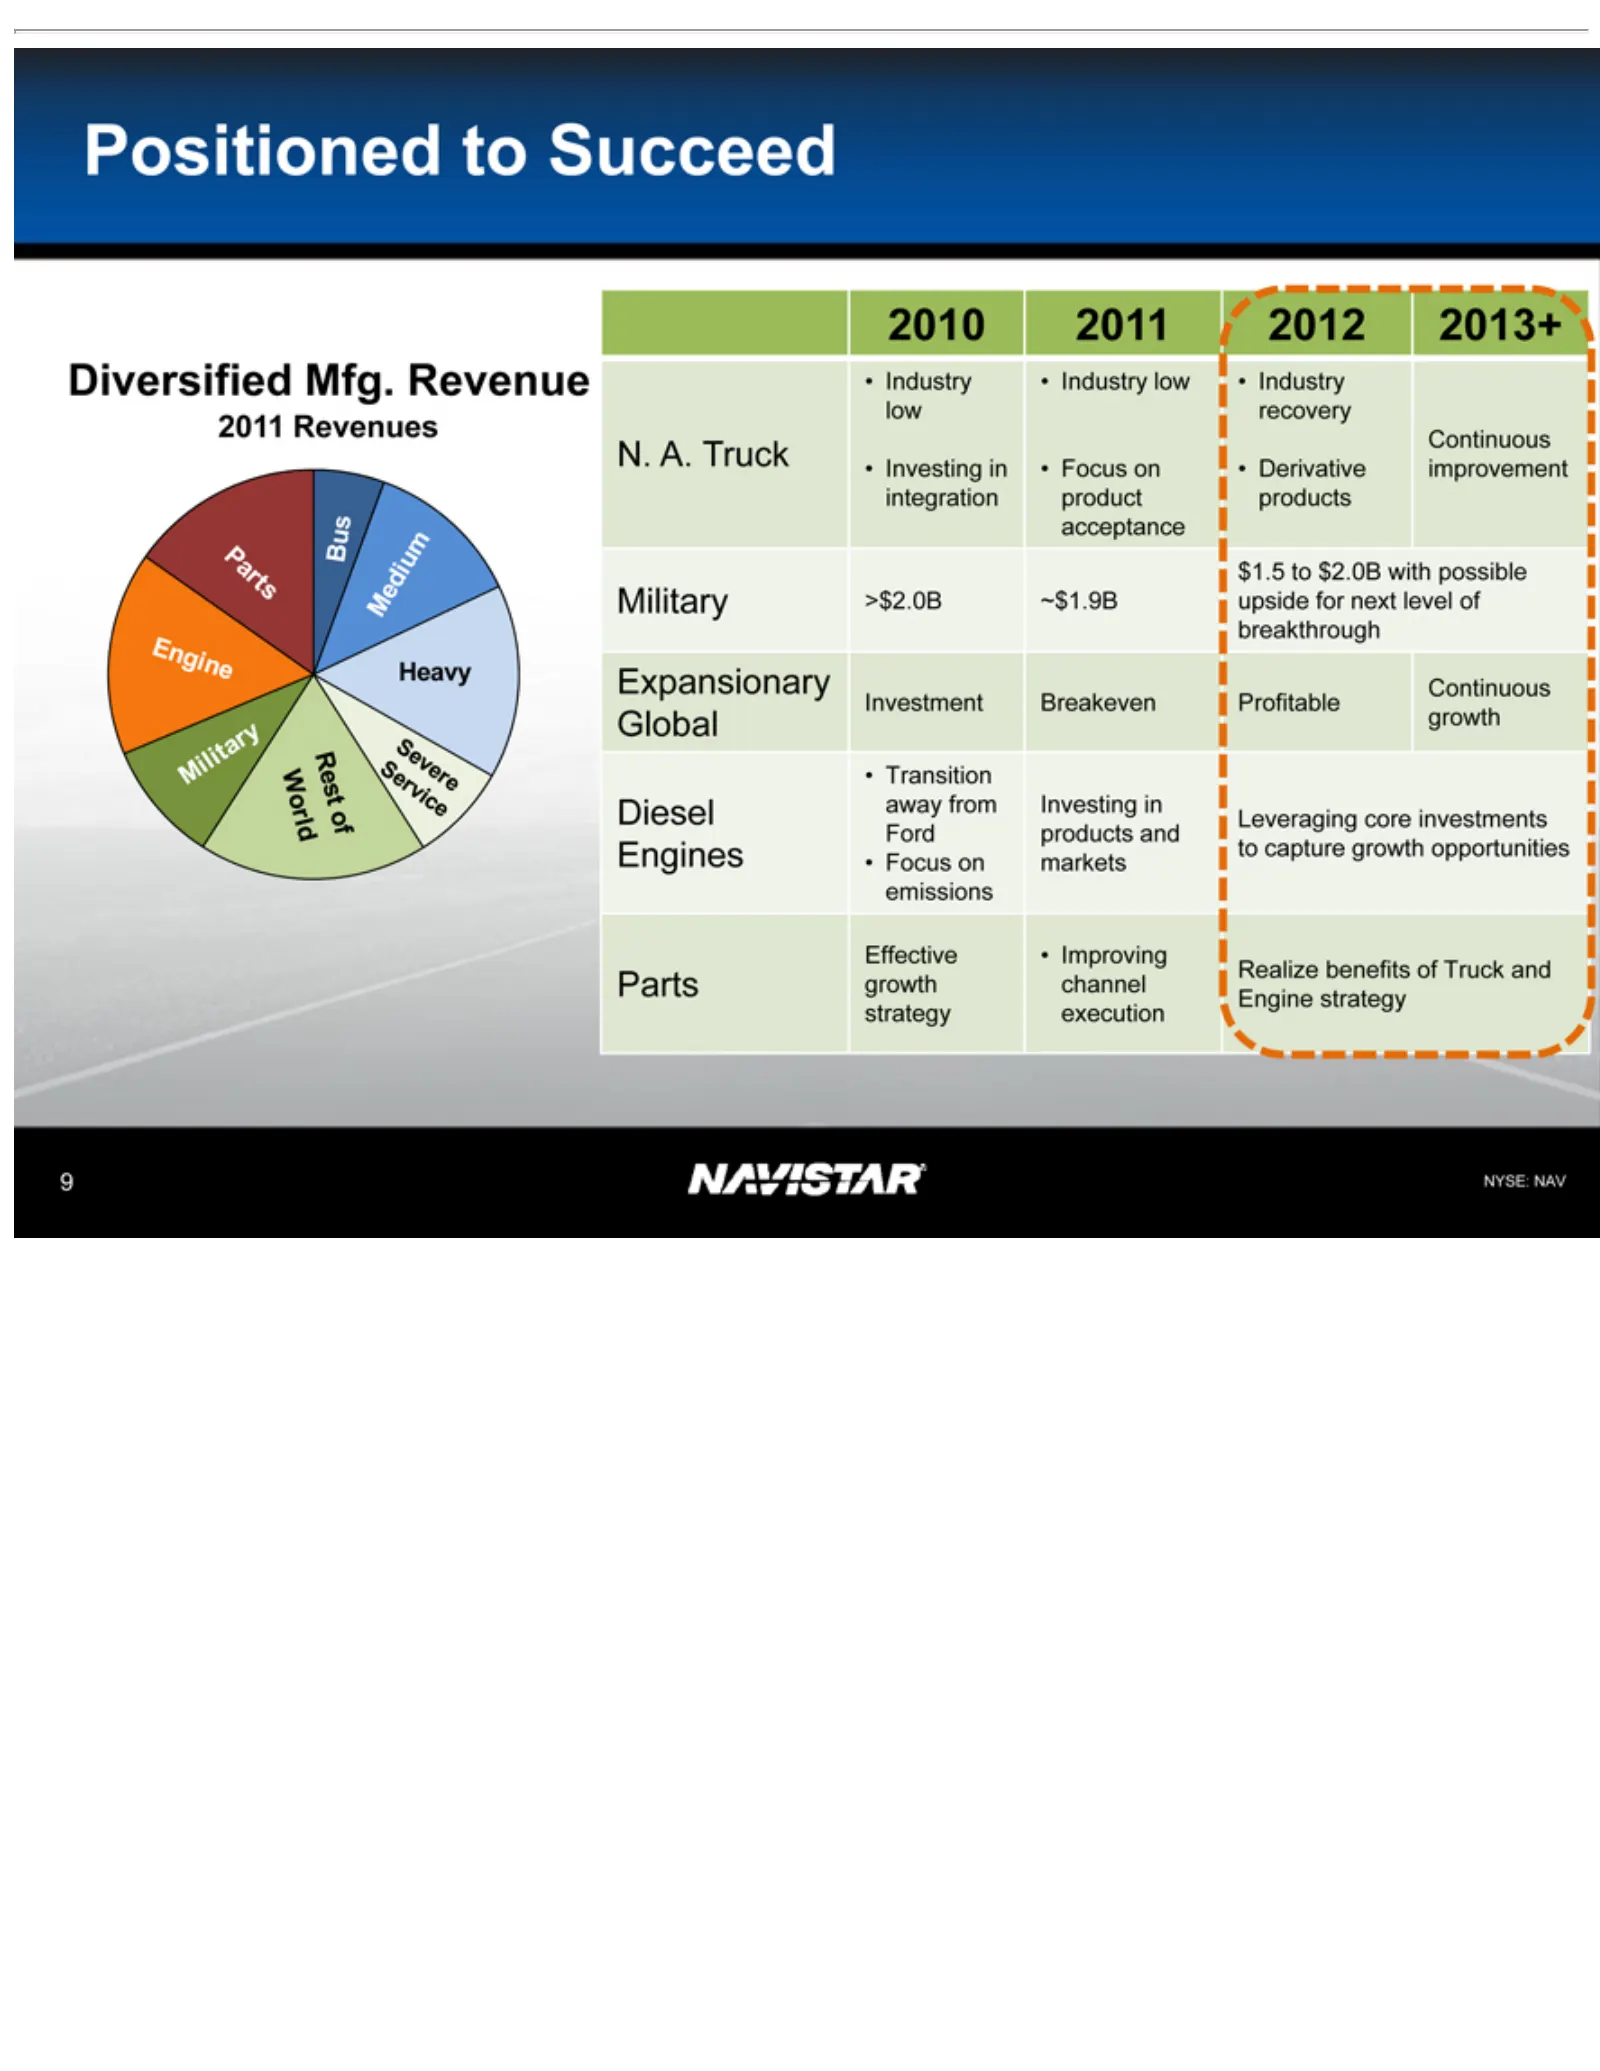
Slide 9: Positioned for Diversified Growth
Positioned Diversified 2011 2010 low N. integration $1.5 acceptance Military Expansionary breakthrough Investment •Global Diesel Ford Engines Effective emissions Parts strategy 9NTransition Industry Investing YSE: A.recovery to products Revenues 2011 growth Truck away growth $2.0B NAV execution •>$2
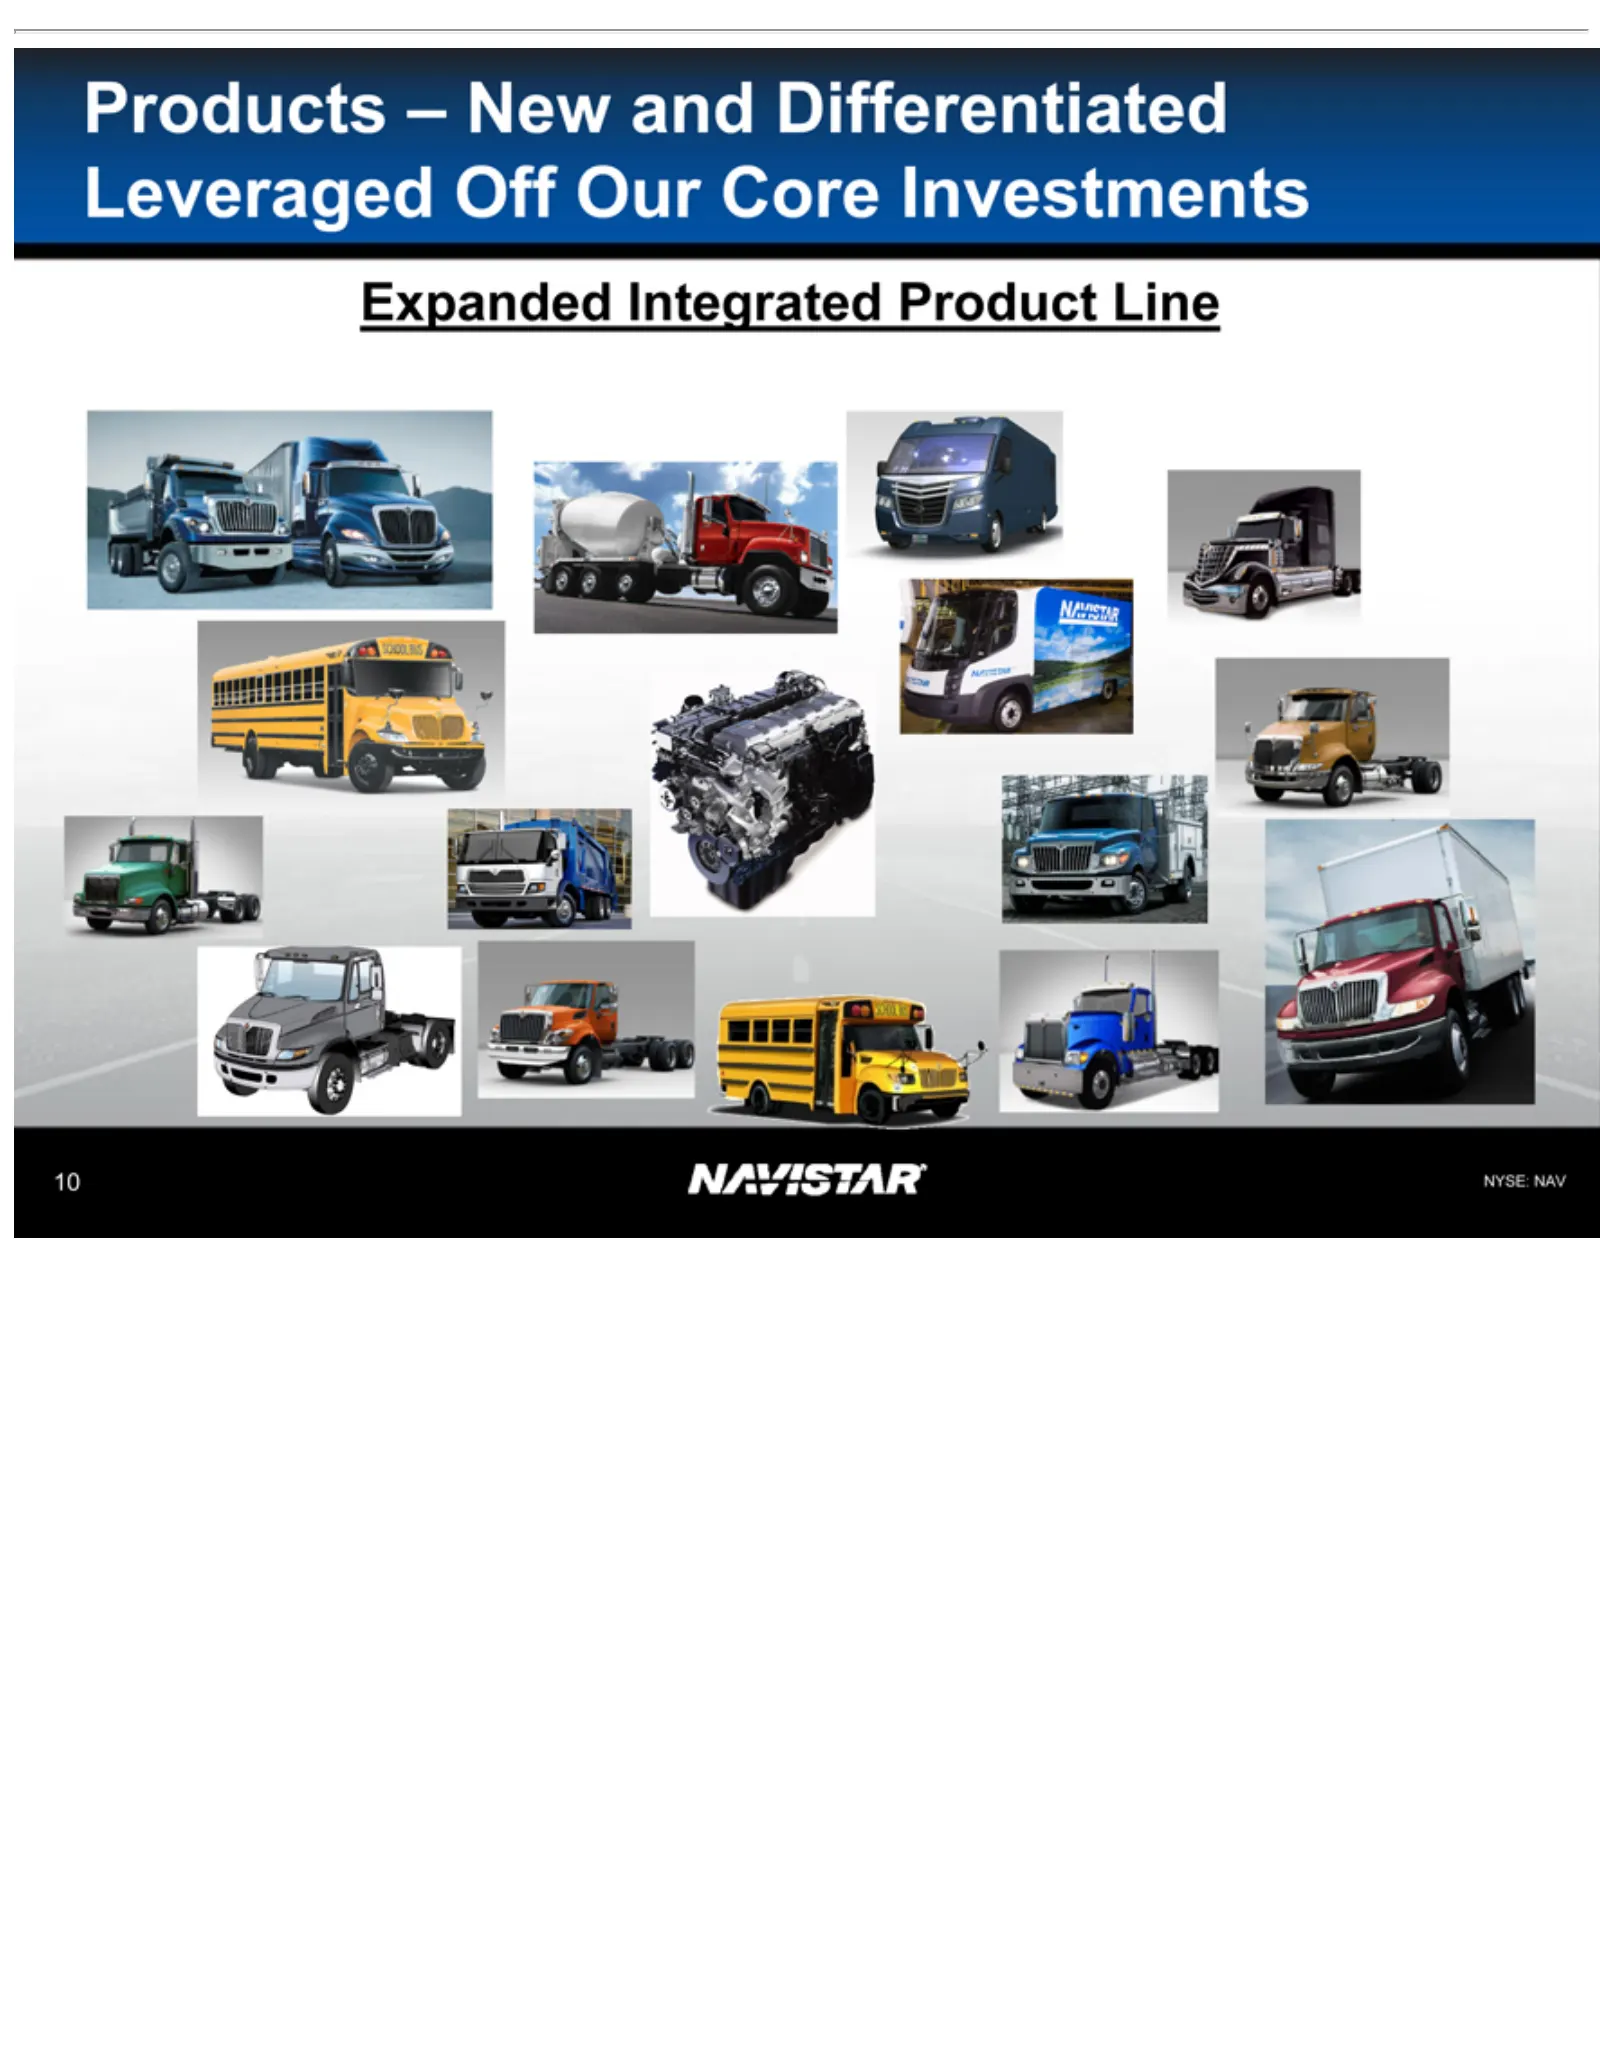
Slide 10: Expanded Integrated Product Line
ProductsNAV Expanded NYSE: 10 –Integrated New and Differentiated Product Line Leveraged Off Our Core Investments
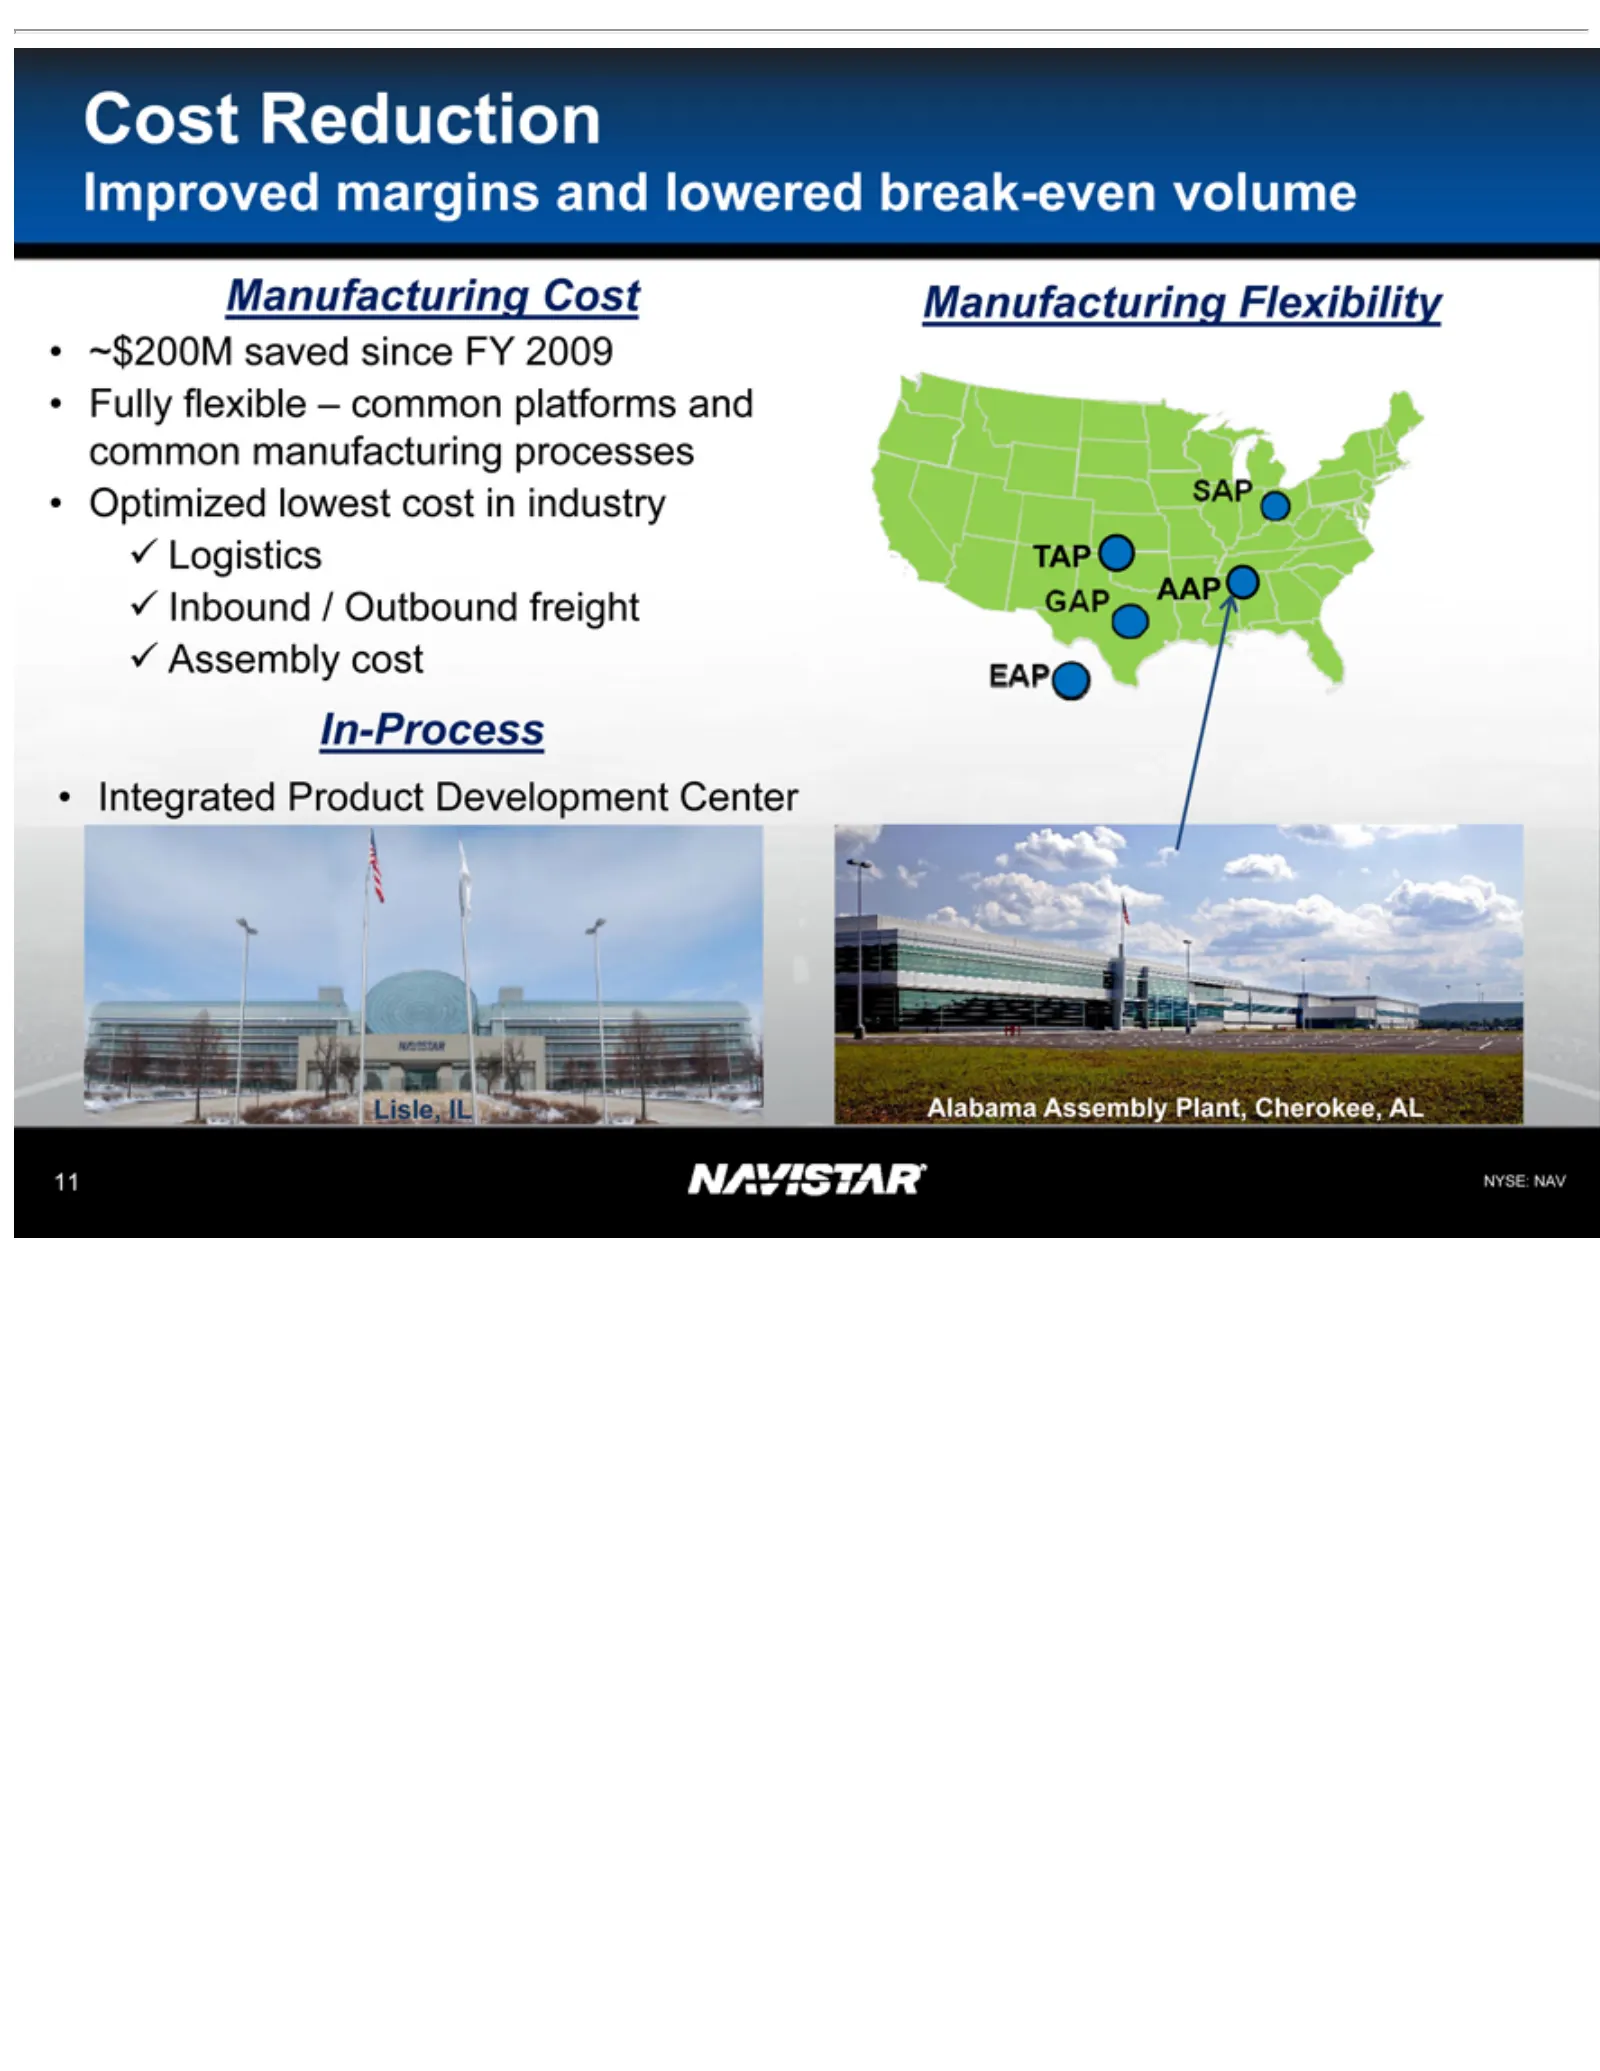
Slide 11: Improved Cost Structure and Manufacturing Flexibility
Cost Improved Inbound Logistics •Assembly In-Process Manufacturing SAP Alabama NYSE: 11~$200M Fully Optimized Integrated TAP Reduction flexible NAV /Assembly AAP Outbound margins cost saved Product lowest Cost Flexibility GAP – since common and cost Plant, Development freight EAP FY lowered in 2009
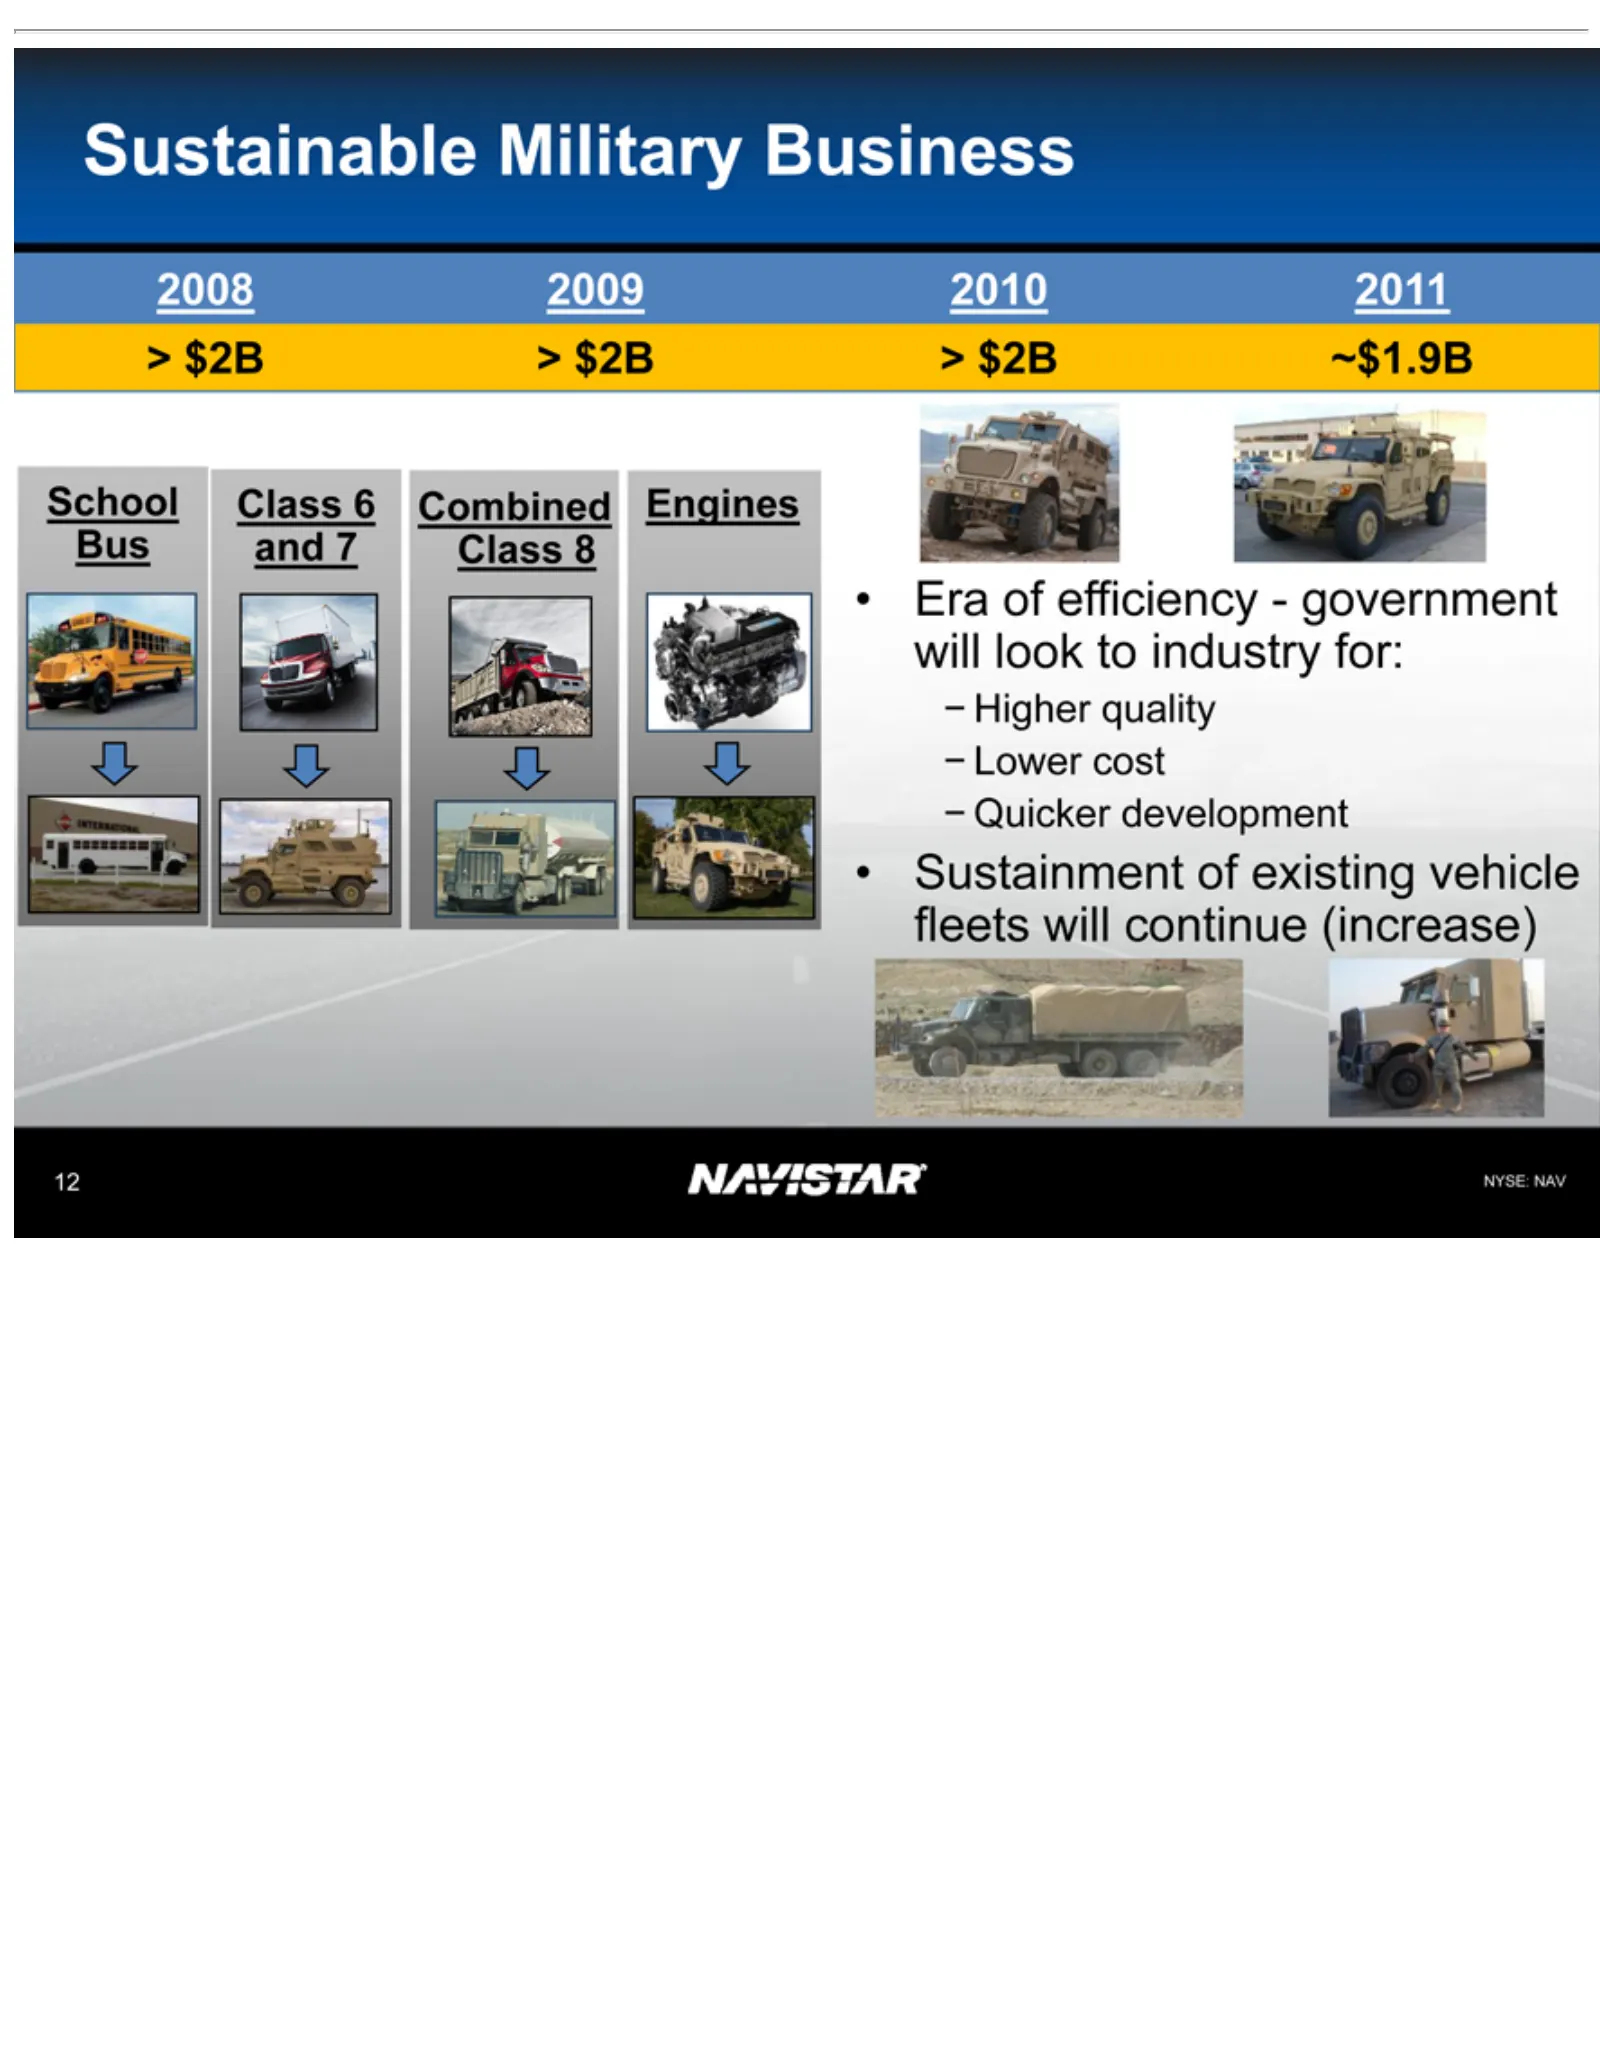
Slide 12: Sustainable Business: School Bus and Military
Sustainable 2008 > School Bus Era Higher Lower Quicker Sustainment NYSE: 12$2B of and 2009 efficiency >cost quality Class NAV development 7$2B Class 2010 Military of 6> Combined $2B existing 82011 - government ~$1.9B Business vehicle Engines will fleets look willtocontinue industry (increase) for:
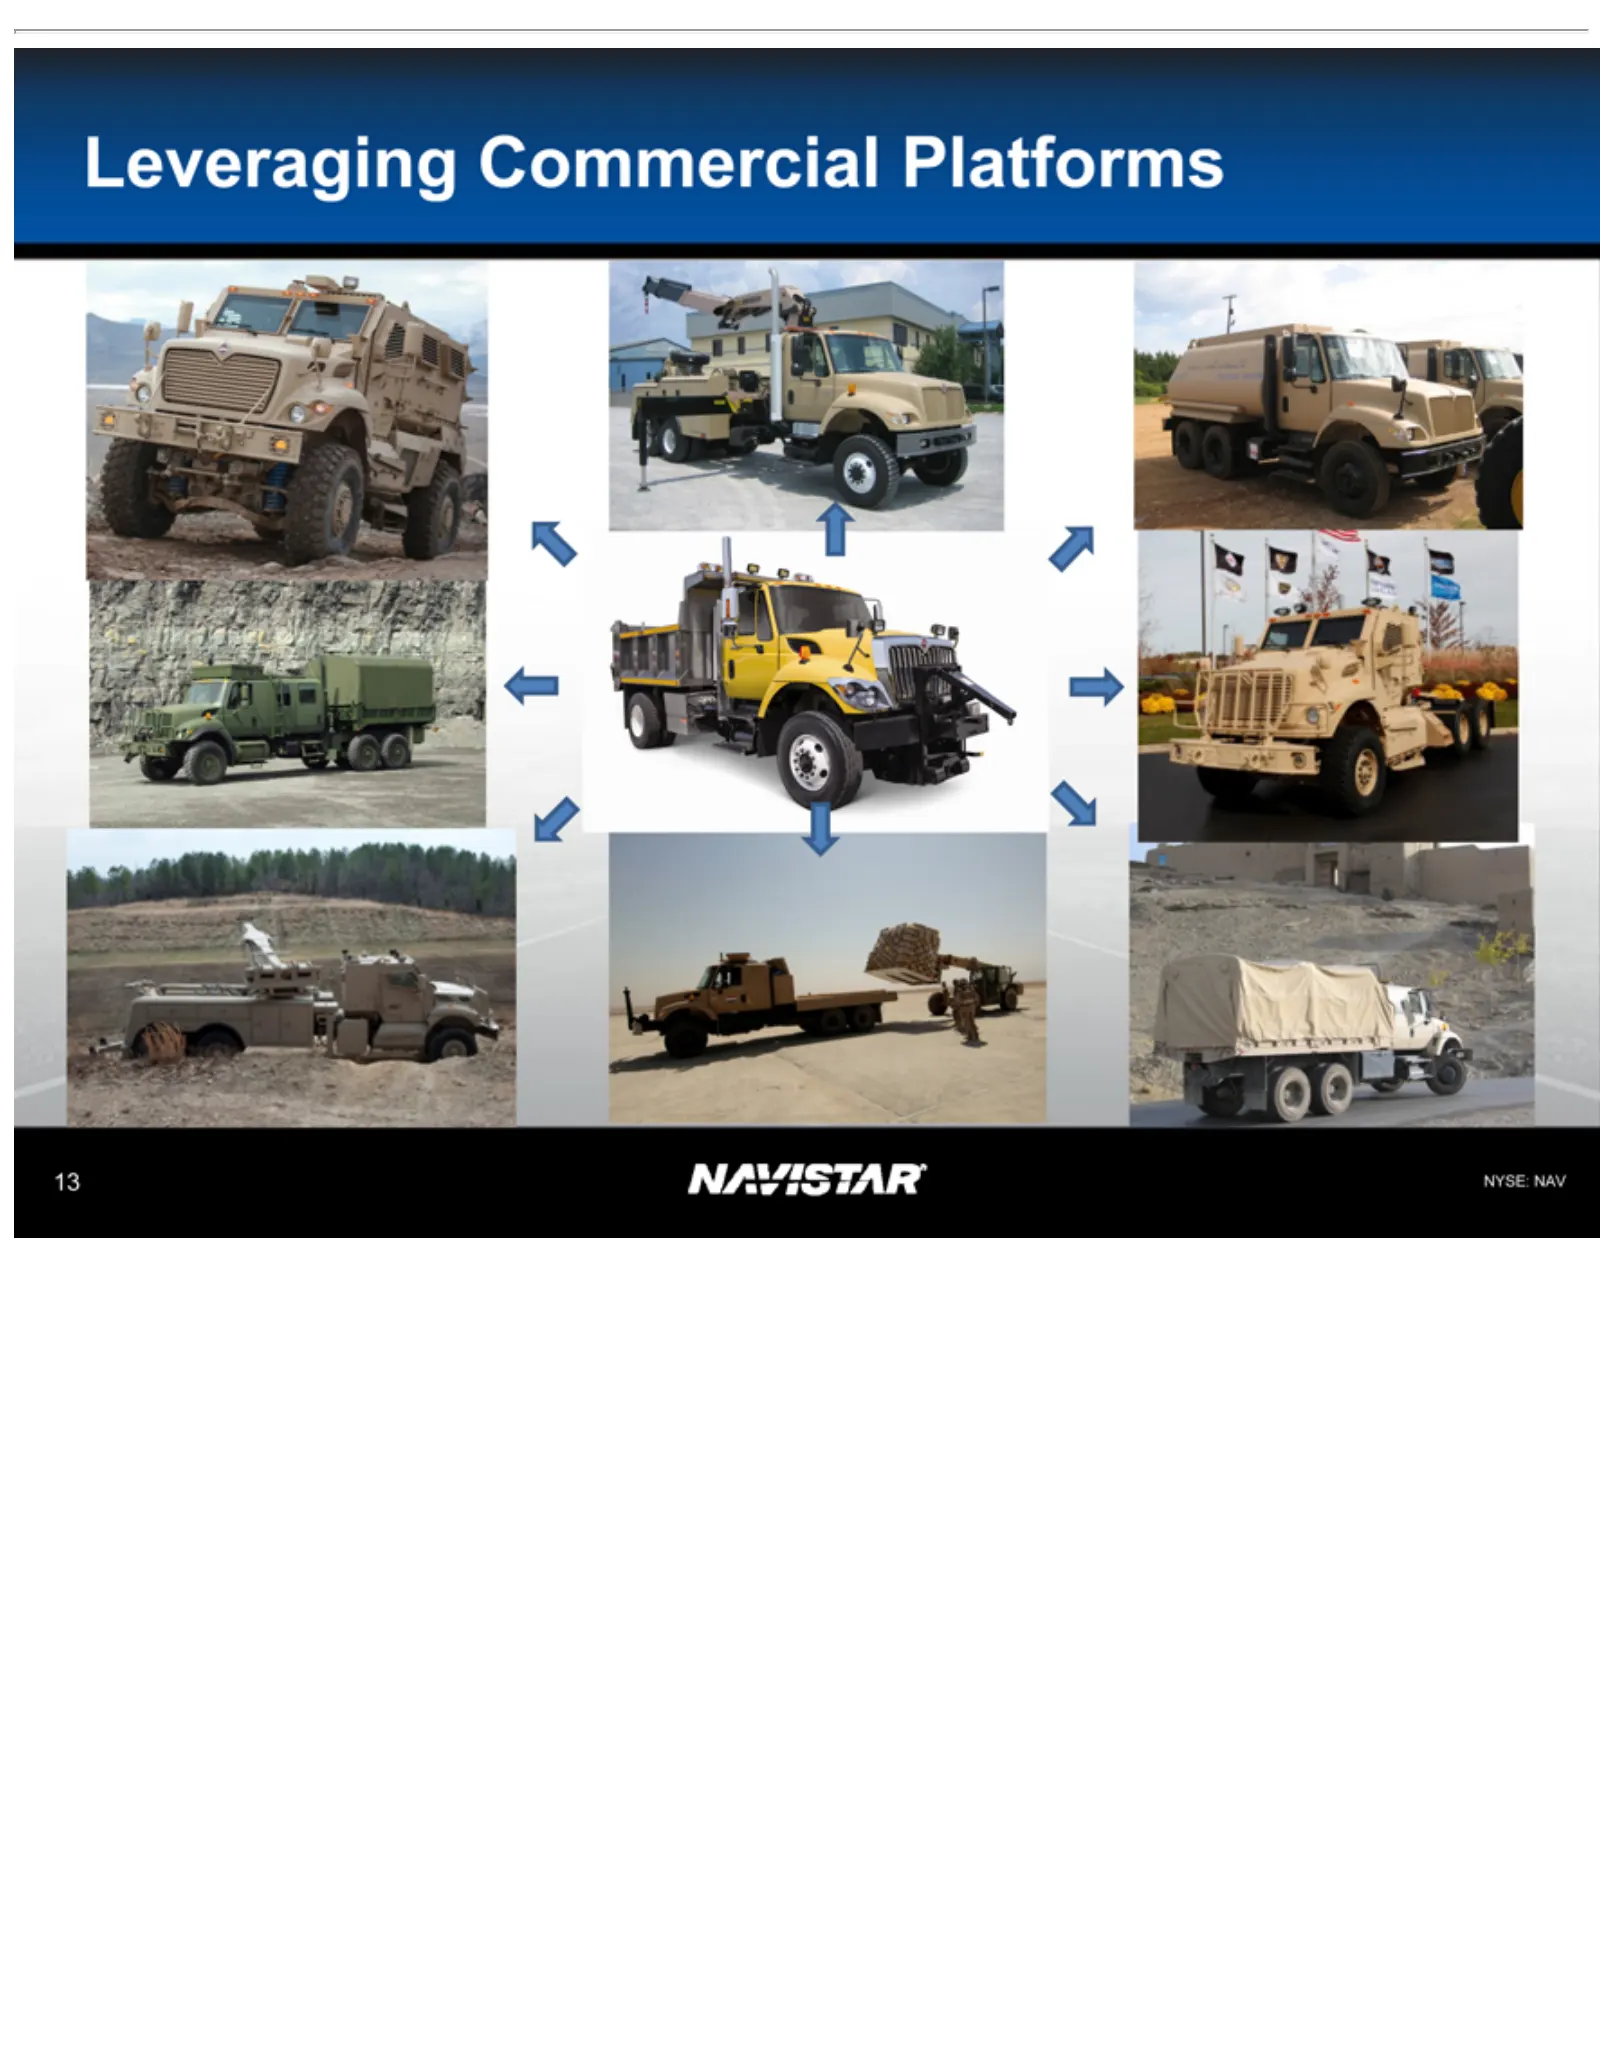
Slide 13: Leveraging Commercial Platforms
Leveraging NYSE: 13 NAVCommercial Platforms
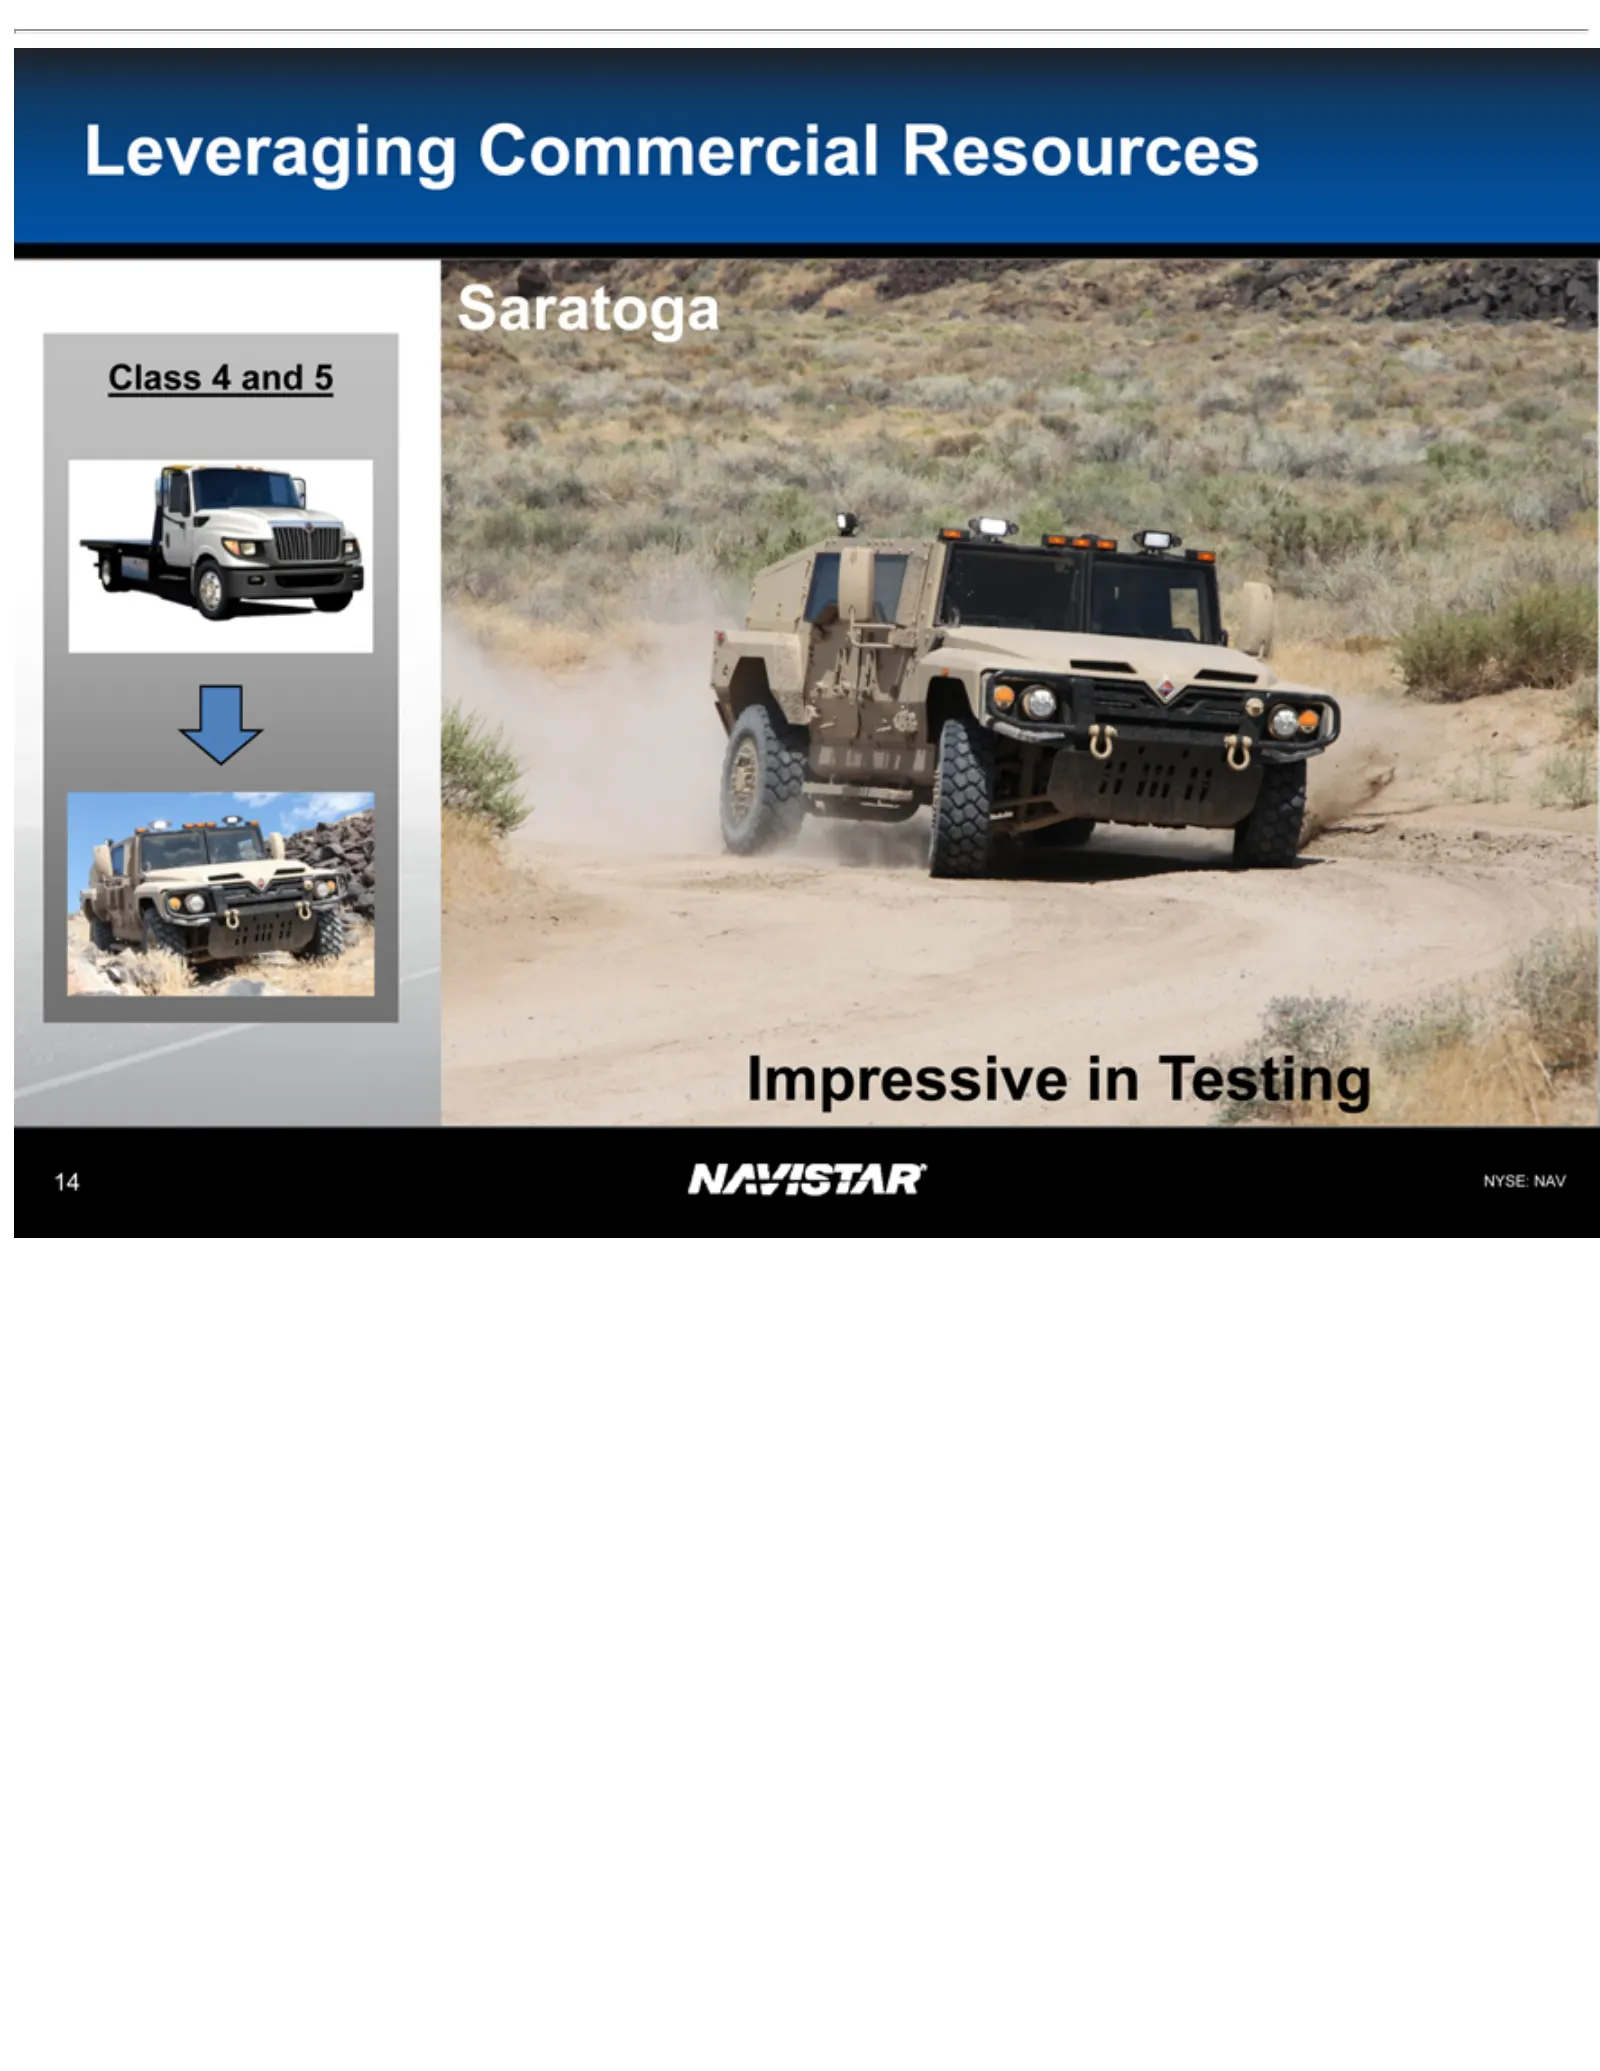
Slide 14: Leveraging Class 8 Testing Resources
Leveraging Class Impressive Saratoga NYSE: 14 4 NAV andin Commercial 5 Testing Resources
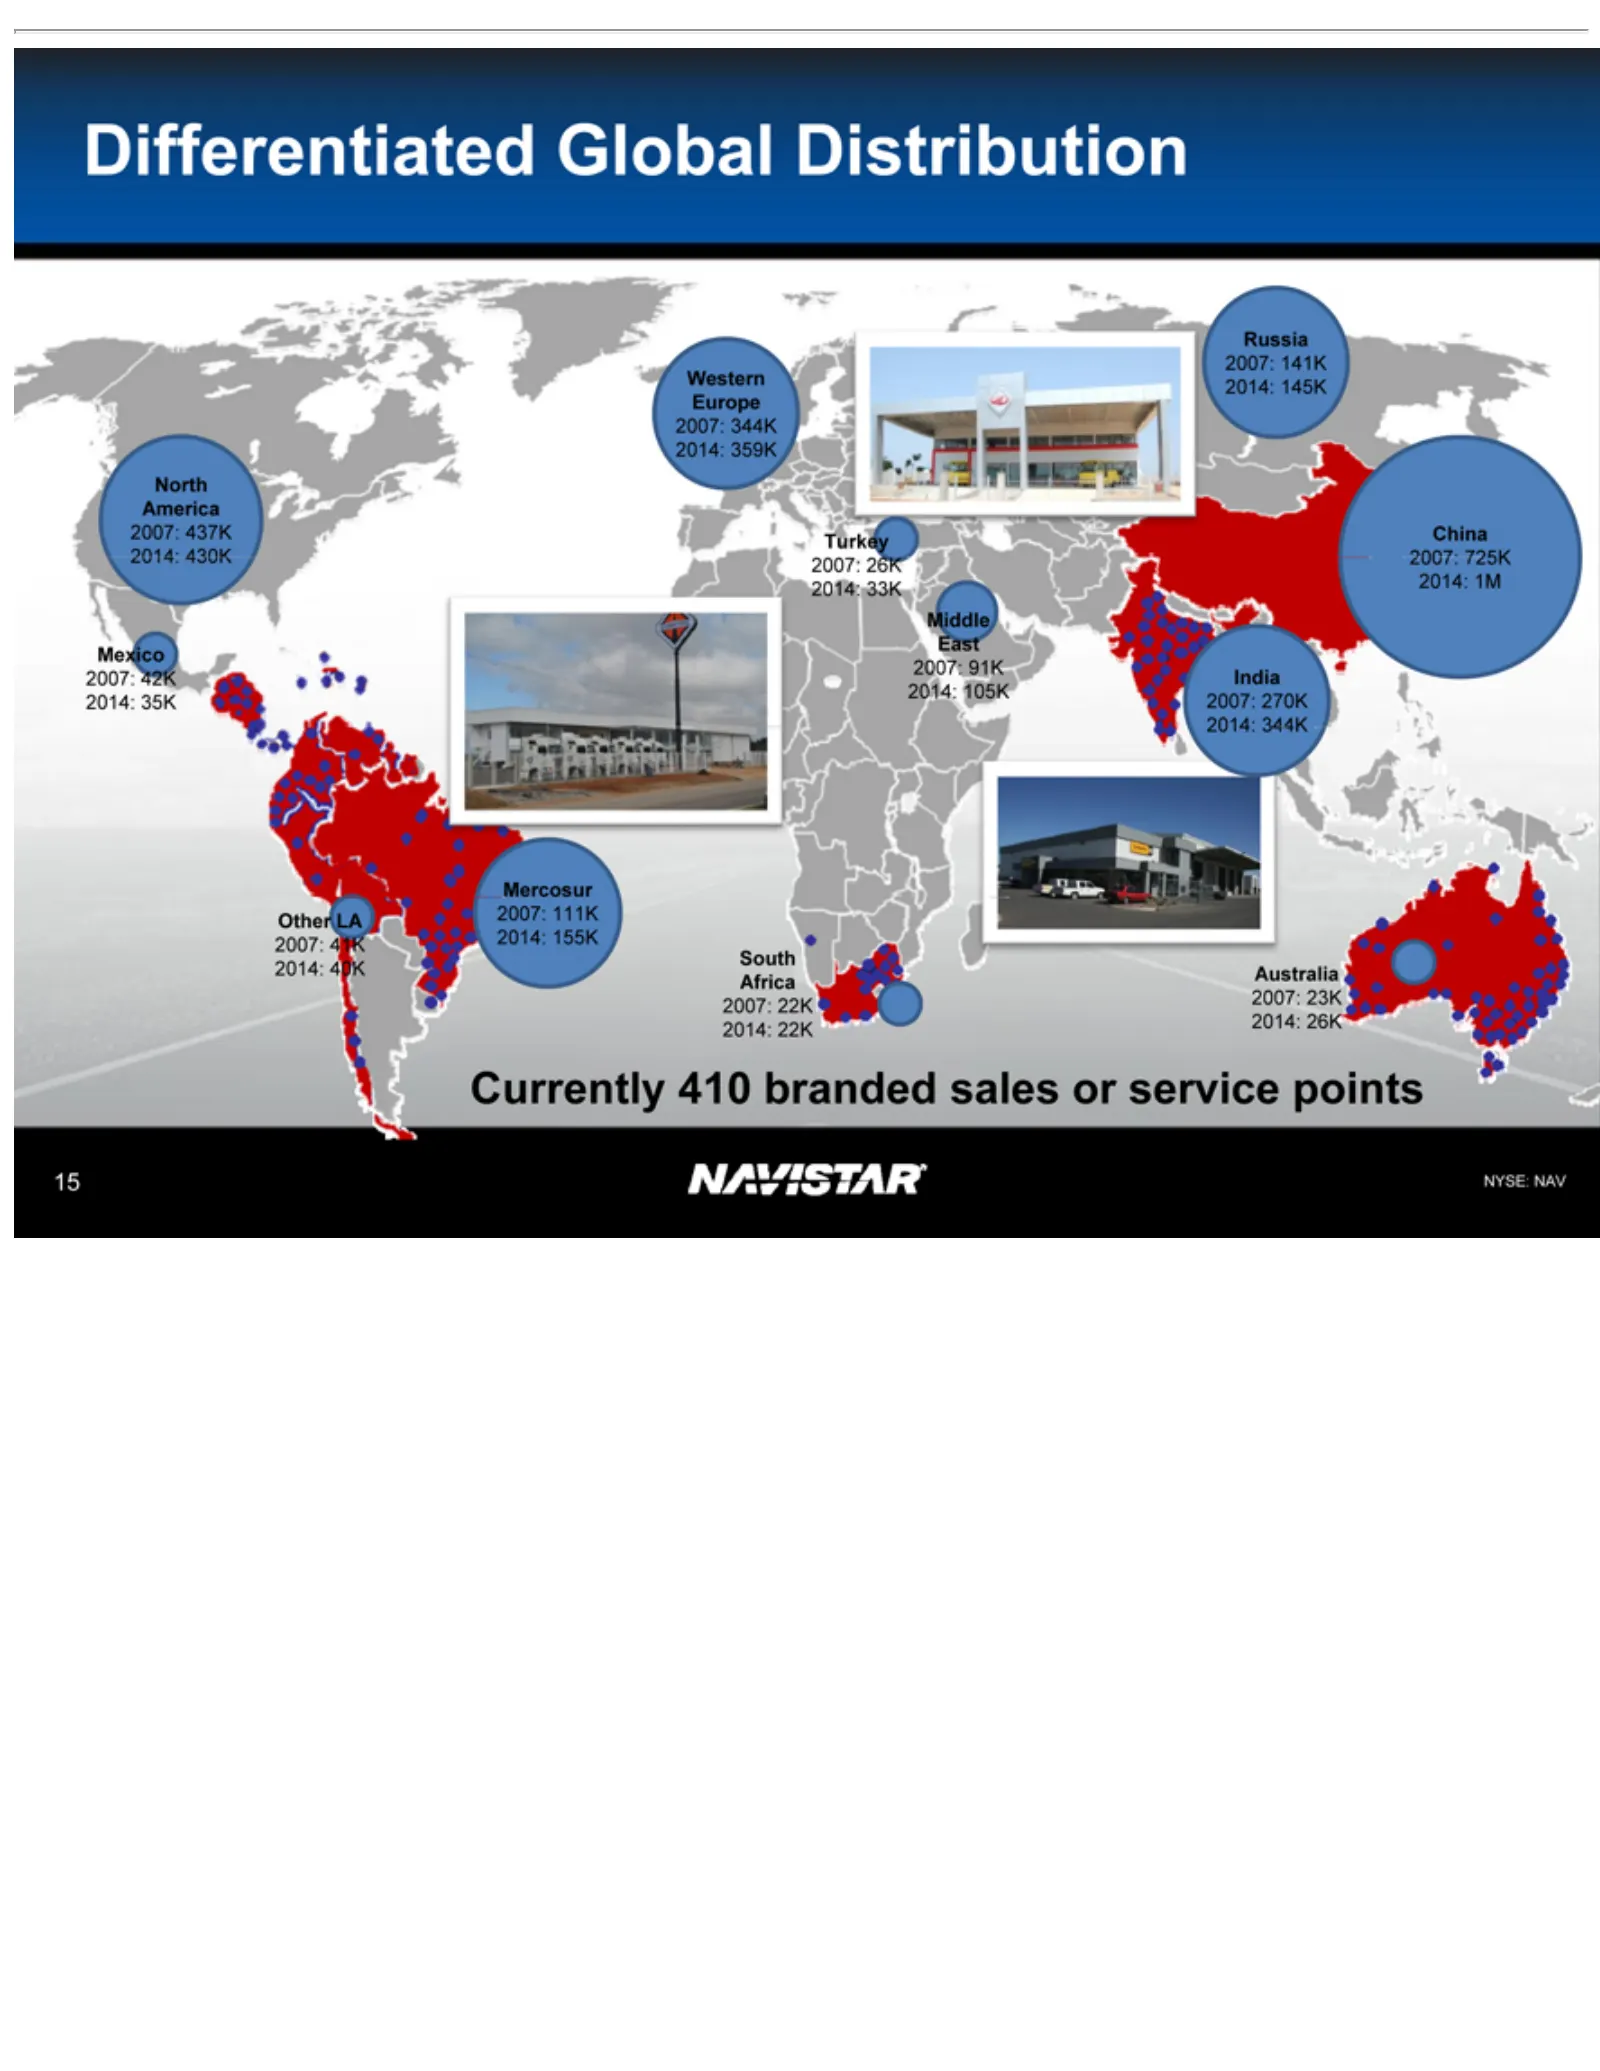
Slide 15: Differentiated Global Distribution
Differentiated North Mexico Other Mercosur Western Turkey Middle South Russia India China 2014: 2007: Australia Currently NYSE: 15 LA America 437K 430K 42K 41K 111K 344K 26K 91K 22K 141K 145K 270K 725K 1M 23K Africa East NAV Europe 410 2014: 2014: branded Global 35K 40K 33K 105K 22K 26K 155K 359K 34
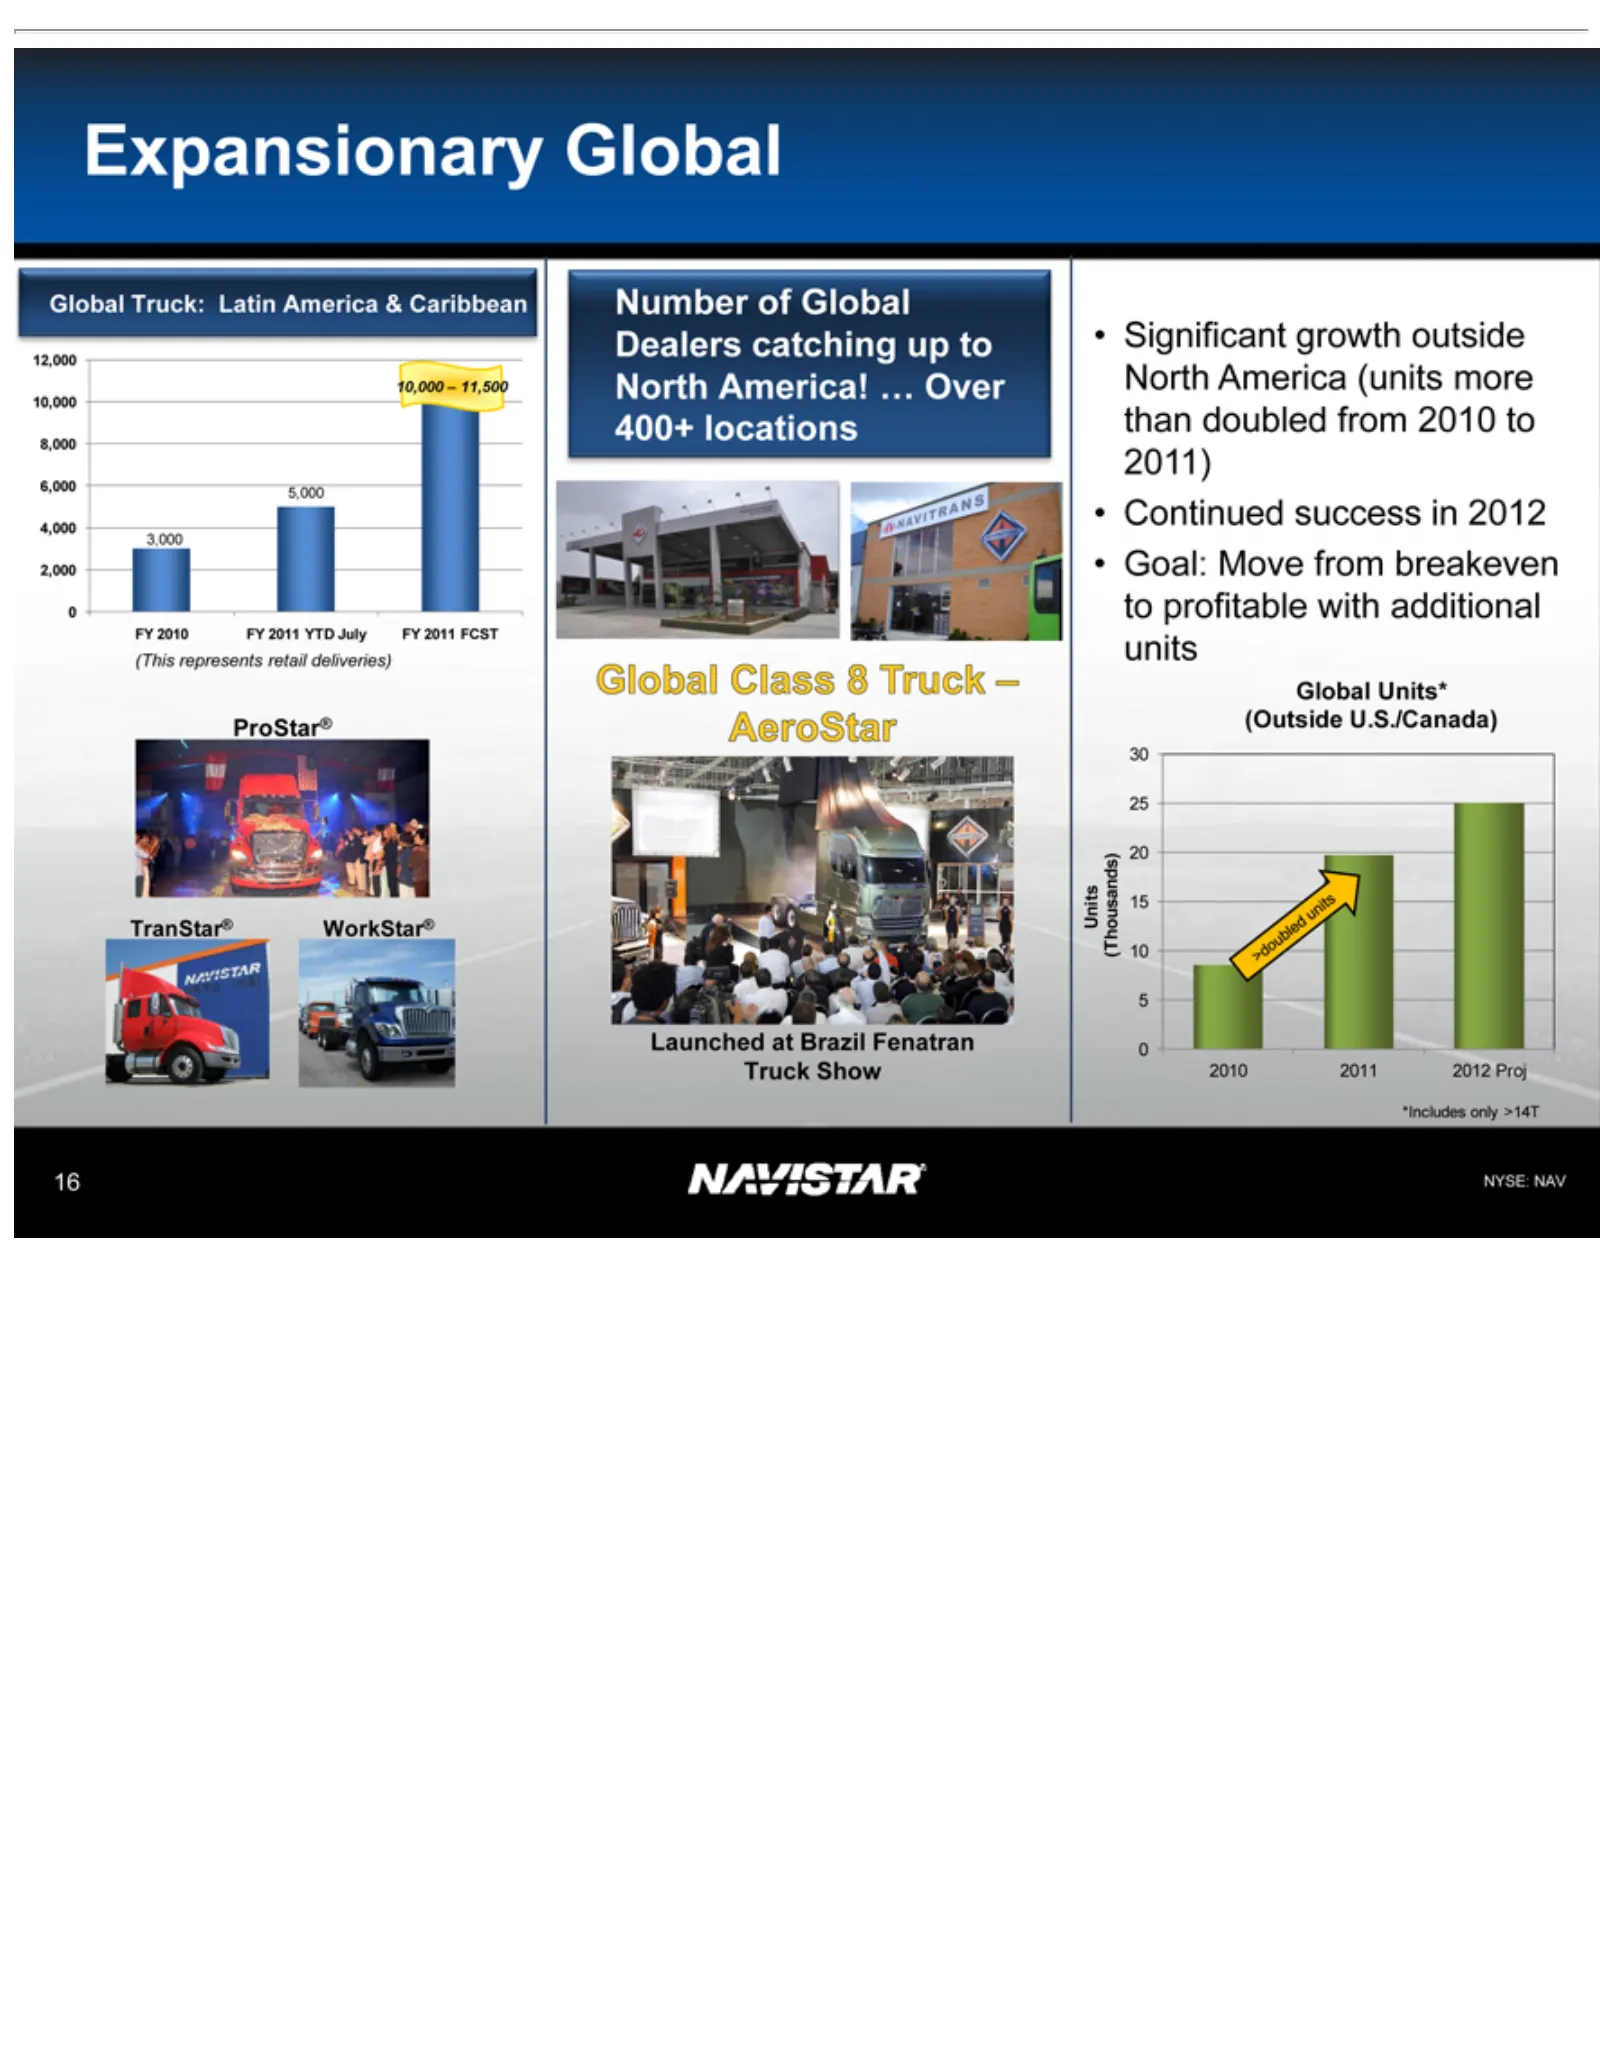
Slide 16: Expansionary Global Truck Growth
Expansionary 12,000 10,000 5,000 3,000 FY (This Number WorkStar® TranStar® ProStar® Launched •North Global Units 30 2010 *Includes NYSE: 16 Significant Continued Goal: 25 2010 2011 represents (Thousands) 20 America Truck: Class Units* 10,000 – Move NAV of FY 11,500 15 only at2012 Global 10 success B
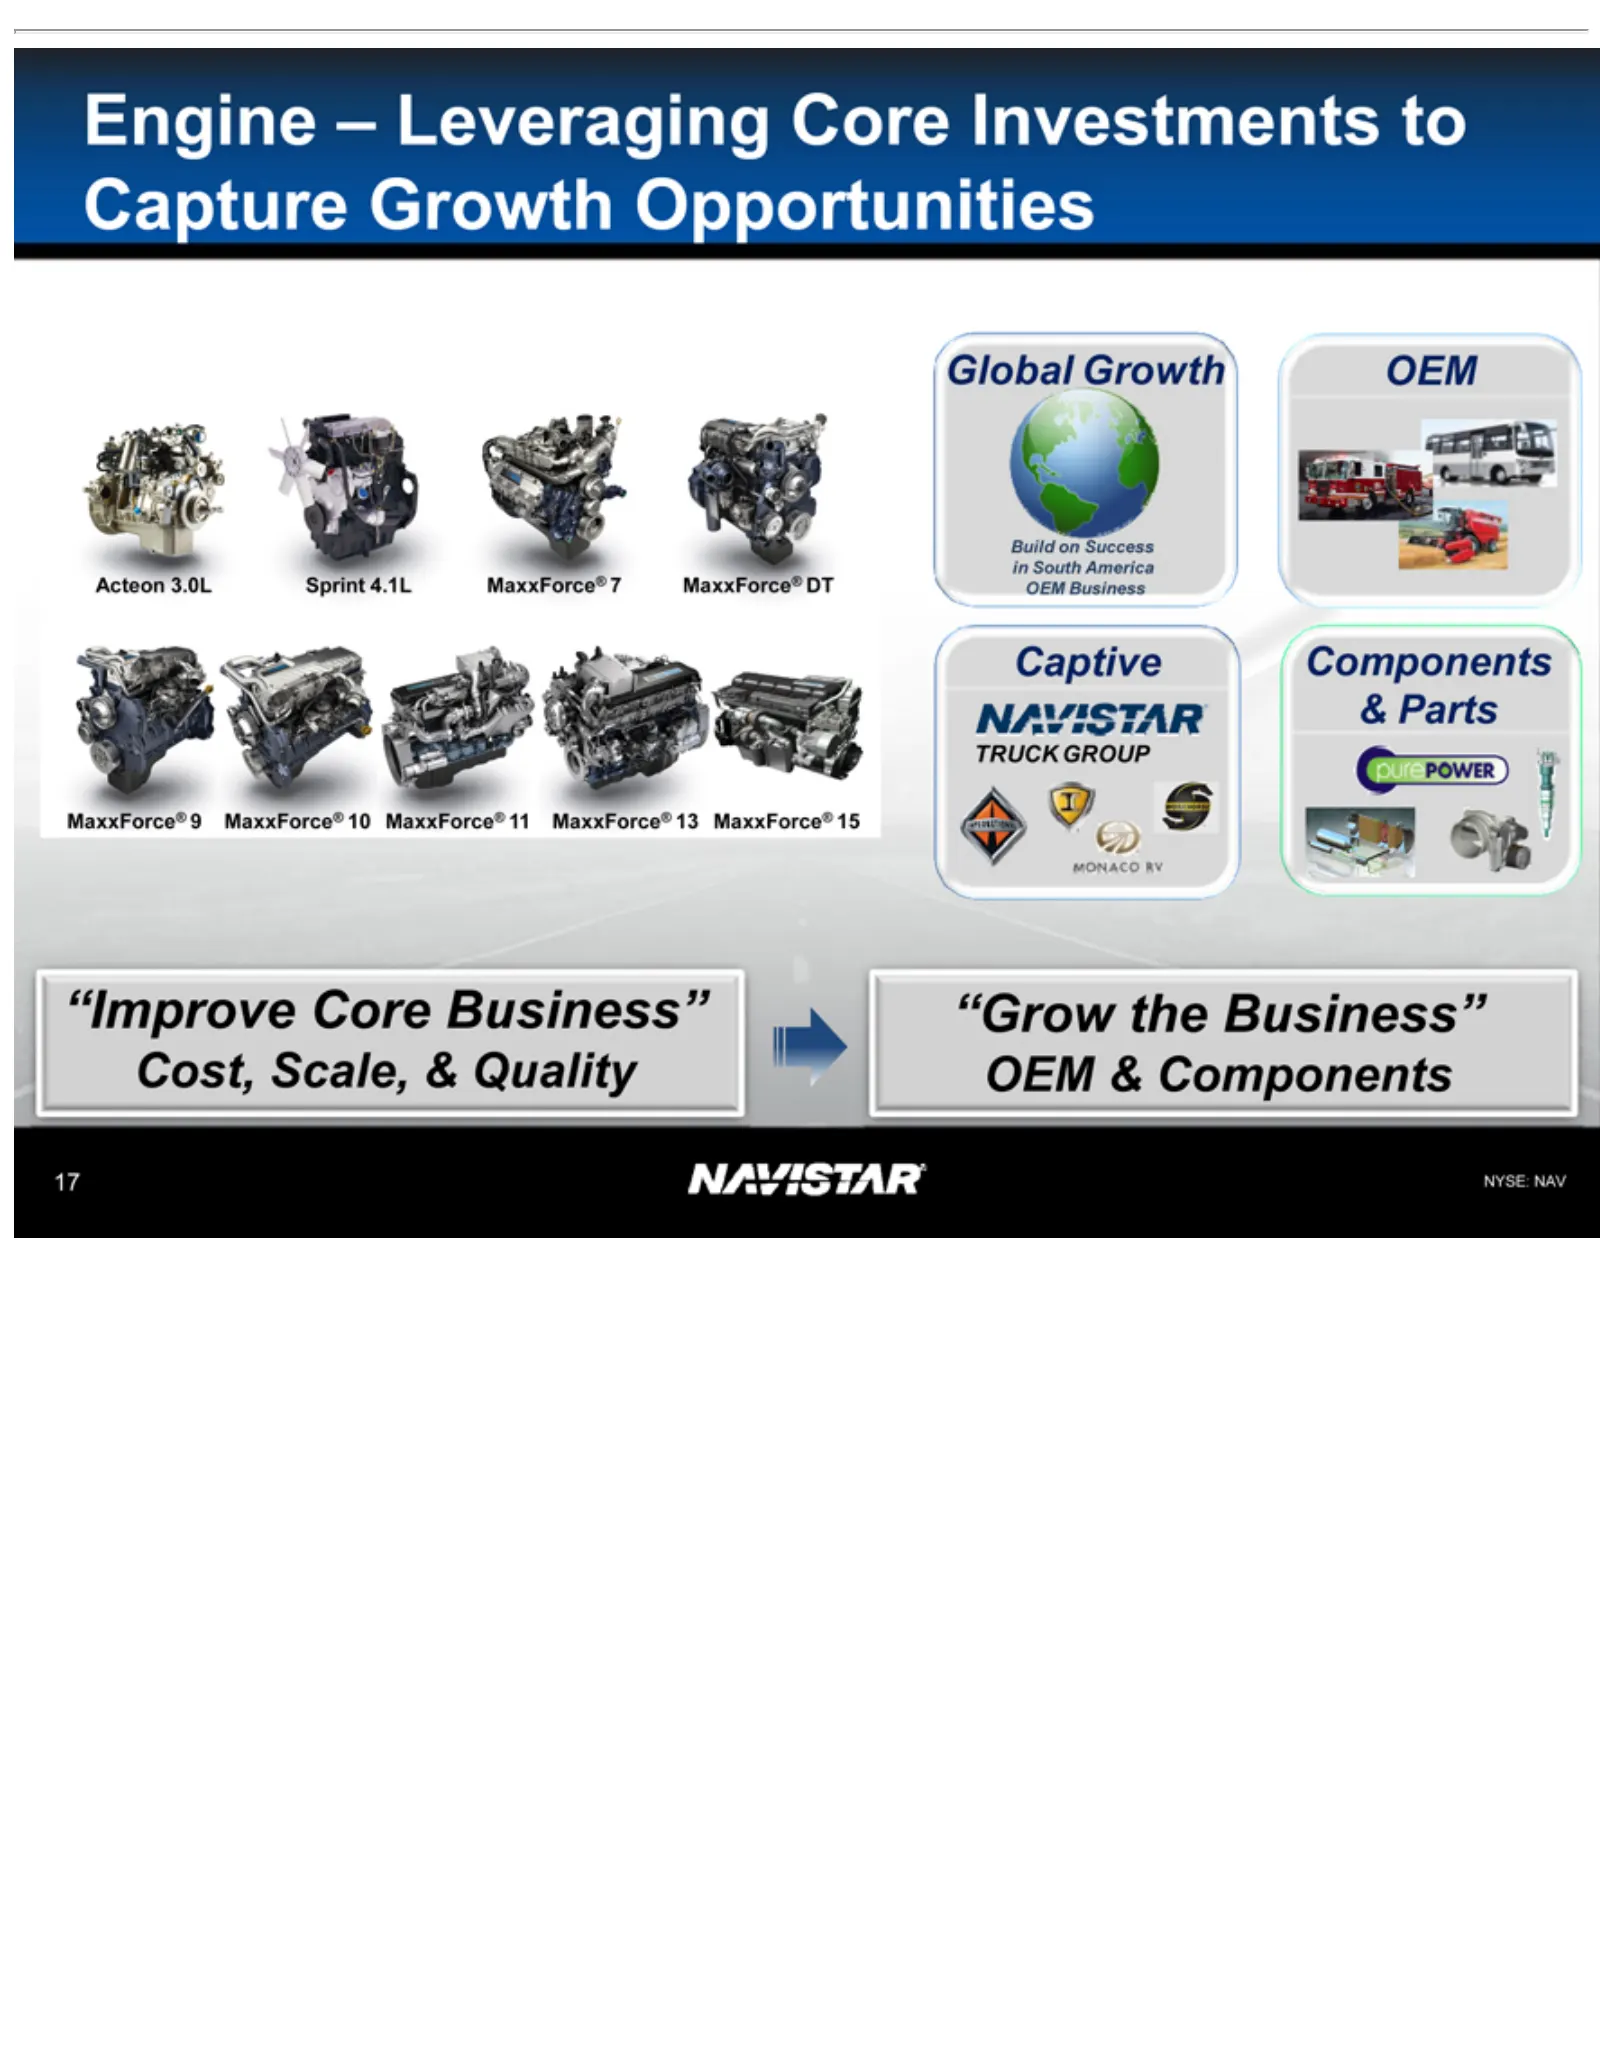
Slide 17: Engine and Components Group Growth
Engine Acteon MaxxForce® Global Build TRUCK Captive OEM & Components “Improve “Grow NYSE: 17 Parts onthe Growth –3.0L NAV GROUP Success Leveraging Core Business” Sprint 9 Business” MaxxForce® in4.1L South Core OEMMaxxForce® Cost, America Investments & 10 Components Scale, MaxxForce® OEM & 7toMaxxFor
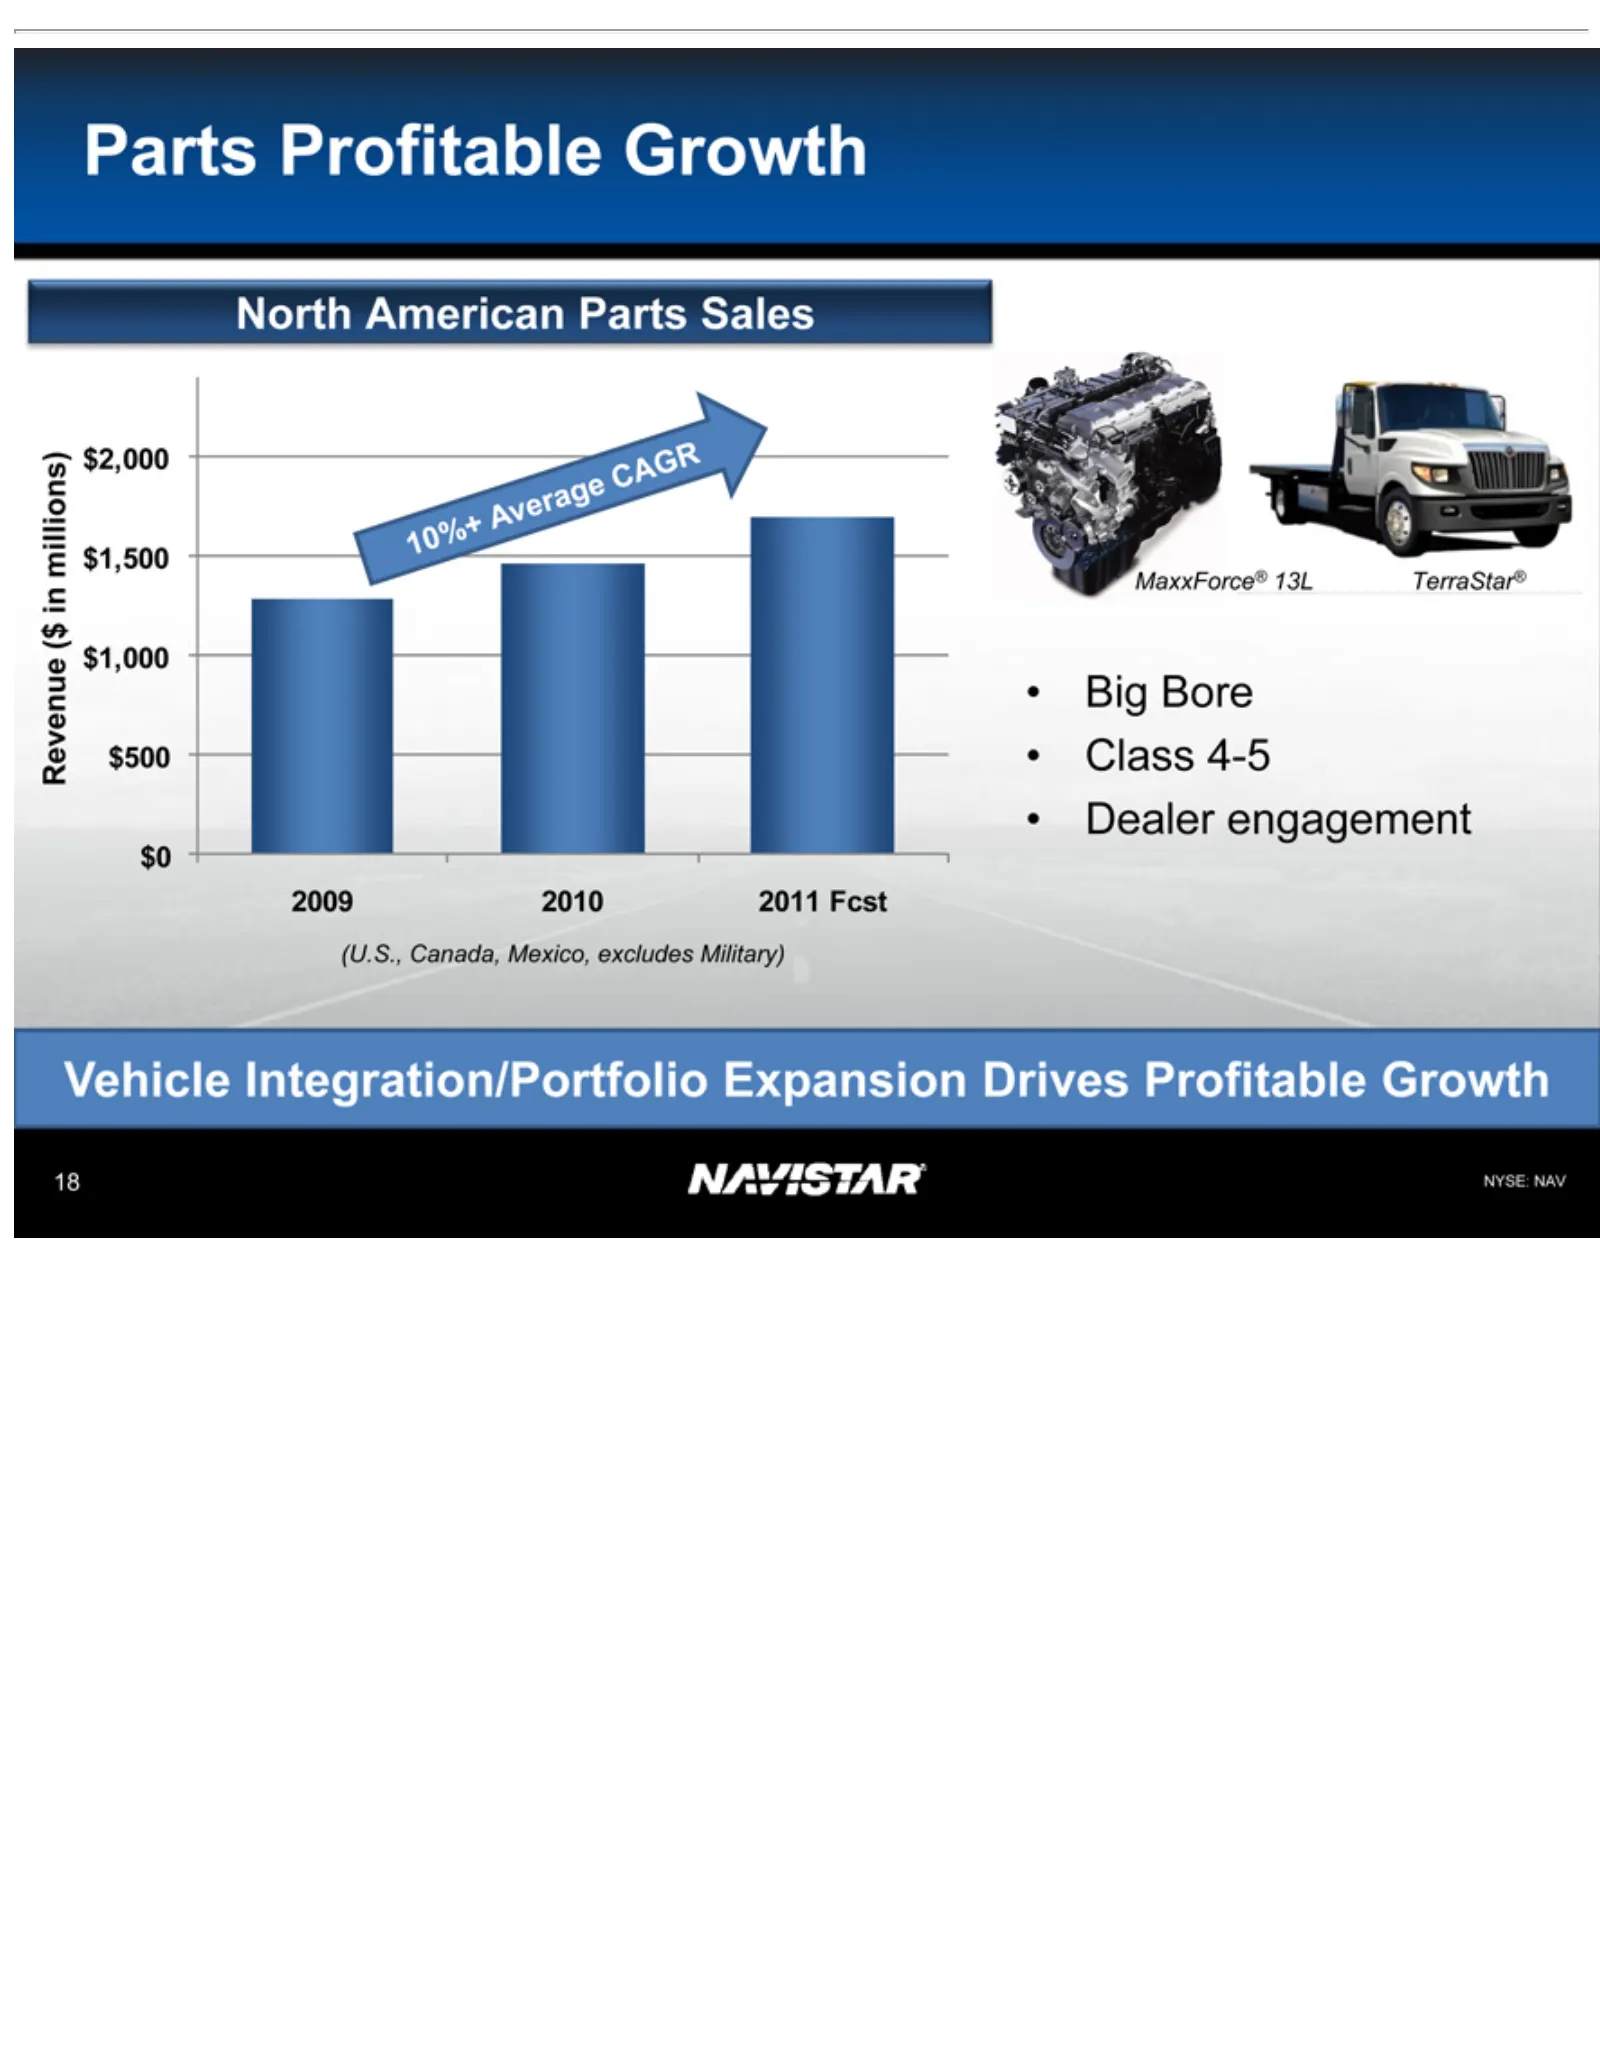
Slide 18: Parts: Drives Profitable Growth
Parts North Revenue $2,000 2009 (U.S., 10%+ •MaxxForce® Vehicle NYSE: 18 Big 2010 Class Dealer Profitable Bore American Average Canada, $1,500 4-5 NAV Integration/Portfolio engagement (in2011 $13L millions) $1,000 Mexico, CAGR Growth Fcst Parts TerraStar® Sales $500 excludes $0 Expansion Military) D
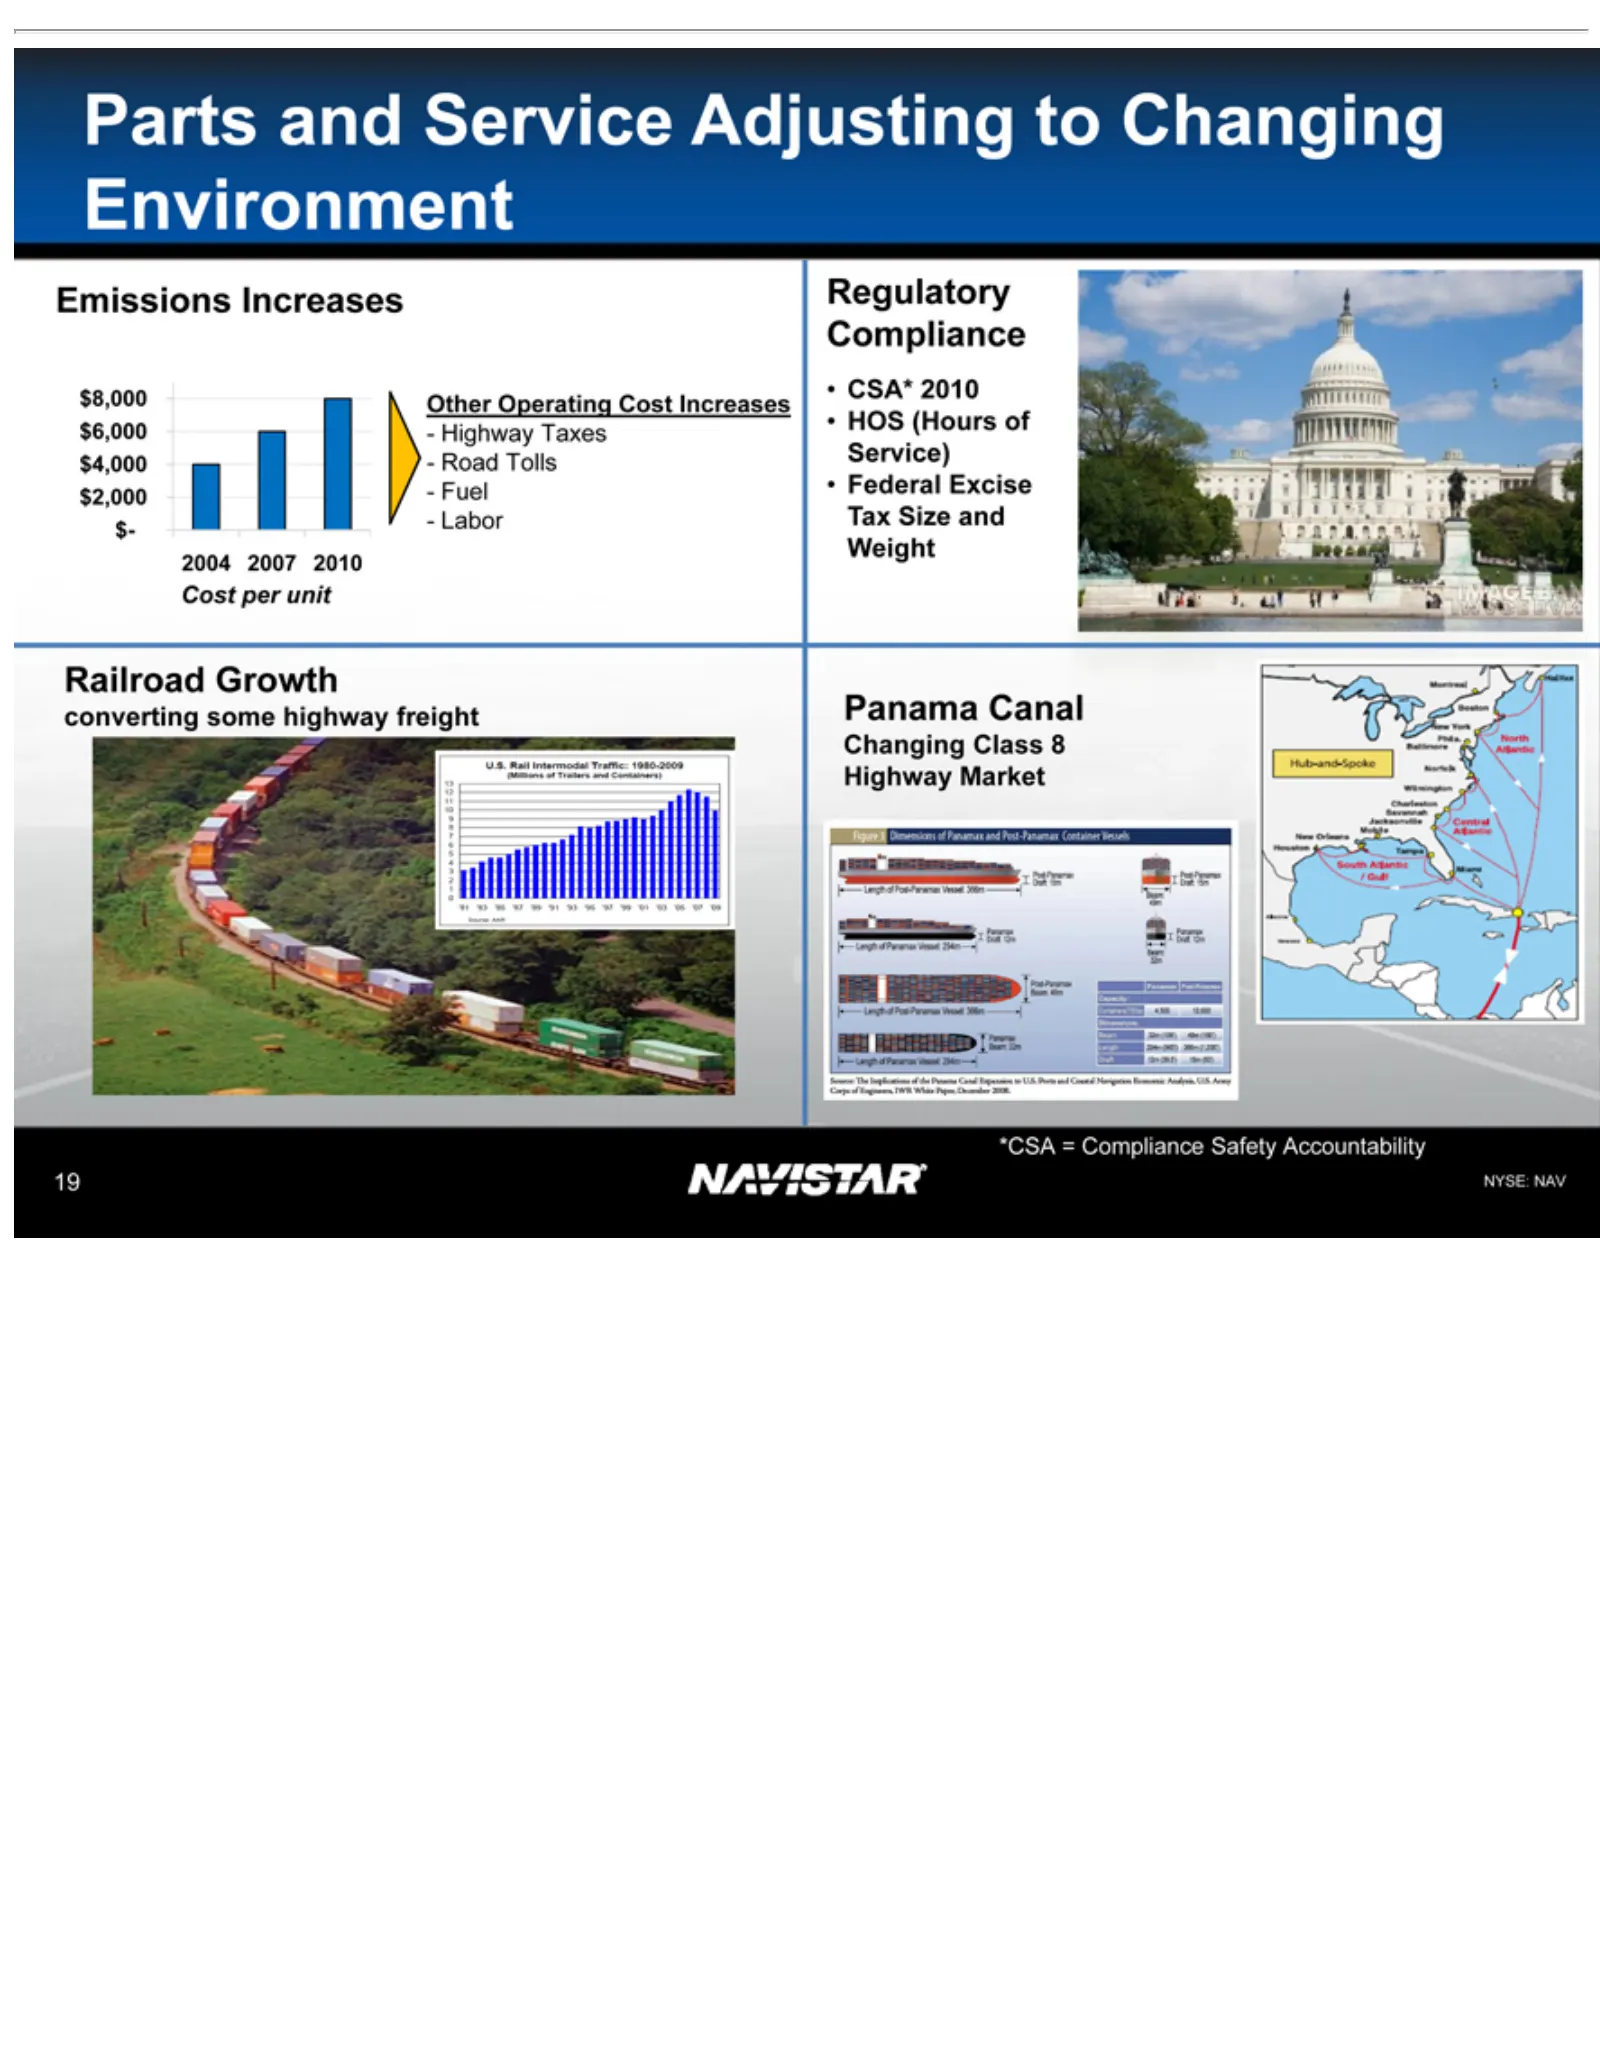
Slide 19: Changing Regulatory and Operating Cost Environment
Parts Emissions $8,000 -Other 2004 Cost •Regulatory Railroad converting Panama Changing *CSA NYSE: 19 Highway Road Fuel Labor CSA* HOS Federal per 2007 and Operating =(Hours Tolls $6,000 NAV 2010 Canal Compliance unit Growth Excise Service Class Increases Taxes 2010 some Compliance of $4,000 8Tax Co
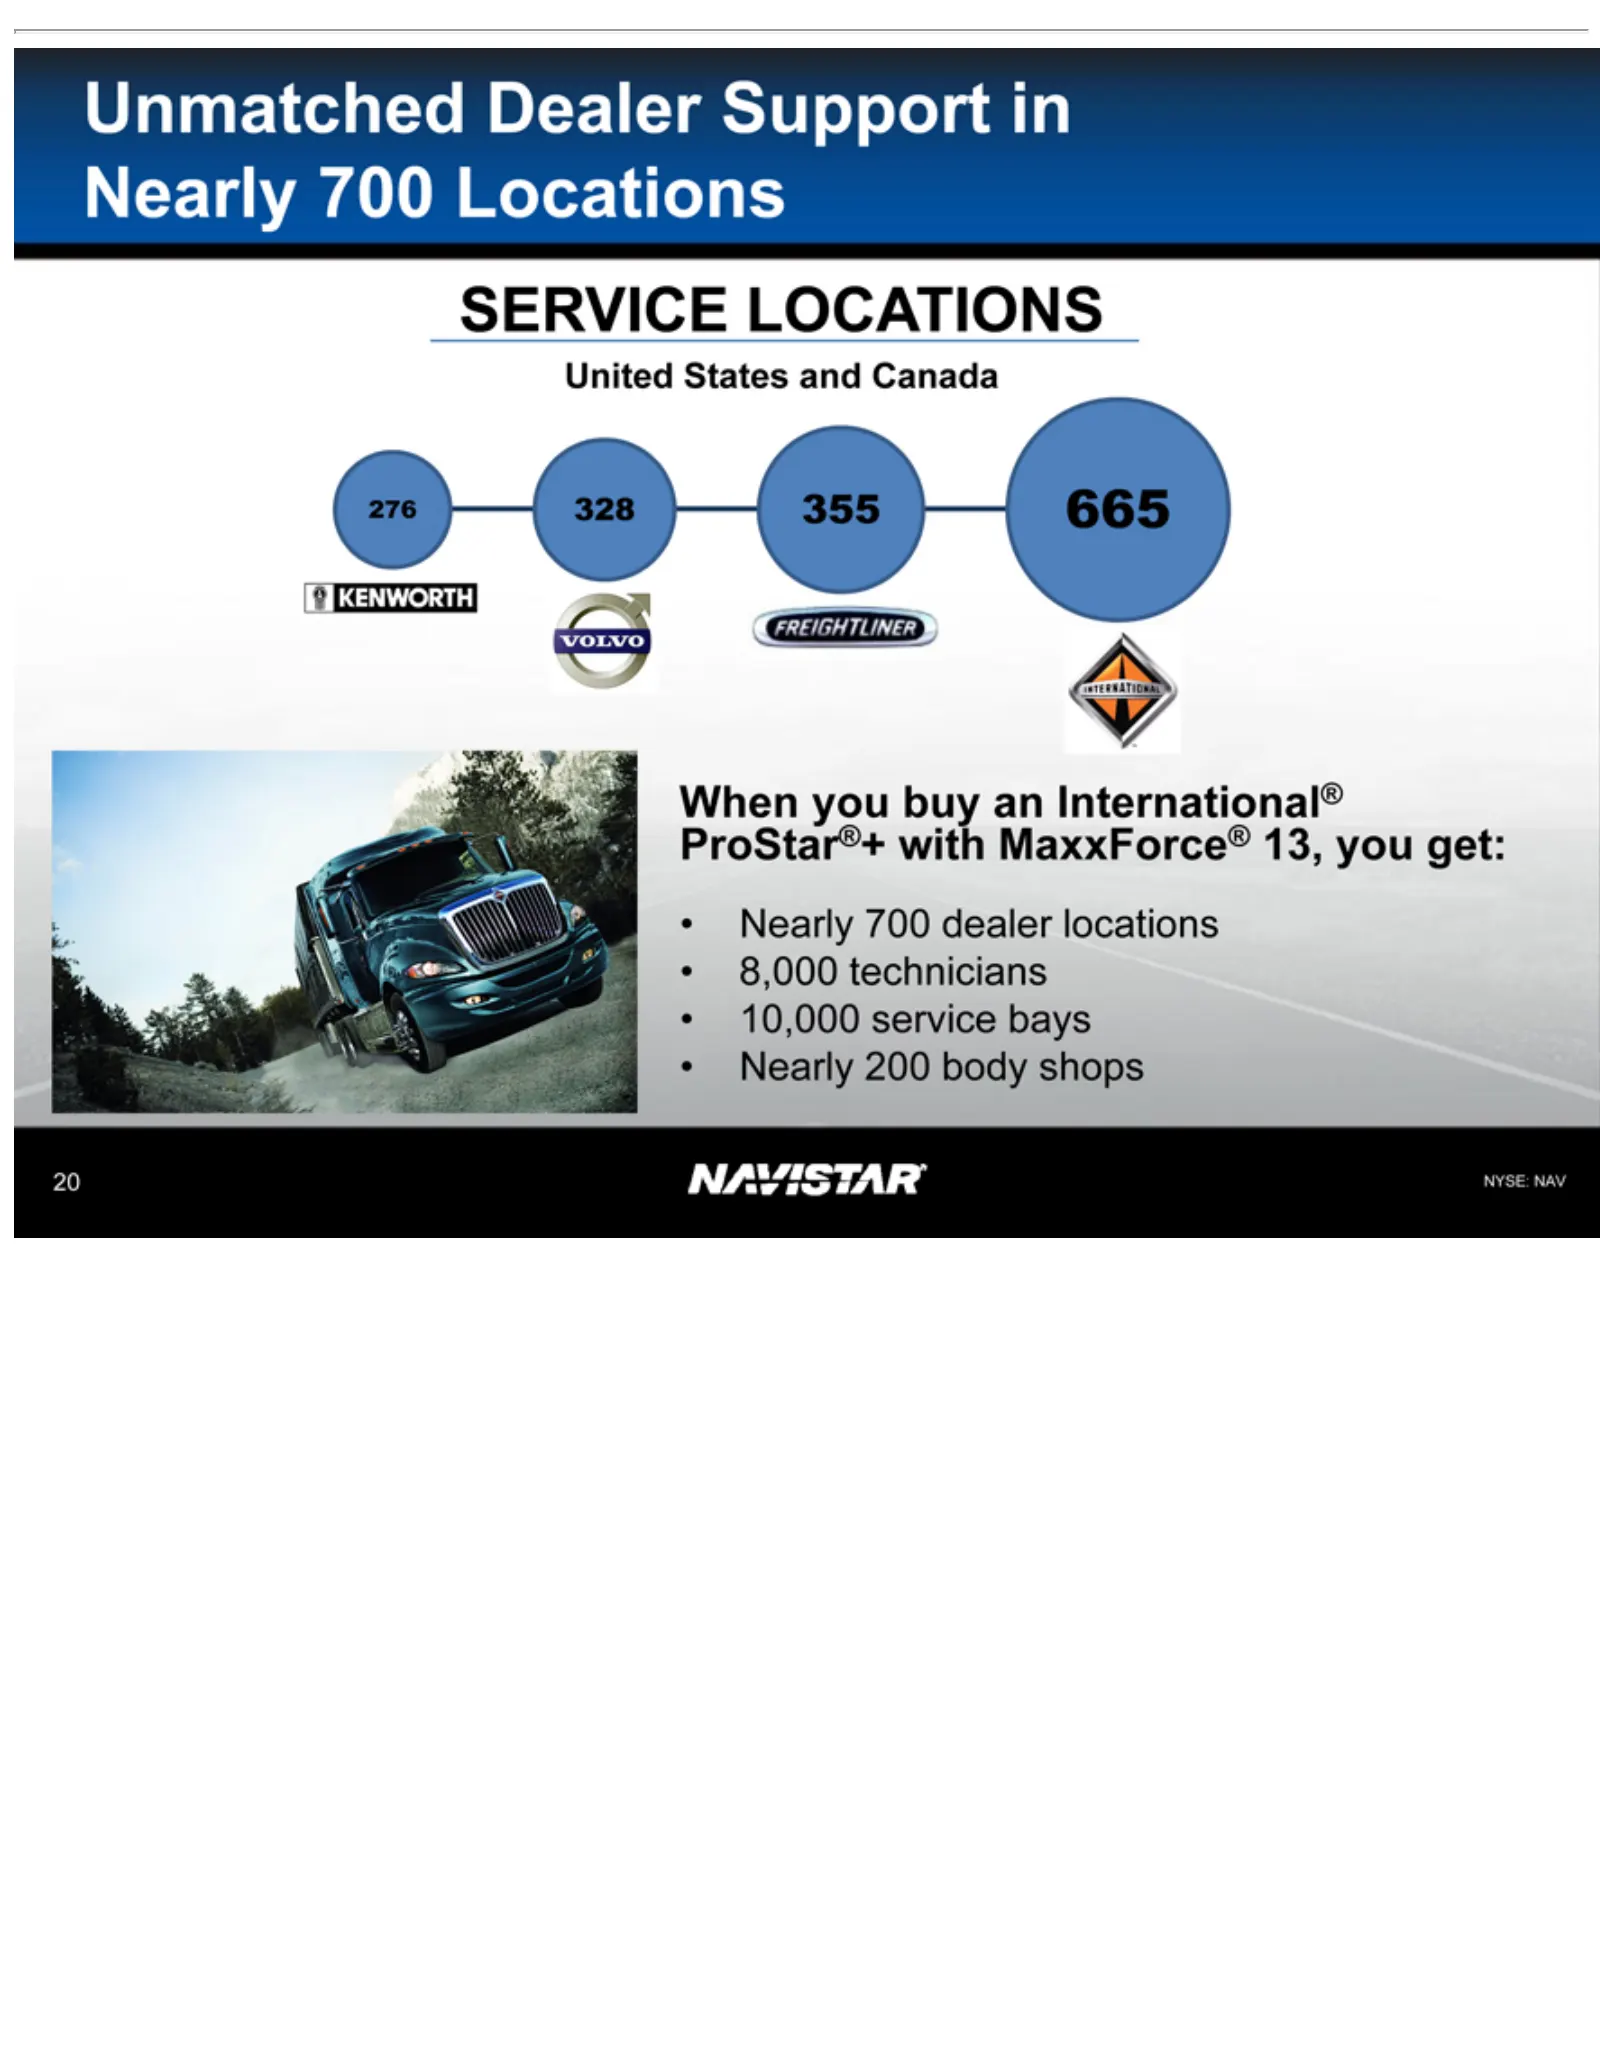
Slide 20: Unmatched Service Network
Unmatched SERVICE United 276 •When NYSE: 20 8,000 10,000 Nearly 328 you States technicians NAV 355 700 200 service LOCATIONS buy Dealer 665 dealer body and anbays Canada International® shops Support locationsin Nearly ProStar®+ 700 Locations with MaxxForce® 13, you get:
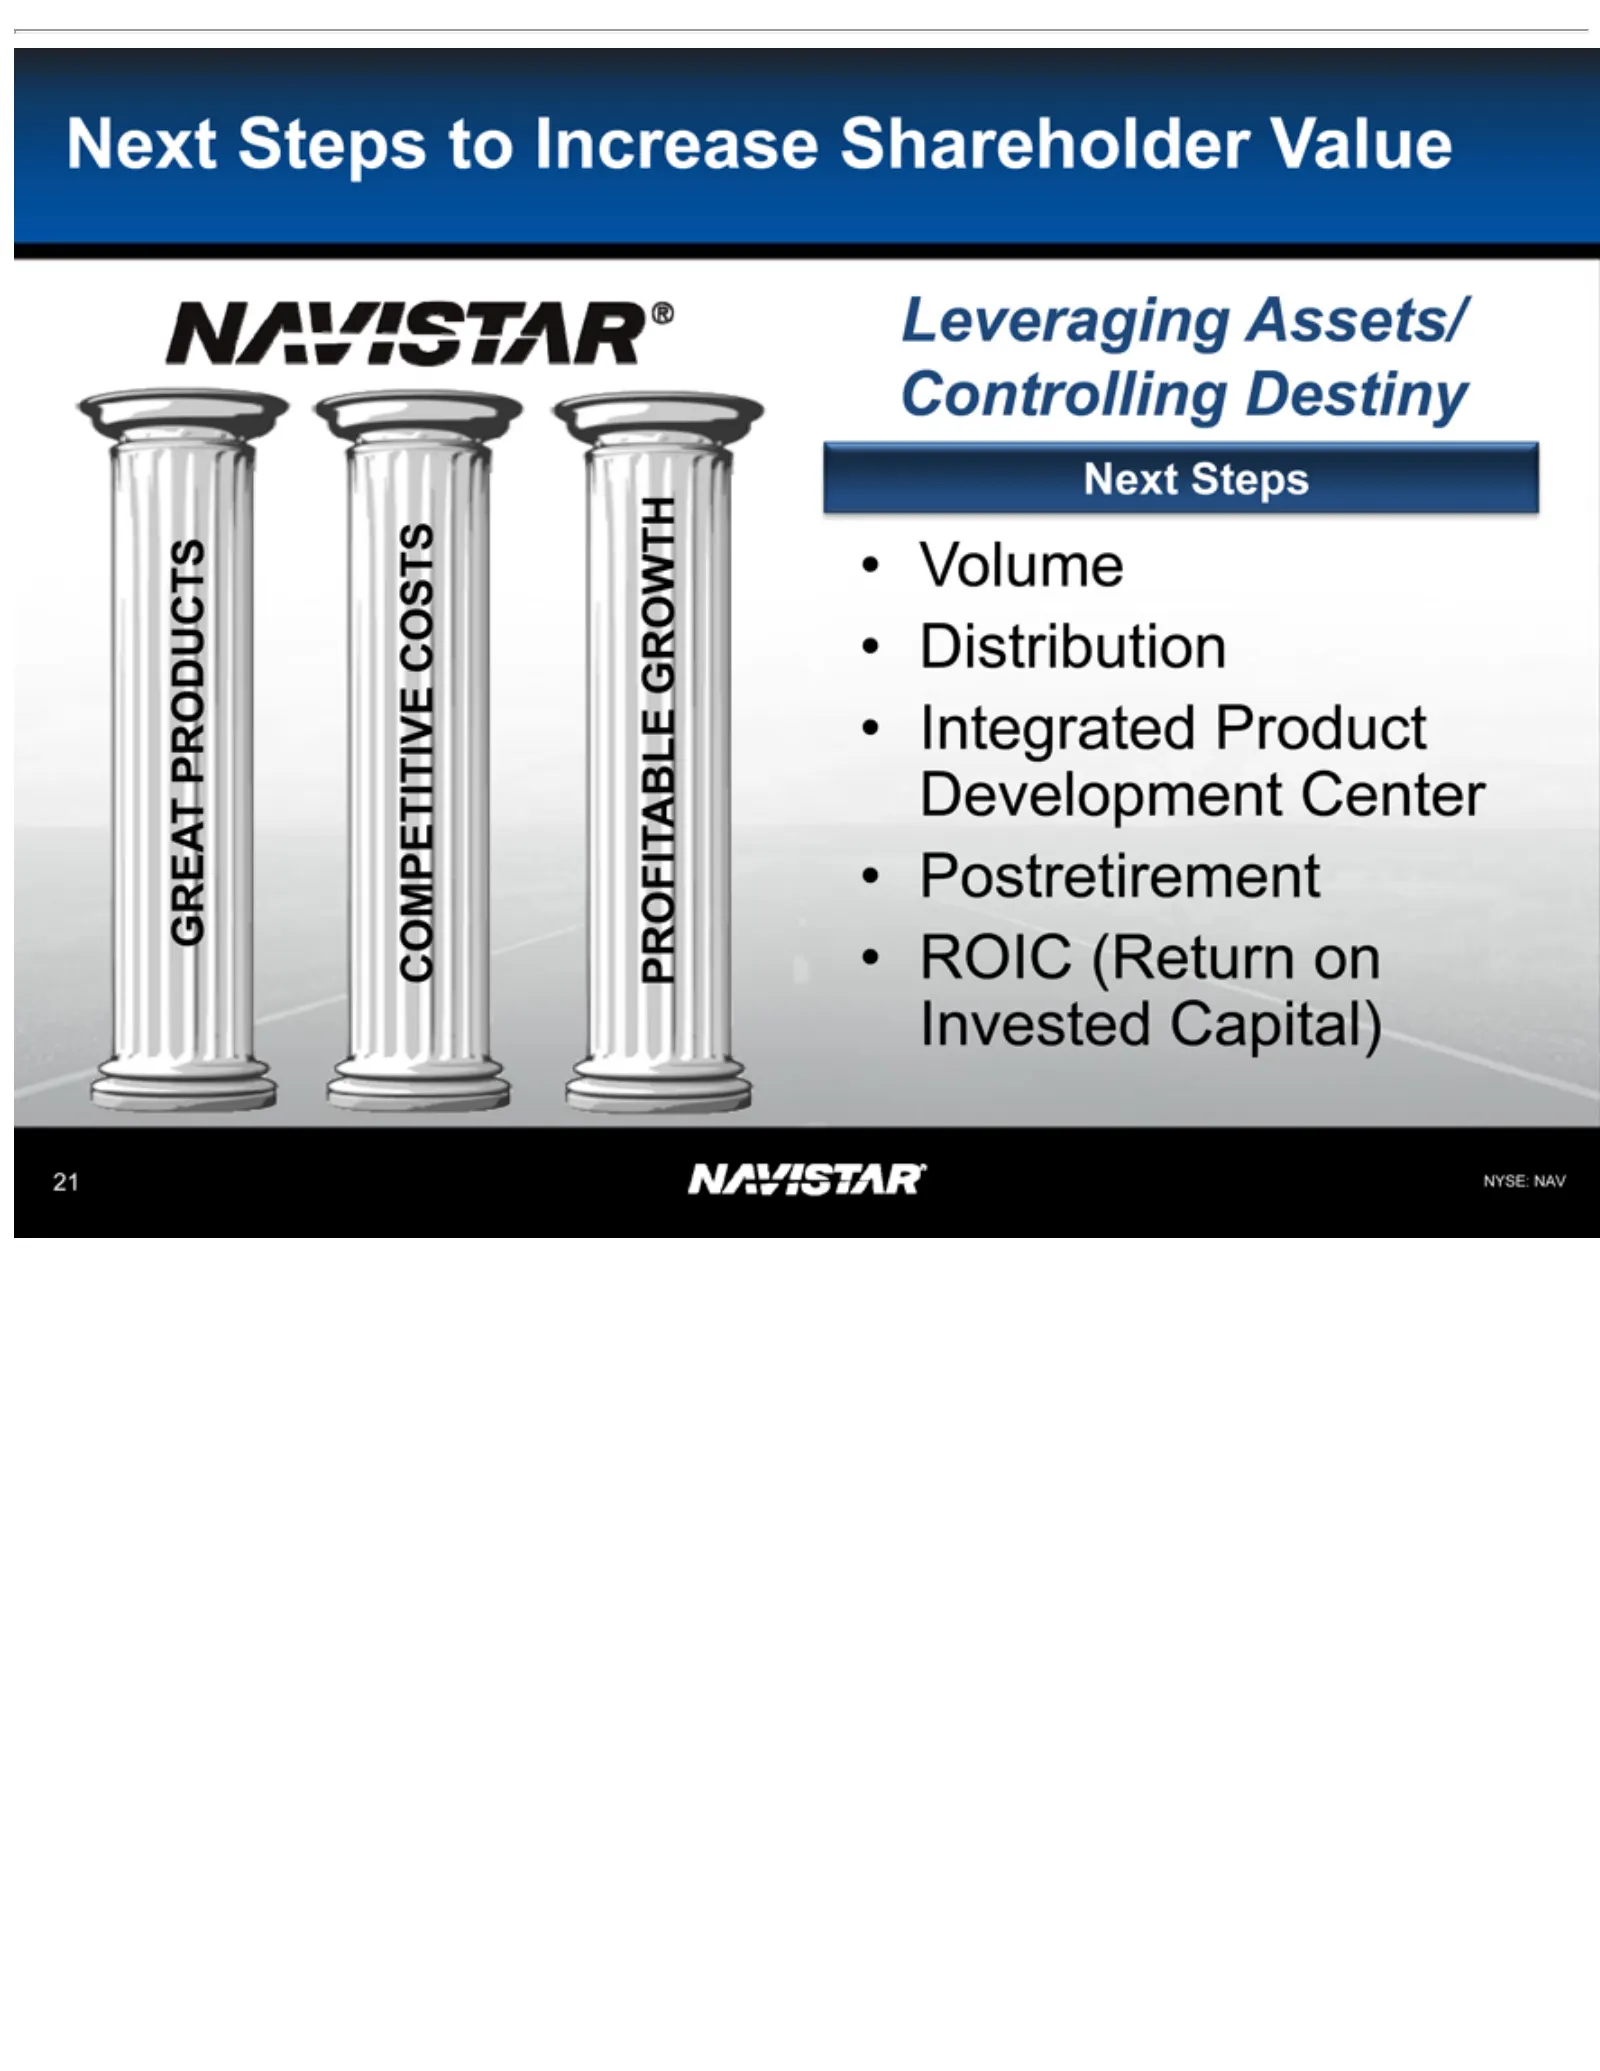
Slide 21: Next Steps
GREAT COMPETITIVE PROFITABLE Leveraging •Next NYSE: 21 Volume Distribution Integrated Postretirement ROICSteps NAV (Return PRODUCTS to Assets/ Product Increase GROWTH on COSTS Invested Controlling Development Shareholder Capital) Destiny Center Value
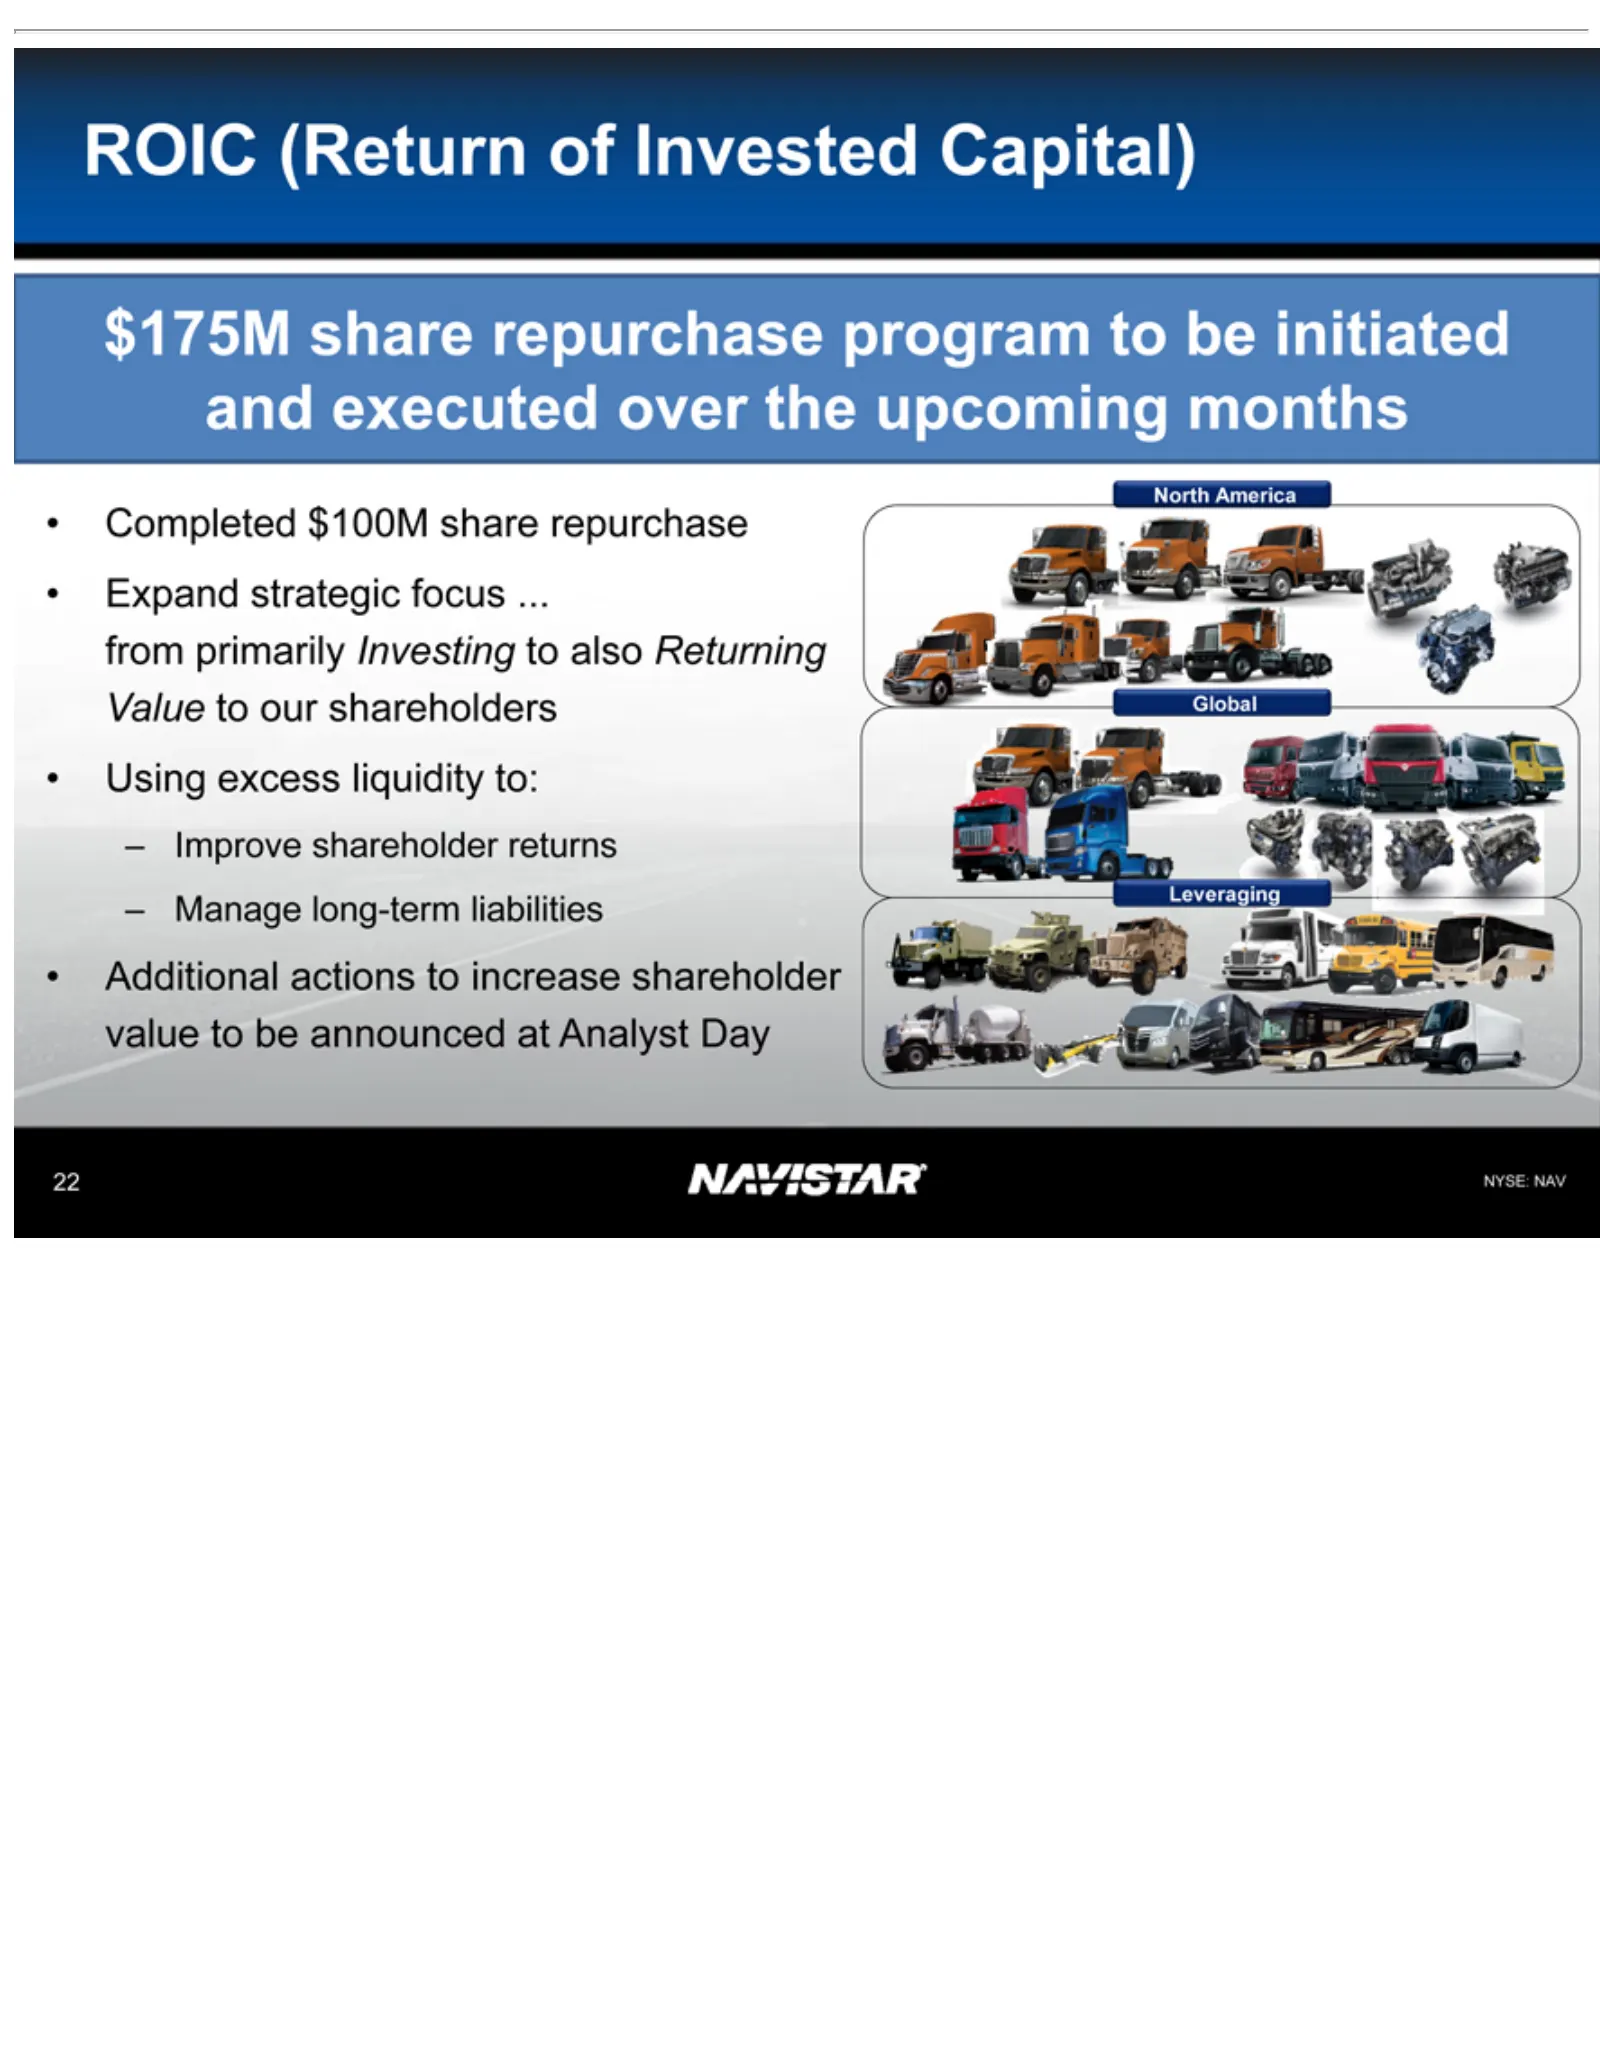
Slide 22: ROIC and Returning Value to Shareholders
ROIC •–$175M North NYSE: 22 Leveraging Global Additional Completed Expand Using Improve Manage America (Return NAV share excess strategic long-term shareholder actions $100M repurchase of liquidity Invested focus... to share liabilities increase returns to: program Capital) from repurchase sharehold
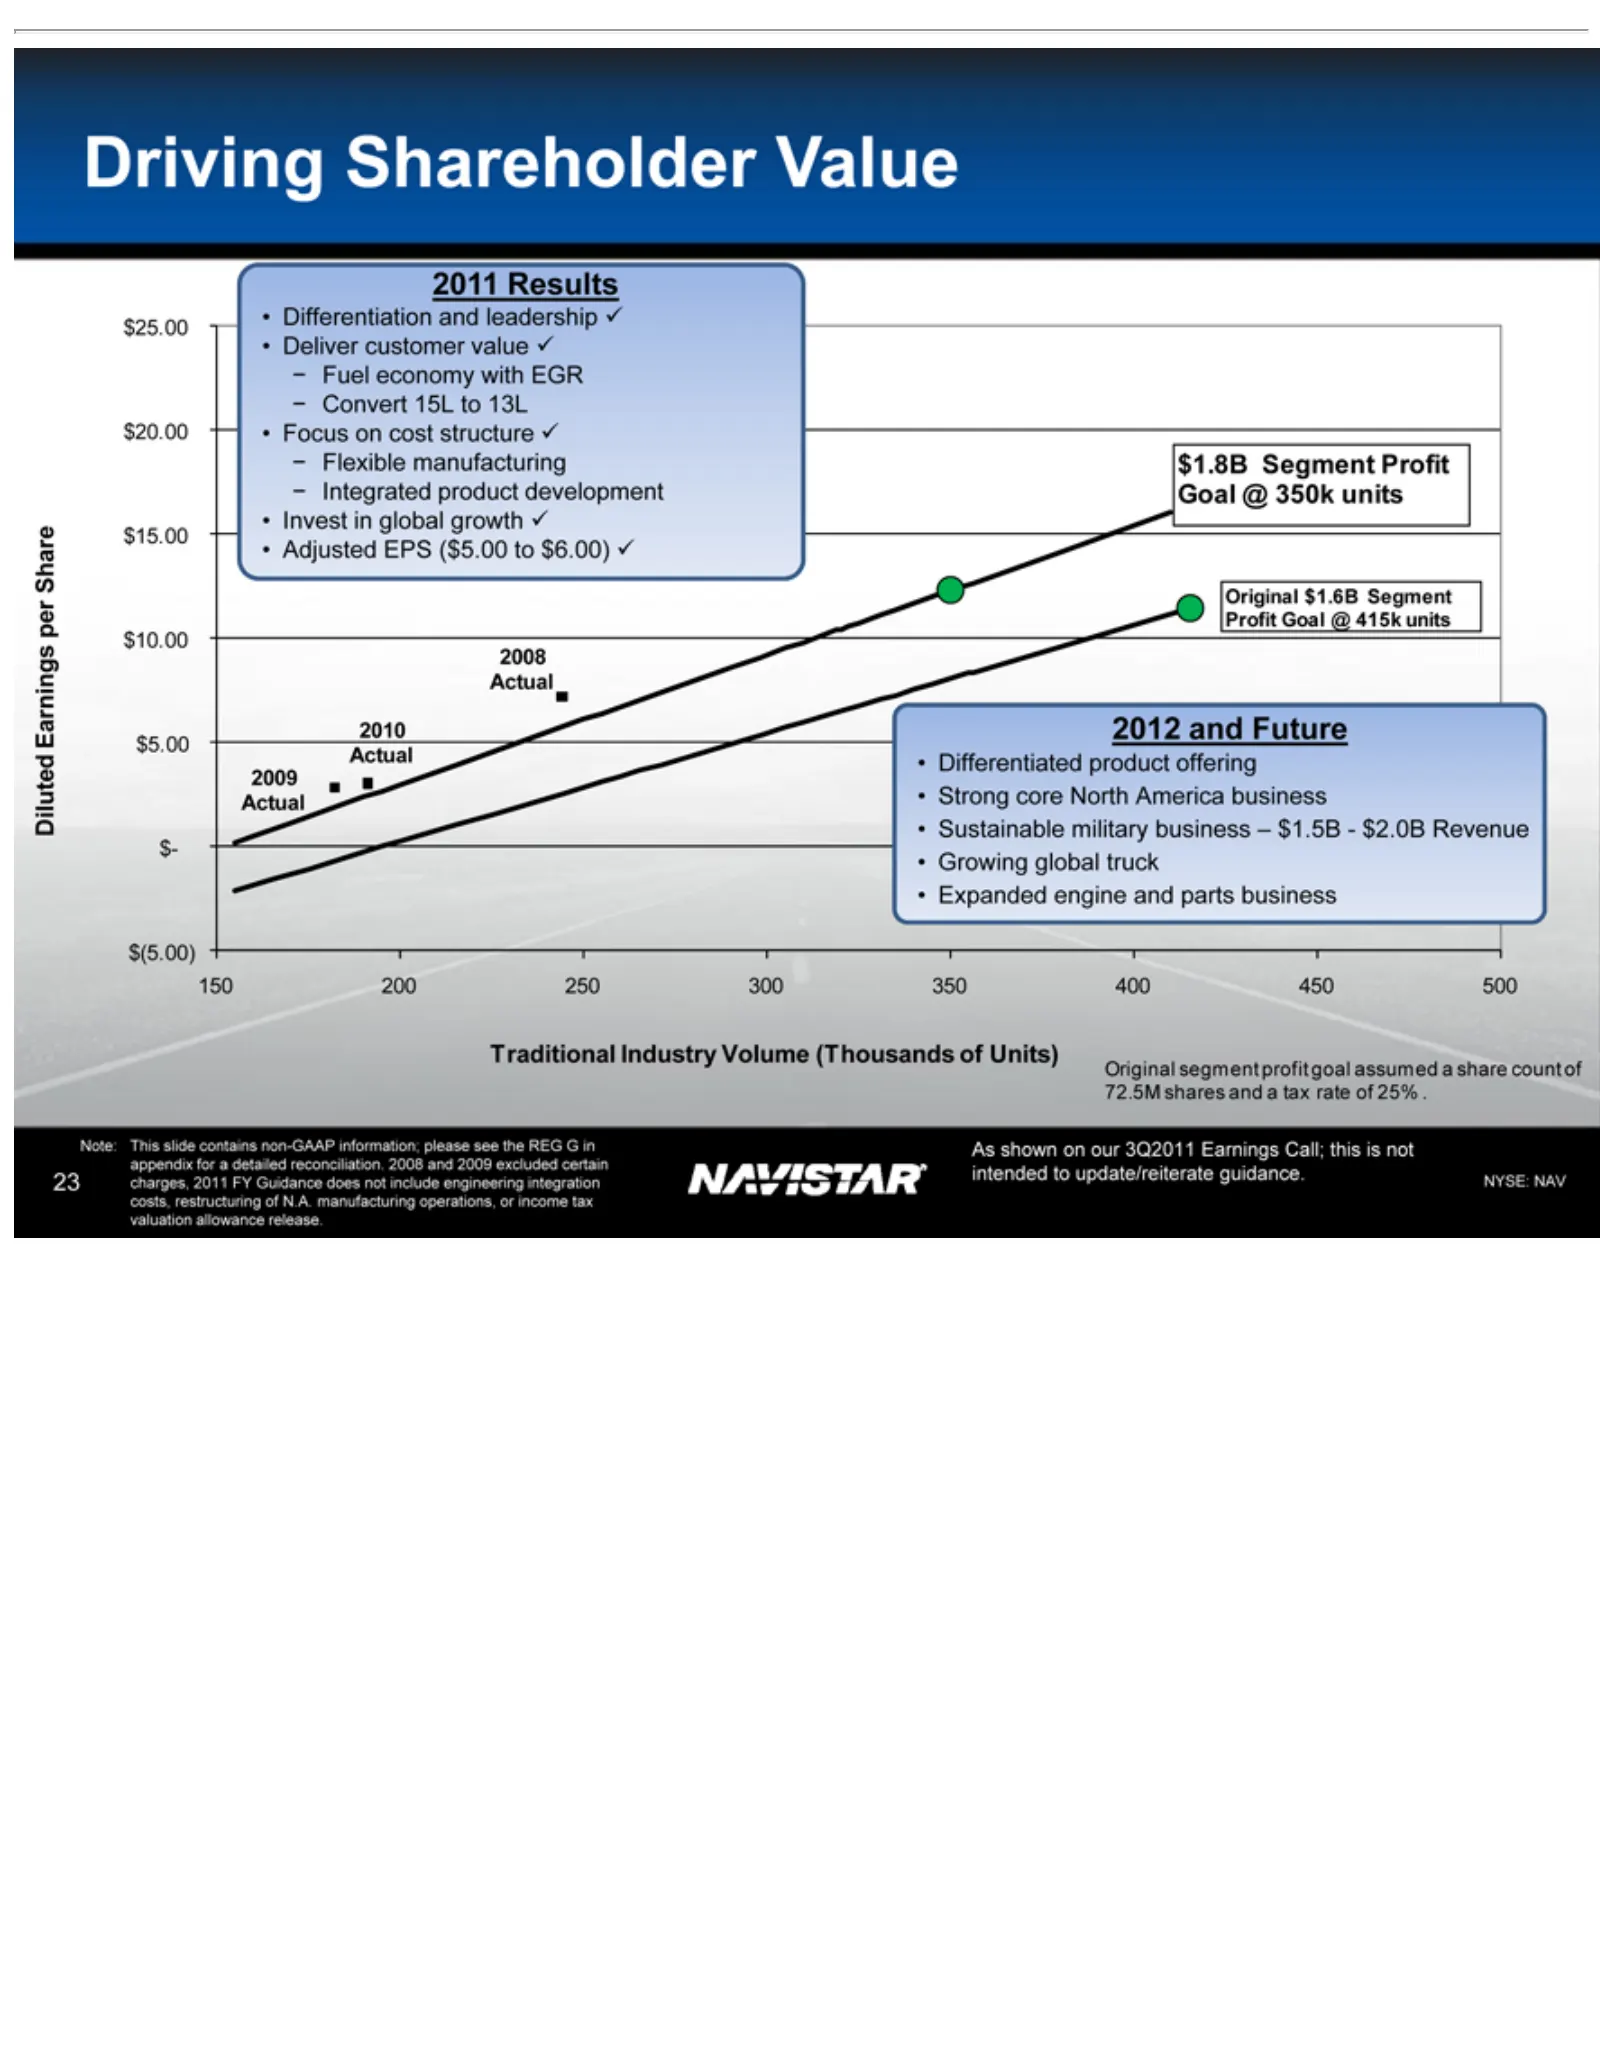
Slide 23: Driving Shareholder Value: Earnings Goal
Driving Diluted $5.00 $10.00 $15.00 $20.00 $25.00 150 $(5.00) 2011 Fuel Convert Flexible Integrated $1.8B 2008 2010 2009 •2012 Traditional Original Note: costs, As NYSE: 23 Adjusted Differentiation Deliver Focus Invest Differentiated Strong Sustainable Growing Expanded shown 200 economy Actual Resul
Slide 24: Appendix
NYSE: NAV 24 Appendix
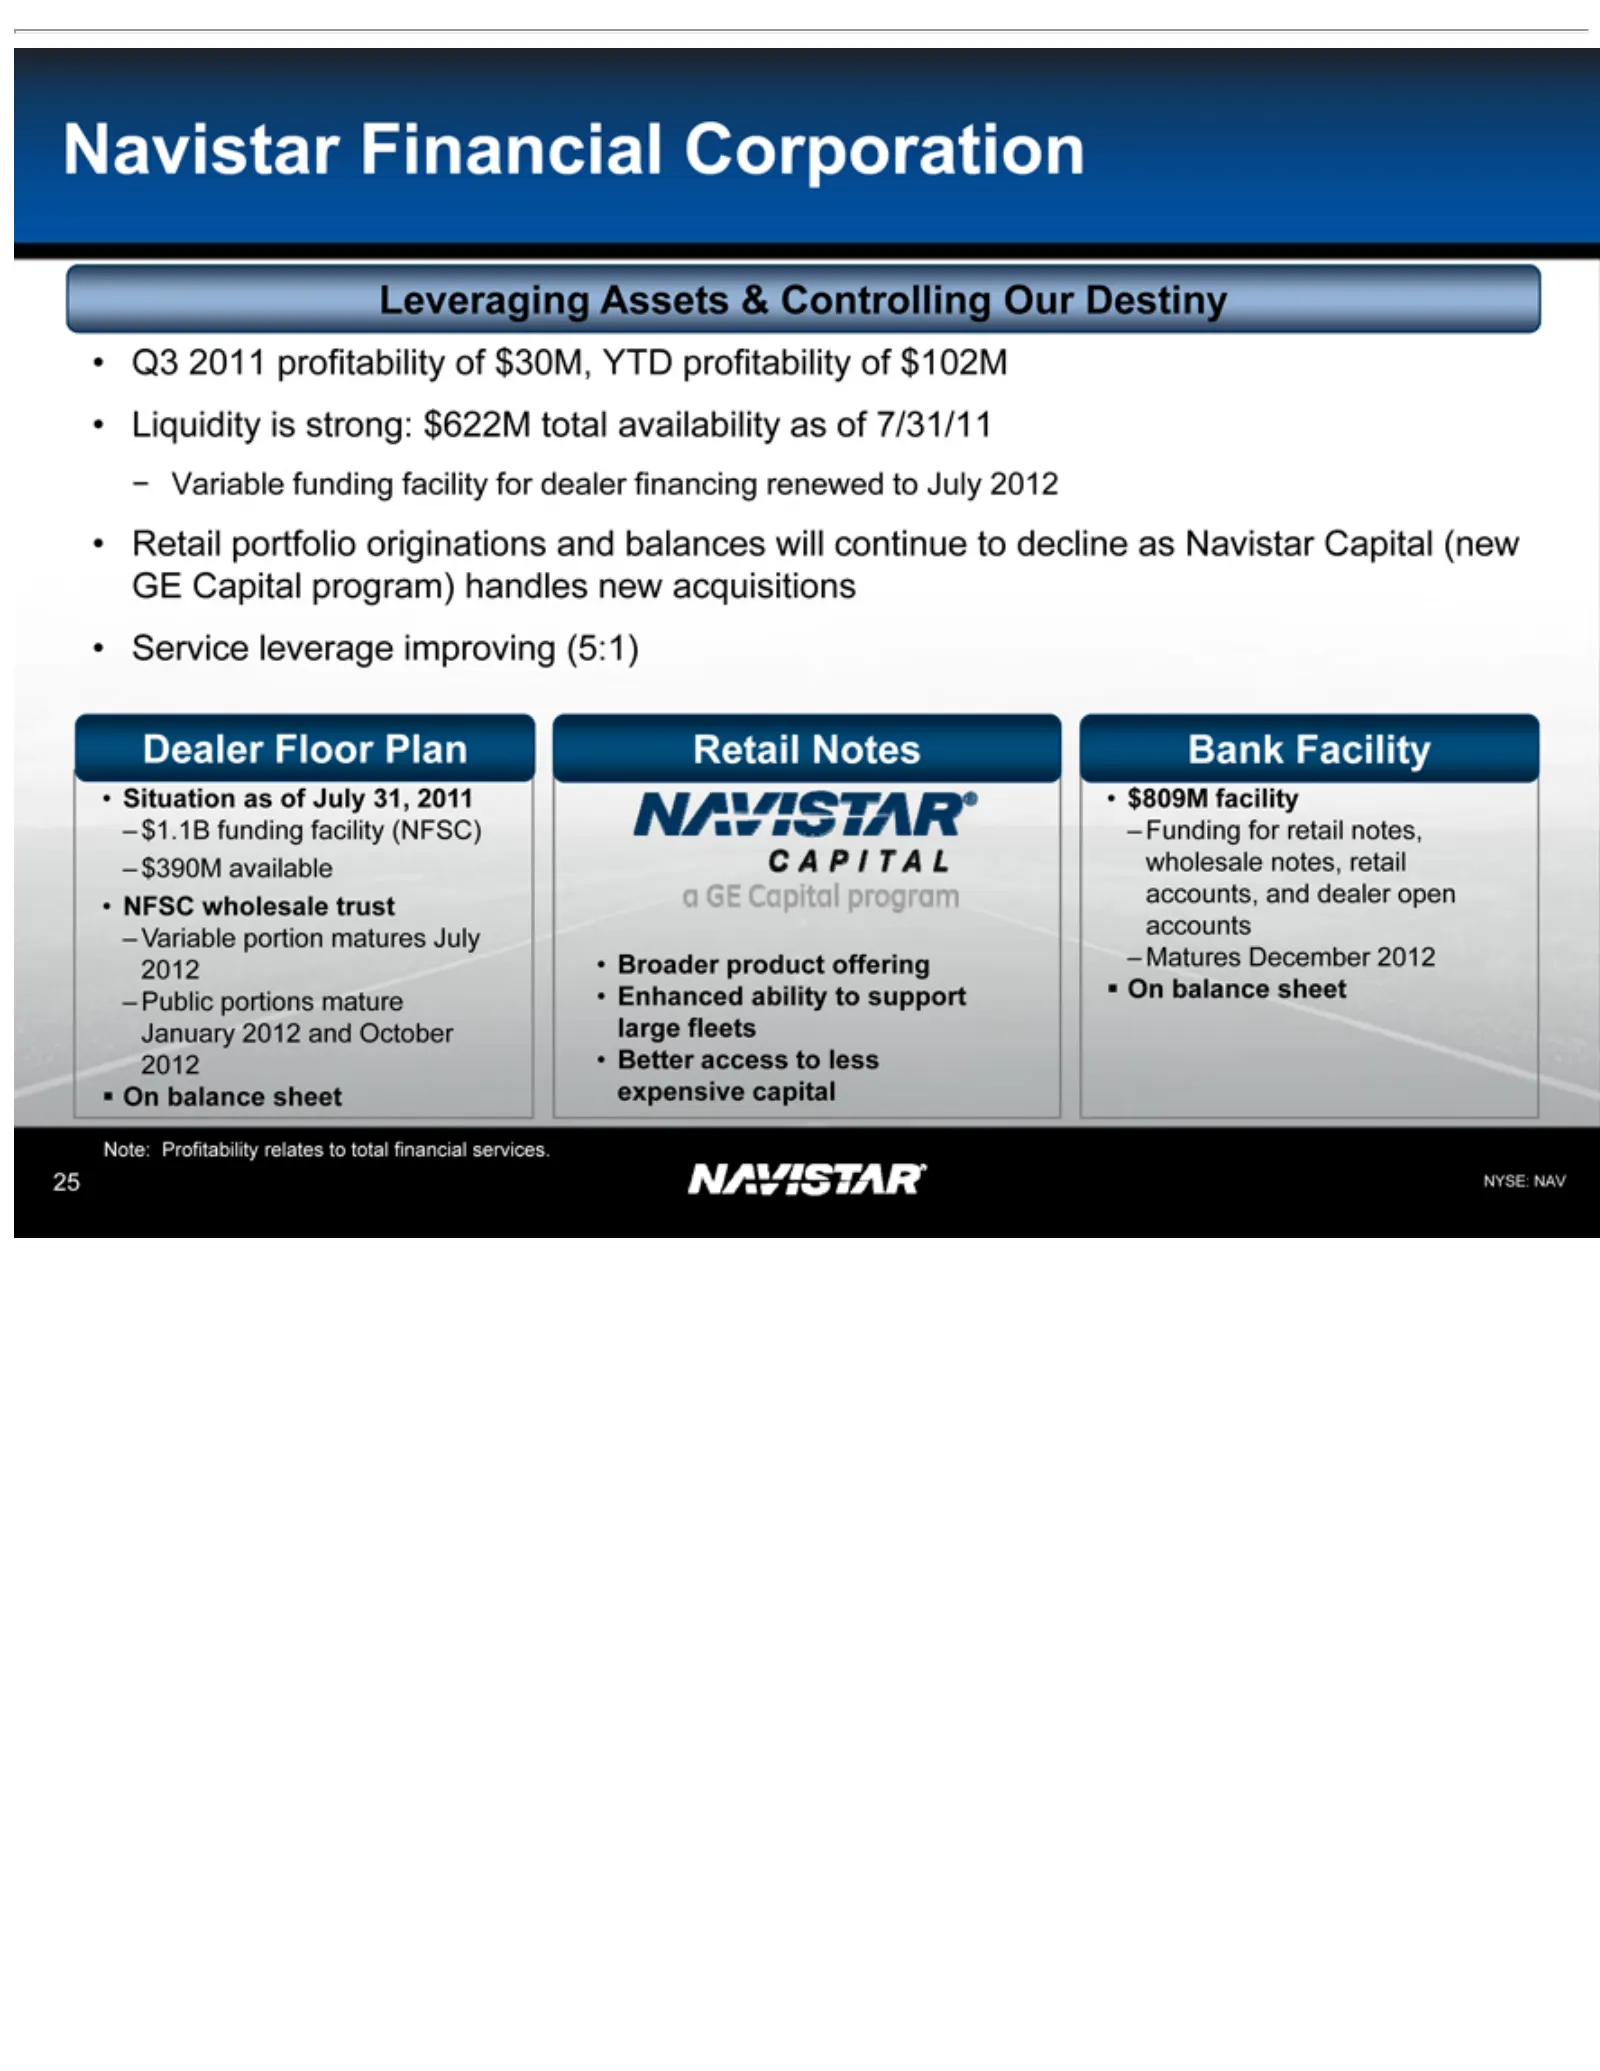
Slide 25: Navistar Financial Liquidity and Funding
Navistar Leveraging Variable Dealer Retail •–Bank Note: NYSE: 25 Q3 Liquidity Retail Service Situation NFSC Broader Enhanced Better $809M On Variable $1.1B $390M Public Funding Matures 2011 balance Facility Profitability Notes Floor NAV portfolio access wholesale funding portions funding Financial f
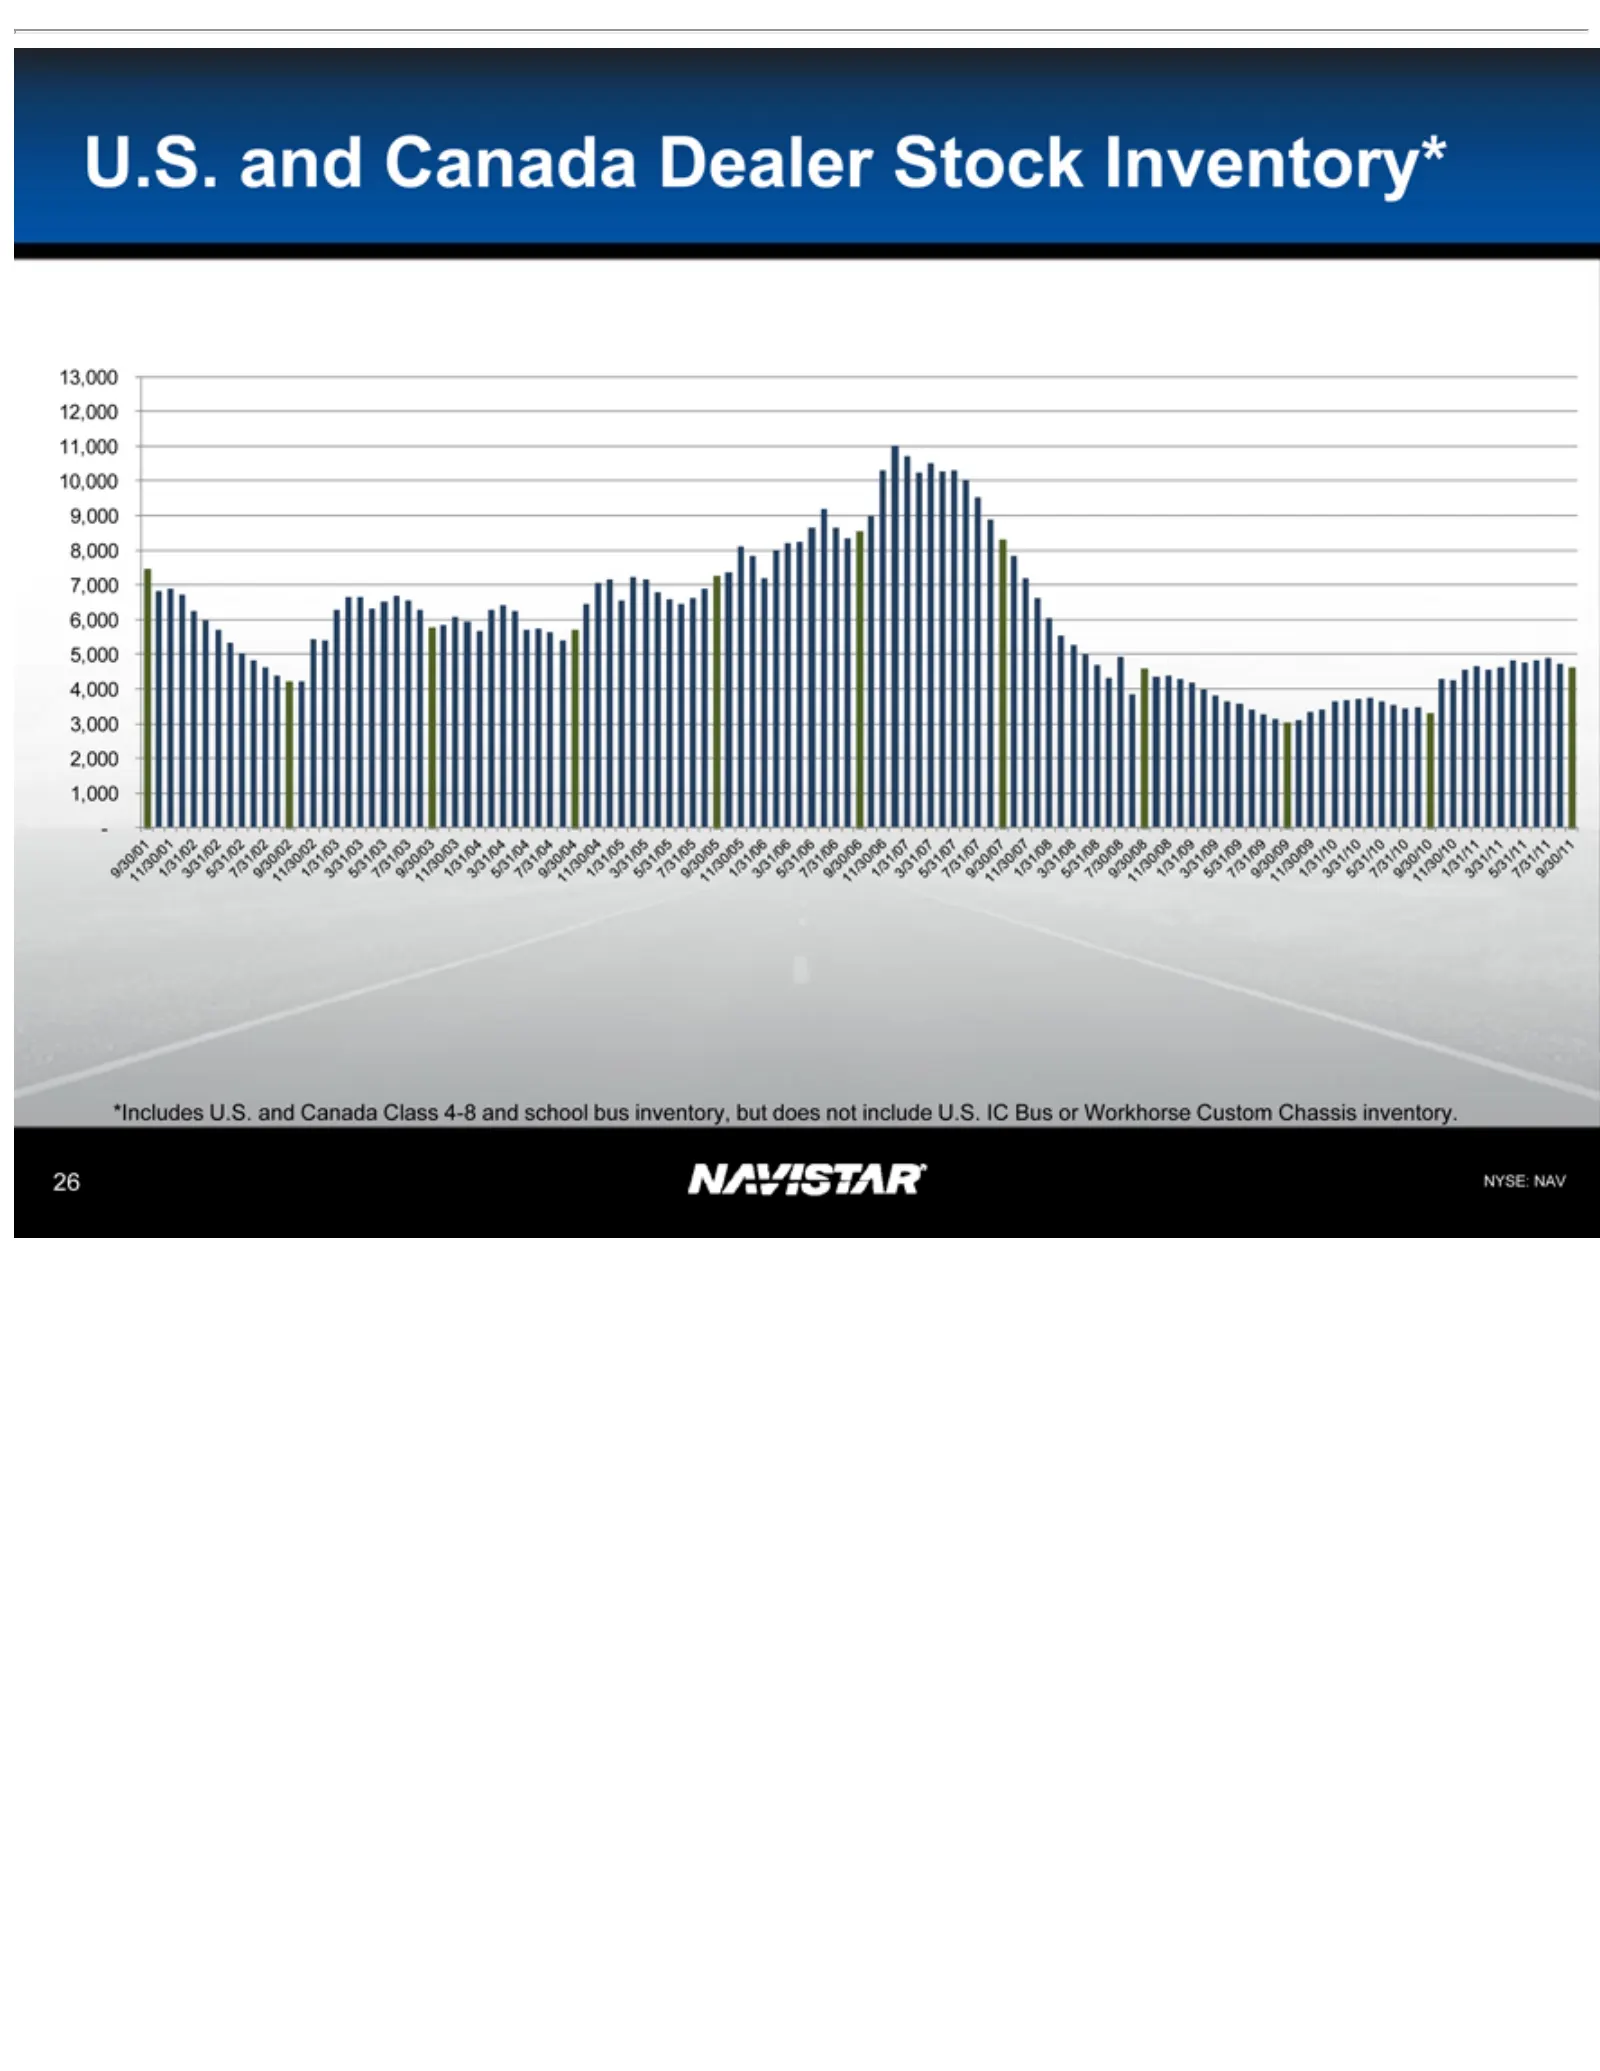
Slide 26: U.S. and Canada Dealer Stock Inventory
U.S. and12,000 13,000 9/30/01 11/30/05 11/30/06 *Includes 9/30/11 7/31/11 5/31/11 3/31/11 1/31/11 NYSE: 26 NAV 11/30/01 Canada 1/31/06 1/31/07 U.S. 11,000 and Dealer 3/31/06 3/31/07 1/31/02 Canada 10,000 Stock 5/31/06 5/31/07 3/31/02 Class 9,000 Inventory* 4-8 7/31/06 7/31/07 5/31/02 8,000 and schoo
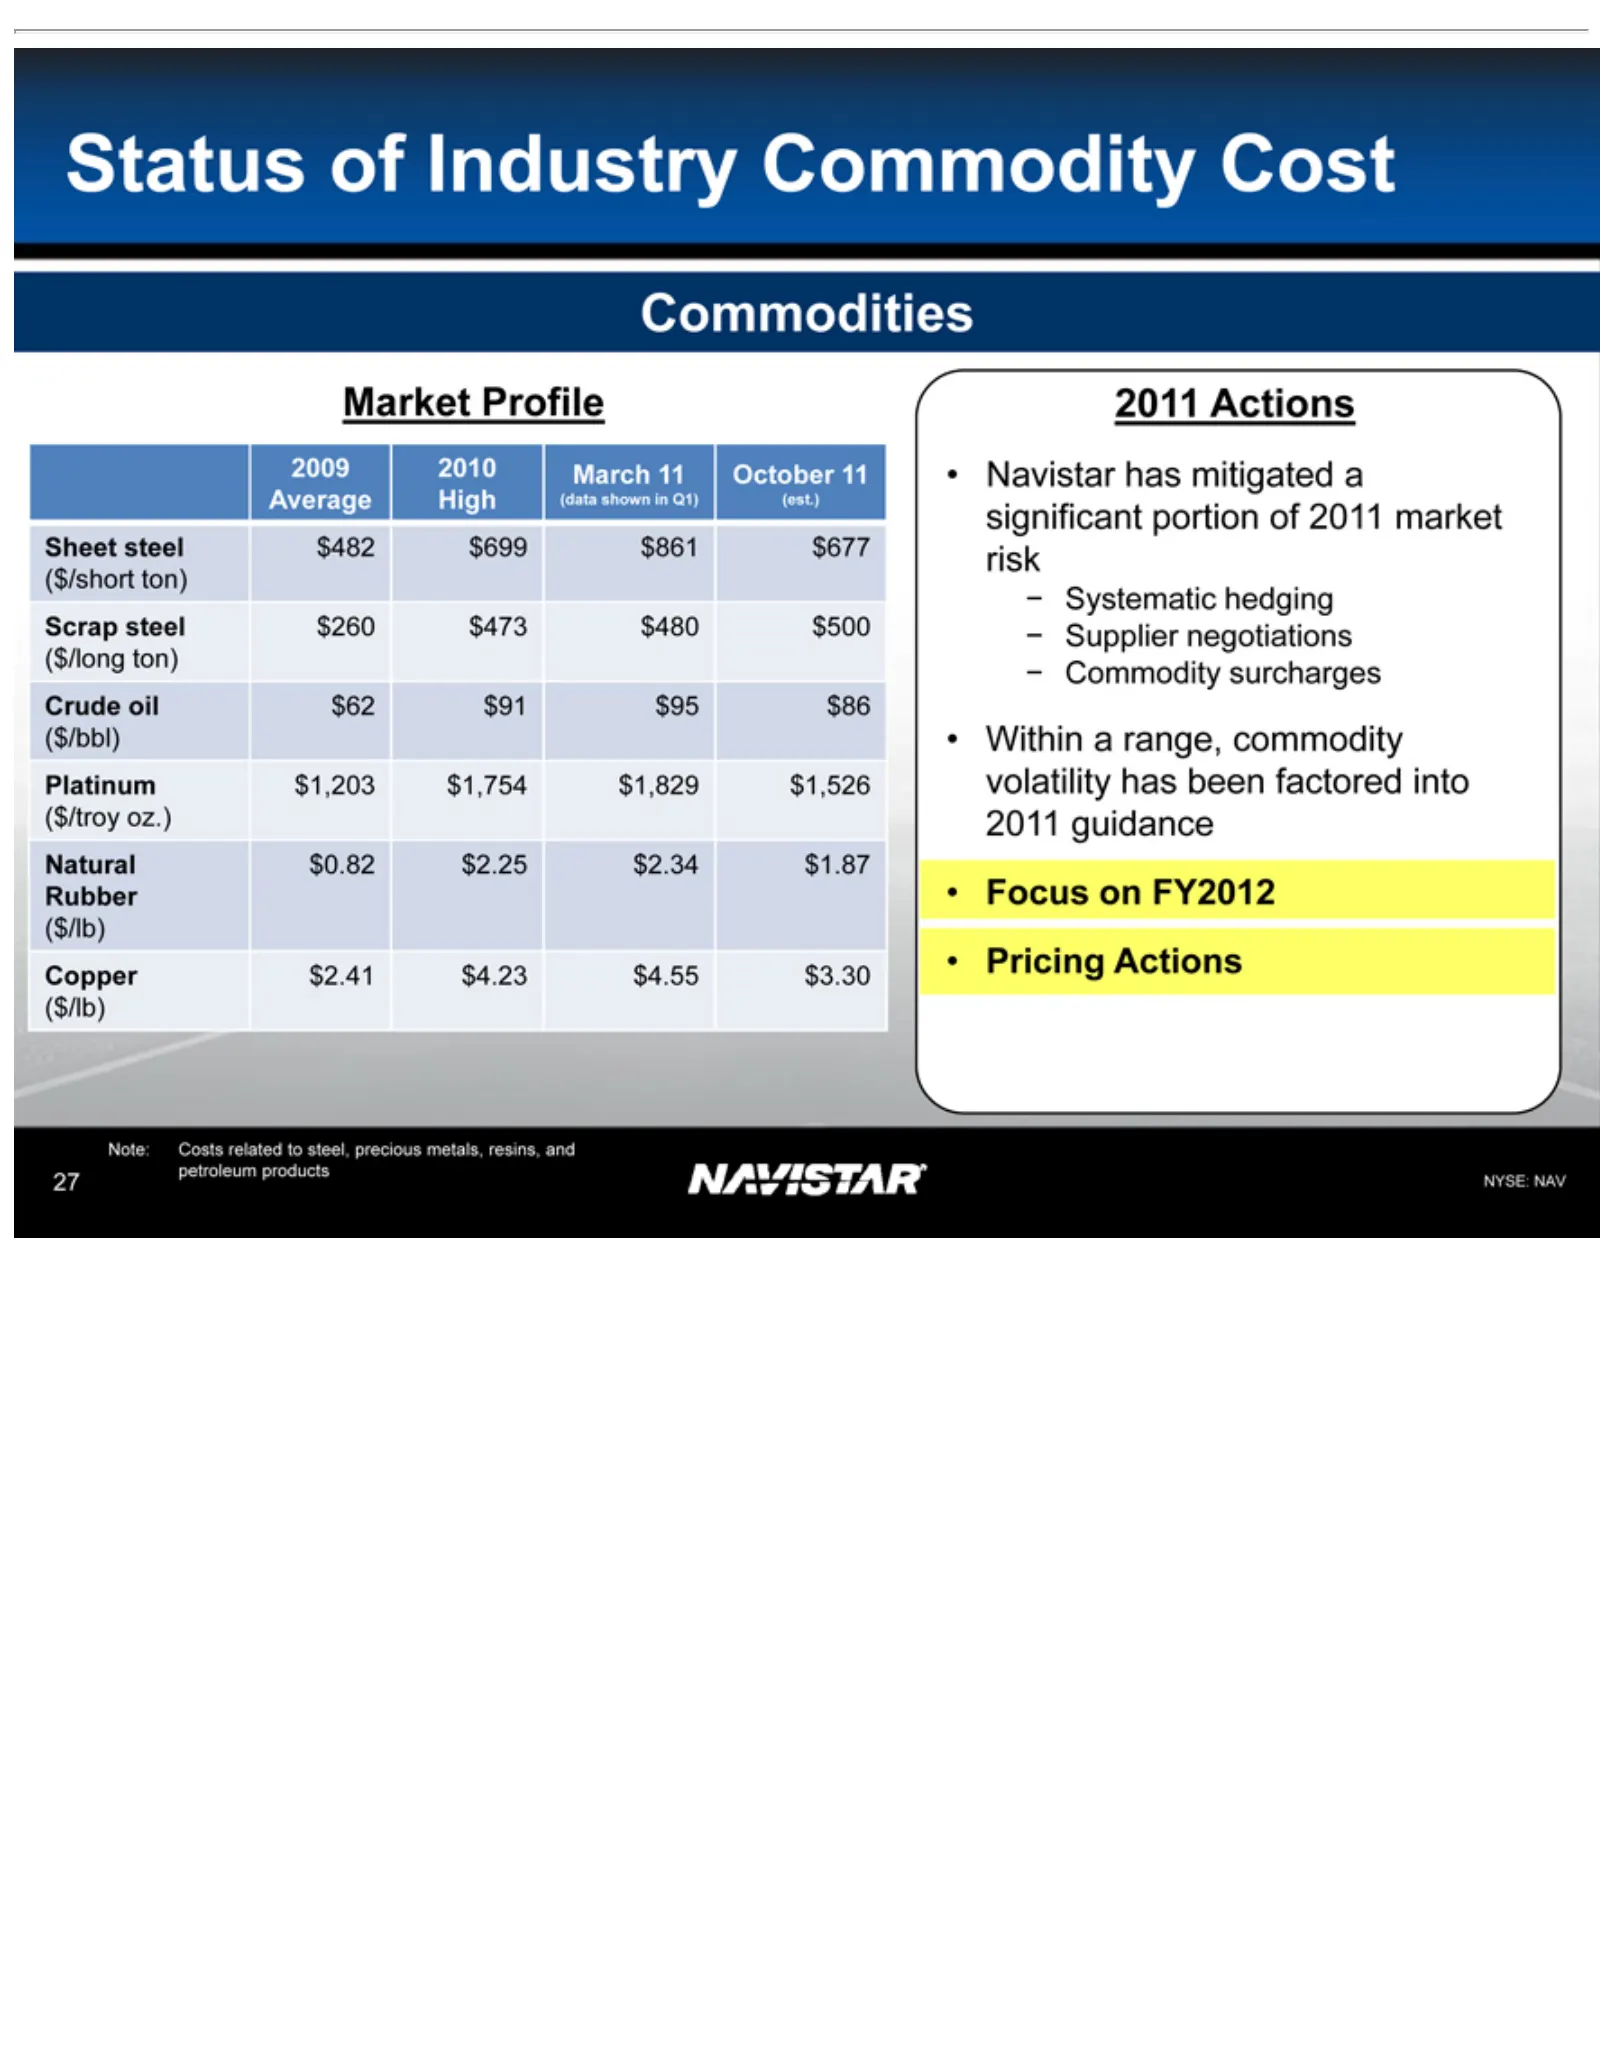
Slide 27: Commodities Market Status
Status Market Commodities 2009 Average Sheet ($/short Scrap ($/long Crude Platinum ($/bbl) ($/troy Natural Copper Rubber 2011 ($/lb) —Systematic —Supplier •—Commodity Note: NYSE: 27 Within Navistar Focus Pricing Actions 2010 steel Costs oil of oz.) Profile ton) NAV $2.41 on $0.82 ton) High(data aAct
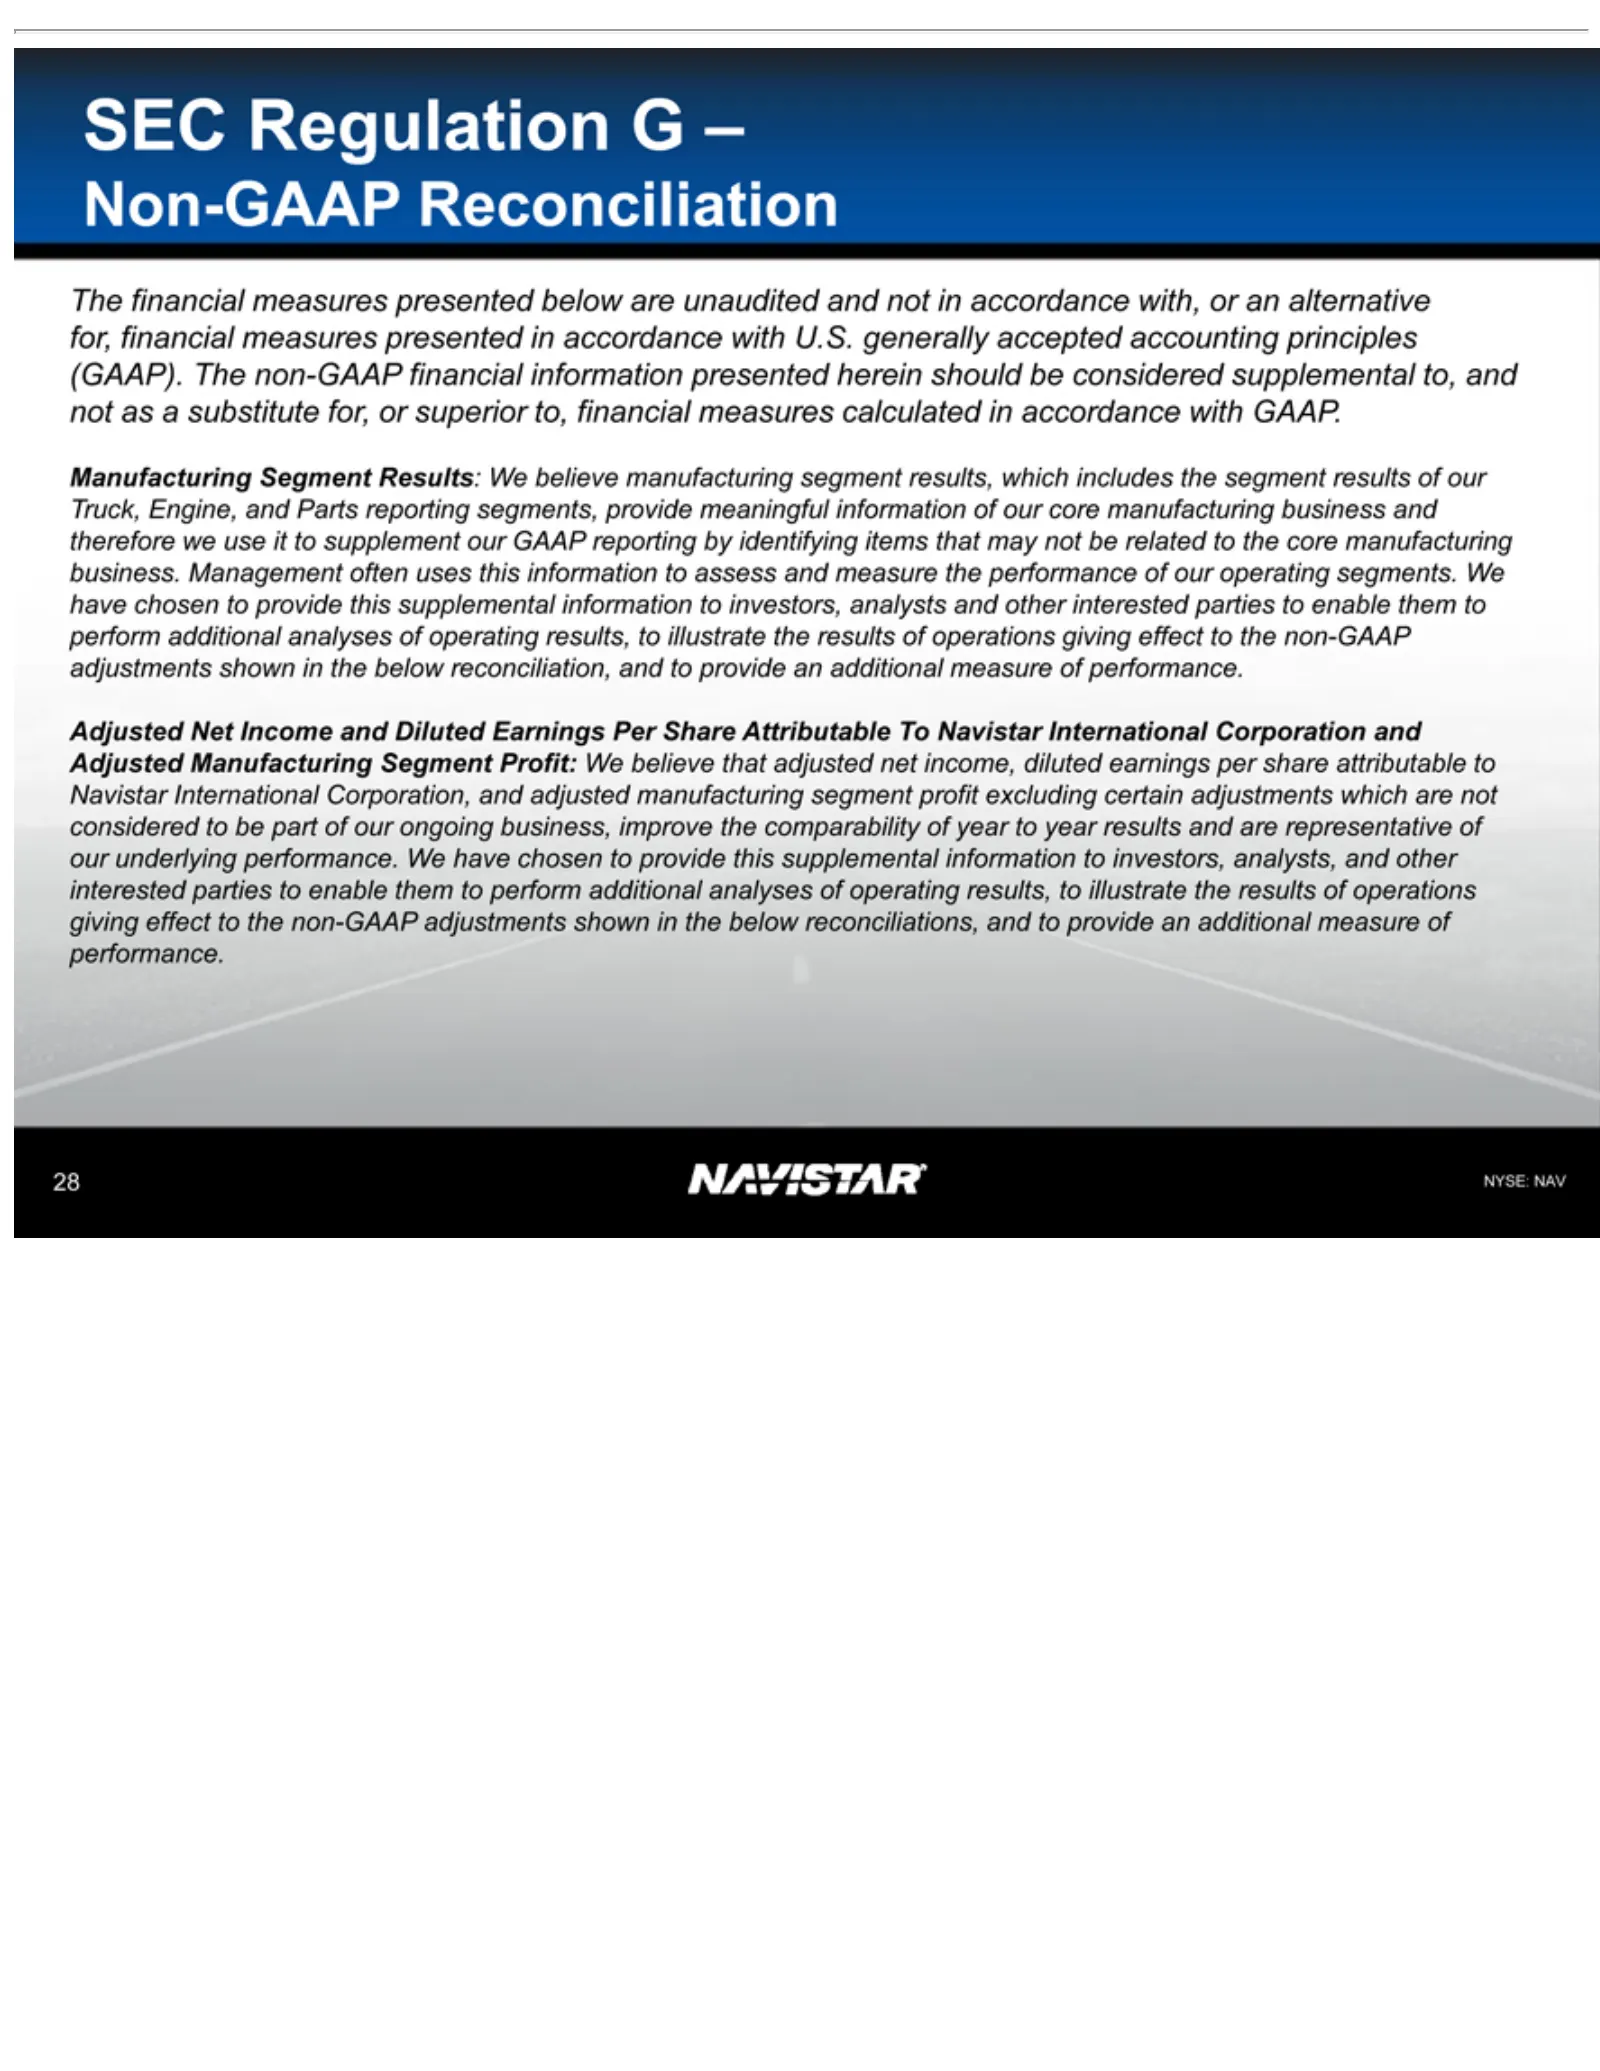
Slide 28: SEC Regulation G Non-GAAP Reconciliation
SECfinancial Non-GAAP The non-GAAP Manufacturing manufacturing measure operating Adjusted attributable year additional NYSE: 28 to Regulation year NAV the Net results, analyses financial to results Reconciliation performance measures Income Navistar business Segment Gto–and of illustrate information
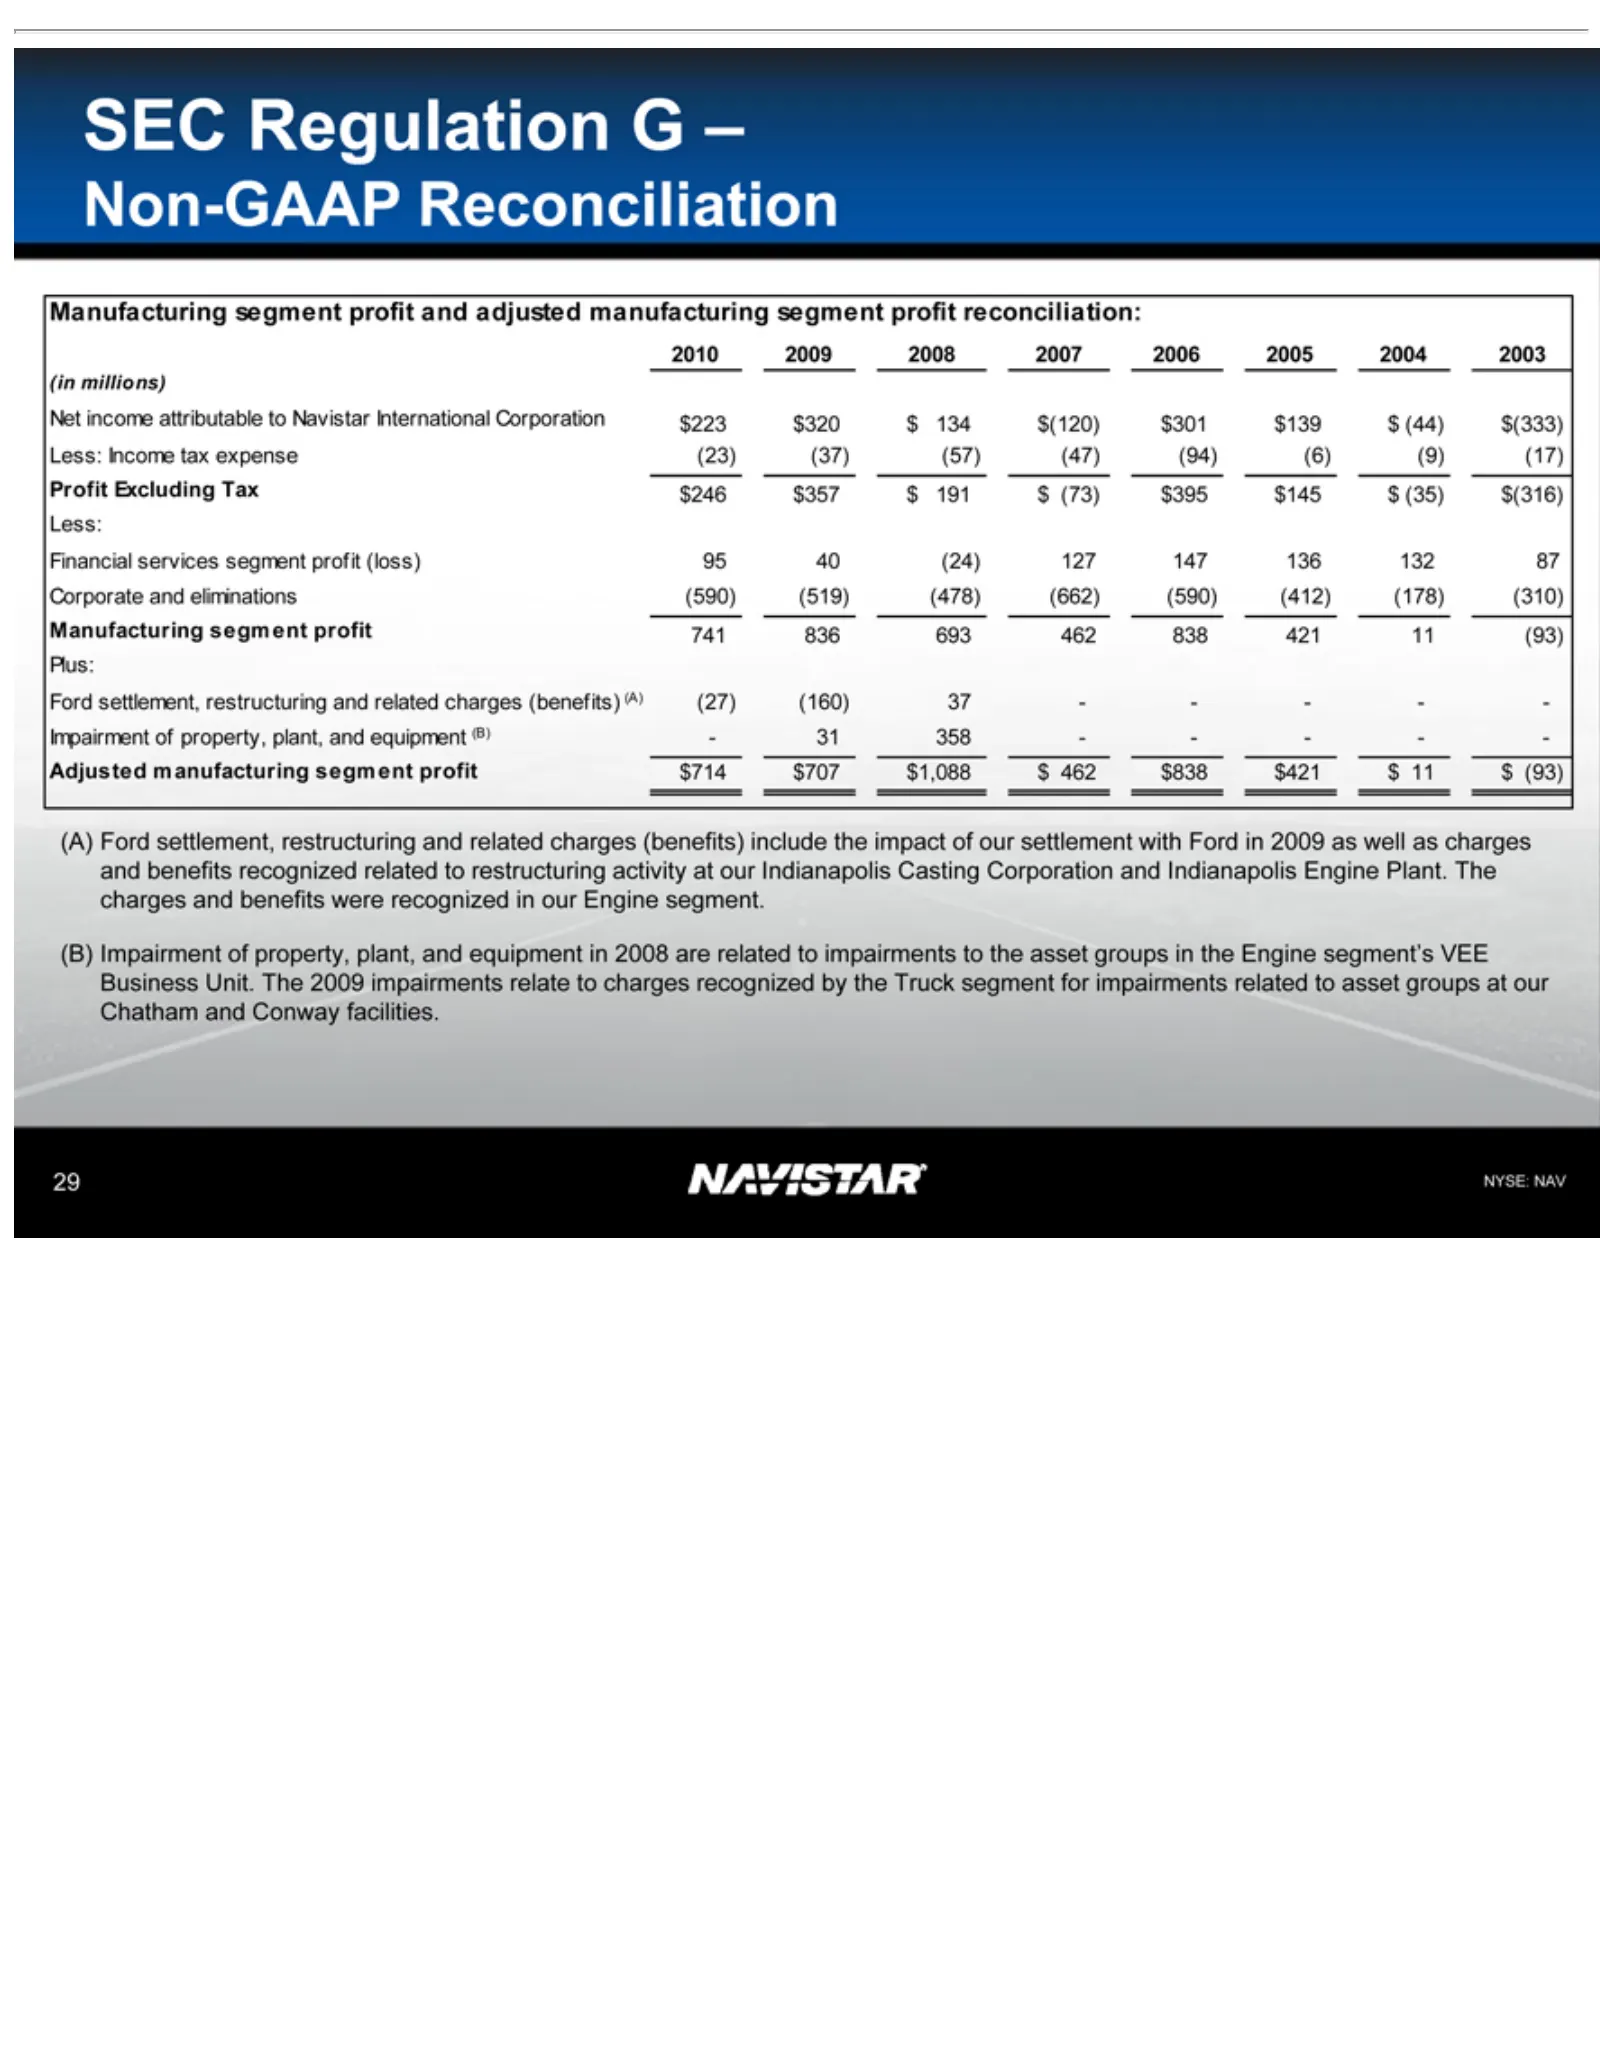
Slide 29: SEC Regulation G Non-GAAP Reconciliation (in millions)
SECmillions) Non-GAAP 2010 (in Net Profit Financial Less: Corporate Manufacturing Ford Plus: Impairment Adjusted (A) Casting (B) segment NYSE: 29 Impairment Ford income Regulation settlement, 2009 Income Excluding NAV Corporation for settlement, manufacturing services and 2008 attributable of Reconc
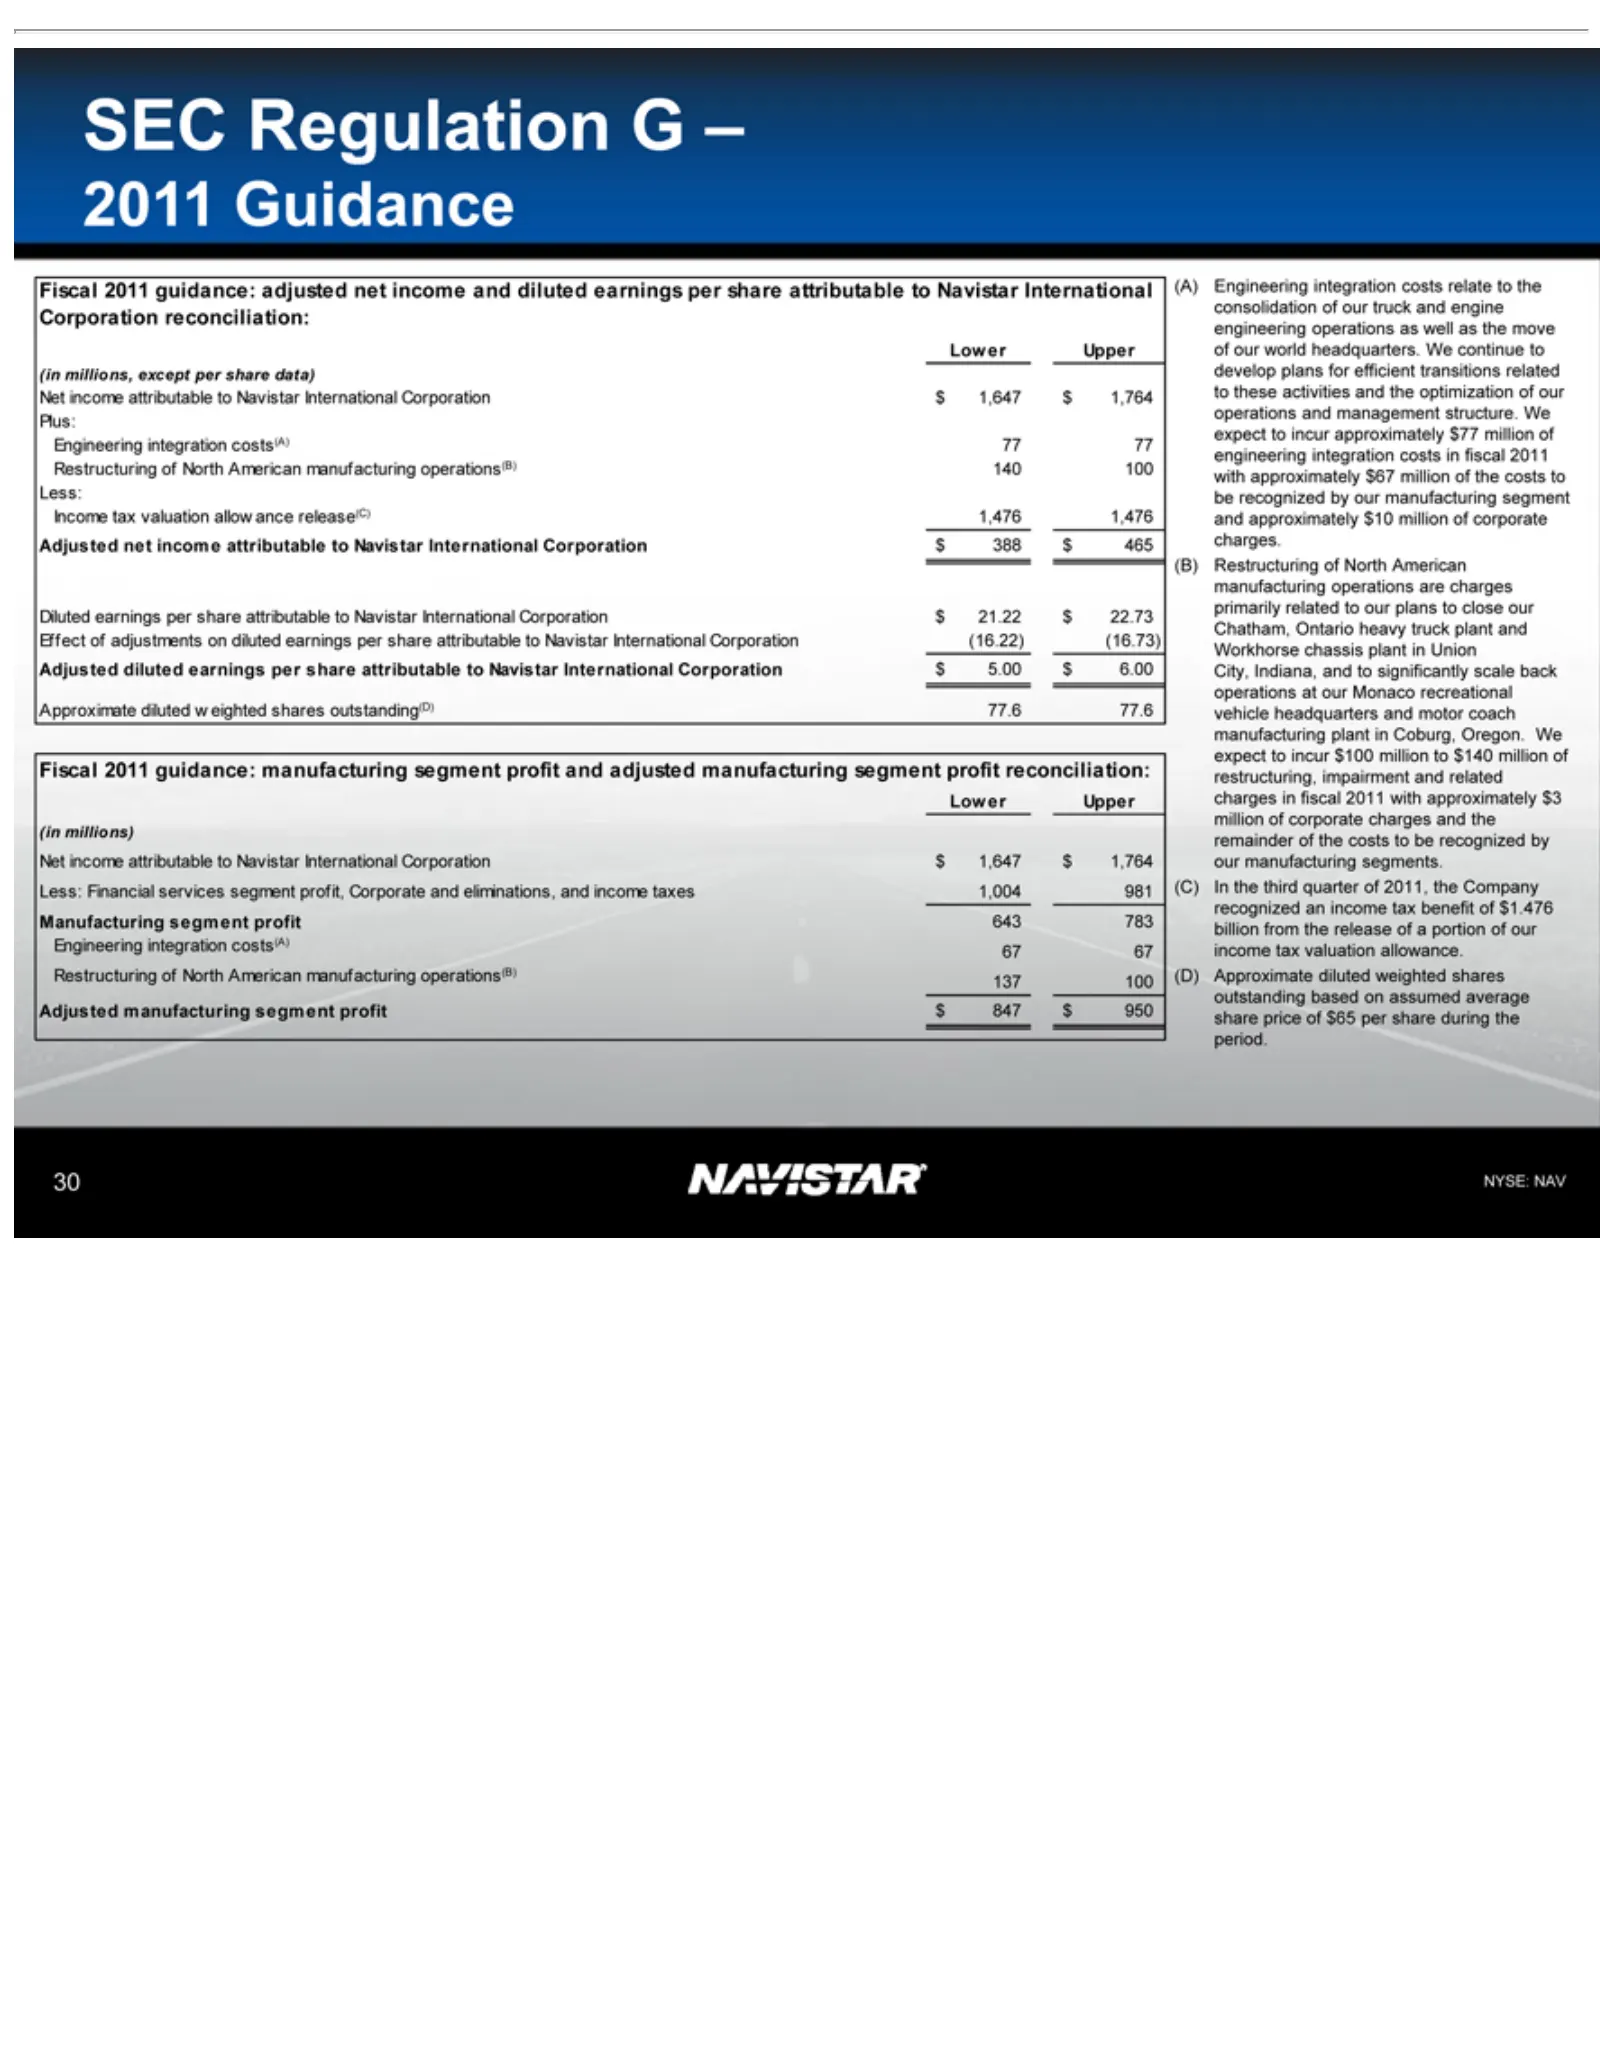
Slide 30: SEC Regulation G Non-GAAP Reconciliation: 2011 Guidance
SEC 2011 Corporation Plus: Income Diluted Effect Approximate Fiscal Lower (in Net Less: Manufacturing Engineering Restructuring Adjusted (A) to costs (B) significantly impairment (C) (D) NYSE: 30 these millions, millions) Approximate Restructuring In Engineering income Regulation Guidance to Financi
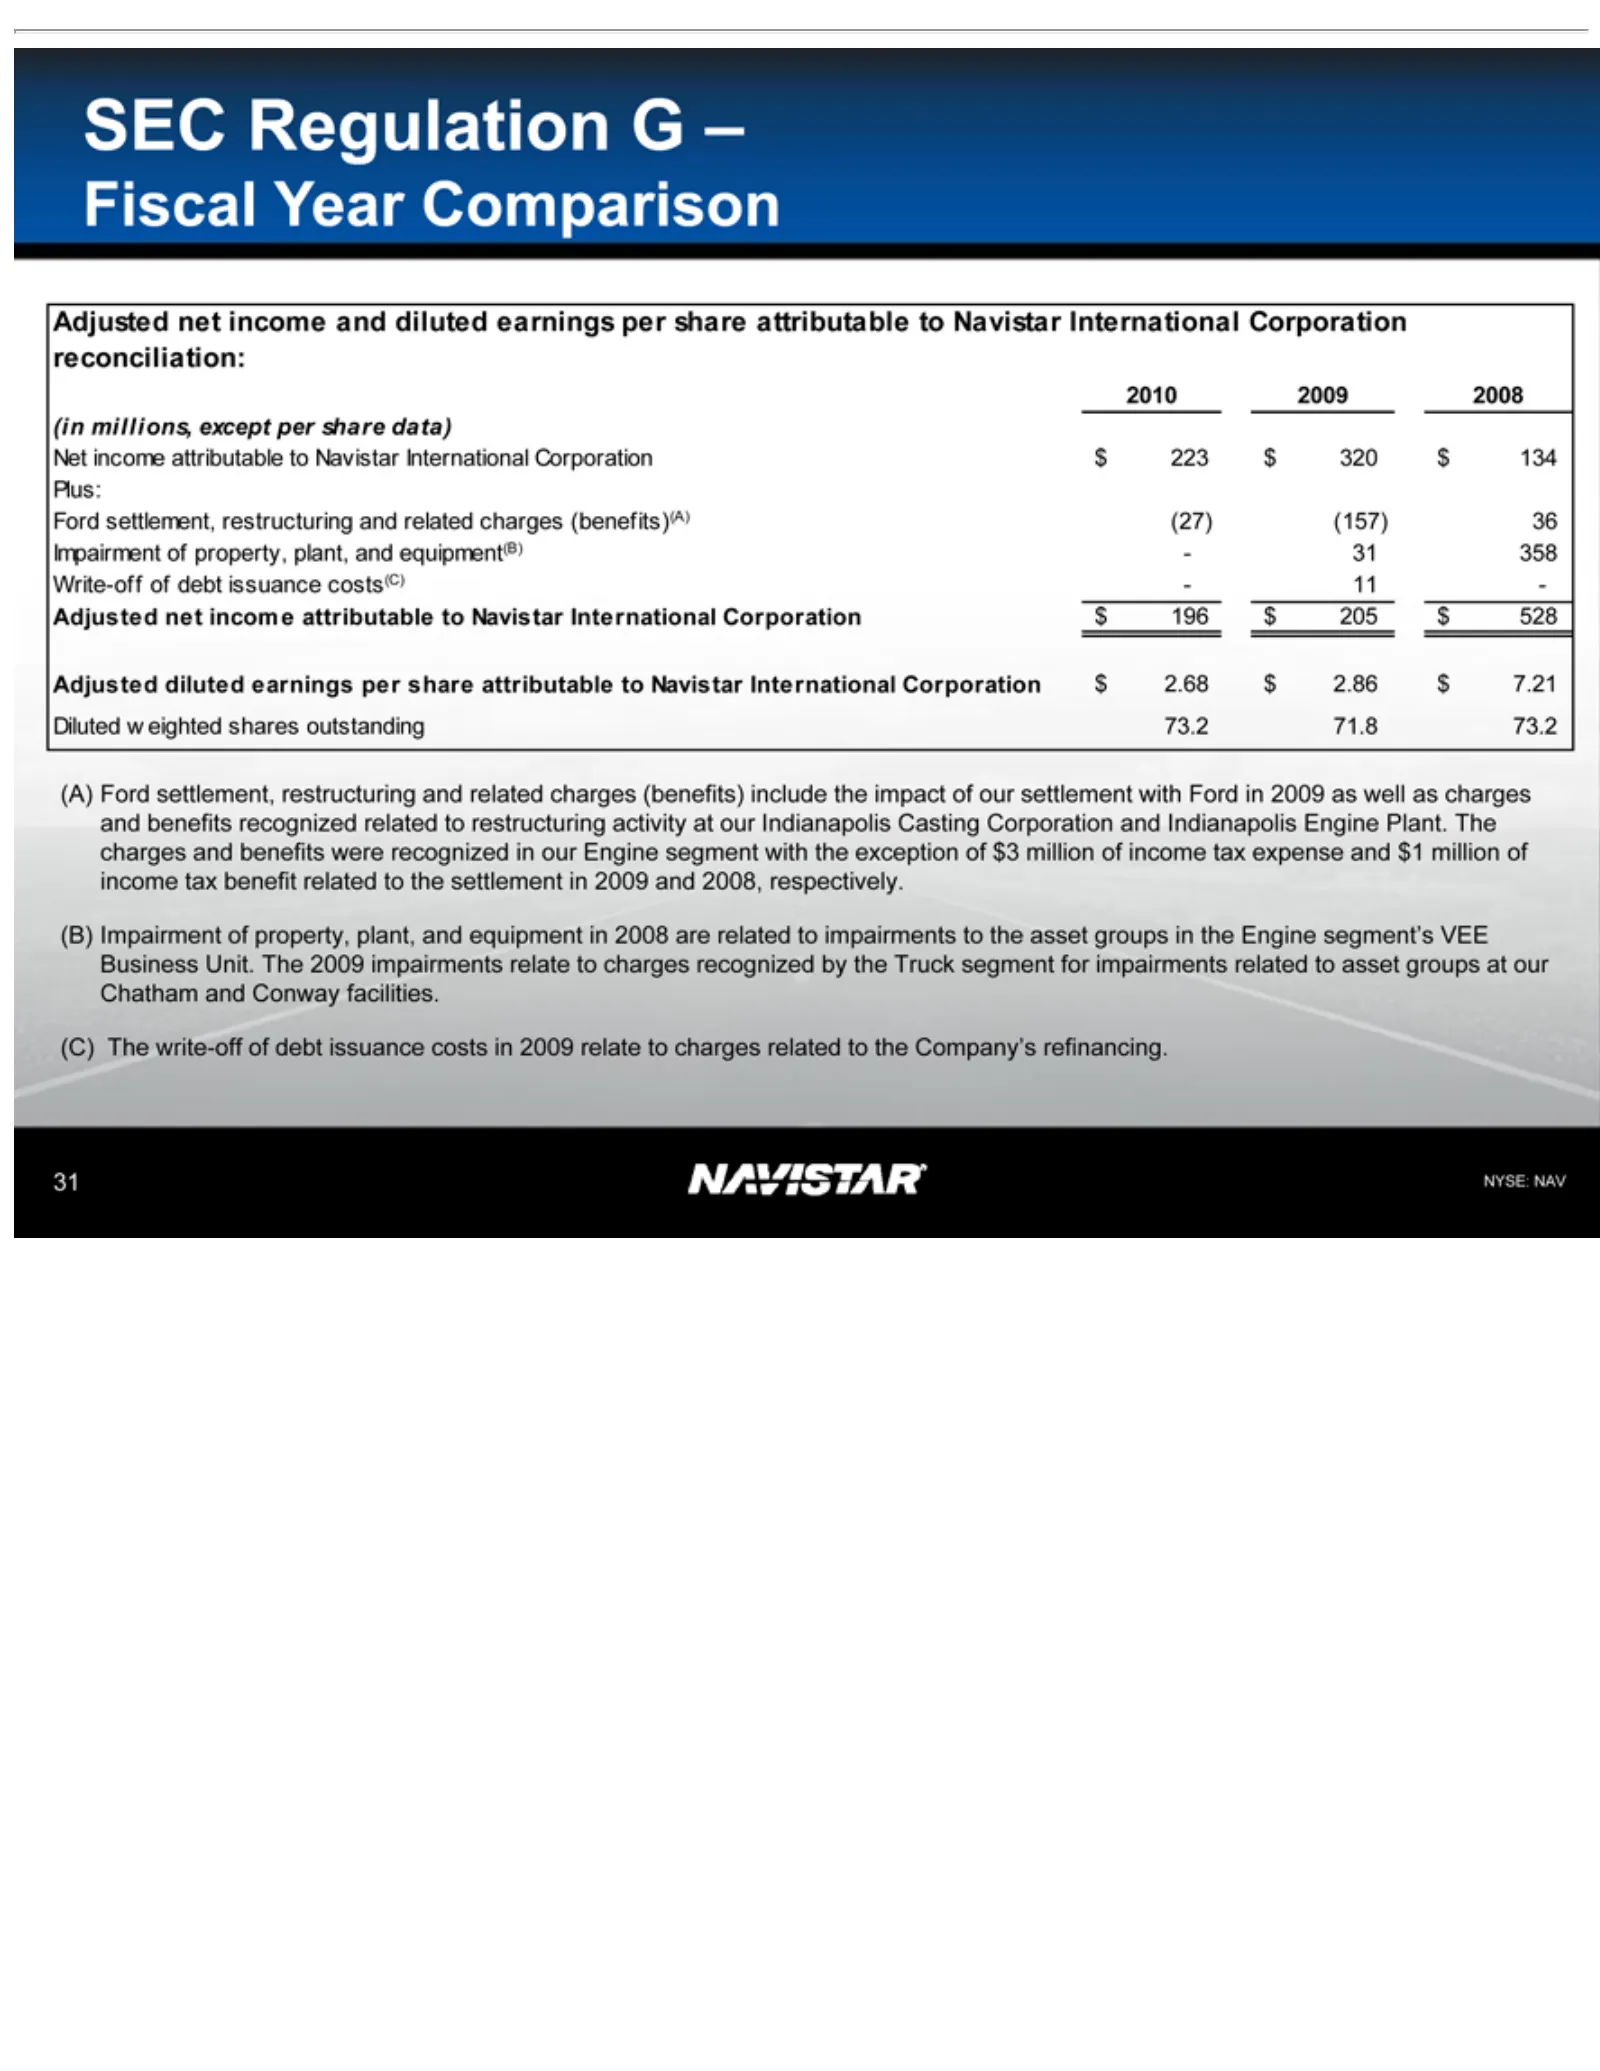
Slide 31: SEC Regulation G Fiscal Year Comparison
SEC Fiscal 2010 (in Net Ford Plus: Impairment Write-off Adjusted Diluted (A) Casting to (B) segment (C) NYSE: 31 the millions, The Impairment Ford income Regulation settlement, 2009 settlement Year NAV weighted Corporation write-off for settlement, net diluted of2008 Comparison attributable of impai
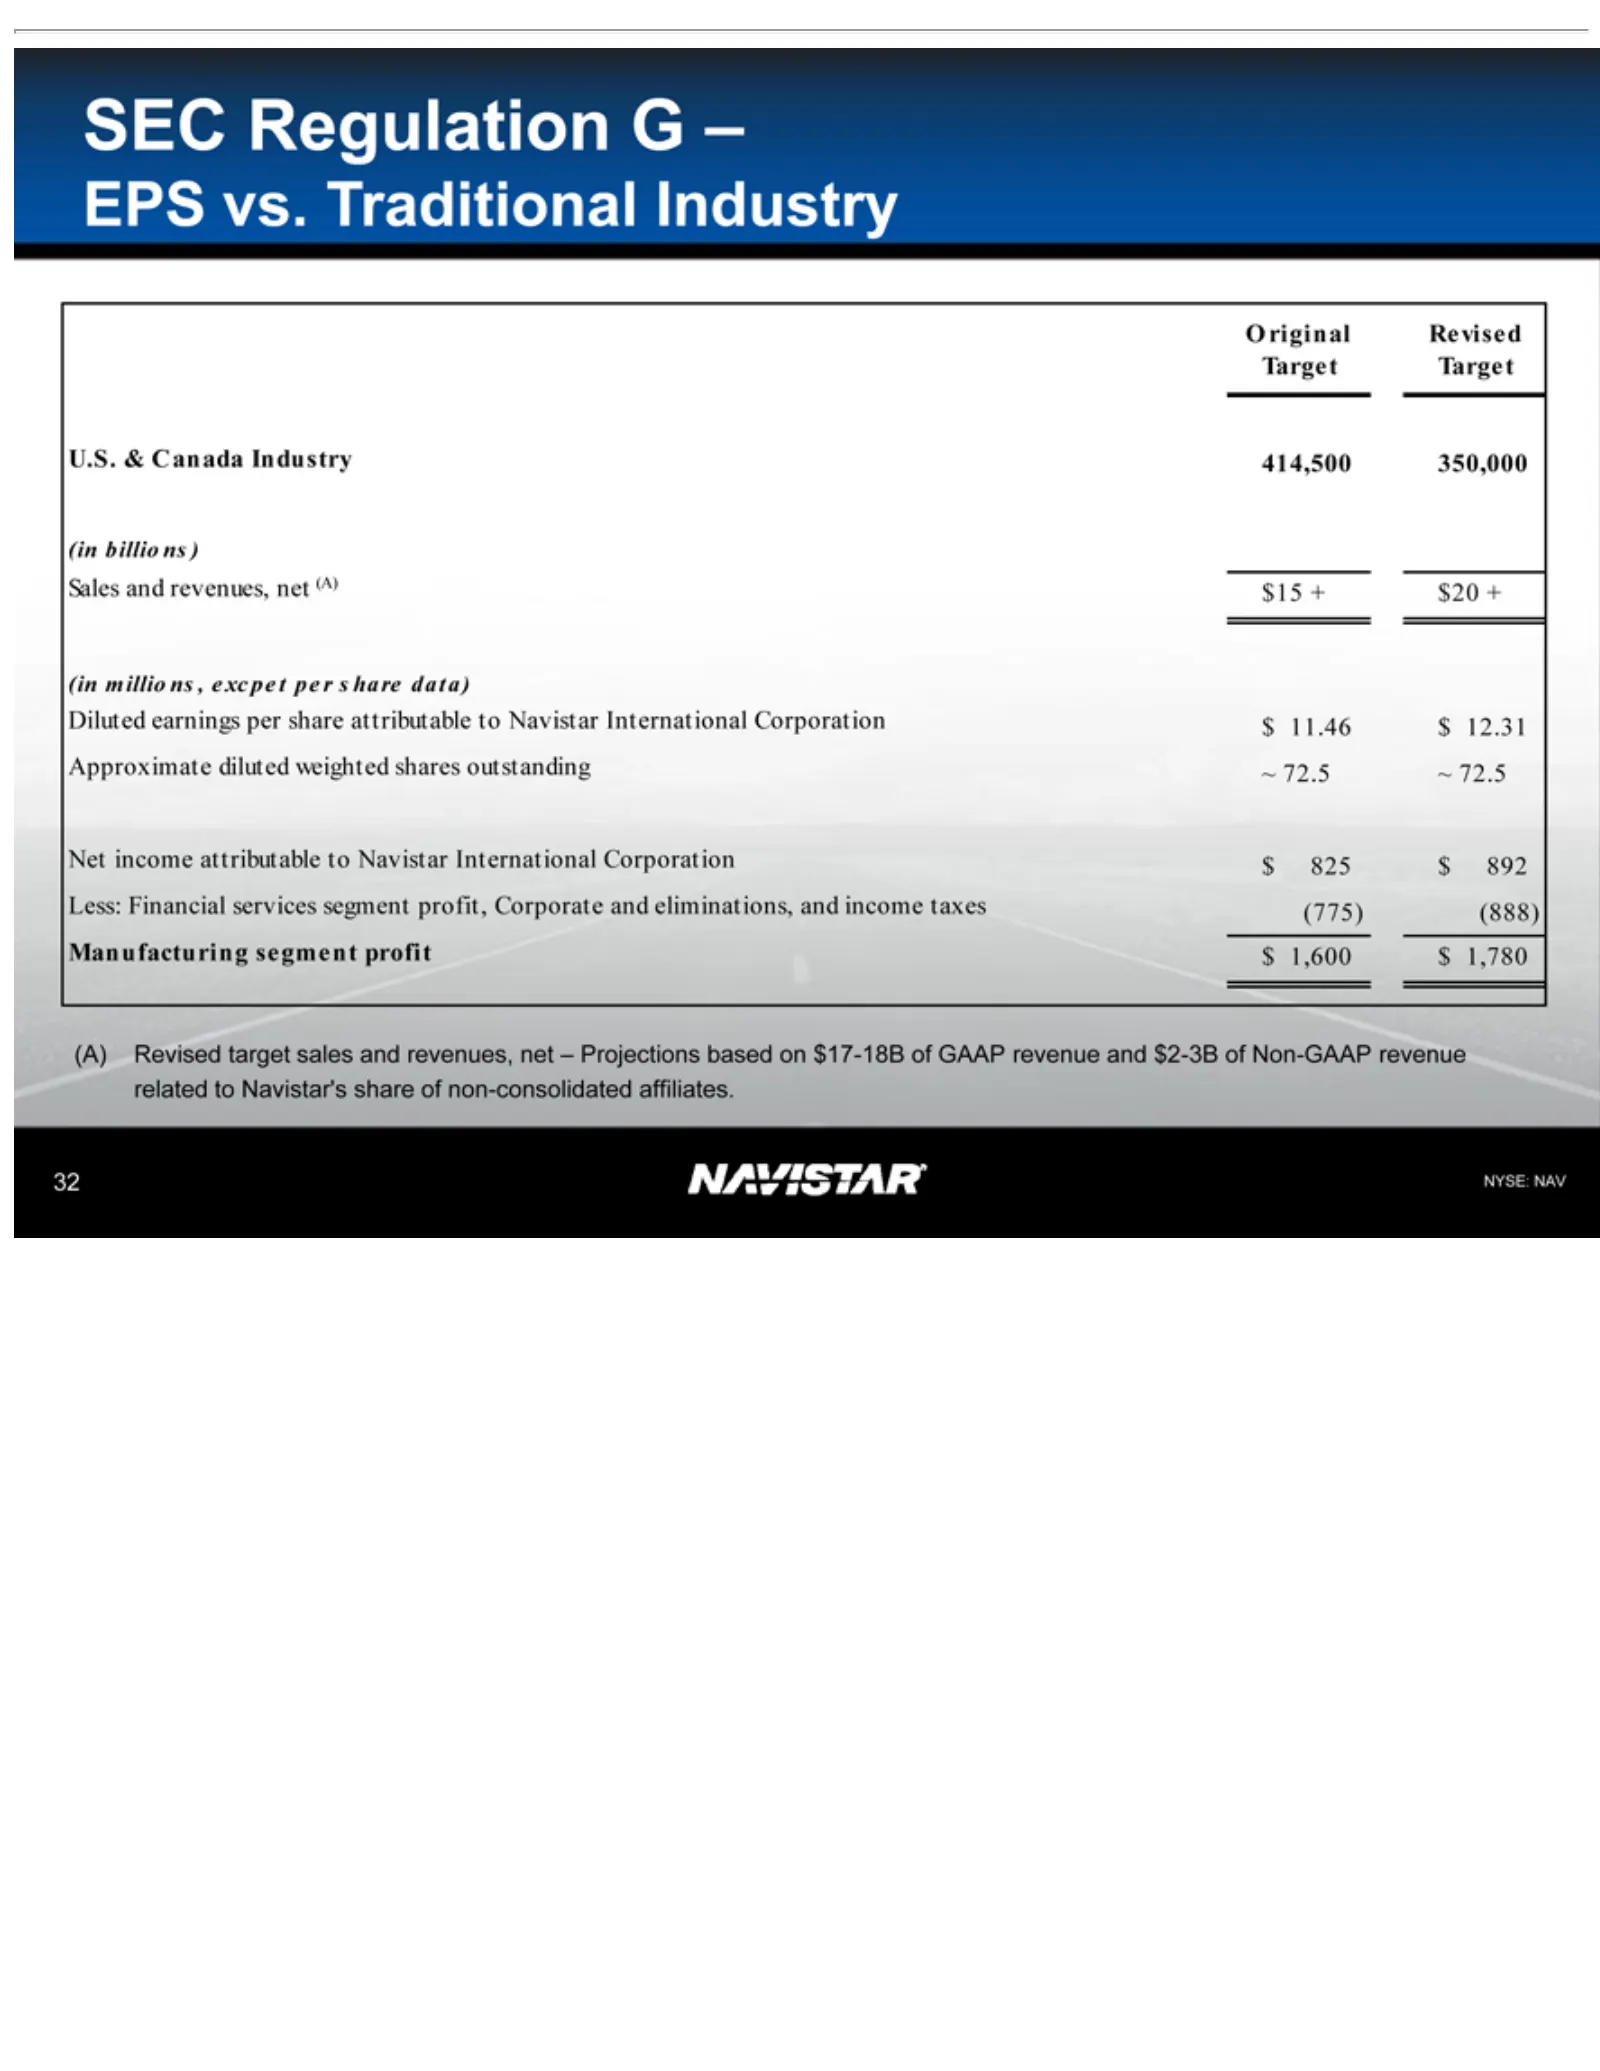
Slide 32: EPS and Industry Original vs Revised Target
SECmillions, EPS Original Target U.S. Sales (in Diluted Approximate Net Less: Manufacturing (A) NYSE: 32 billions) Revised income vs. & Regulation and Financial Target Canada NAV earnings Traditional Revised revenues, attributable target excpet diluted segment Industry services Gper sales –per Indus
Source: SEC EDGAR · 8-K filed Oct 31, 2011
More decks from Navistar International Corporation
 Q2 2021 Earnings Presentation20 slides · Jun 8, 2021
 Q1 2021 Earnings Presentation20 slides · Mar 9, 2021
 Q4 2020 Earnings Presentation22 slides · Dec 17, 2020
 Q3 2020 Earnings Presentation21 slides · Sep 9, 2020
 Q2 2020 Earnings Presentation21 slides · Jun 4, 2020
 Q1 2020 Earnings Presentation21 slides · Mar 4, 2020