Navistar International Corporation
Navistar International — Investor Day (February 2012)
118 slides from Navistar International's investor day presentation, Feb 1, 2012
Slide 1: Navistar Analyst Day
NYSE: NAV 1 Analyst Day February 1, 2012 Exhibit 99.1 Navistar Analyst Day February 1, 2012

Slide 2: Safe Harbor Statement
NYSE: NAV 2 Analyst Day February 1, 2012 2 Safe Harbor Statement Information provided and statements contained in this presentation that are not purely historical are forward-looking statements within the meaning of Section 27A of the Securities Act of 1933, as amended, Section 21E of the Securities

Slide 3: Other Cautionary Notes
NYSE: NAV 3 Analyst Day February 1, 2012 3 Other Cautionary Notes • The financial information herein contains audited and unaudited information and has been prepared by management in good faith and based on data currently available to the Company. • Certain Non-GAAP measures are used in this present

Slide 4: Dan Ustian, Chairman, President and CEO
NYSE: NAV 4 Analyst Day February 1, 2012 4 Dan Ustian Chairman, President and Chief Executive Officer
Slide 5: Agenda
NYSE: NAV 5 Analyst Day February 1, 2012 5 Agenda • Jack Allen, President, N.A. Truck Group • Archie Massicotte, President, Navistar Defense • Eric Tech, President, Engine Group • Troy Clarke, President, Asia Pacific and Strategic Initiatives • A.J. Cederoth, EVP & CFO • Q&A • Product and Technology
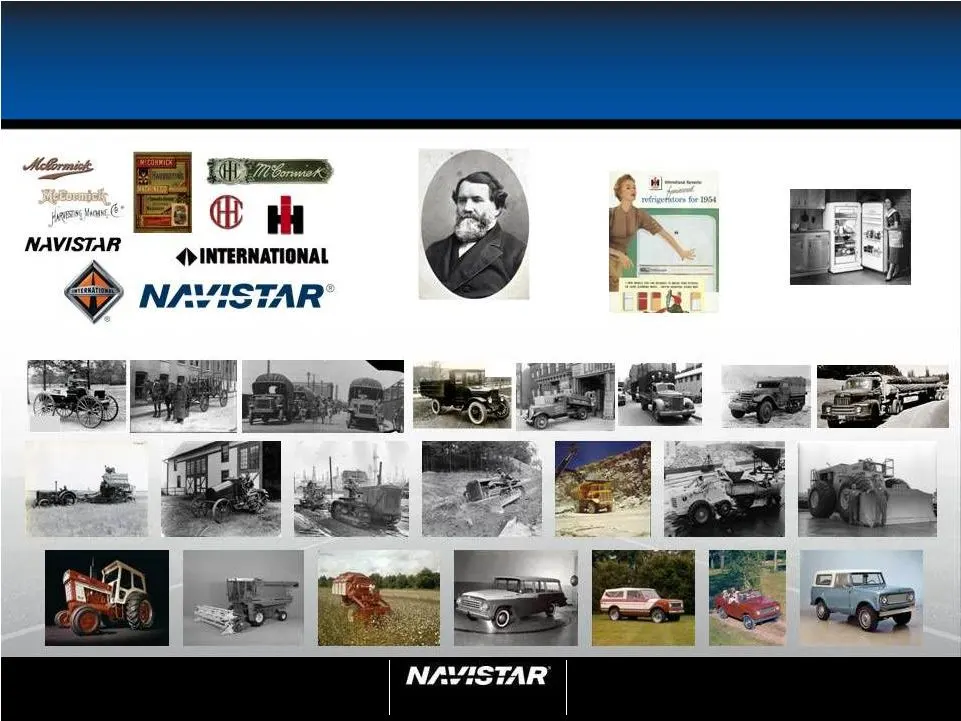
Slide 6: Building and Shaping Navistar's History
NYSE: NAV 6 Analyst Day February 1, 2012 6 Building and Shaping Navistar’s History 1909 1912 1918 1924 1936 1942 1943 1950s Cyrus H. McCormick
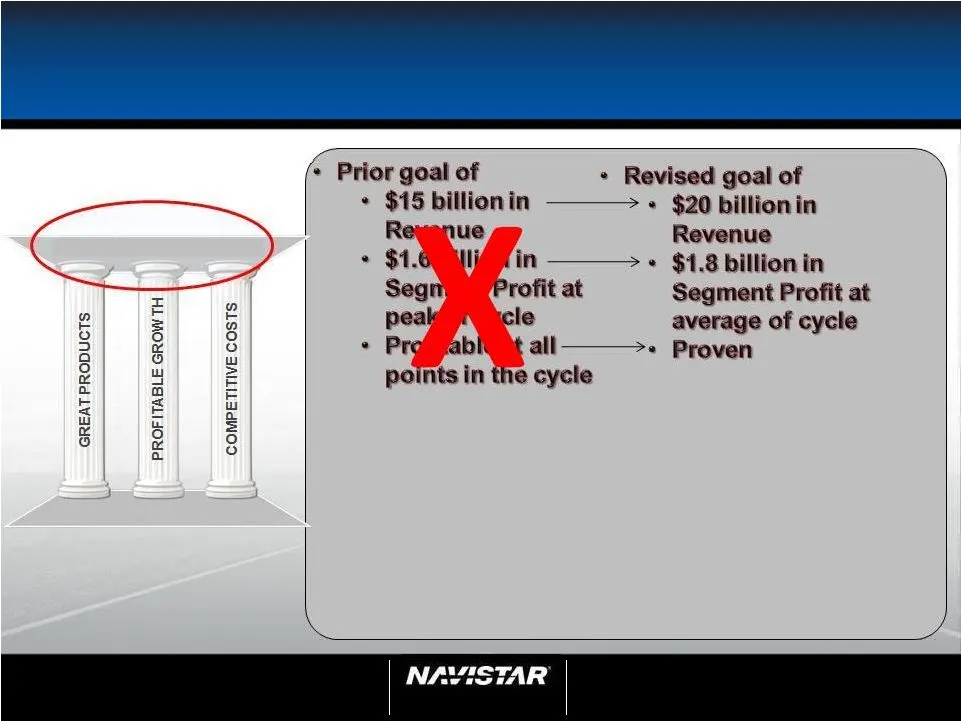
Slide 7: Strategy: Leveraging What We Have and What Others Have Built
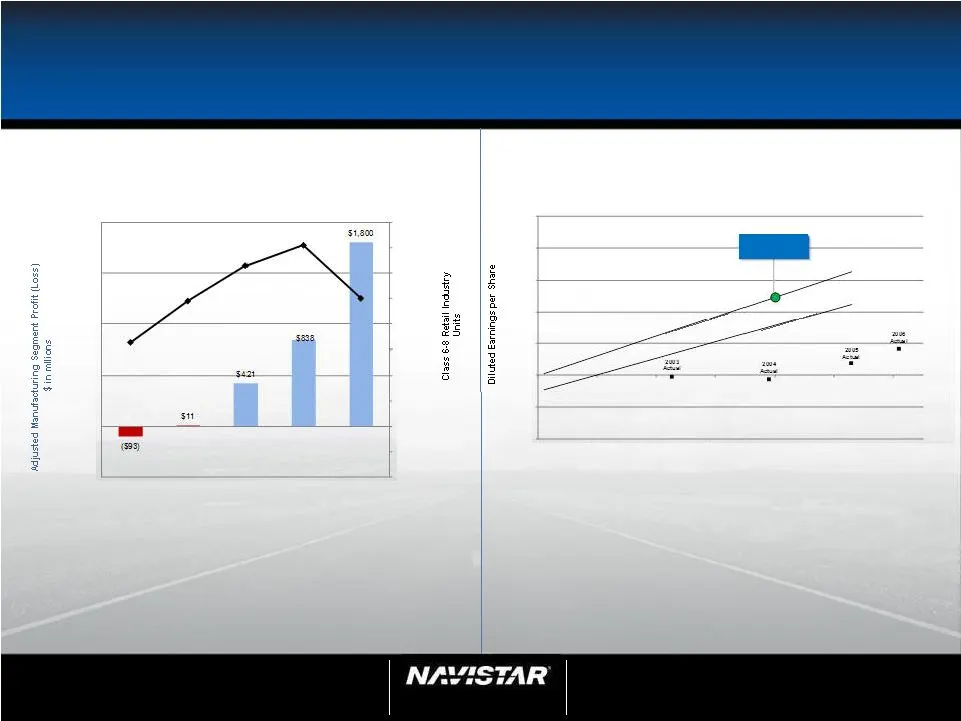
NYSE: NAV 7 Analyst Day February 1, 2012 7 Strategy: Leveraging What We Have and What Others Have Built Note: This slide contains non-GAAP information; please see the Reg G in appendix for a detailed reconciliation. • Focus is on reducing impact of cyclicality – Non-traditional/expansion markets – G
Slide 8: Strategy: Leveraging What We Have and What Others Have Built
NYSE: NAV 8 Analyst Day February 1, 2012 8 Strategy: Leveraging What We Have and What Others Have Built Note: This slide contains non-GAAP information; please see the Reg G in appendix for a detailed reconciliation. Goal at Mature strategy & 350k $(10.00) $(5.00) - $5.00 $10.00 $15.00 $20.00 $25.00
Slide 9: Leveraging by Integration and Differentiation
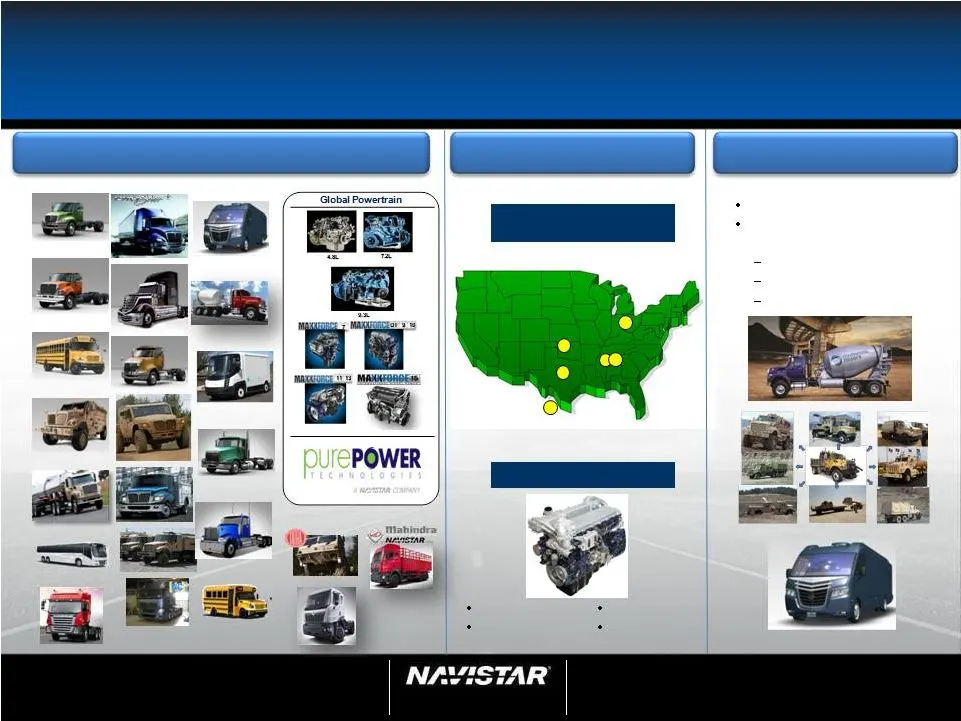
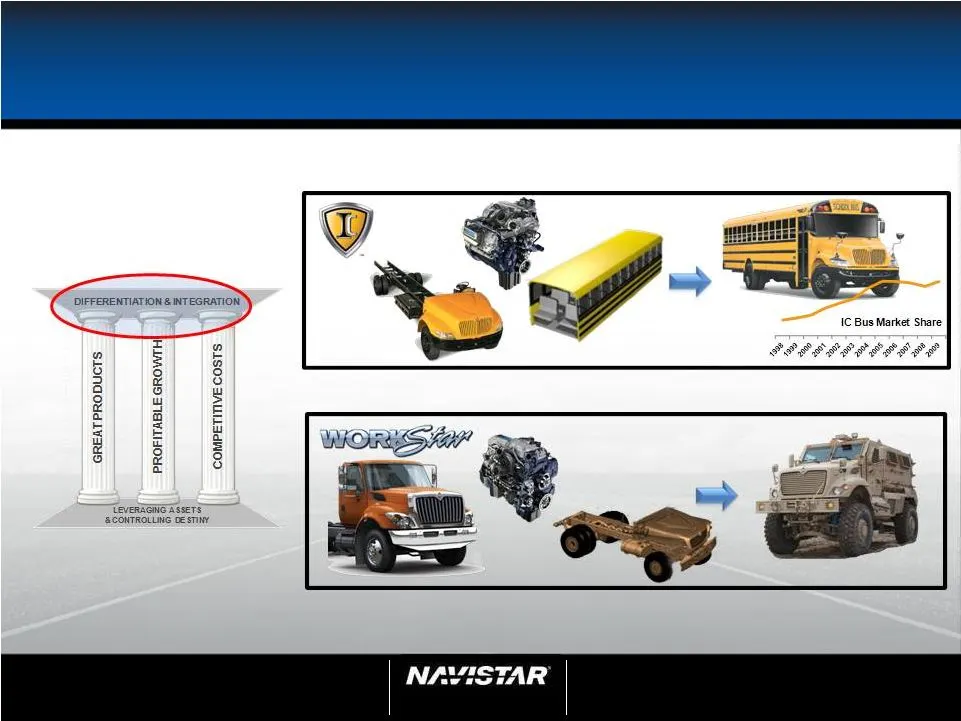
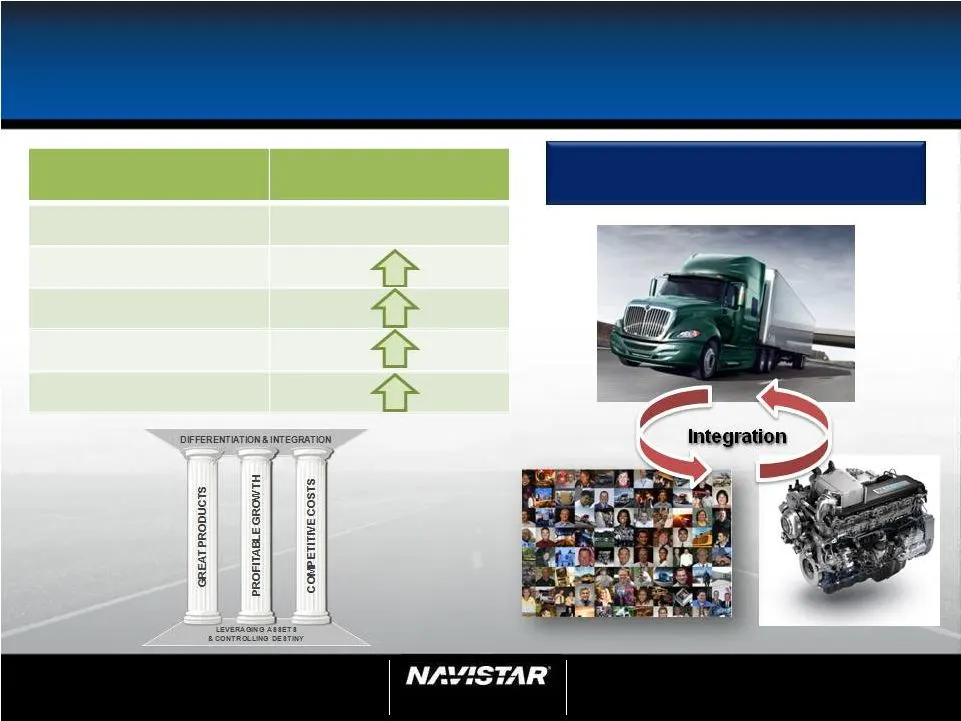
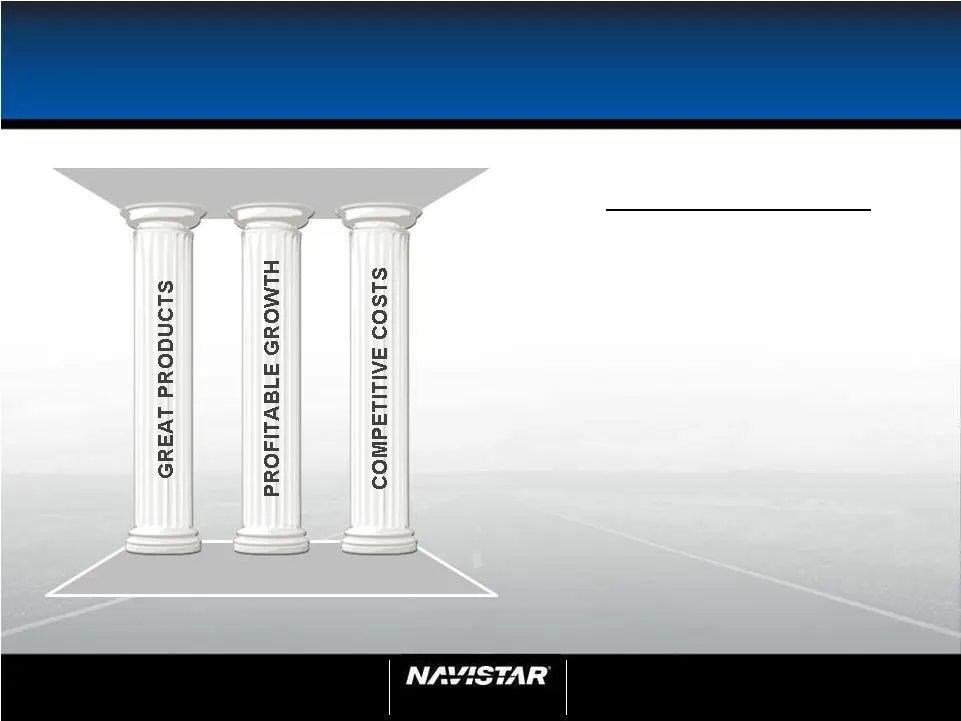
NYSE: NAV 9 Analyst Day February 1, 2012 9 Leveraging by Integration and Differentiation Great Products Great Products Transition from Focused to Flexible Manufacturing In-cylinder EGR Profitable Growth Competitive Cost Structure AAP TBP GAP EAP SAP HEP Air System Fuel System Controls Blocks Dealer
Slide 10: Results While Building The Foundation For Our Future Through Integration
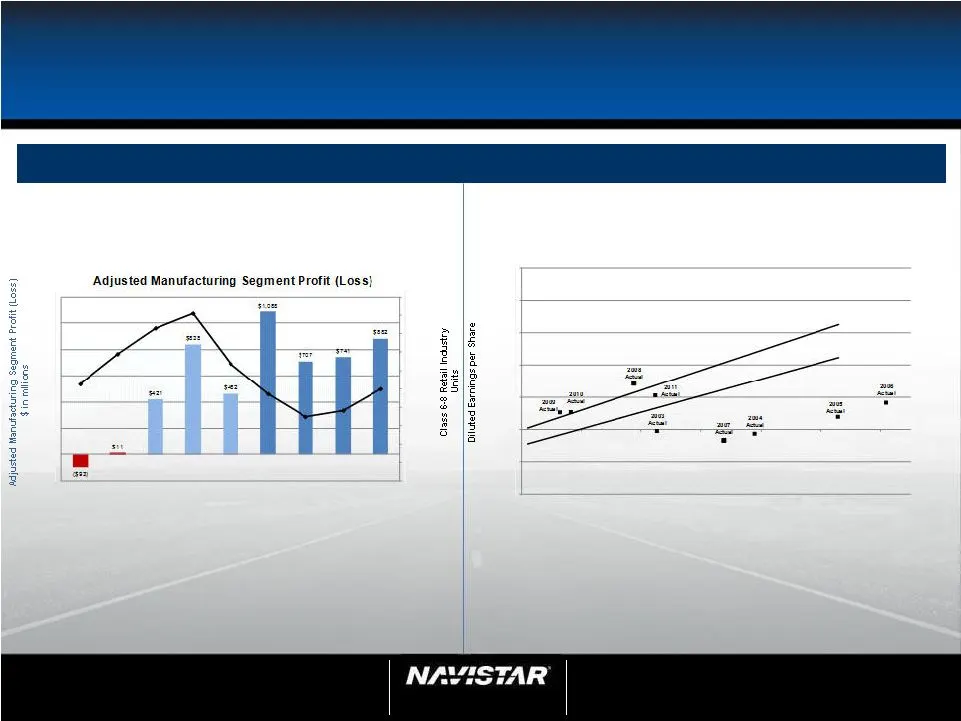
NYSE: NAV 10 Analyst Day February 1, 2012 10 Results While Building The Foundation For Our Future Through Integration
Slide 11: Profitable at all points in the cycle
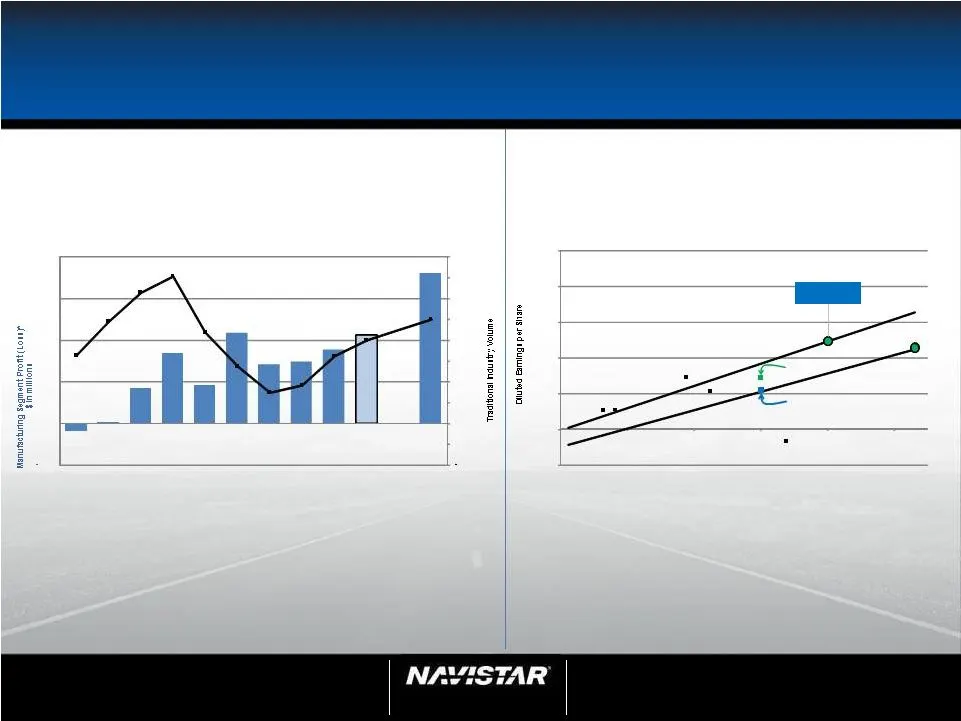
NYSE: NAV 11 Analyst Day February 1, 2012 11 Profitable at all points in the cycle Results While Building Note: This slide contains non-GAAP information; please see the Reg G in appendix for a detailed reconciliation. 2007, 2008, 2009 and 2011 excluded certain charges. ($200) $0 $200 $600 $1,200 $1,
Slide 12: Leader in Integrated Products, Technology and Innovation
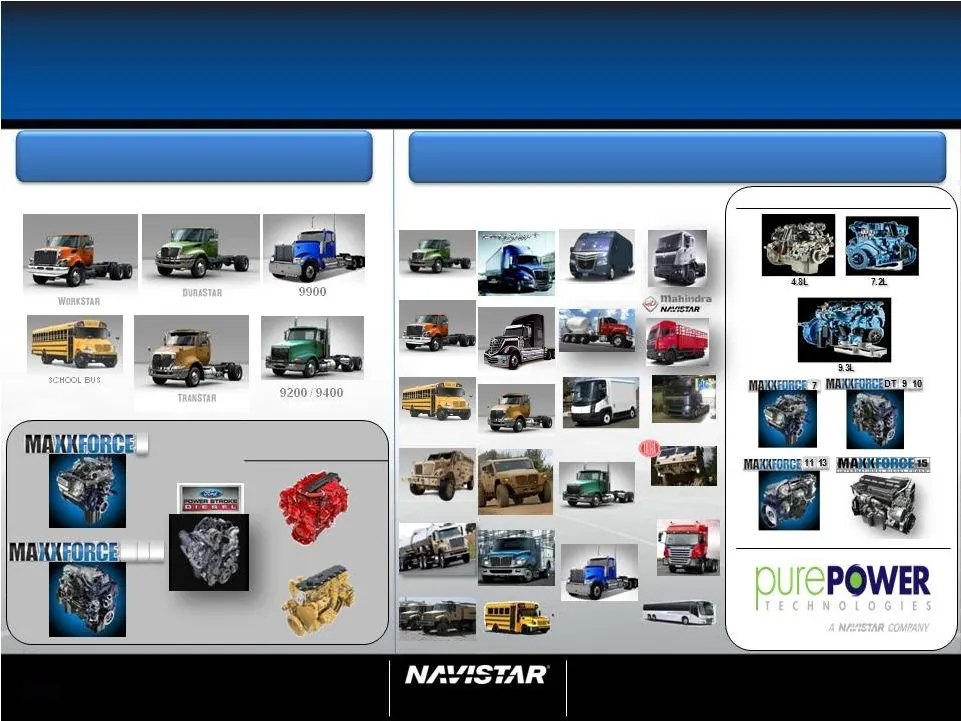
Leader in Integrated Products, Technology and Innovation 12 Analyst Day February 1, 2012 NYSE: NAV 2012 Product Offerings – Well Positioned For the Future 2007 Product Offerings Purchased Engines Global Powertrain DT
Slide 13: Positioned Well for the Future FY 2012
NYSE: NAV 13 Analyst Day February 1, 2012 13 Positioned Well for the Future FY 2012 Building the foundation for our future through integration Military ~$1.5B N. A. Truck Engines Parts Global
Slide 14: Continued Success in 2012 While Building Our Future
NYSE: NAV 14 Analyst Day February 1, 2012 14 Continued Success in 2012 While Building Our Future Note: This slide contains non-GAAP information; please see the Reg G disclosure in the appendix for a detailed reconciliation. 2007, 2008, 2009 and 2011 excluded certain charges. 2012 FY Guidance and Pro
Slide 15: Status of Integration/Differentiation Actions
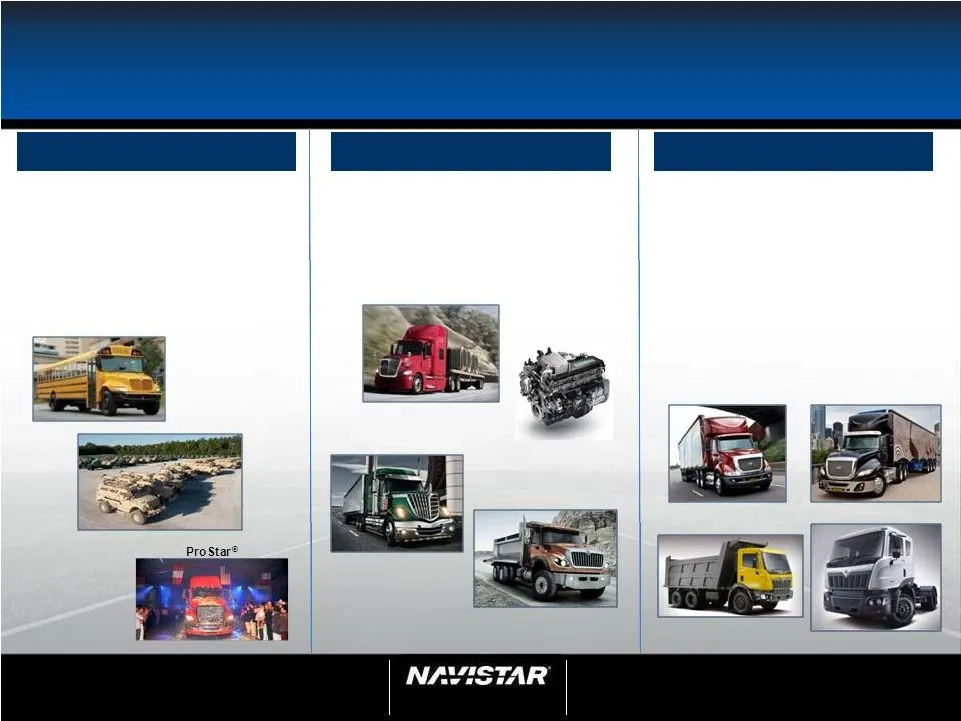
NYSE: NAV 15 Analyst Day February 1, 2012 15 Status of Integration/Differentiation Actions Complete Breakthroughs 2012 Future • Bus • Military • Latin America • Parts • North America Truck • Engine • Global Truck • Global Bus 40T/49T 25T Tipper CT610 CT630 ProStar ® with MaxxForce ® Sloped Nose Work

Slide 16: Jack Allen, President, North America Truck Group
NYSE: NAV 16 Analyst Day February 1, 2012 16 Jack Allen President, North America Truck Group
Slide 17: North America Truck Industry
NYSE: NAV 17 Analyst Day February 1, 2012 17 North America Truck Industry Navistar Strategy Anticipates and Capitalizes on Market Dynamics through Integration • Economy – Choppy recovery – Consumer confidence lacking – Unemployment remains high – Freight levels/rates/profitability • Industry Shifts
Slide 18: North American Truck Strategy
NYSE: NAV 18 Analyst Day February 1, 2012 18 North American Truck Strategy • Great Products Differentiated through Integration • Costs Scale/Labor/Manufacturing • Growth Market Share, New Markets, New Business 10% Return on Sales LEVERAGING ASSETS & CONTROLLING DESTINY DIFFERENTIATION & INTEGRATION
Slide 19: Integrated Strategic Picture
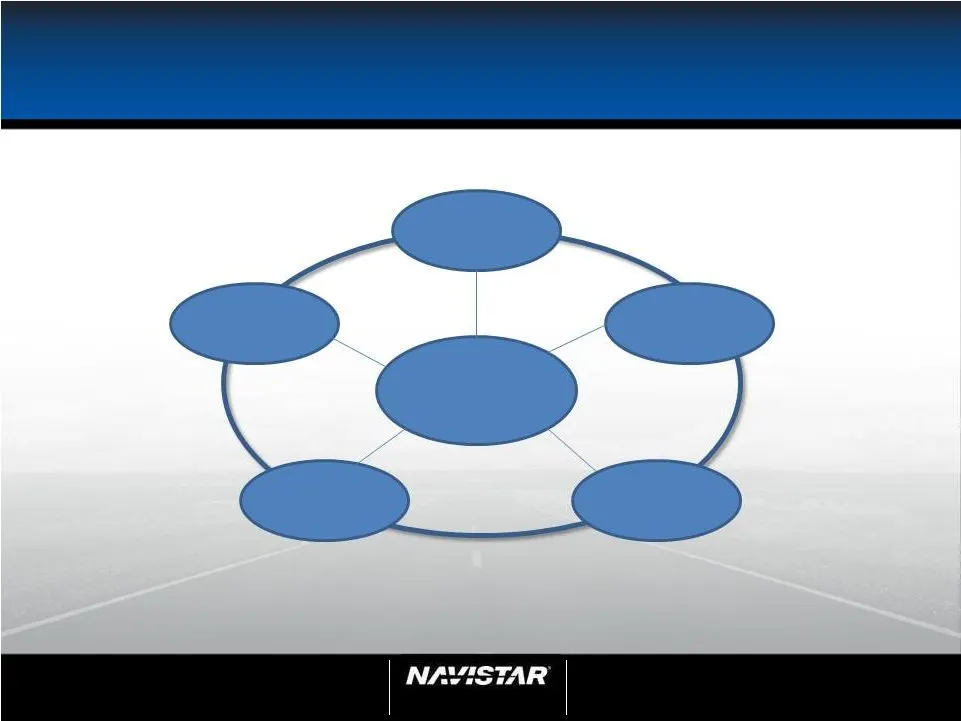
NYSE: NAV 19 Analyst Day February 1, 2012 19 Integrated Strategic Picture Product Customer New Products New Markets Distribution Customer Support Integrated Trucks
Slide 20: Strong Actions During Recession Lead to Success in Core Market Recovery
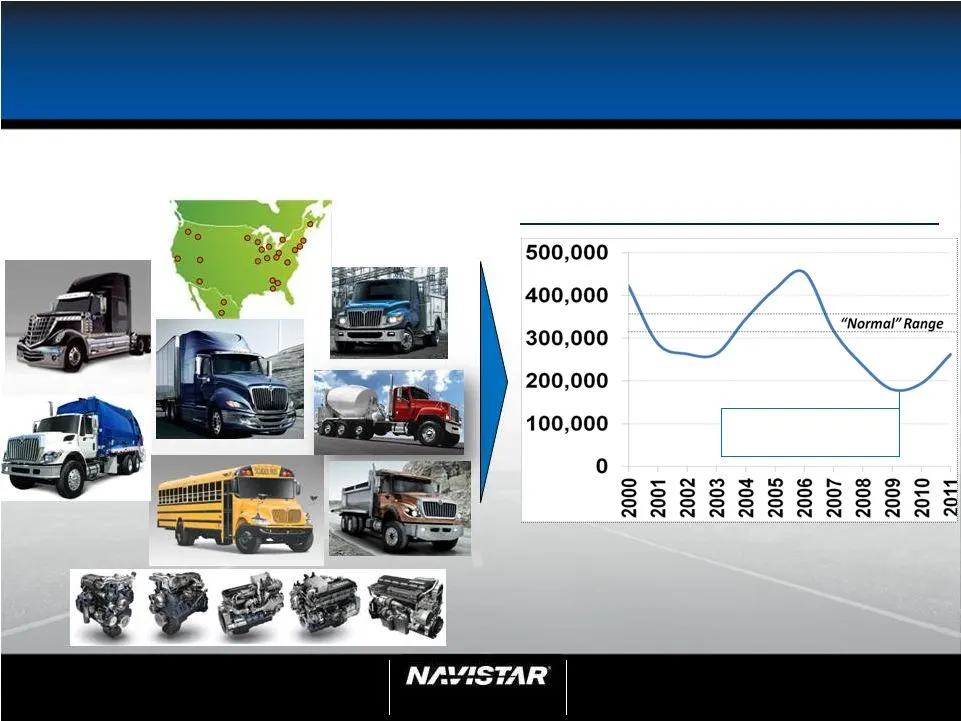
NYSE: NAV 20 Analyst Day February 1, 2012 20 Strong Actions During Recession Lead to Success in Core North America Market Recovery U.S. and Canada Traditional Industry Products, Distribution, Growth Solid Recovery from 2009 Trough Industry up 45% from 2009 trough Industry up 45% from 2009 trough
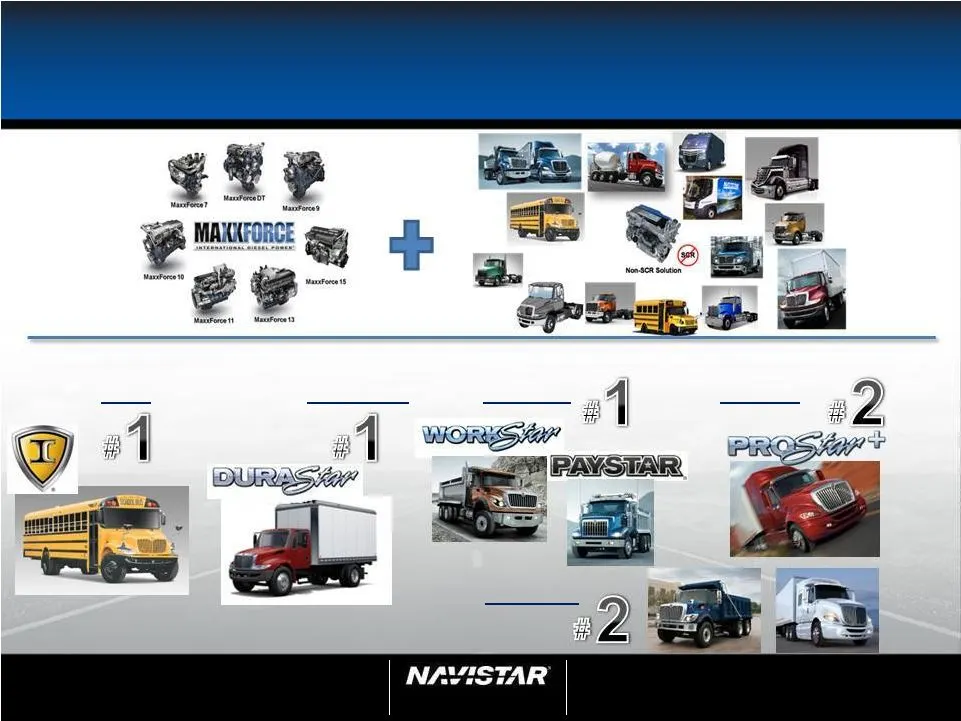
Slide 21: Broadest Integrated Application Based Product Line
NYSE: NAV 21 Analyst Day February 1, 2012 21 Broadest Integrated Application Based Product Line Note: Market share based on brand Heavy Medium Class Bus Severe Market Leadership:
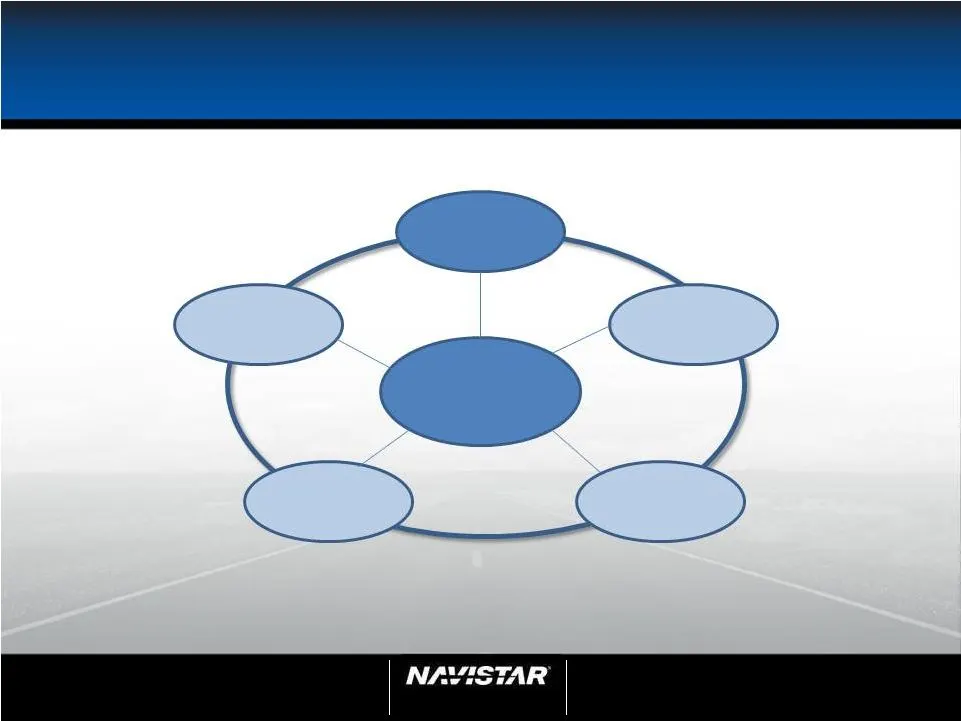
Slide 22: Integrated Strategic Picture
NYSE: NAV 22 Analyst Day February 1, 2012 22 Integrated Strategic Picture New Products New Markets Distribution Product Integrated Trucks Customer Support Customer
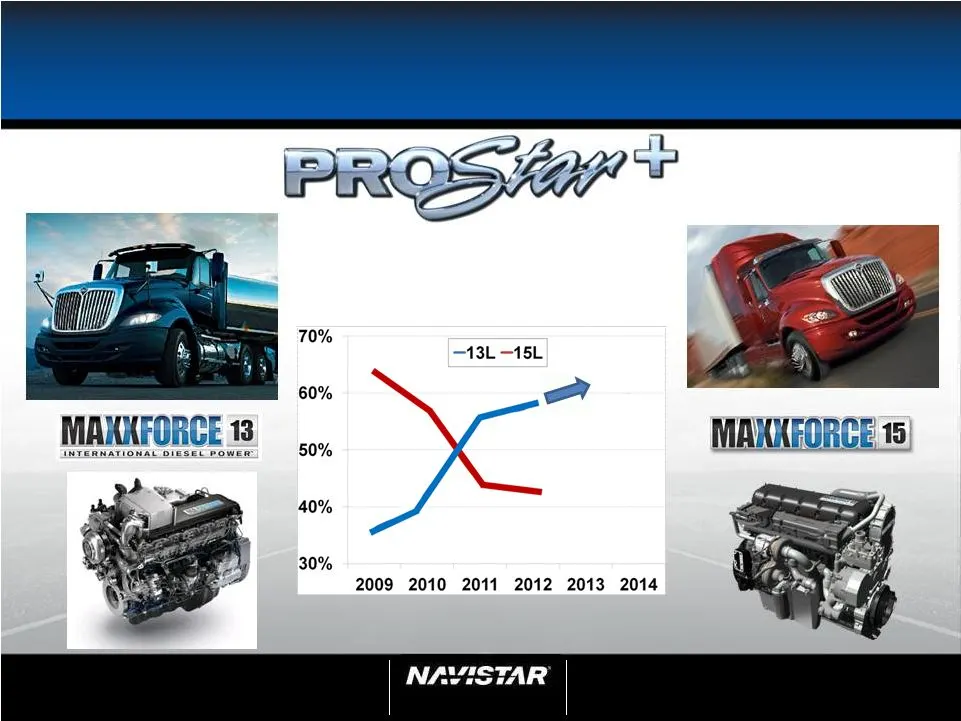
Slide 23: Core Product Strategy
NYSE: NAV 23 Analyst Day February 1, 2012 23 Core Product Strategy Industry 15L to 13L Conversion
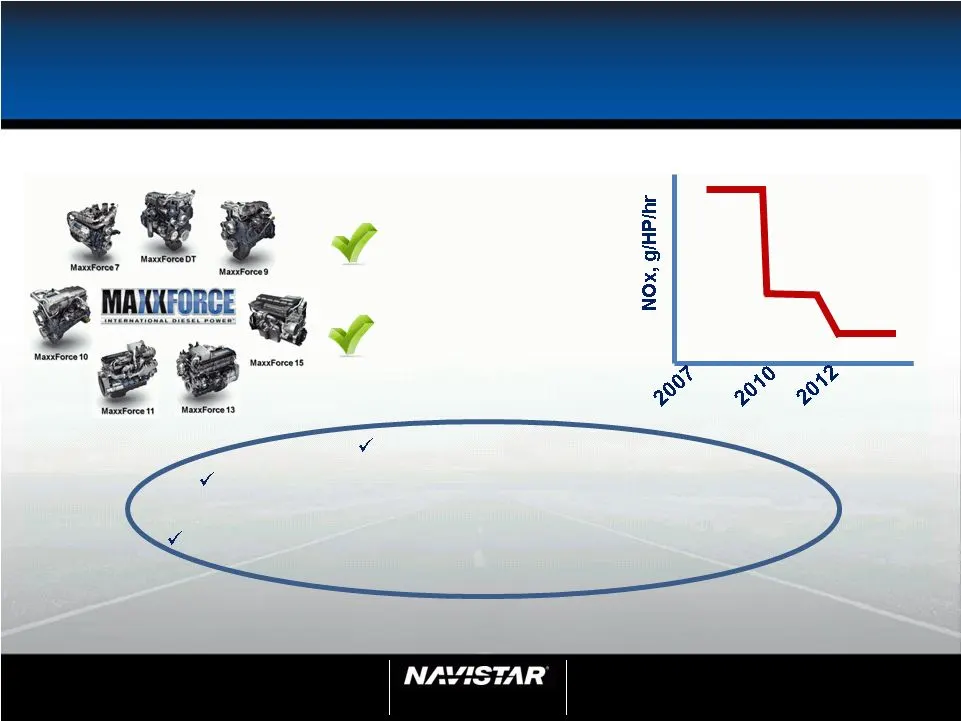
Slide 24: Products – New and Differentiated
NYSE: NAV 24 Analyst Day February 1, 2012 Products – New and Differentiated MaxxForce ® Engines Family NOx Emissions Working with the EPA Submitted a 0.2g NOx in-cylinder Big Bore engine for production certification Continue building with credits and other EPA alternatives if required In-cylinder Em
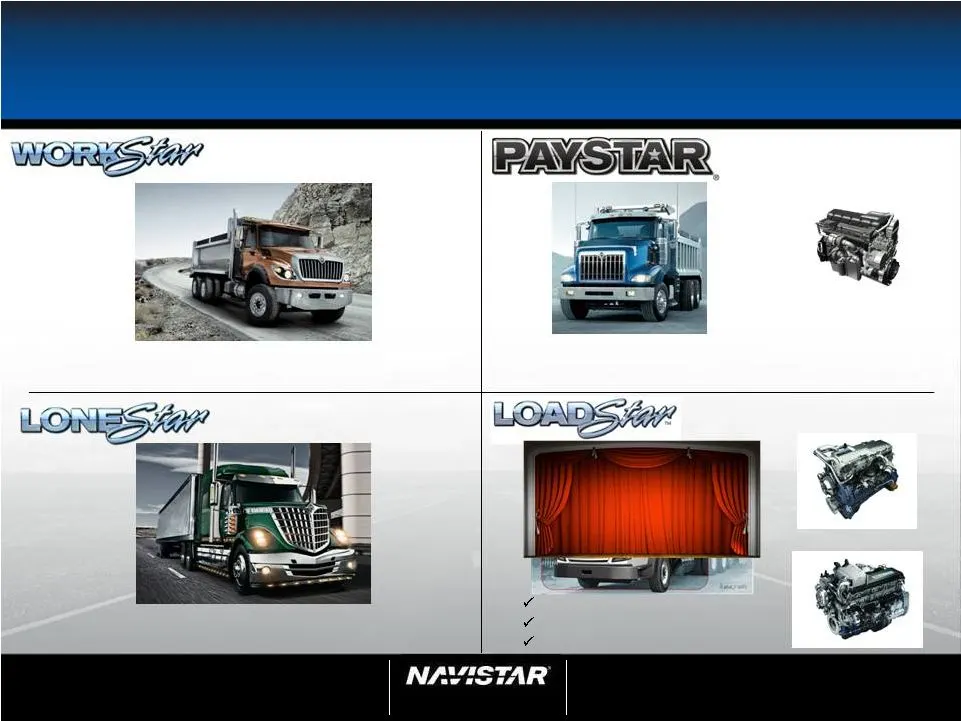
Slide 25: Core Product Strategy – Integrated and Enhanced
NYSE: NAV 25 Analyst Day February 1, 2012 25 Core Product Strategy – Integrated and Enhanced LoneStar ® with 500HP MaxxForce ® Sloped Nose WorkStar ® with upgraded interior MaxxForce ® PayStar ® with MaxxForce ® up to 550HP New Low Cab Forward product Advanced EGR technology Natural Gas offering Max
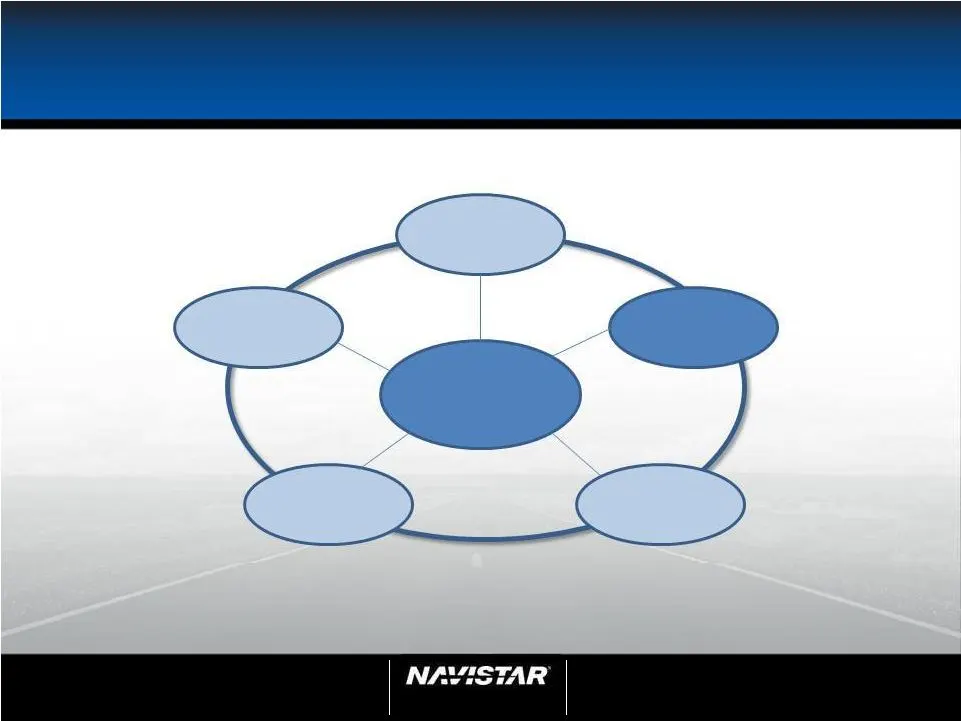
Slide 26: Integrated Strategic Picture
NYSE: NAV 26 Analyst Day February 1, 2012 26 Integrated Strategic Picture New Products New Markets Distribution Product Integrated Trucks Customer Support Customer
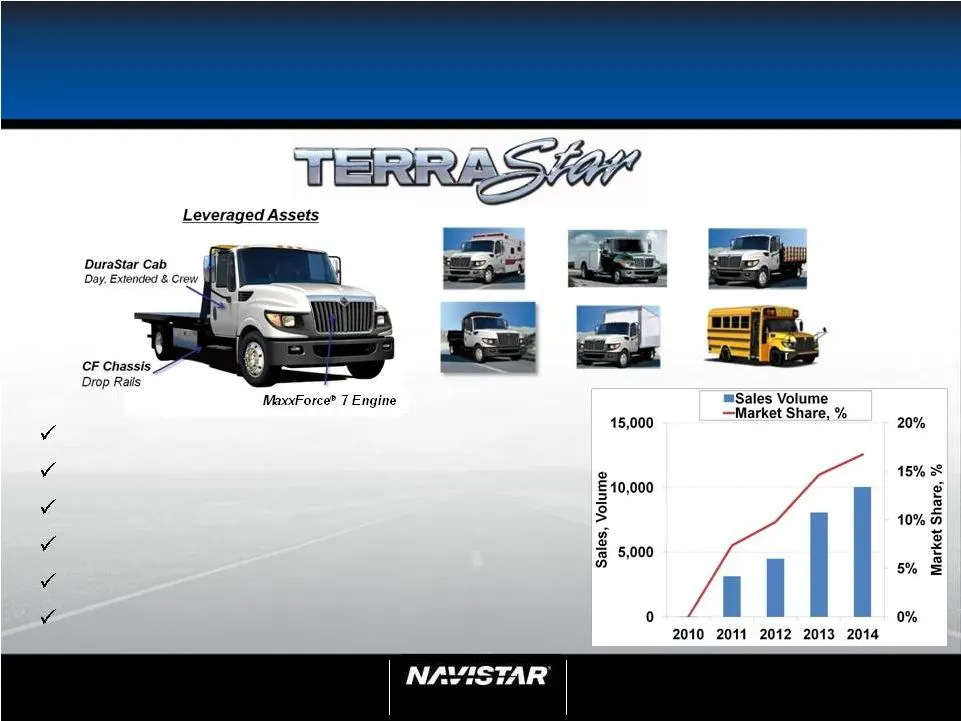
Slide 27: Products – New and Differentiated
NYSE: NAV 27 Analyst Day February 1, 2012 27 Products – New and Differentiated 60,000 Unit Class 4/5 Market – 20% Share Goal Commercial Alternative to Pick-up Truck EGR Based MaxxForce ® 7 Engine 3,000 in 2011; 12,000 Mature 4x4 in 2012 Body Installation at Navistar Plant
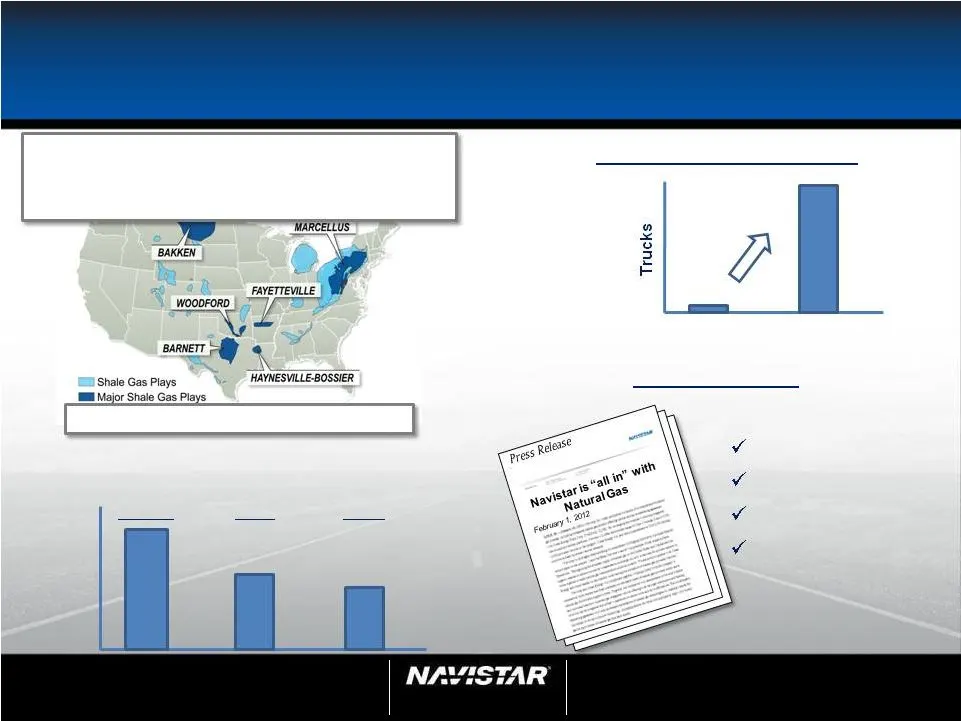
Slide 28: Natural Gas is a Growth Opportunity
NYSE: NAV 28 Analyst Day February 1, 2012 28 Natural Gas is a Growth Opportunity Natural Gas Demand Integrated product Strong partners Full product line Best distribution network and customer support Why Navistar? Diesel and Natural Gas (DGE) Pricing Natural Gas is 50% less than Diesel New Innovatio
Slide 29: Integrated Strategic Picture
NYSE: NAV 29 Analyst Day February 1, 2012 29 Integrated Strategic Picture New Products New Markets Distribution Product Integrated Trucks Customer Support Customer
Slide 30: North America Distribution
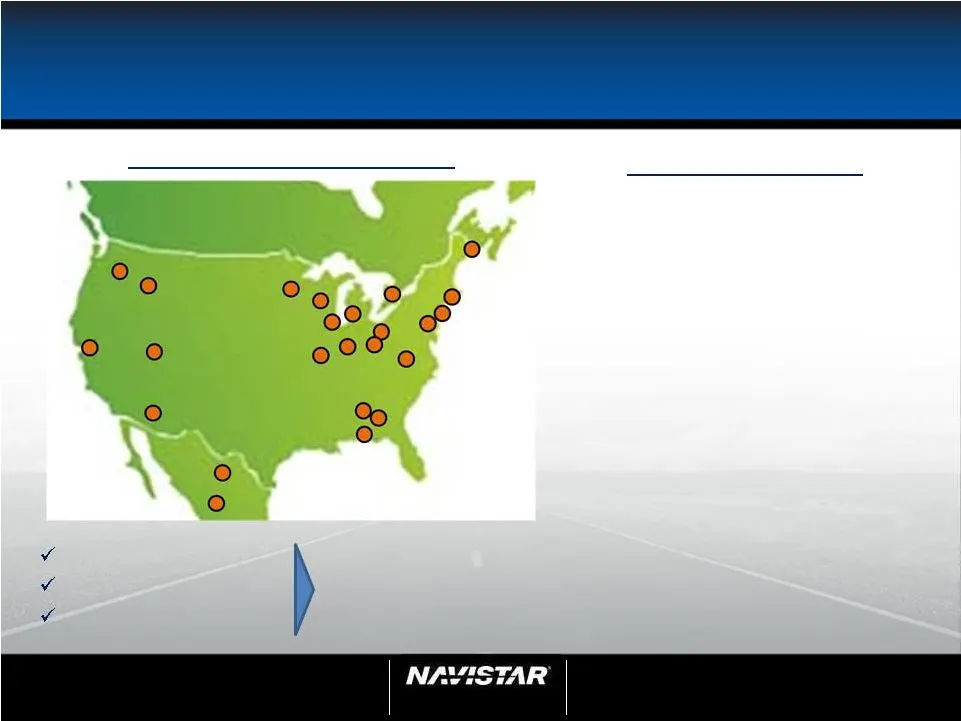
NYSE: NAV 30 Analyst Day February 1, 2012 30 North America Distribution New International Dealers Distribution Network • Investments to strengthen the best dealer network in the industry • New and existing dealers in key major market areas • Solid experience from proven leaders in truck and related
Slide 31: Integrated Strategic Picture
NYSE: NAV 31 Analyst Day February 1, 2012 31 Integrated Strategic Picture New Products New Markets Distribution Product Integrated Trucks Customer Support Customer
Slide 32: Integrated Parts, Service and Customer Support
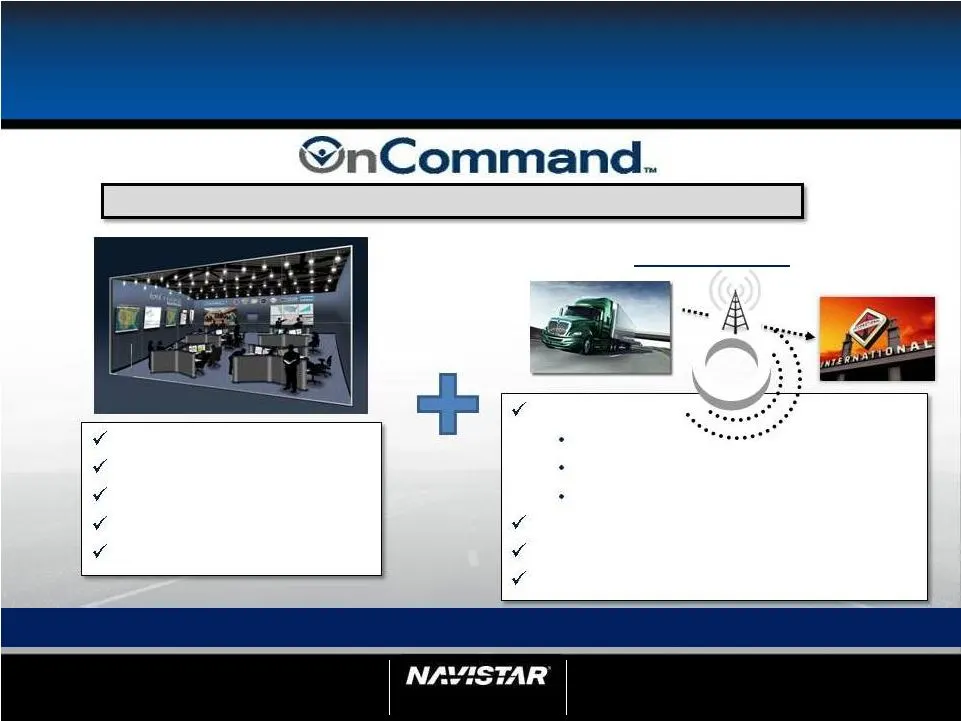
NYSE: NAV 32 Analyst Day February 1, 2012 32 Integrated Parts, Service and Customer Support Built around the Customer Significantly Improving Vehicle Uptime Repair advocates Diagnostic/Repair Parts identification Parts sourcing Warranty On the move: Alerts Assessment/Diagnostic Repair facility ident
Slide 33: Parts Business
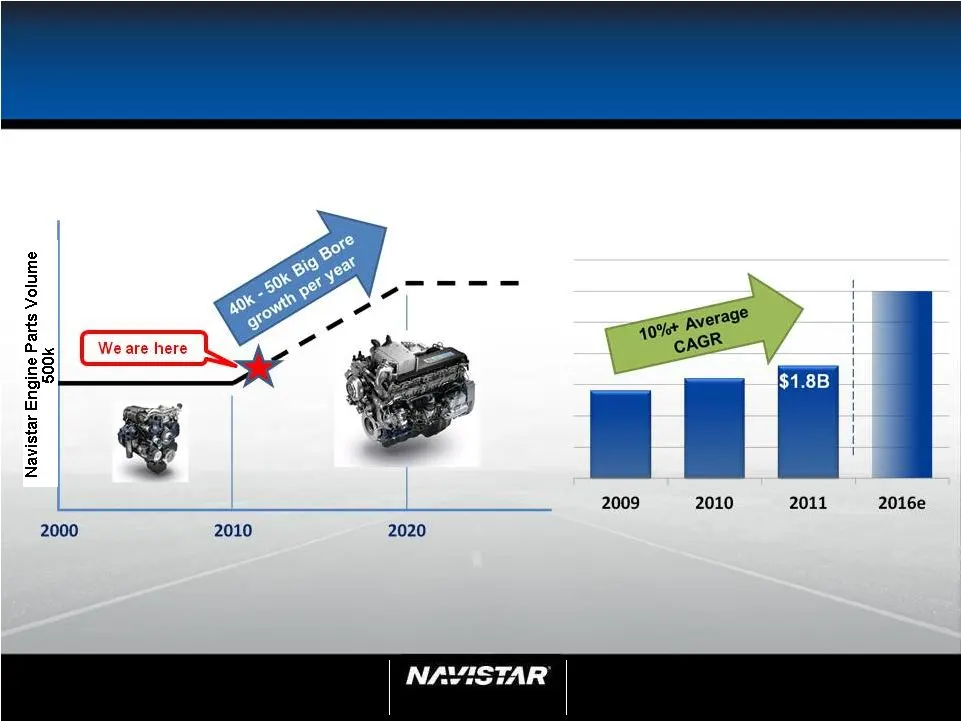
NYSE: NAV 33 Analyst Day February 1, 2012 33 Parts Business Parts Business Positioned for Steady Consistent Growth Proprietary Engine Population Growth North American Commercial Parts Sales Mid Range Established Big Bore Growth Engine business drives ancillary part sales
Slide 34: Integrated Strategic Picture
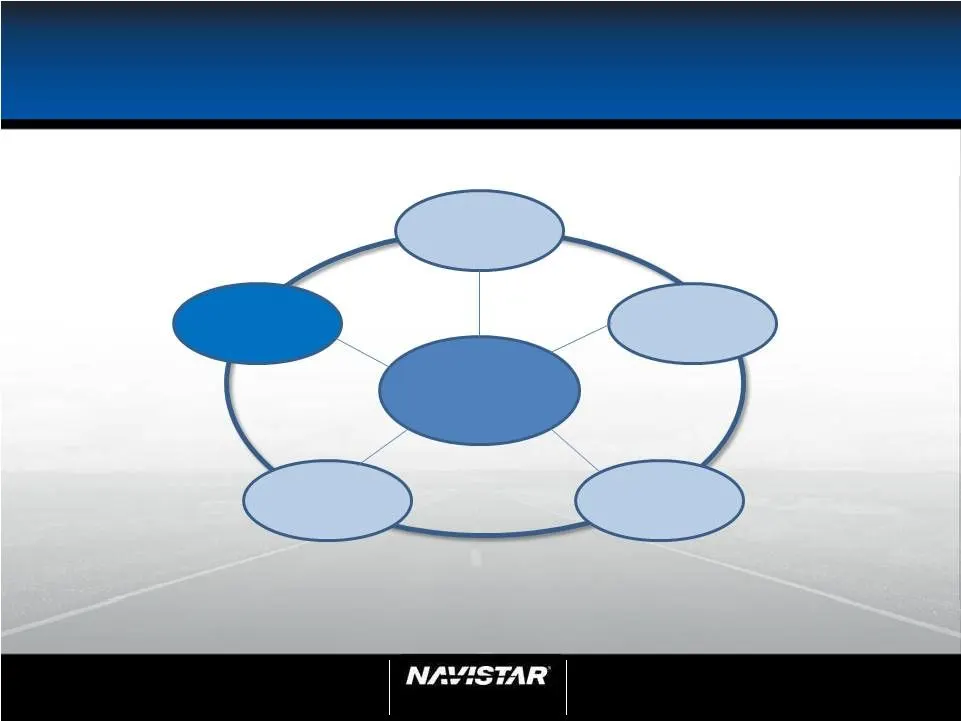
NYSE: NAV 34 Analyst Day February 1, 2012 34 Integrated Strategic Picture New Products New Markets Distribution Product Integrated Trucks Customer Support Customer
Slide 35: Growth: Integrated Trucks
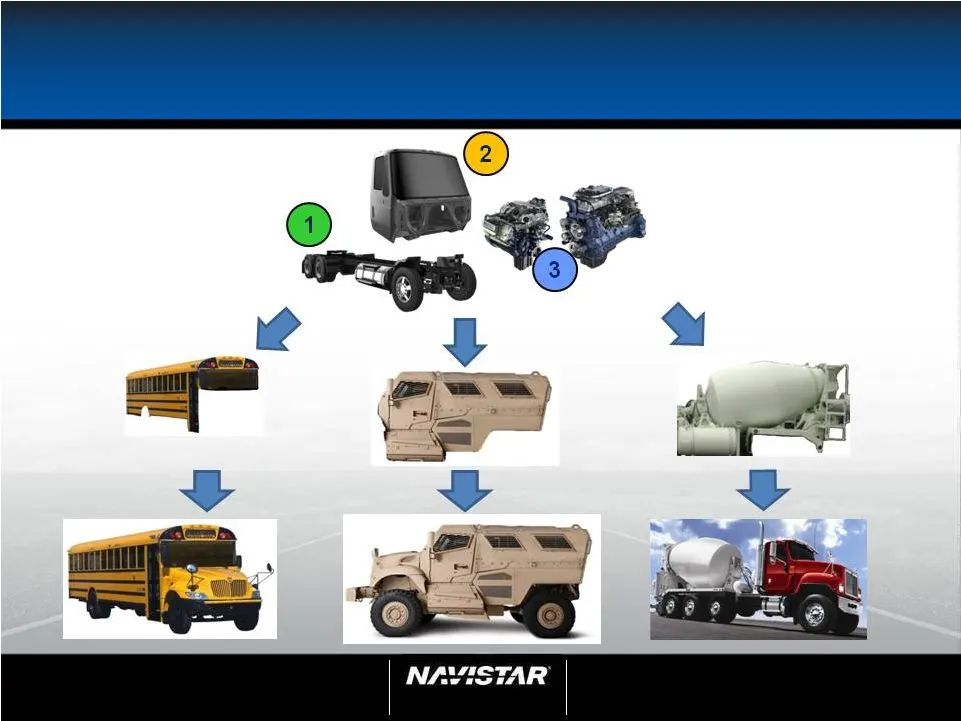
NYSE: NAV 35 Analyst Day February 1, 2012 35 Growth: Integrated Trucks
Slide 36: Integrated Truck Strategy
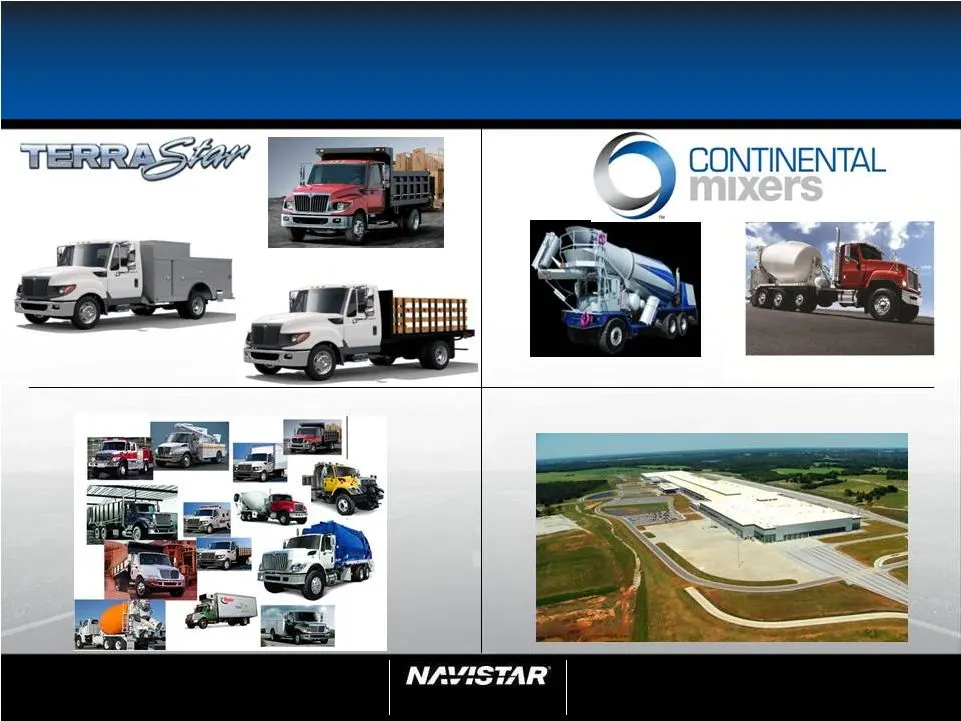
NYSE: NAV 36 Analyst Day February 1, 2012 36 Integrated Truck Strategy Rear Discharge Front Discharge Body Integration Alabama Assembly Plant
Slide 37: Competitive Cost Structure
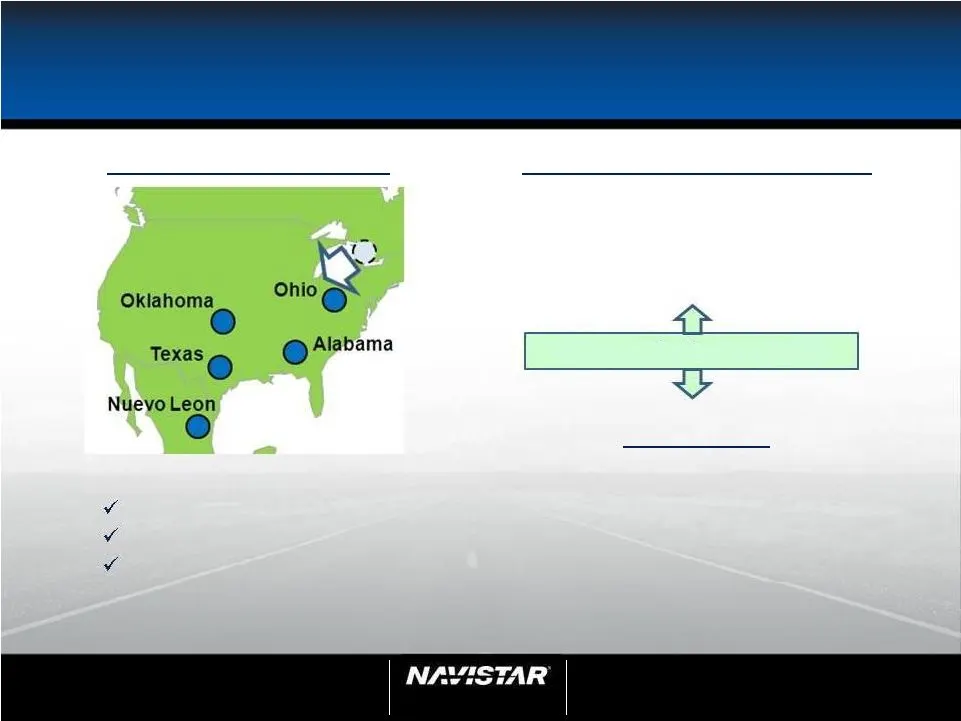
NYSE: NAV 37 Analyst Day February 1, 2012 37 Competitive Cost Structure JAC JV pending government approval • Lisle and Melrose integration • Fully flexible – 1 – 2 – 3 platforms • Common manufacturing processes • Global Sourcing • Commodity Strategy Manufacturing Flexibility Product Development Stra
Slide 38: Results and a Look Forward
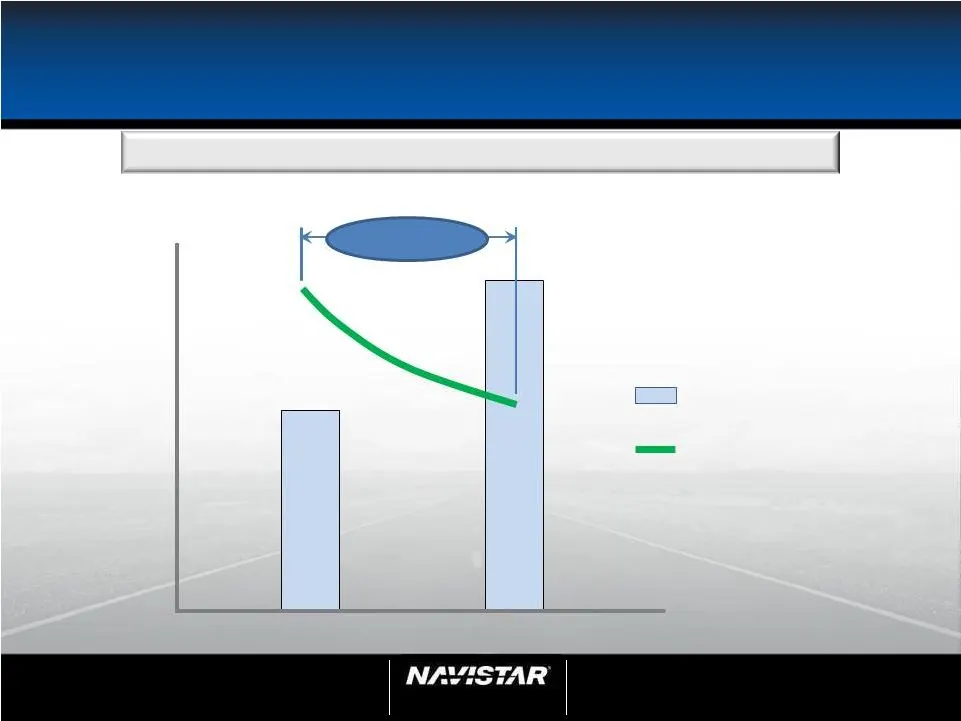
NYSE: NAV 38 Analyst Day February 1, 2012 38 Results and a Look Forward 40+% North America Truck Breakeven Volume Improvement 2009 2012 Unit Volume Breakeven Volume
Slide 39: Results
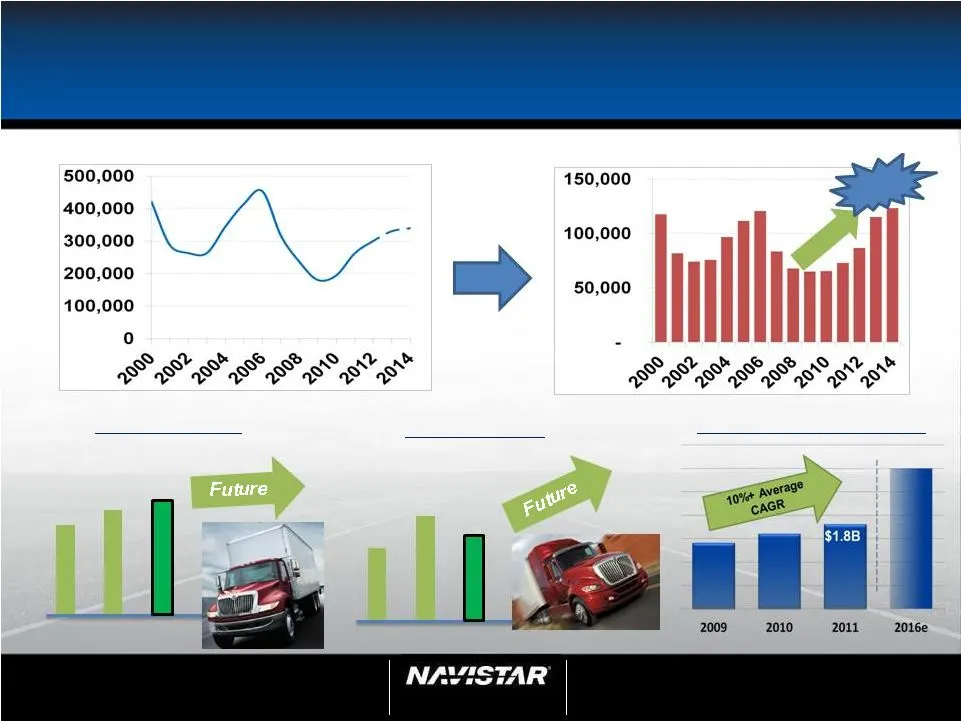
NYSE: NAV 39 Analyst Day February 1, 2012 39 Results $10+B Medium Share 36% - 38% 40% Past 2011 Class 8 Share 19% - 25% 21% Past 2011 Class 6 – 8 Industry Aftermarket Part Sales Navistar Class 6 – 8 Sales
Slide 40: Positioned for Profit and Growth
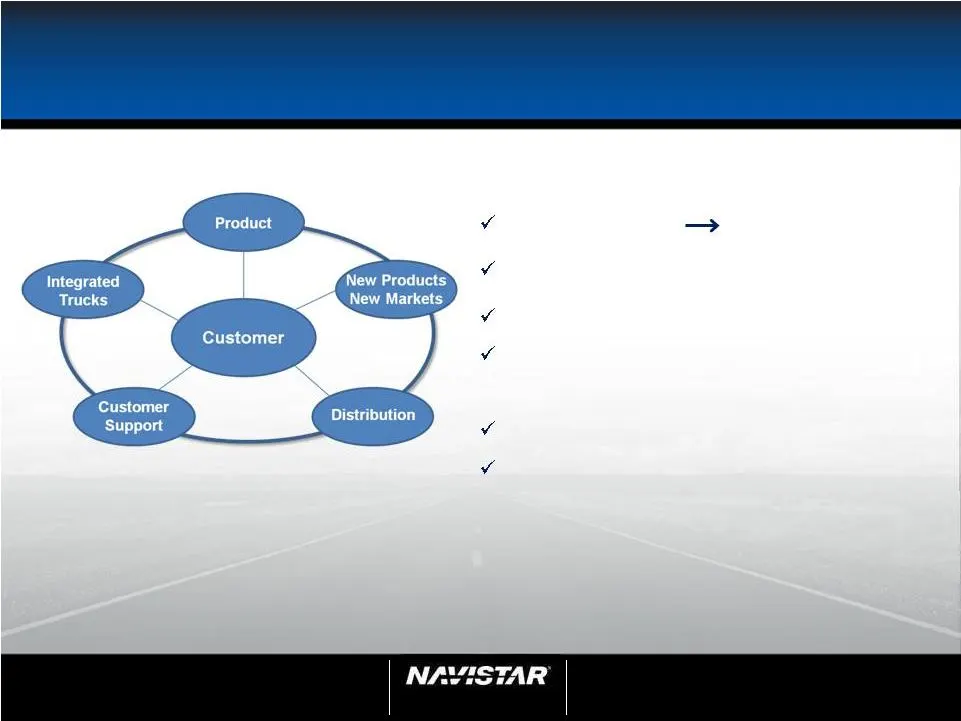
NYSE: NAV 40 Analyst Day February 1, 2012 40 Positioned for Profit and Growth Note: Market share based on brand “Best Integrated Vehicle Solutions for Our Customers” Industry recovery Increasing volumes Market Leader #1/#2 in all segments Investing in distribution Continuing to invest in new product

Slide 41: Archie Massicotte, President, Navistar Defense
NYSE: NAV 41 Analyst Day February 1, 2012 41 Archie Massicotte President, Navistar Defense
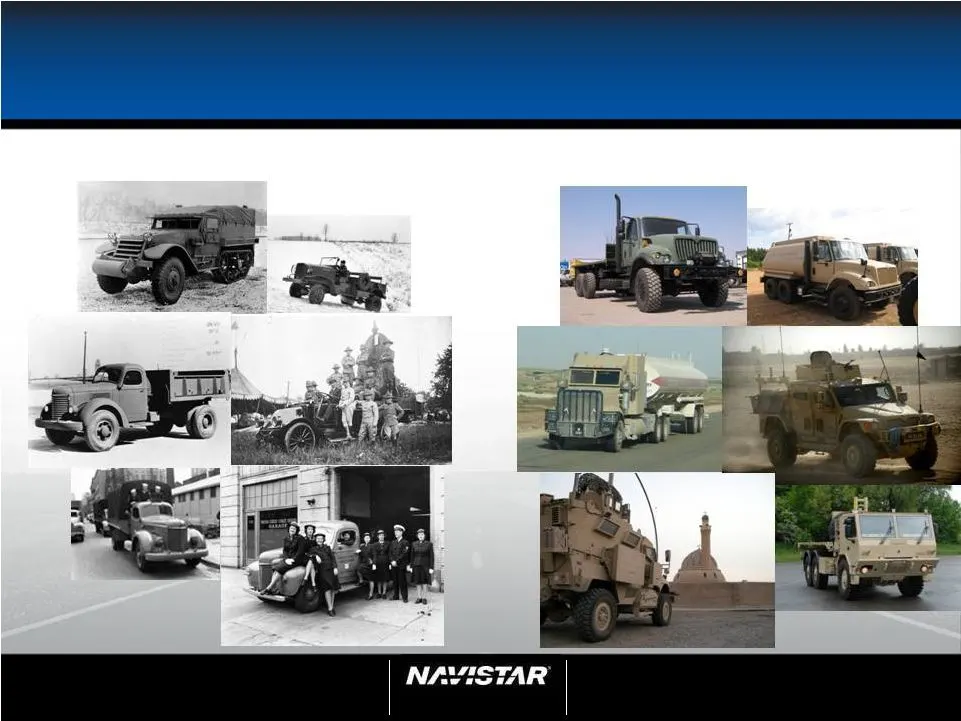
Slide 42: Serving Our Military
NYSE: NAV 42 Analyst Day February 1, 2012 42 Serving Our Military Then Now
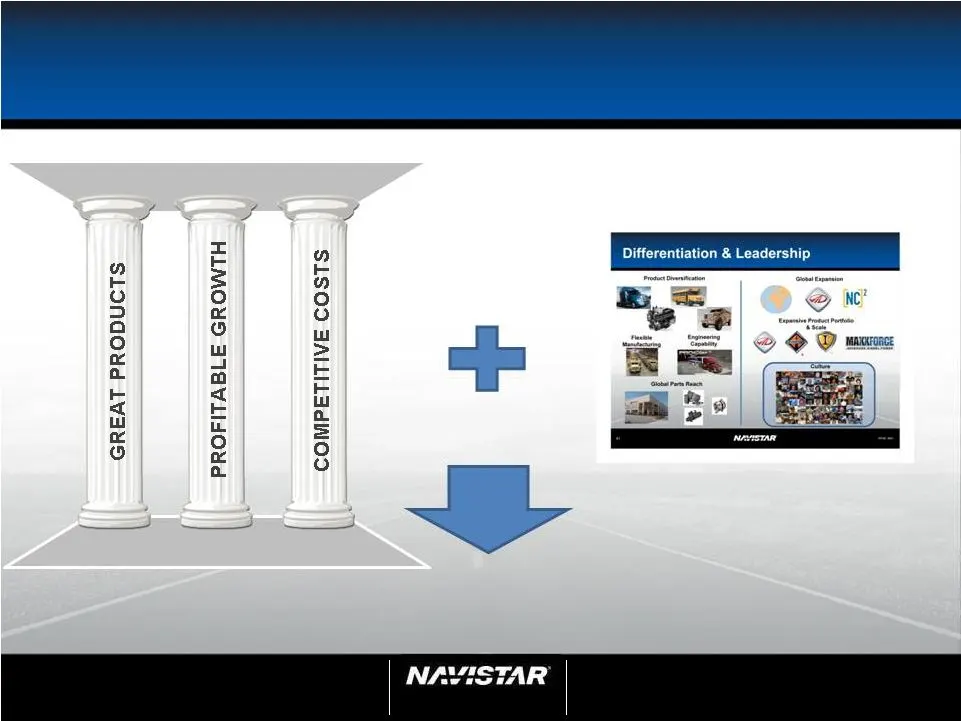
Slide 43: Profitable Growth Through Integration
NYSE: NAV 43 Analyst Day February 1, 2012 43 Profitable Growth Through Integration Leverage & Integrate Our Assets Navistar Defense • Body integrator • Full service logistics • Parts LEVERAGING ASSETS & CONTROLLING DESTINY DIFFERENTIATION & INTEGRATION
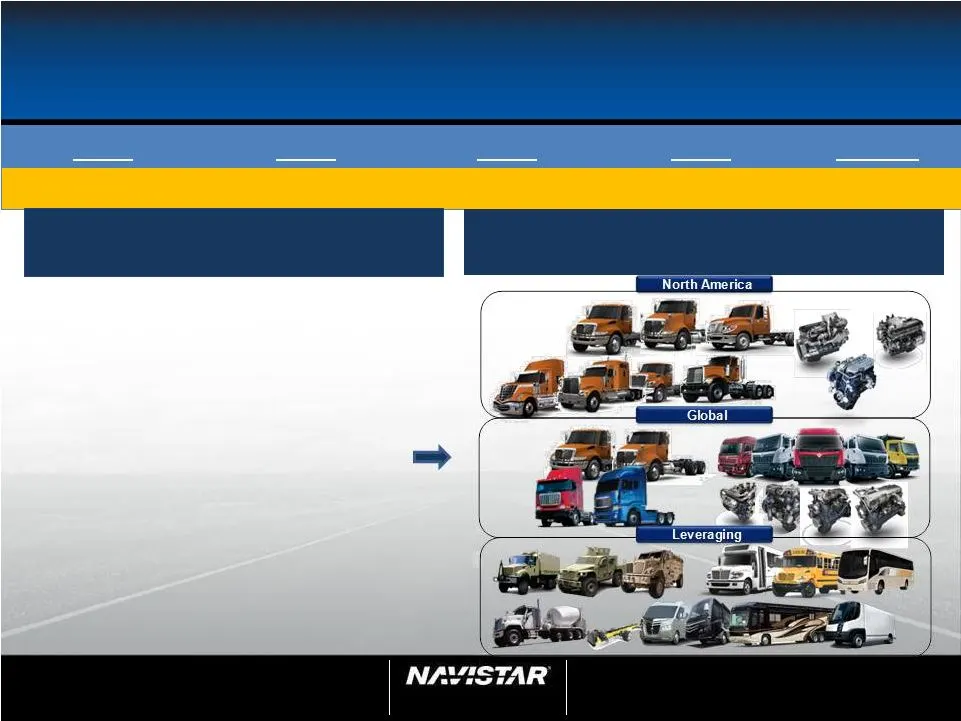
Slide 44: Navistar Defense – Era of Efficiency
NYSE: NAV 44 Analyst Day February 1, 2012 44 Navistar Defense – Era of Efficiency 2008 2009 2010 2011 2012 + Positioned well for dealing with budget constraints Commercial platforms and services for any program > $2B > $2B > $2B ~$2B $1.5+ Defense departments desire • High operational readiness • Ra
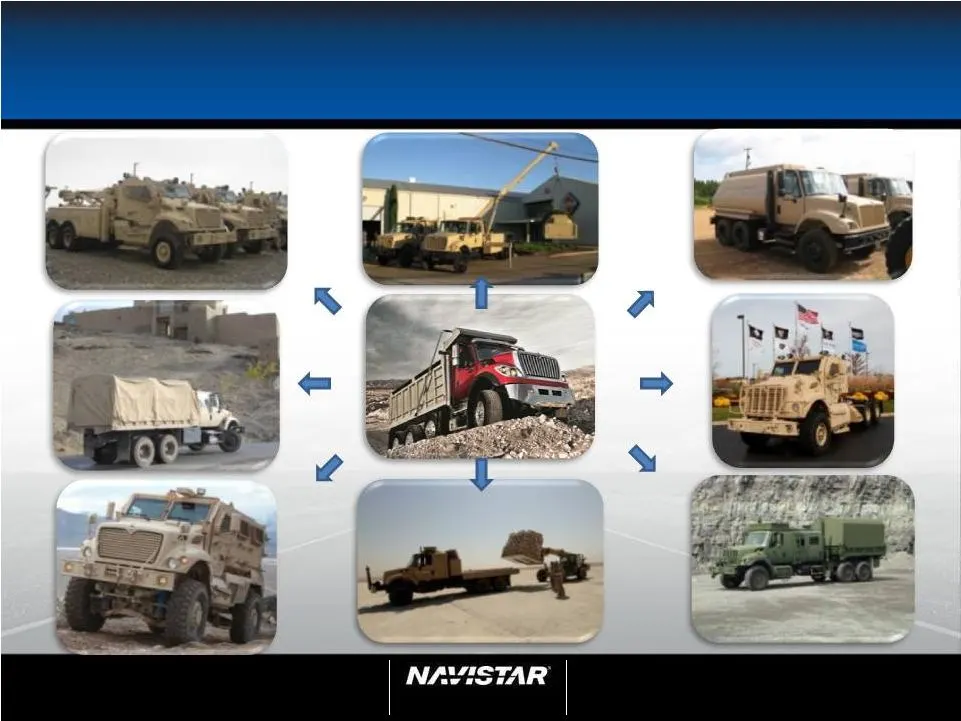
Slide 45: Economical Solutions Leveraging Commercial Assets with Integration
NYSE: NAV 45 Analyst Day February 1, 2012 45 Economical Solutions Leveraging Commercial Assets with Integration
Slide 46: Economical Solutions Innovation & Integration Within Defense
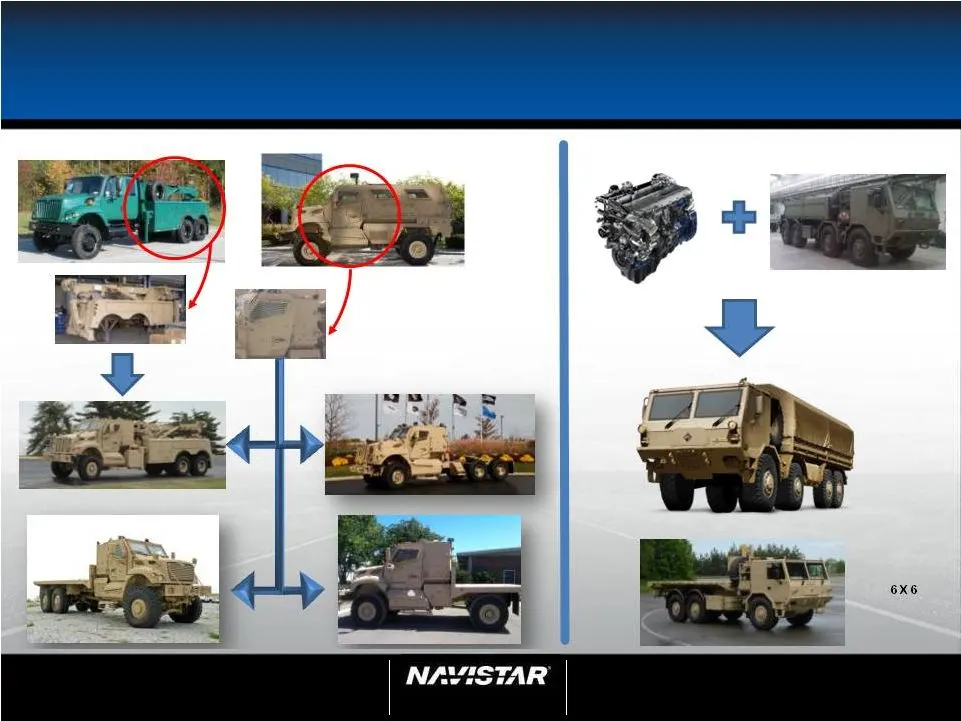
NYSE: NAV 46 Analyst Day February 1, 2012 46 Economical Solutions Innovation & Integration Within Defense MaxxForce ® D Engines Tatra Suspension System 8 X 8 6 X 6
Slide 47: Economical Solutions for Life-Cycle Integration With Commercial Systems
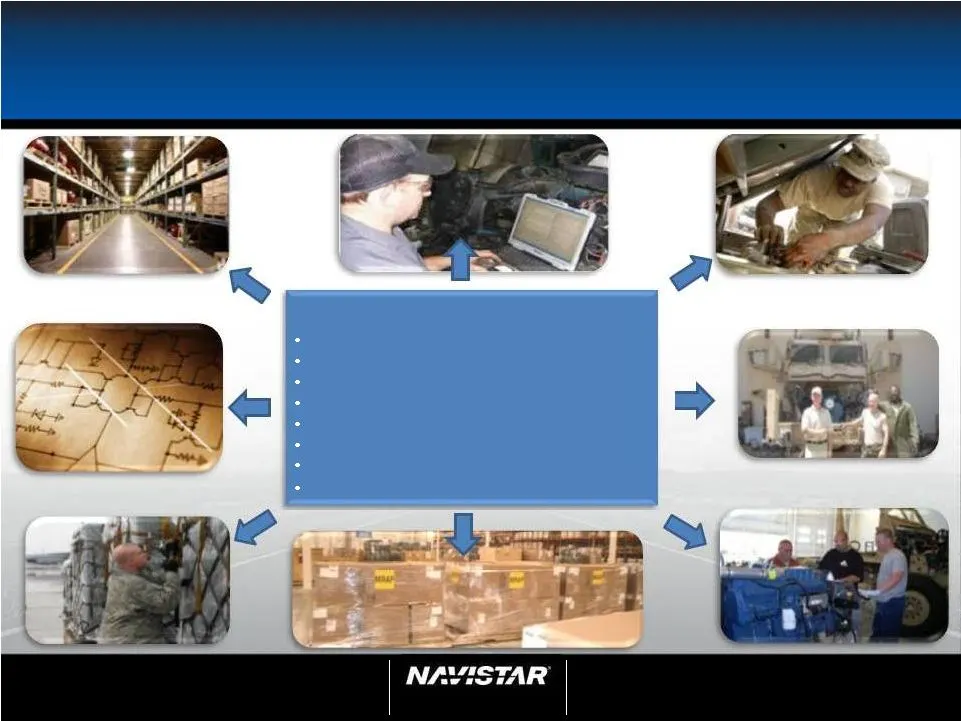
NYSE: NAV 47 Analyst Day February 1, 2012 47 FSRs Parts distribution Economical Solutions for Life – Cycle Integration With Commercial Systems Special tools (EZ techs) Engineering services Fleet/Parts availability contracts Warranty Training Commercial Core Dealerships Parts availability Technicians
Slide 48: System Technical Support Initiatives
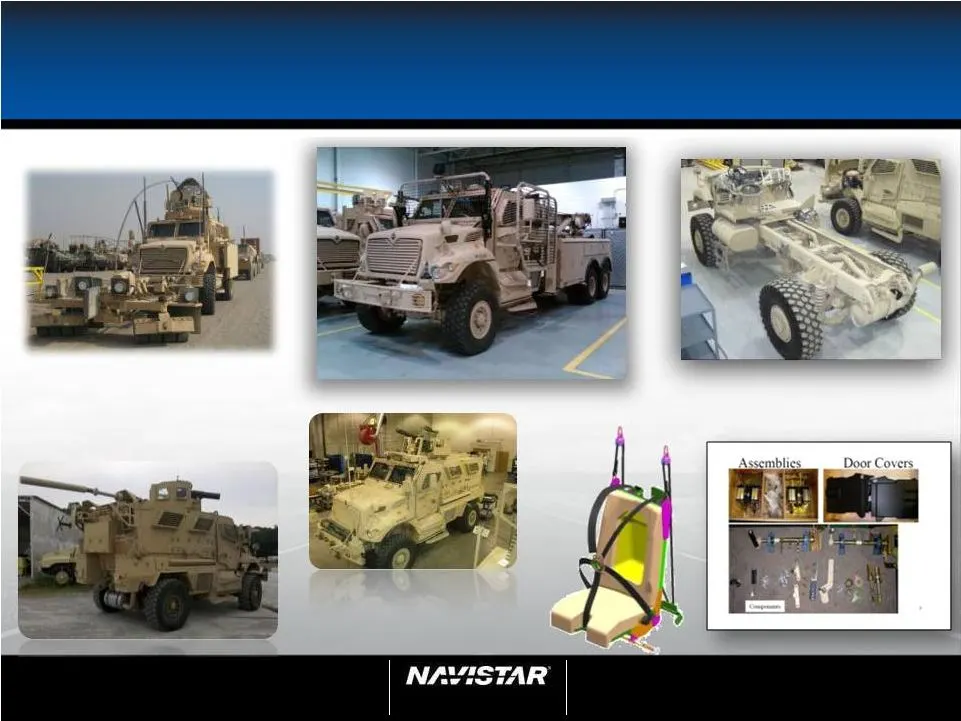
NYSE: NAV 48 Analyst Day February 1, 2012 48 System Technical Support Initiatives
Slide 49: Recent Wins: $990M MaxxPro Rolling Chassis & DXM Kits
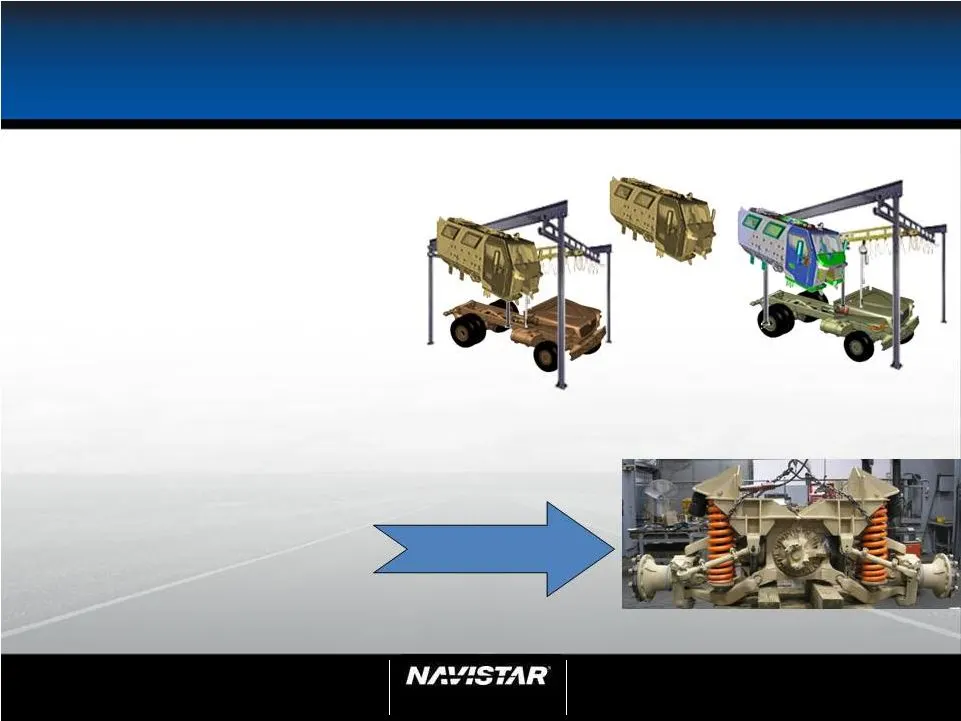
NYSE: NAV 49 Analyst Day February 1, 2012 49 Recent Wins: $990M MaxxPro Rolling Chassis & DXM Kits ISS – Independent Suspension Solution (ISS) Fielded MaxxPro Plus DXM ISS upgrade Rolling Chassis Award: • 2,717 Rolling Chassis • Engineering changes • Supplies • Services MaxxPro Plus DXM™ ISS Kits: •
Slide 50: Navistar Defense Revenue Mix
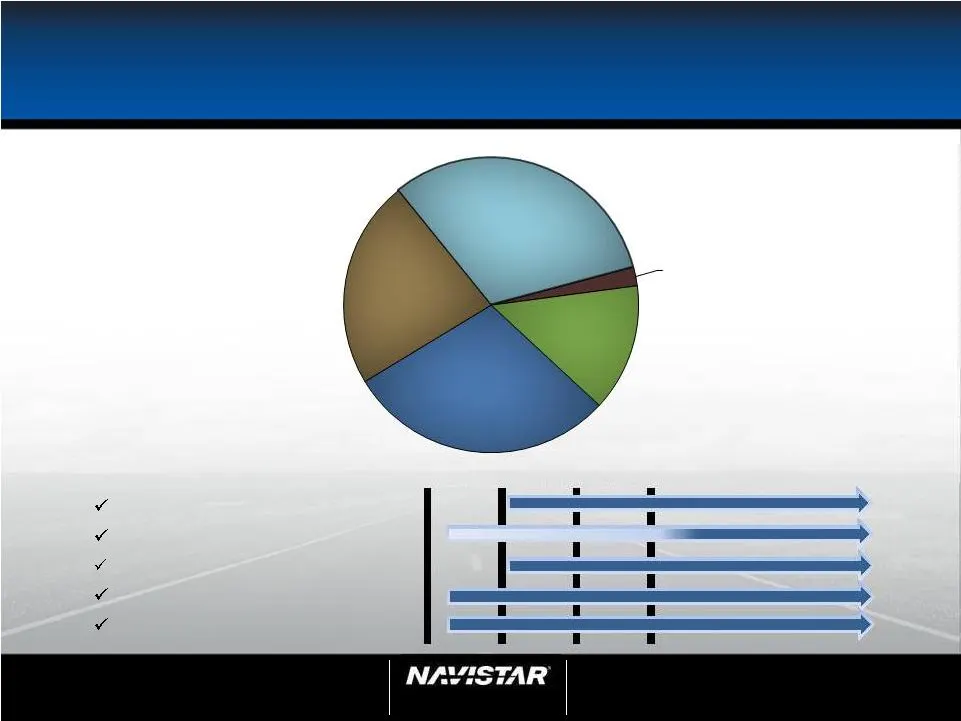
NYSE: NAV 50 Analyst Day February 1, 2012 50 Navistar Defense Revenue Mix MSVS SMP - Medium Support Vehicle System (MSVS) Standard Military Pattern (SMP); JLTV – Joint Light Tactical Vehicle (JLTV); FMS – Foreign Military Sales Diversified Military Revenue Capability Insertion Parts U.S. & FMS Vehic
Slide 51: Anticipating the Need
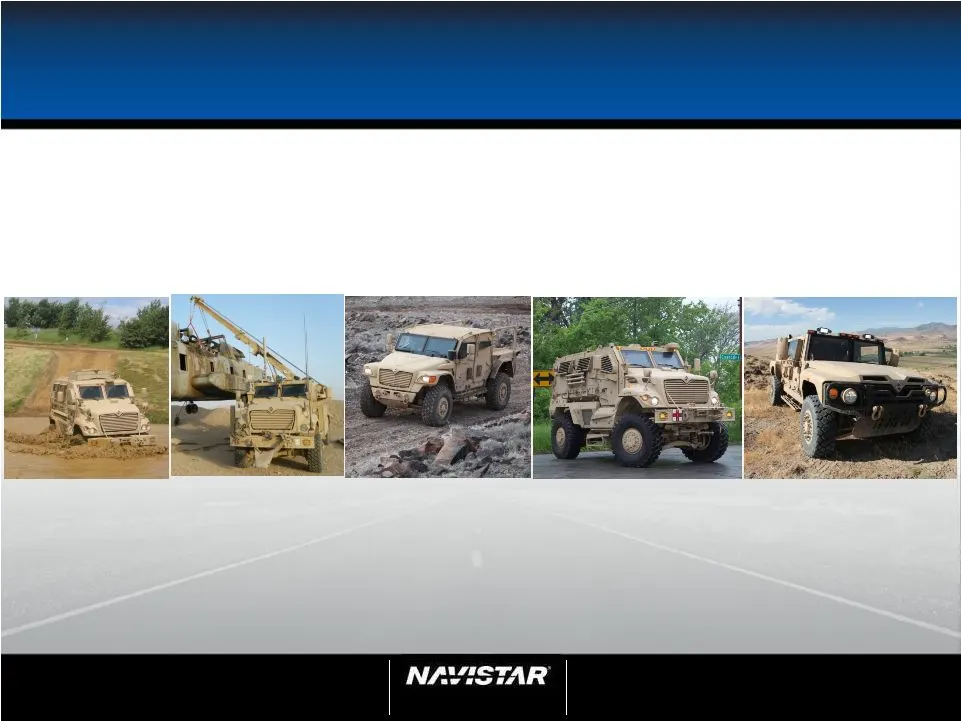
NYSE: NAV 51 Analyst Day February 1, 2012 51 Anticipating the Need MaxxPro ® Plus 2,247 Units MaxxPro ® Recovery 390 Units MaxxPro ® Dash Ambulance 250 Units Saratoga™ MXT™ 338 Units and Allied opportunities Available for U.S.
Slide 52: Joint Light Tactical Vehicle
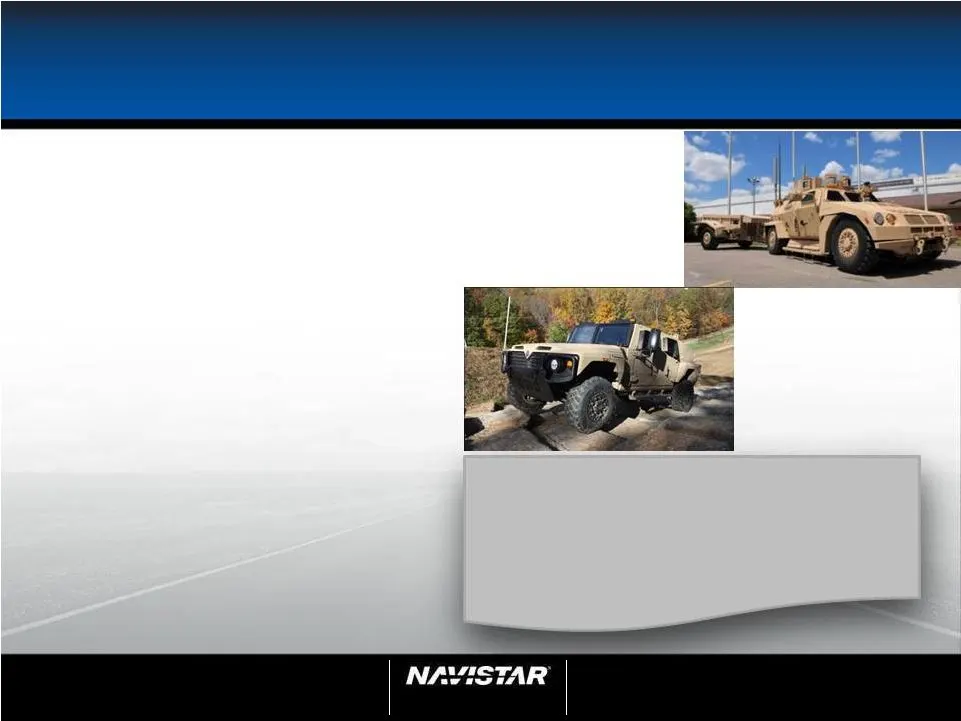
NYSE: NAV 52 Analyst Day February 1, 2012 52 Joint Light Tactical Vehicle The Jan. 26 update: • $250K average cost per vehicle target • $65K for additional add-on armor kit (called a B kit) • Engineering, Manufacturing and Development phase will now be 27 months • Production award in 2015 • Procurem

Slide 53: Thanks
NYSE: NAV 53 Analyst Day February 1, 2012 53 Thanks Affordability $250K B-kit Survivability MRAP-Level Transportability 76” Ready Now

Slide 54: Eric Tech, President, Engine Group
NYSE: NAV 54 Analyst Day February 1, 2012 54 Eric Tech President, Engine Group
Slide 55: Navistar Engine
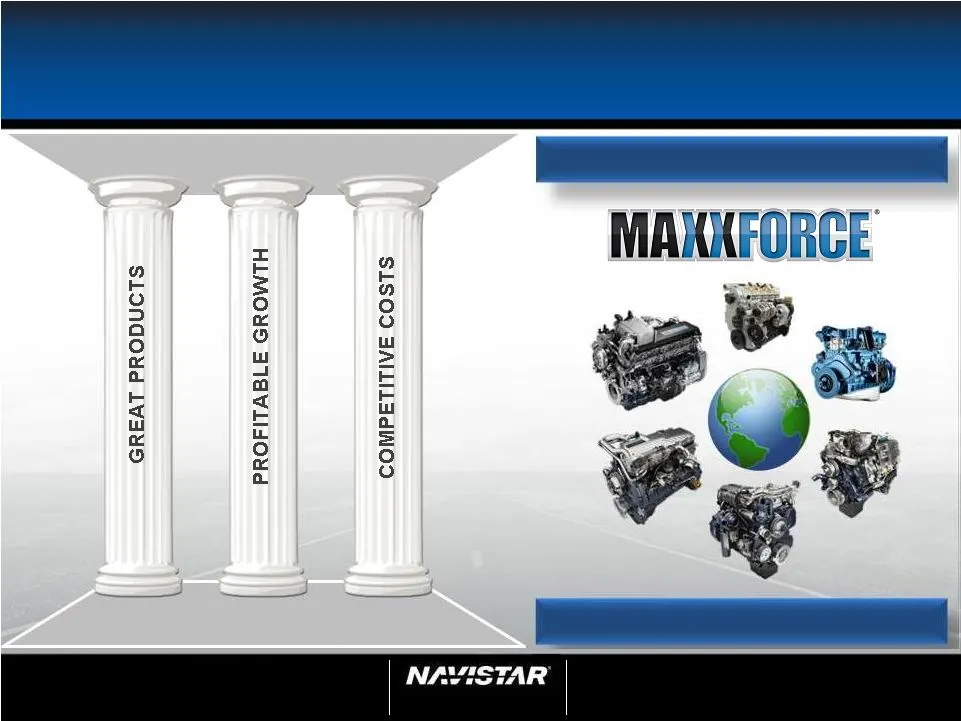
NYSE: NAV 55 Analyst Day February 1, 2012 55 Navistar Engine LEVERAGING ASSETS & CONTROLLING DESTINY DIFFERENTIATION & INTEGRATION Controlling Our Destiny Leading Integration
Slide 56: Integration - Navistar Truck
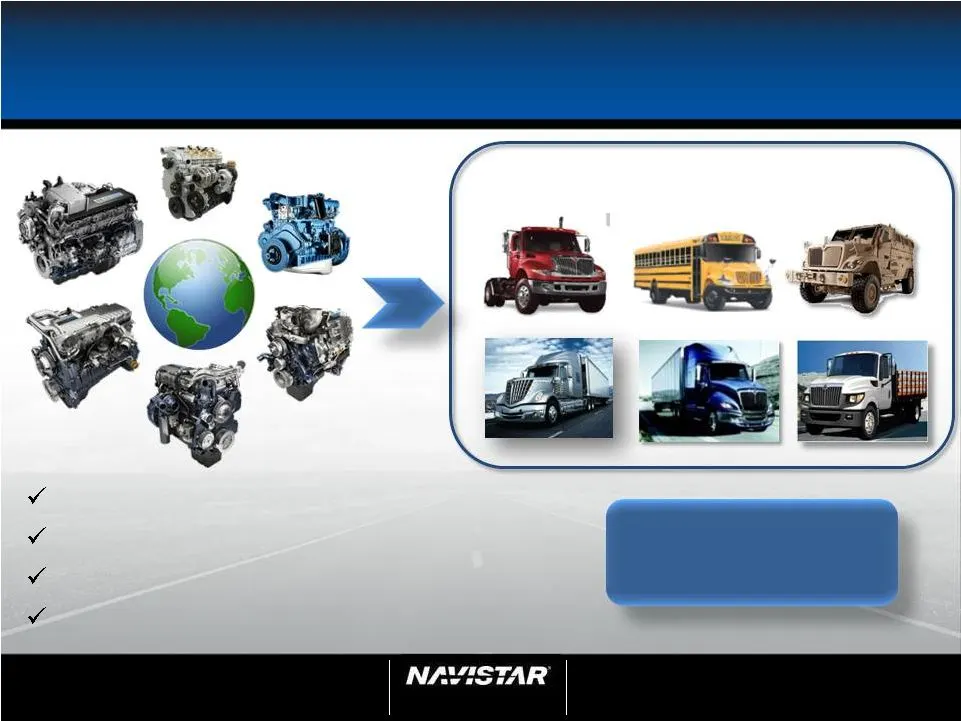
NYSE: NAV 56 Analyst Day February 1, 2012 56 Integration - Navistar Truck 100% MaxxForce Engines Full line of engines & parts thru Class 8 Superior emissions solution Fuel economy & performance advantages Competitive cost structure Advantage Navistar Truck
Slide 57: Margin Improvement Reduced Cost Improved Profitability
NYSE: NAV 57 Analyst Day February 1, 2012 57 Margin Improvement Reduced Cost Improved Profitability Stability & scale enables… Material cost reduction Supply chain optimization Manufacturing efficiencies Internalized margins through PPT 2011 2012 Goal Cost per unit reduction 13% 10% Hour per unit re
Slide 58: Leverage Across the Business
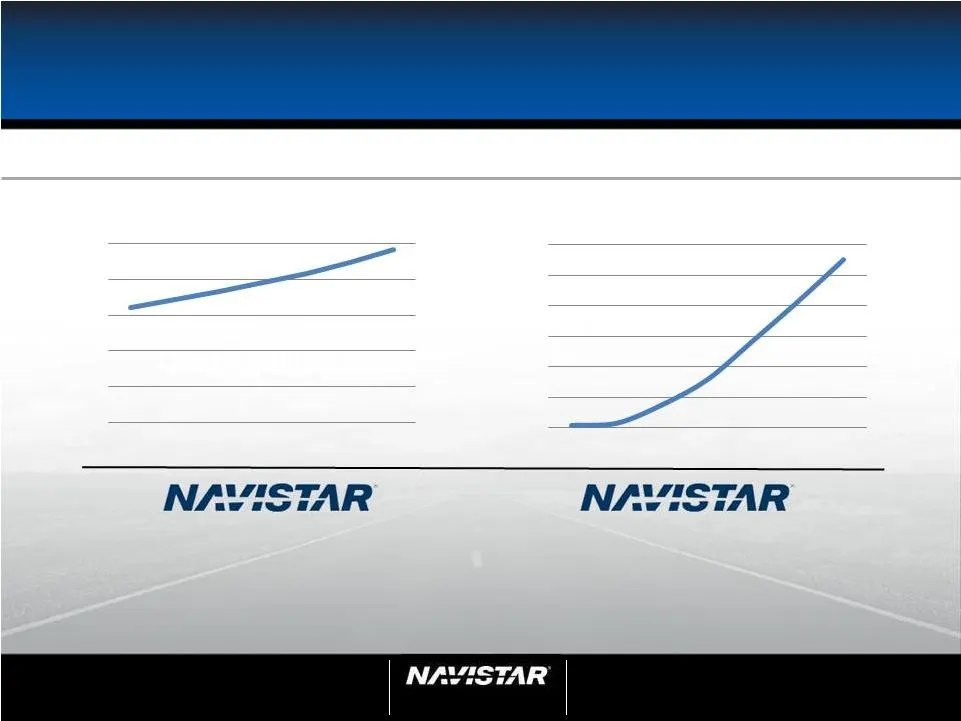
NYSE: NAV 58 Analyst Day February 1, 2012 58 Leverage Across the Business Over 7 Million Today Inline Installed Engine Population 2009 2012 2015 Big Bore Today 50,000 • Large installed base • Drives parts revenue • Growing components share • Expanded engine range • Increasing proprietary parts • Big
Slide 59: Industry Leverage for North America Growth
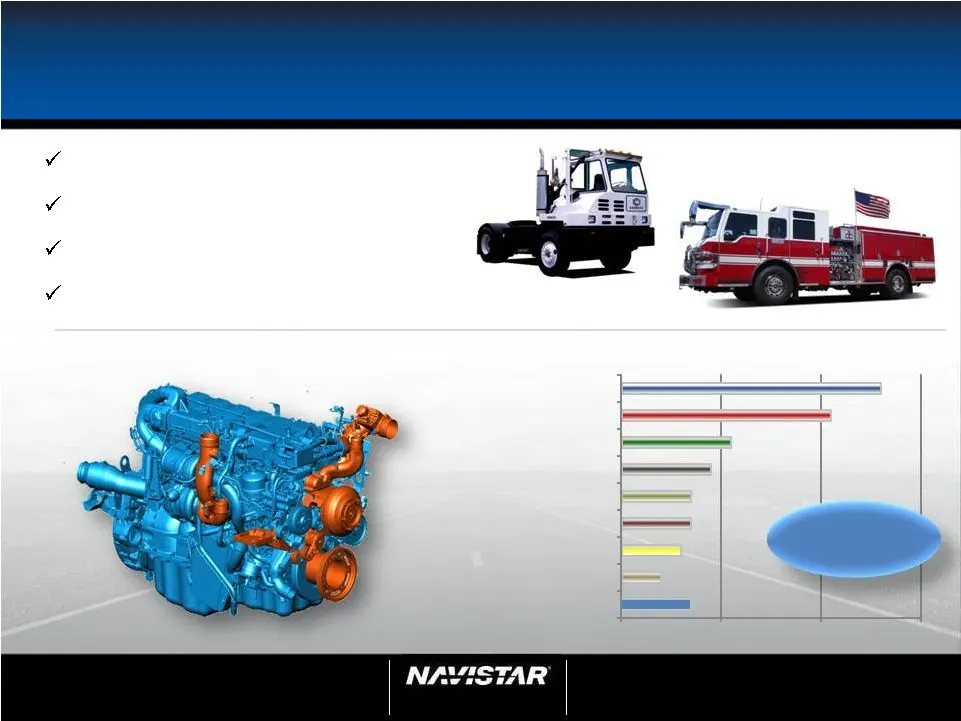
NYSE: NAV 59 Analyst Day February 1, 2012 59 30k Industry Leverage for North America Growth North American On-Road OEM Market MaxxForce ® 13 Custom Fire Truck Engine Proven on-road product portfolio Leading emissions technology Niche high-margin segments Leverage Navistar parts & service 3,000 6,000
Slide 60: Leverage for Global Growth
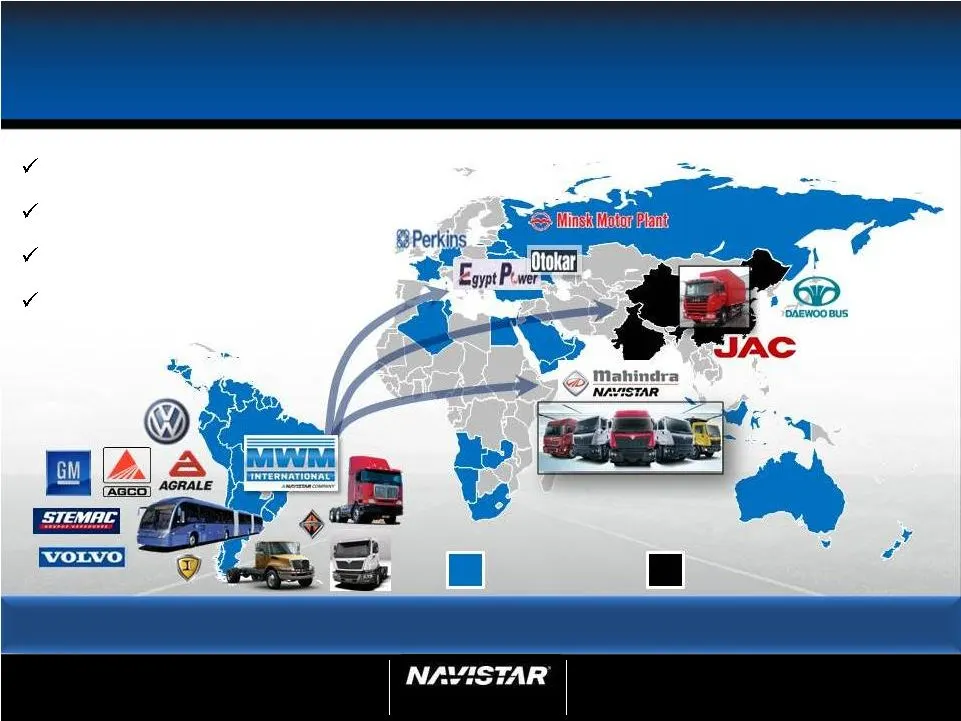
NYSE: NAV 60 Analyst Day February 1, 2012 60 Leverage for Global Growth Global Emissions Flexibility Regional Supply Base Local Manufacturing Capability Global Service & Parts Network Setting the Foundation for Global Truck Business OEM/Truck Market Joint Ventures
Slide 61: Leverage for Component Growth
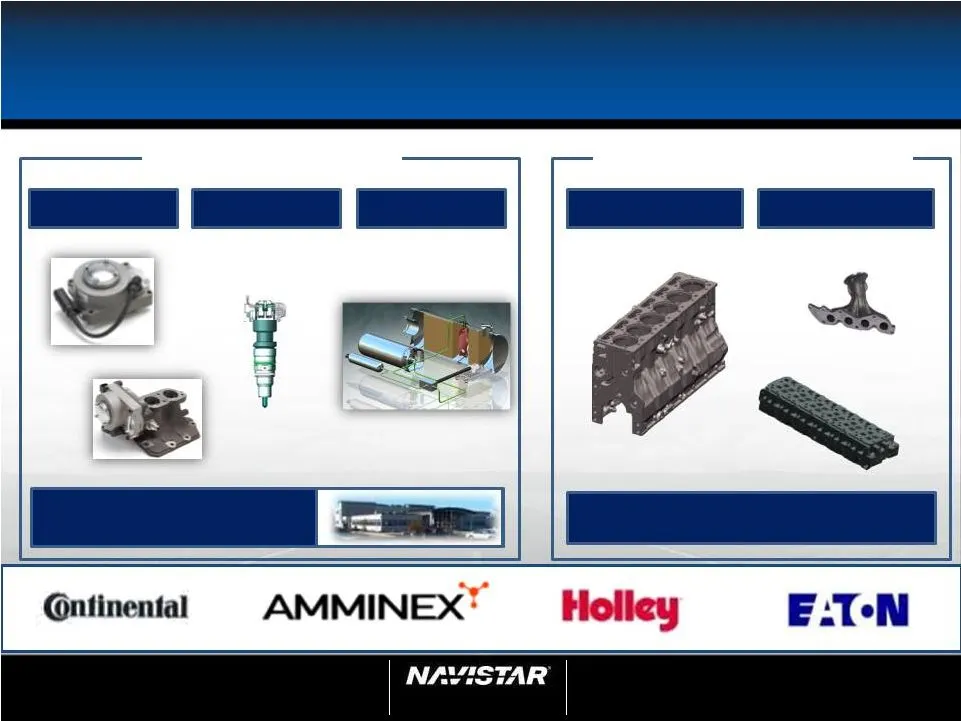
NYSE: NAV 61 Analyst Day February 1, 2012 61 A ir S ystem F uel S ystem A/T S ystem R esearch and D evelopment D esign and M aterial S olutions M etal C astings M achining Leverage for Component Growth METALCASTINGS GROUP SYSTEMS GROUP
Slide 62: Navistar Engine Business Progress
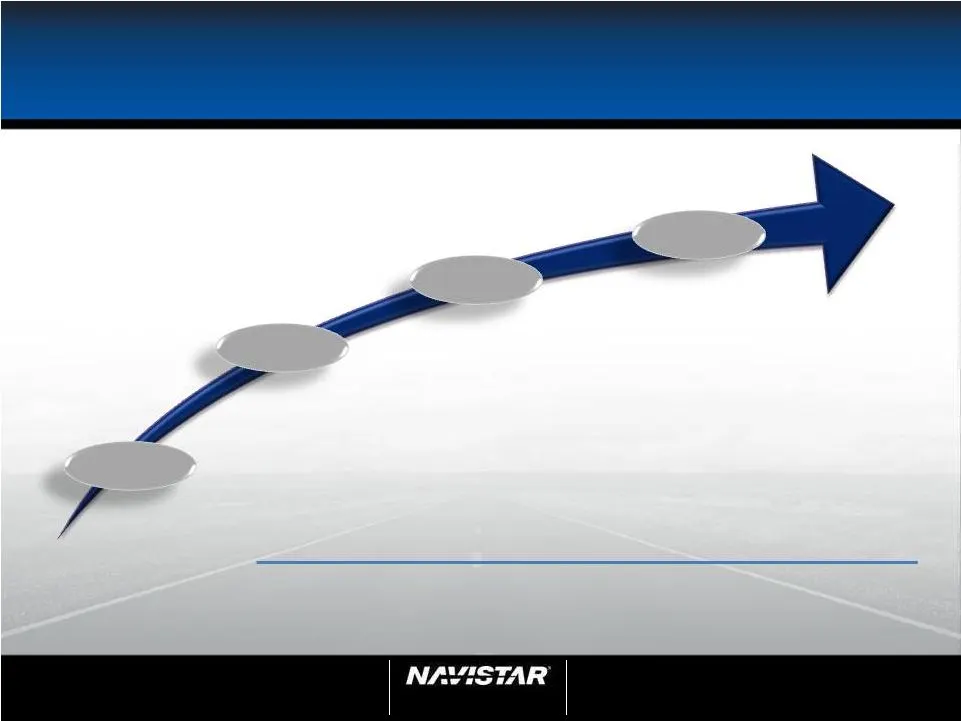
NYSE: NAV 62 Analyst Day February 1, 2012 62 Navistar Engine Business Progress Note: Engine revenue includes intercompany sales. 2011 2012 Future Transition Stabilize & Achieve Scale Demonstrate Results Leading Commercial Engine Producer Revenue Growth 2010 2011 2012 Future $3.0B $3.7B $4.0 - $4.5B

Slide 63: Troy Clarke, President, Asia Pacific and Strategic Initiatives
NYSE: NAV 63 Analyst Day February 1, 2012 63 Troy Clarke President, Asia Pacific and Strategic Initiatives
Slide 64: Navistar's Global Strategy
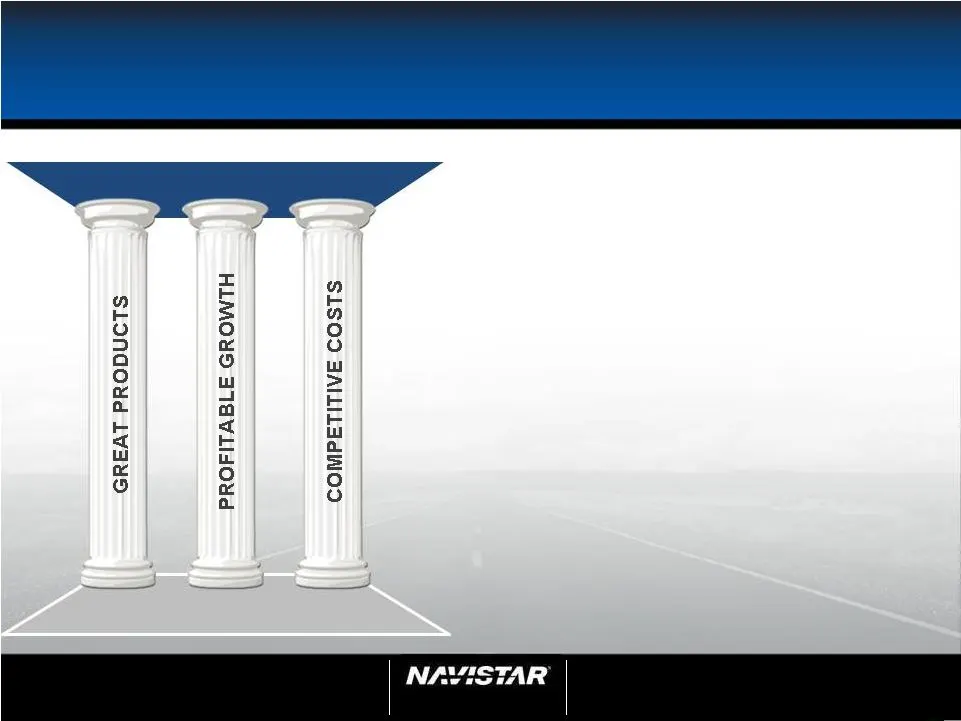
NYSE: NAV 64 Analyst Day February 1, 2012 64 Navistar’s Global Strategy DIFFERENTIATION & INTEGRATION LEVERAGING ASSETS & CONTROLLING DESTINY 1. INTERNATIONAL ® brand distribution • Markets that matter • Local leadership • Exclusive distribution 2. Leverage what we do well • Customer knowledge / sup
Slide 65: Goal: Significant Revenue Growth
NYSE: NAV 65 Analyst Day February 1, 2012 65 Goal: Significant Revenue Growth PARTS revenue outside revenue outside North America North America 50% 50% Integrated Growth Engines Trucks
Slide 66: Global Timeline
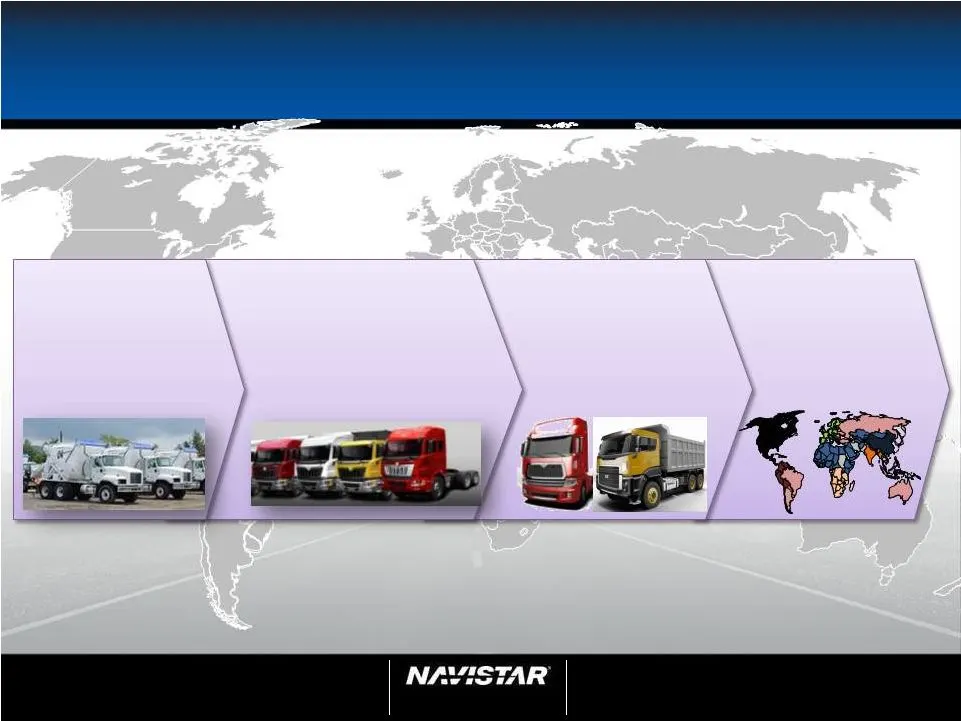
NYSE: NAV 66 Analyst Day February 1, 2012 66 Global Timeline 2010 Profitable Exports and Investing 2011 Expanded Exports and Continuing Investment 2012 Growth and Profitability 2015 Global Vision
Slide 67: 2011 Global Accomplishments
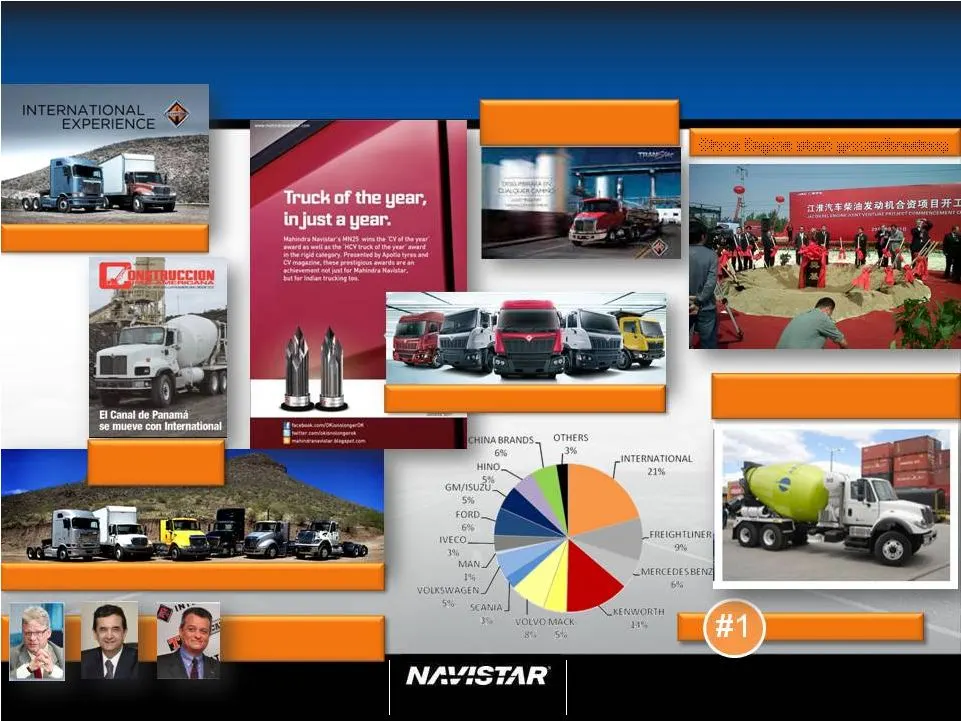
2011 Global Accomplishments Restructured NC2 JV Strong LOCAL Leadership China Engine plant groundbreaking Latin America share Record Continental Mixer sales in Latin America China Engine plant groundbreaking Award-winning products in India TranStar ® launch in Latin America Back in business in Brazi
Slide 68: Global Revenue Projected to Double
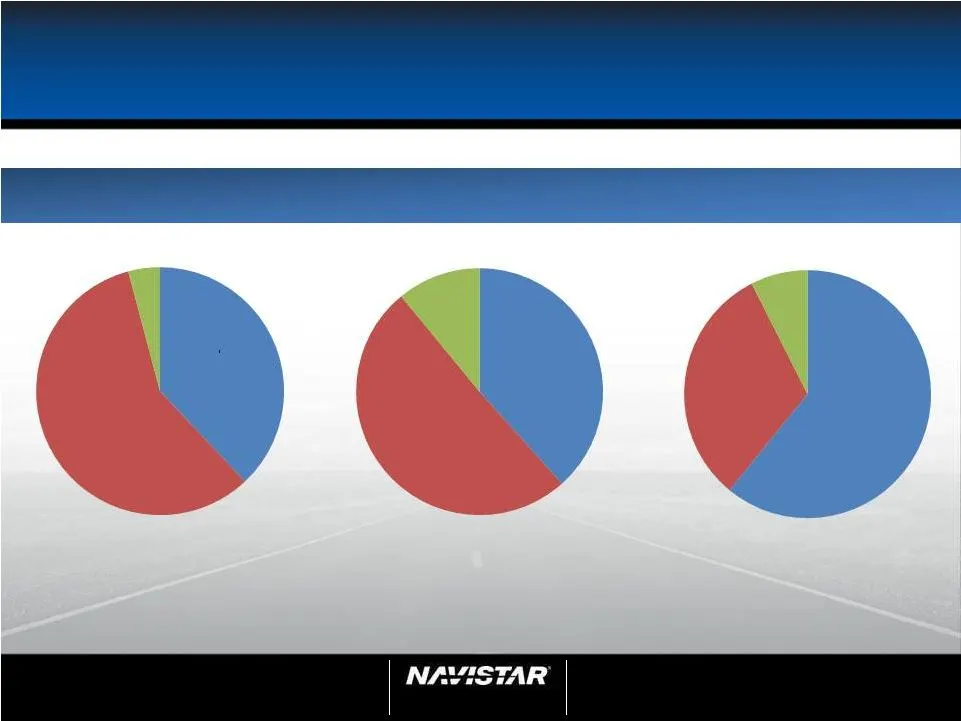
NYSE: NAV 68 Analyst Day February 1, 2012 68 Global Revenue Projected to Double 2007 2015 2011 $1.5 B $6-8 B $3 B Parts Engine Truck Parts Engine Truck Parts Engine Truck
Slide 69: Integrated Global Strategy: Feet First
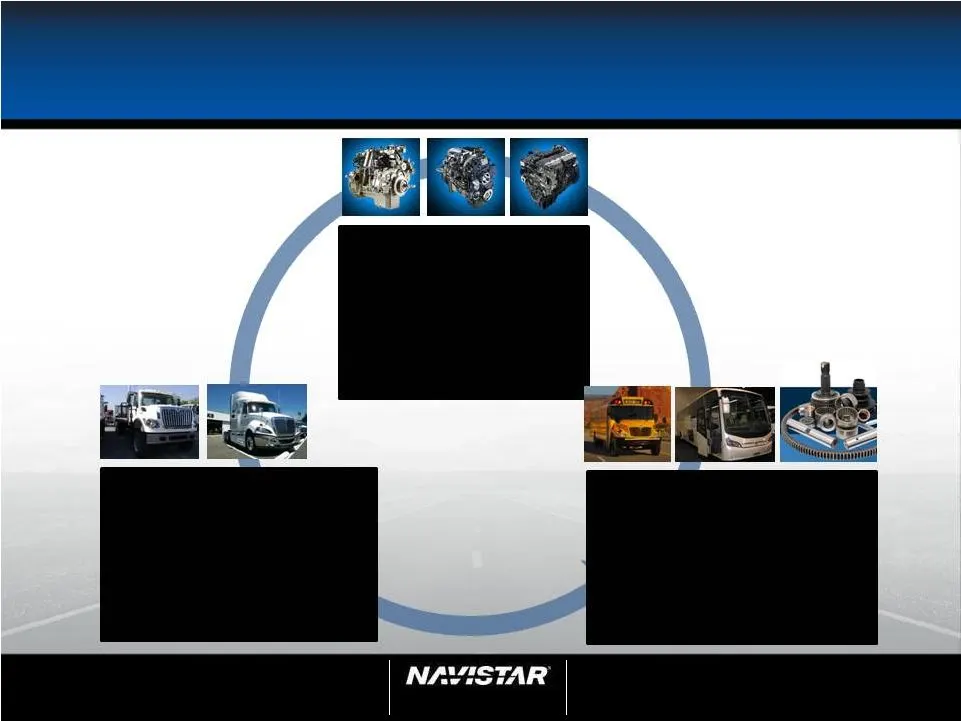
NYSE: NAV 69 Analyst Day February 1, 2012 69 Integrated Global Strategy: Feet First ENGINE • Build reputation • Service network • Brand association • Supply base • Parts support network • 85% key ratings available TRUCK • Develop truck distribution • Leverage truck brands • Integrated engines • Incr
Slide 70: Global Playbook: A Proven Blueprint
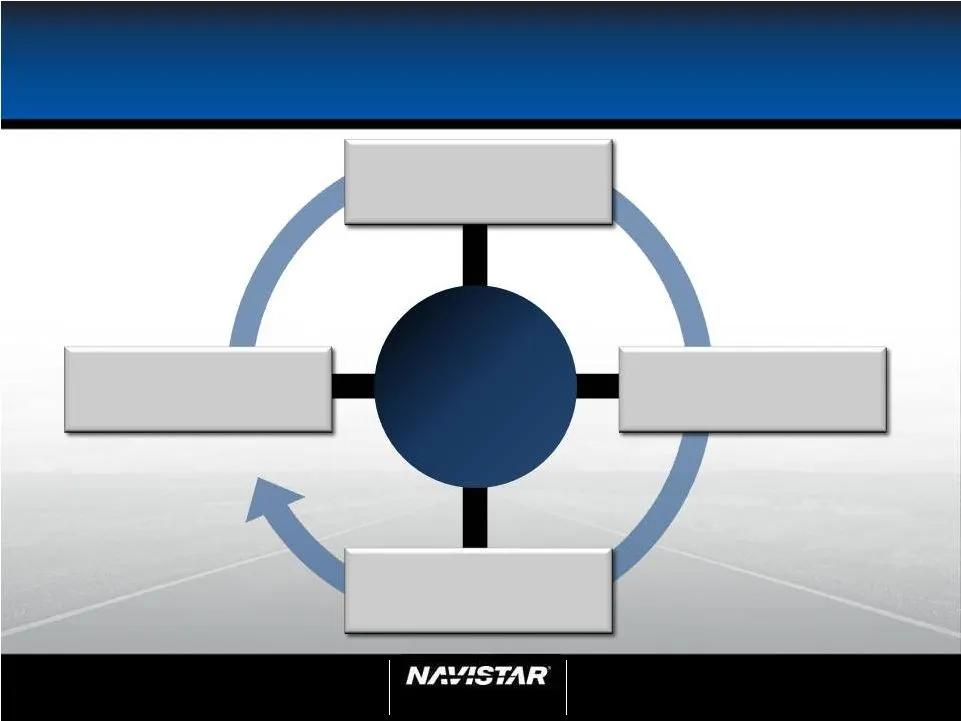
NYSE: NAV 70 Analyst Day February 1, 2012 70 STRONG DISTRIBUTION LOCAL LEADERSHIP INTEGRATED GROWTH INTEGRATED PRODUCT Global Playbook: A Proven Blueprint MARKETS THAT MATTER
Slide 71: Focus on Growing Markets
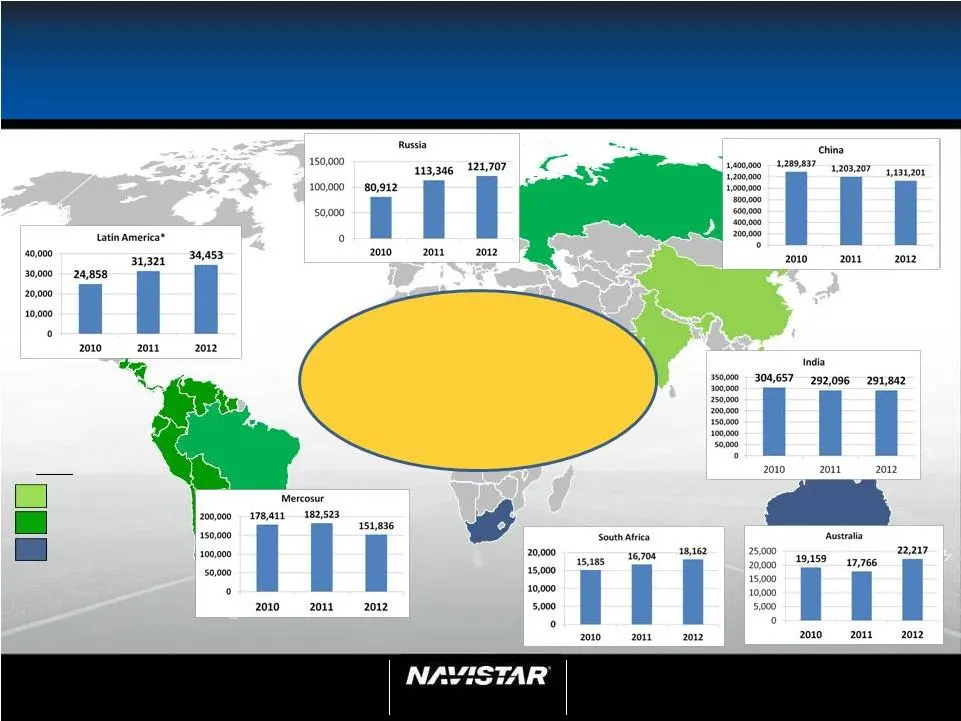
NYSE: NAV 71 Analyst Day February 1, 2012 71 Focus on Growing Markets 2010: 1.9 M 2015: 2.3 – 2.5 M GDP > 7% GDP = 4 – 7% GDP < 4% GDP Industry Volumes Note: Includes Medium and Heavy Trucks >6T - Source: JD Power Q2 2011 * Class & Only (source: compiled country data from Regional Office)
Slide 72: Global Playbook
NYSE: NAV 72 Analyst Day February 1, 2012 72 LOCAL LEADERSHIP INTEGRATED GROWTH Global Playbook MARKETS THAT MATTER STRONG DISTRIBUTION INTEGRATED PRODUCT
Slide 73: Strong Alliances and Leadership
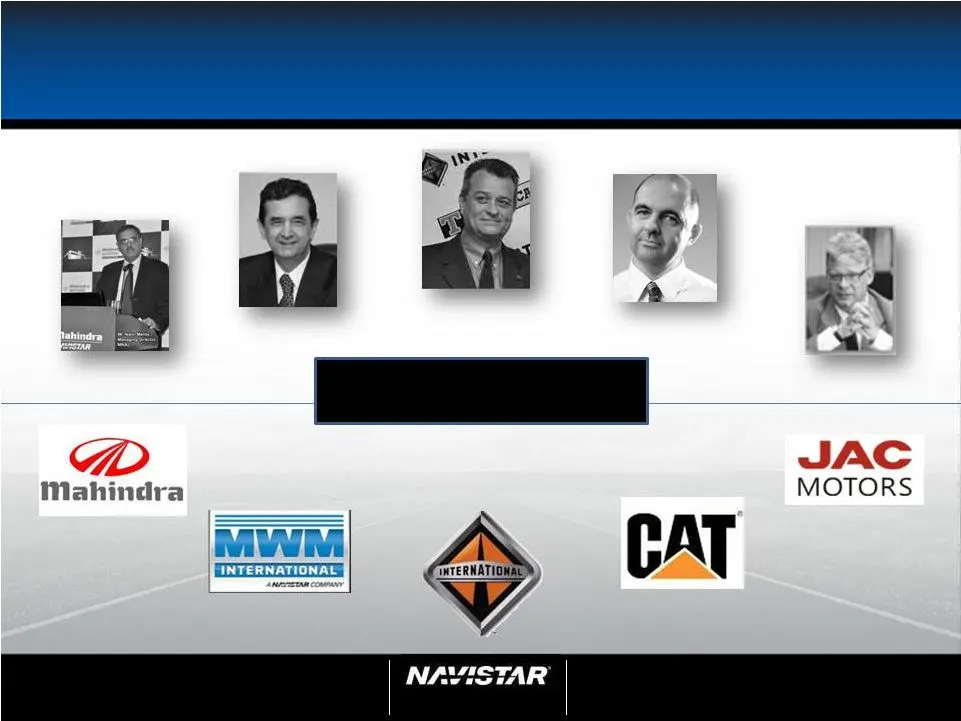
NYSE: NAV 73 Analyst Day February 1, 2012 73 Strong Alliances and Leadership LEADERSHIP ALLIANCES AROUND THE GLOBE
Slide 74: Global Playbook
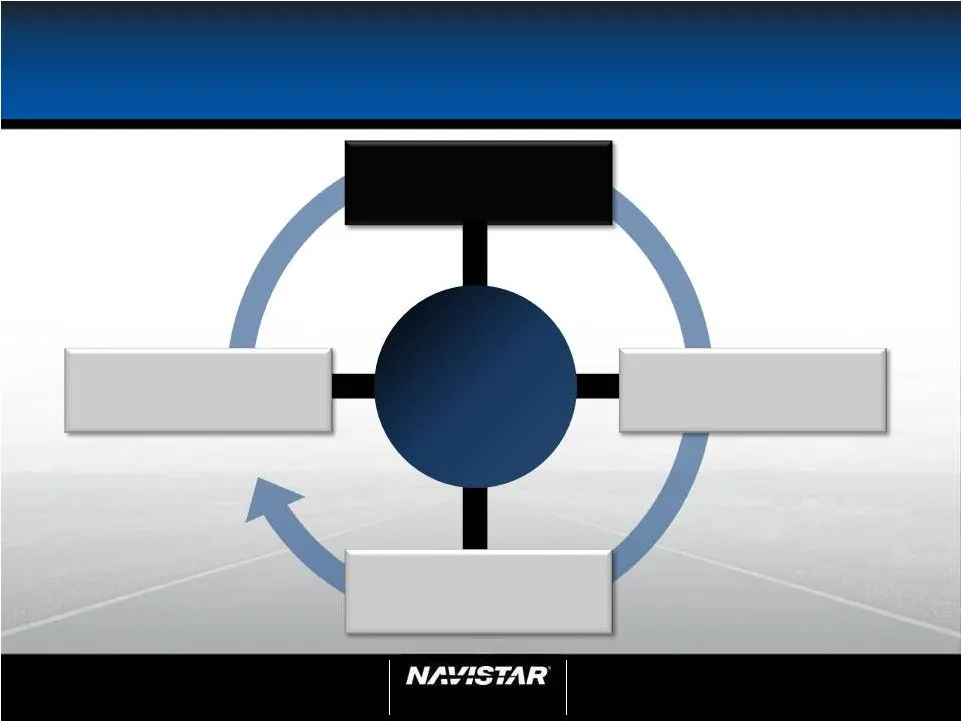
NYSE: NAV 74 Analyst Day February 1, 2012 74 INTEGRATED PRODUCT Global Playbook MARKETS THAT MATTER STRONG DISTRIBUTION LOCAL LEADERSHIP INTEGRATED GROWTH
Slide 75: Differentiate: Integrated Product Portfolio
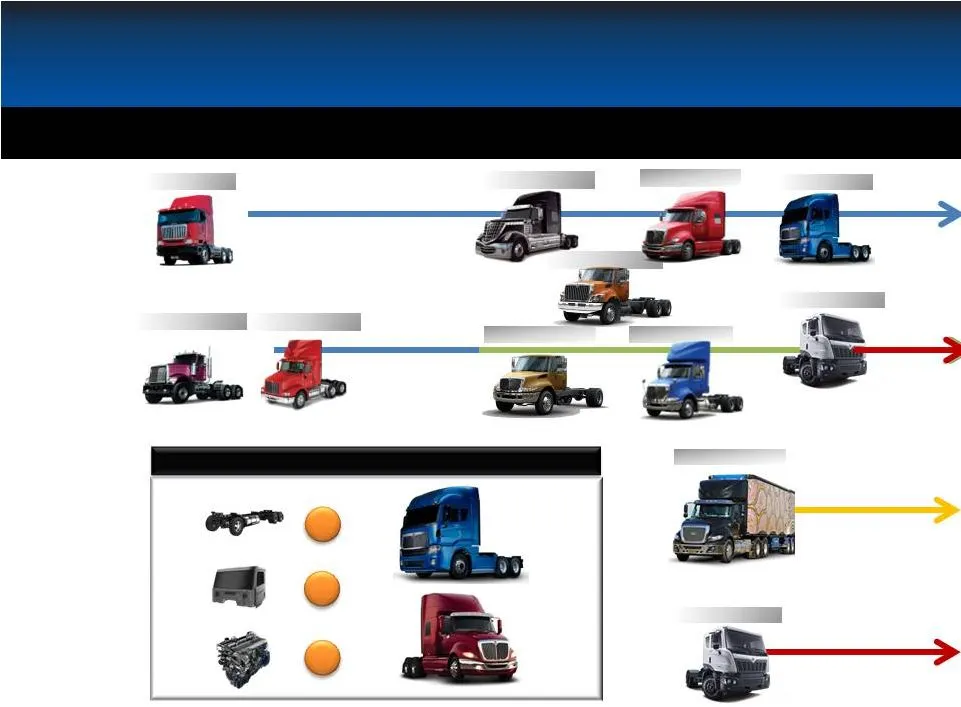
Differentiate: Integrated Product Portfolio 1-2-3 STRATEGY 1990 2010 2015 Brazil South Africa Latin America Australia India Brazil Latin America MN Series Cat C610/30 DuraStar ® LoneStar® ProStar® AeroStar™ TranStar ® MN Series 9000s PayStar ® 9800 WorkStar ®
Slide 76: Differentiate: Integrated Engine Portfolio
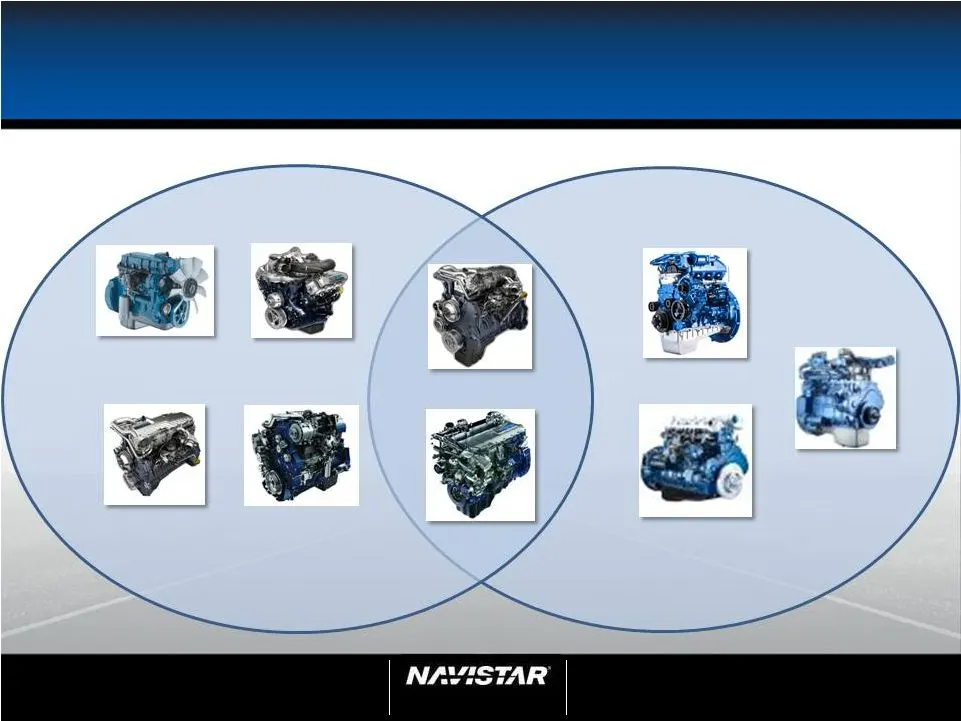
NYSE: NAV 76 Analyst Day February 1, 2012 76 Differentiate: Integrated Engine Portfolio EPA ENGINES EURO ENGINES MaxxForce ® DT466 / 530 MaxxForce ® MaxxForce ® MaxxForce ® MaxxForce ® MaxxForce ® MaxxForce ® 3.2 MaxxForce ® 4.8 MaxxForce ® 7.2
Slide 77: Global Playbook
NYSE: NAV 77 Analyst Day February 1, 2012 77 MARKETS THAT MATTER STRONG DISTRIBUTION LOCAL LEADERSHIP INTEGRATED GROWTH INTEGRATED PRODUCT Global Playbook
Slide 78: Differentiate: Strong Distribution
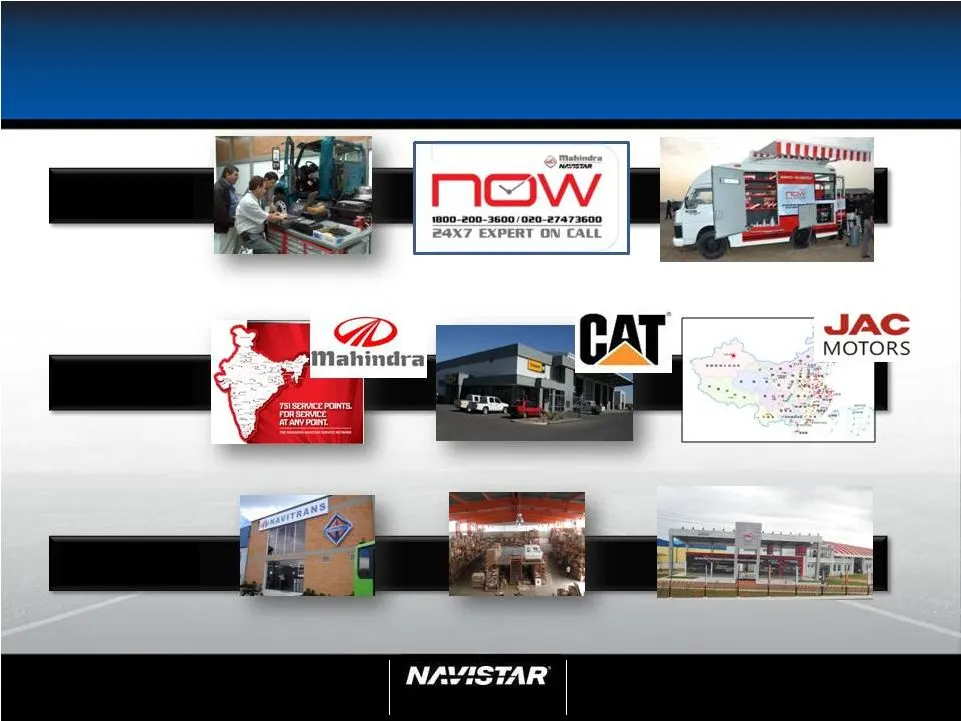
NYSE: NAV 78 Analyst Day February 1, 2012 78 Differentiate: Strong Distribution *JAC JV pending Customer Support Leverage Partnerships Commitment to the business Parts availability Brand exclusive Well financed, multi-location Australia India Training facilities Real time support China* Mobile servi
Slide 79: Global Dealer Footprint Progress
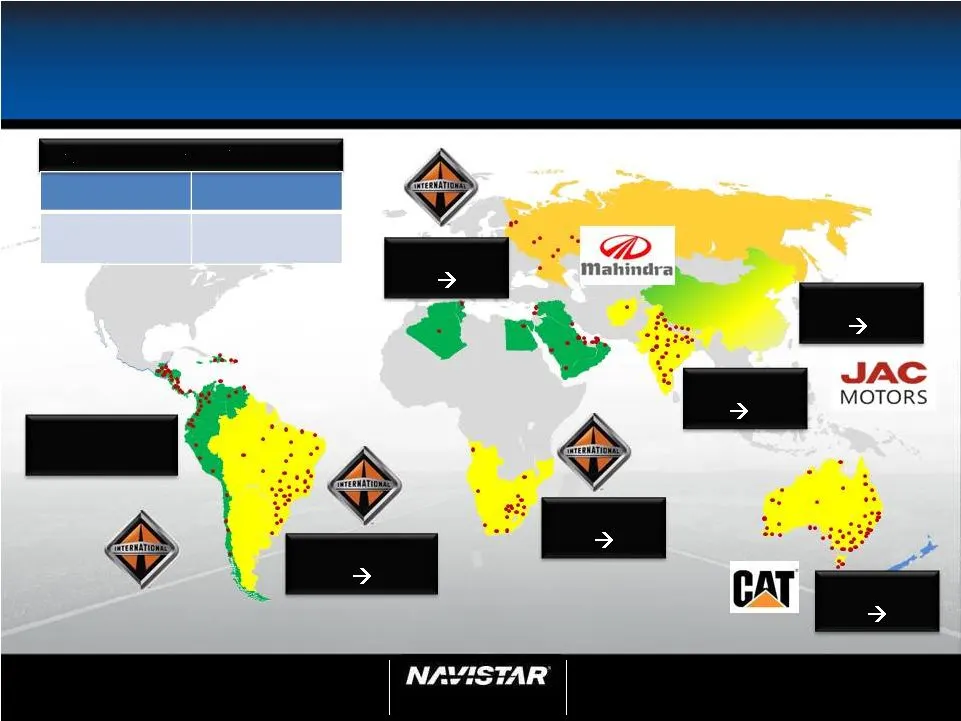
NYSE: NAV 79 Analyst Day February 1, 2012 79 Global Dealer Footprint Progress LATIN AMERICA 74 BRAZIL 12 80 S. AFRICA 11 40 INDIA 49 100 CHINA 100 180* AUSTRALIA 14 20 Sales locations 2012 2015+ Total Sales or Service Points *JAC JV pending MENA 13 25 650-700
Slide 80: Global Playbook
NYSE: NAV 80 Analyst Day February 1, 2012 80 MARKETS THAT MATTER LOCAL LEADERSHIP Global Playbook INTEGRATED PRODUCT STRONG DISTRIBUTION INTEGRATED GROWTH
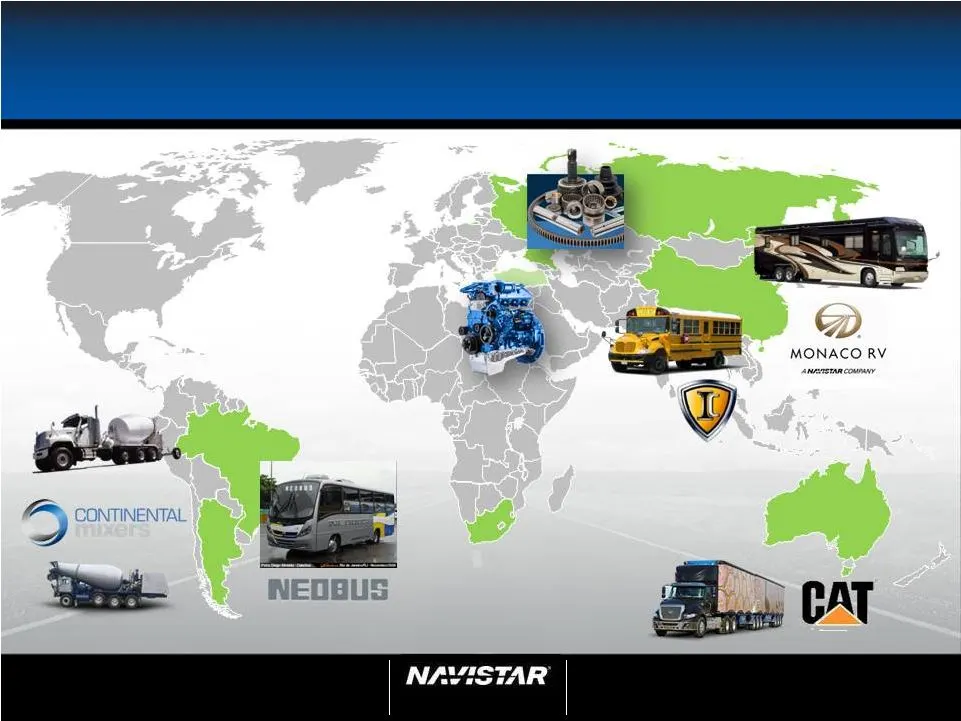
Slide 81: Integrated Growth Opportunities
NYSE: NAV 81 Analyst Day February 1, 2012 81 Integrated Growth Opportunities *Neobus JV pending
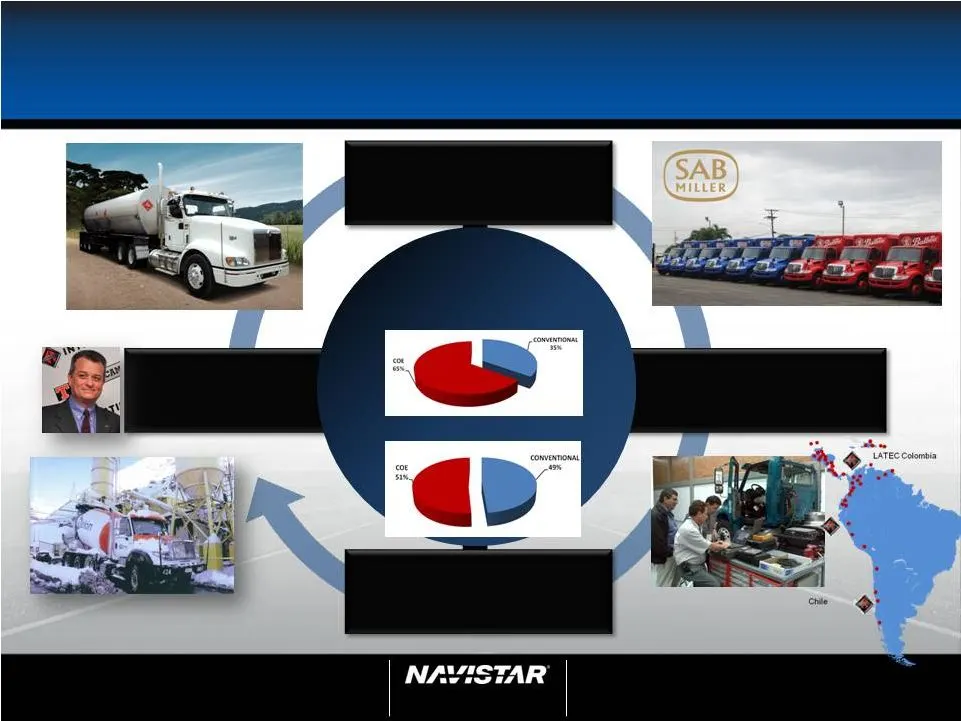
Slide 82: Global Playbook: Latin America
82 NYSE: NAV Analyst Day February 1, 2012 82 Global Playbook: Latin America INTEGRATED PRODUCT LOCAL LEADERSHIP INTEGRATED GROWTH STRONG DISTRIBUTION 31 YEARS EXPERIENCE IN LATIN AMERICA AERO VS. CAB OVER 2010 2011 LATEC fleet training Continental ® mixer Adapted for local market
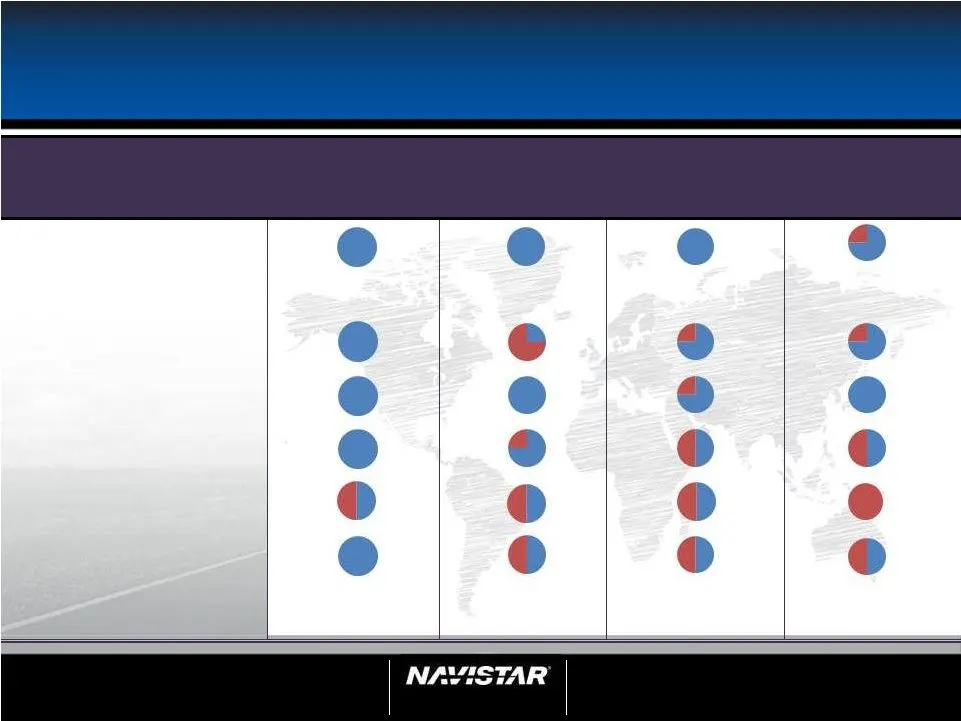
Slide 83: Progress and Results
NYSE: NAV 83 Analyst Day February 1, 2012 83 Progress and Results * JV pending Latin America Brazil India China* Local Leadership Product Truck Engine Parts Bus Distribution Results 2007 2000 2013 2013*
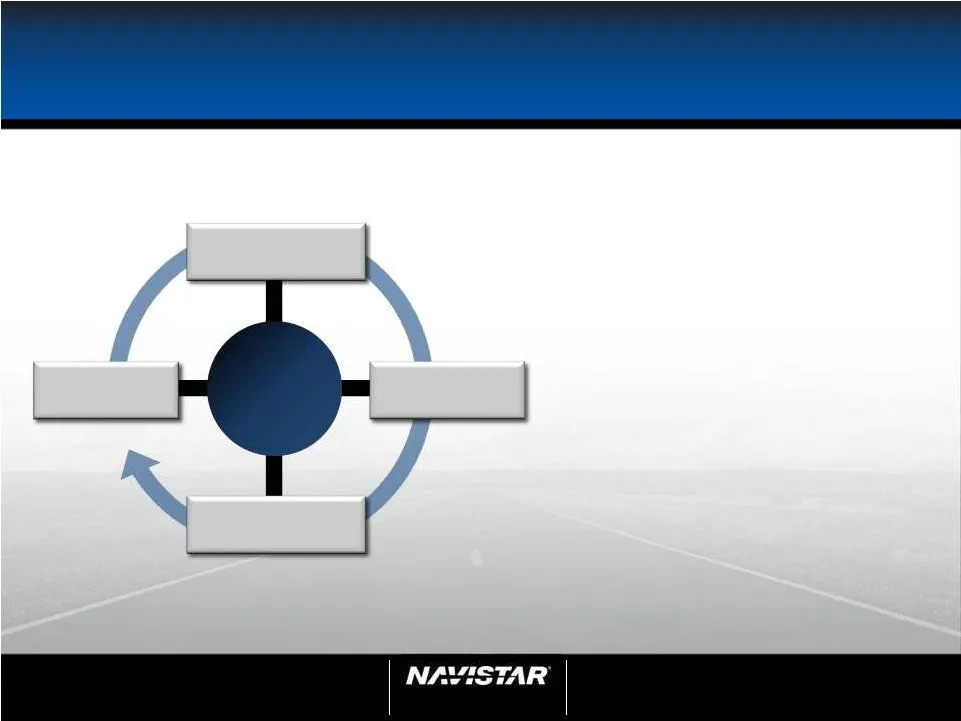
Slide 84: Accelerating Global Results
NYSE: NAV 84 Analyst Day February 1, 2012 84 Accelerating Global Results INTEGRATED PRODUCT STRONG DISTRIBUTION LOCAL LEADERSHIP INTEGRATED GROWTH MARKETS THAT MATTER • Global market – growing • Product strategy – ready to go • Distribution – building 2012 • Growth business – exciting opportunities

Slide 85: A. J. Cederoth, Executive Vice President & Chief Financial Officer
NYSE: NAV 85 Analyst Day February 1, 2012 85 A. J. Cederoth Executive Vice President & Chief Financial Officer
Slide 86: Setting a Path for Delivering Results
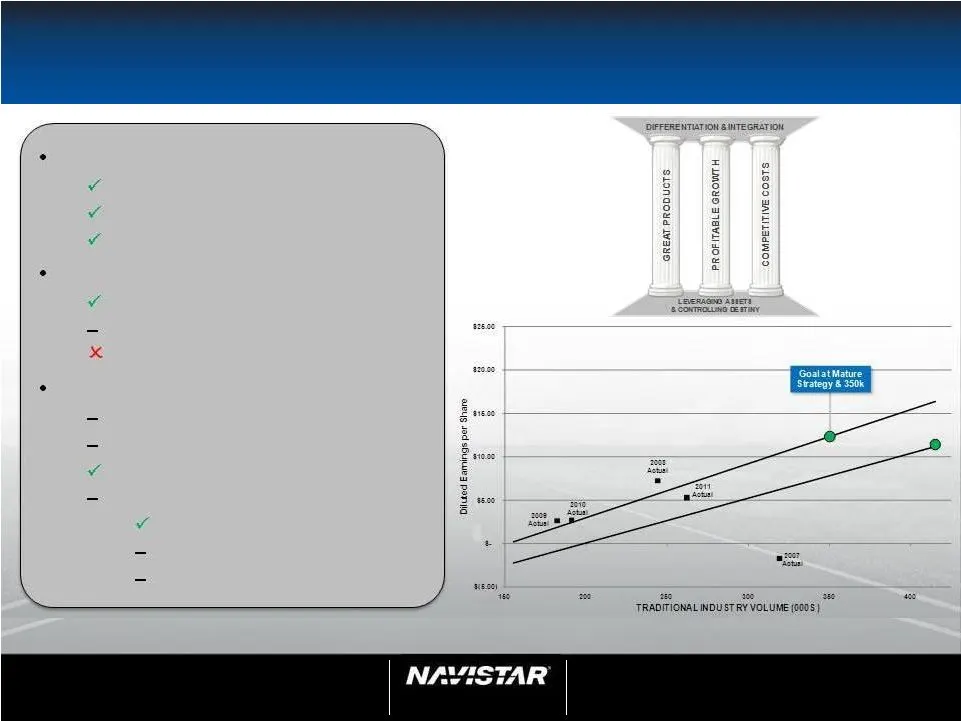
NYSE: NAV 86 Analyst Day February 1, 2012 86 Setting a Path for Delivering Results Note: This slide contains non-GAAP information; please see the Reg G disclosure in the appendix for a detailed reconciliation. 2007, 2008, 2009 and 2011 excluded certain charges. Great Products ProStar Big Bore Engine
Slide 87: What We've Heard Today
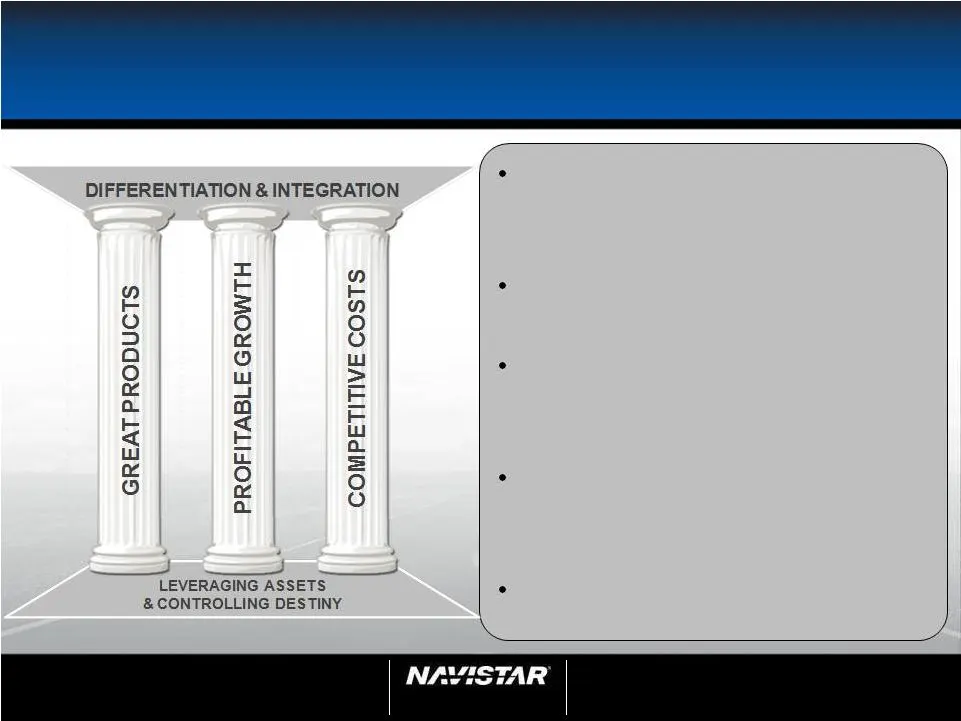
NYSE: NAV 87 Analyst Day February 1, 2012 87 What We’ve Heard Today Creating value through integration and differentiated thinking Core Truck – 10% return on sales Sustainable Military – Leveraged from commercial core Engine – Differentiator and catalyst for growth Global – Positioned for success
Slide 88: $20 Billion Diversified Mfg Revenue
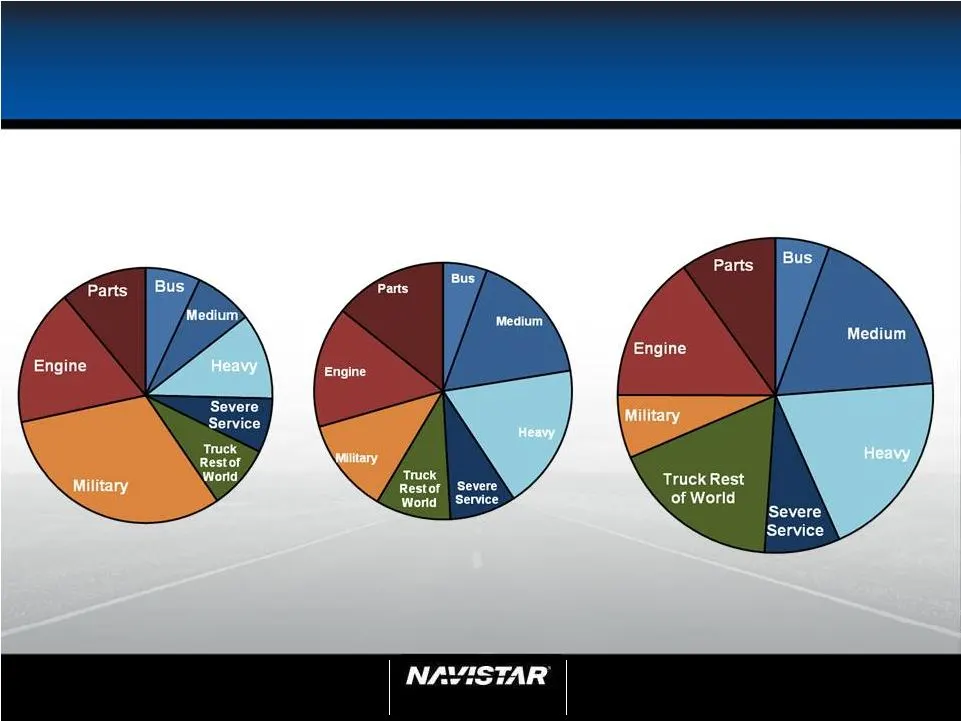
NYSE: NAV 88 Analyst Day February 1, 2012 88 $20 Billion Diversified Mfg Revenue Manufacturing Revenue 2008 $14 Billion $20 Billion $14 Billion Manufacturing Revenue 2011 Manufacturing Revenue at 350k Industry
Slide 89: Manufacturing Segment Profit
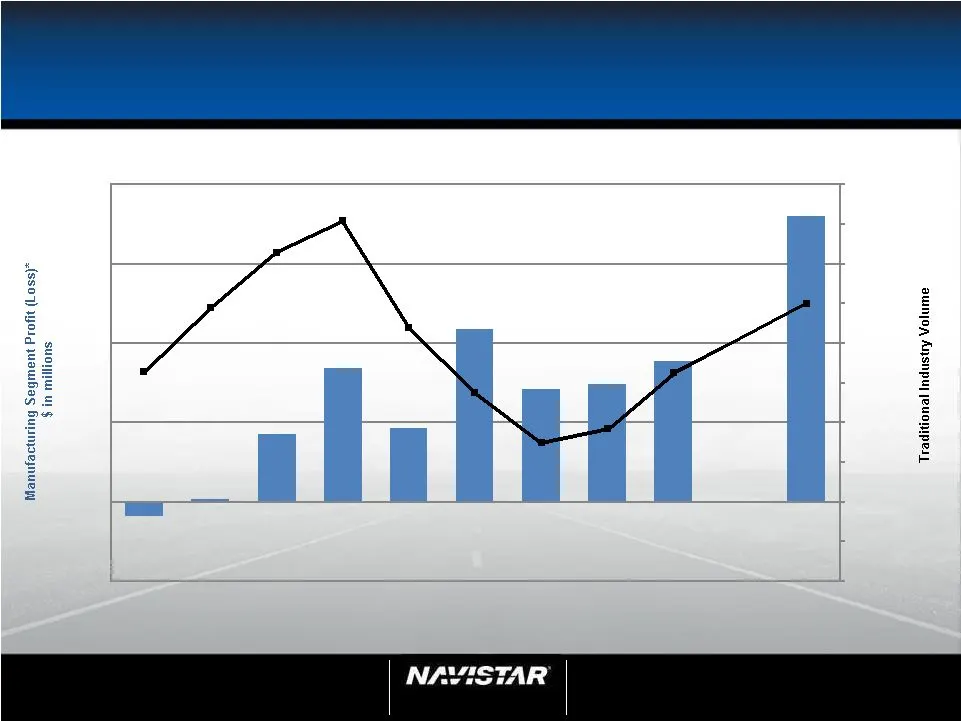
NYSE: NAV 89 Analyst Day February 1, 2012 89 Manufacturing Segment Profit* Note: This slide contains non-GAAP information; please see the Reg G disclosure in the appendix for a detailed reconciliation. * As adjusted ($93) $11 $421 $838 $462 $1,088 $707 $741 $882 $1,800 - 50,000 100,000 150,000 200,0
Slide 90: Elements of Strategic Success
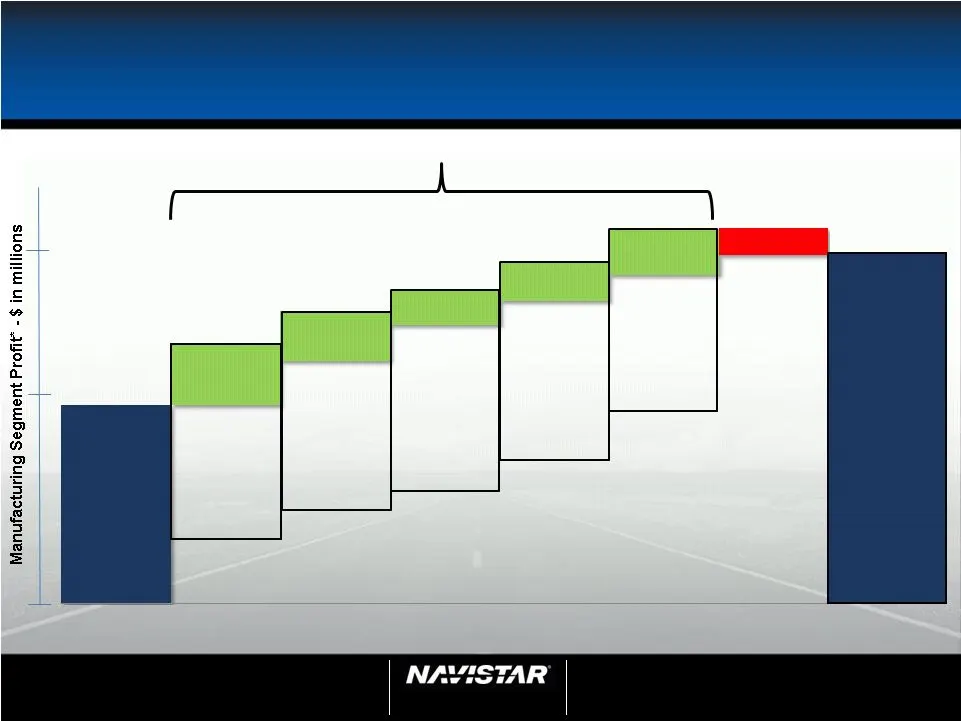
NYSE: NAV 90 Analyst Day February 1, 2012 90 Elements of Strategic Success Mfg. Segment Profit* Mfg. Segment Profit* Note: This slide contains non-GAAP information; please see the Reg G disclosure in the appendix for a detailed reconciliation. $1,200M Potential $882M $1,800M At 350k *As adjusted Mar
Slide 91: Competitive Cost Structure
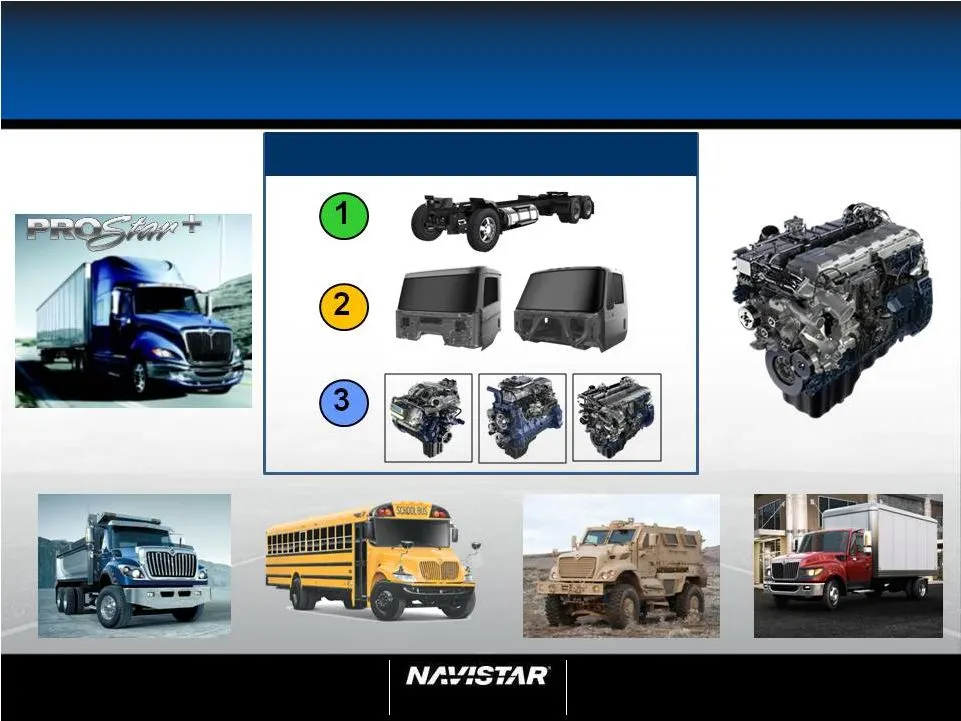
NYSE: NAV 91 Analyst Day February 1, 2012 91 Competitive Cost Structure Leveraging Assets/Controlling Destiny Scale 1-2-3
Slide 92: Return on Invested Capital (ROIC)
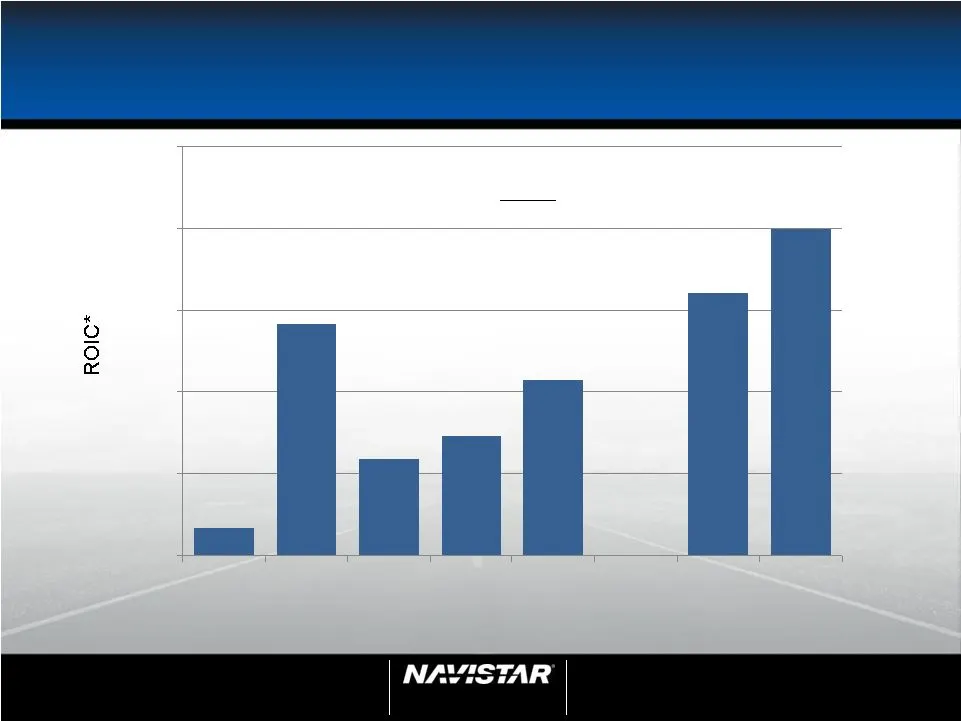
NYSE: NAV Analyst Day February 1, 2012 * Note: This slide contains non-GAAP information; please see the Reg G disclosure in the appendix for a detailed ROIC calculation and reconciliation. Return on Invested Capital (ROIC) ** Excluding ~$200 million in legacy pension and OPEB expenses. 92 ROIC* = NO
Slide 93: Capital Allocation Priorities
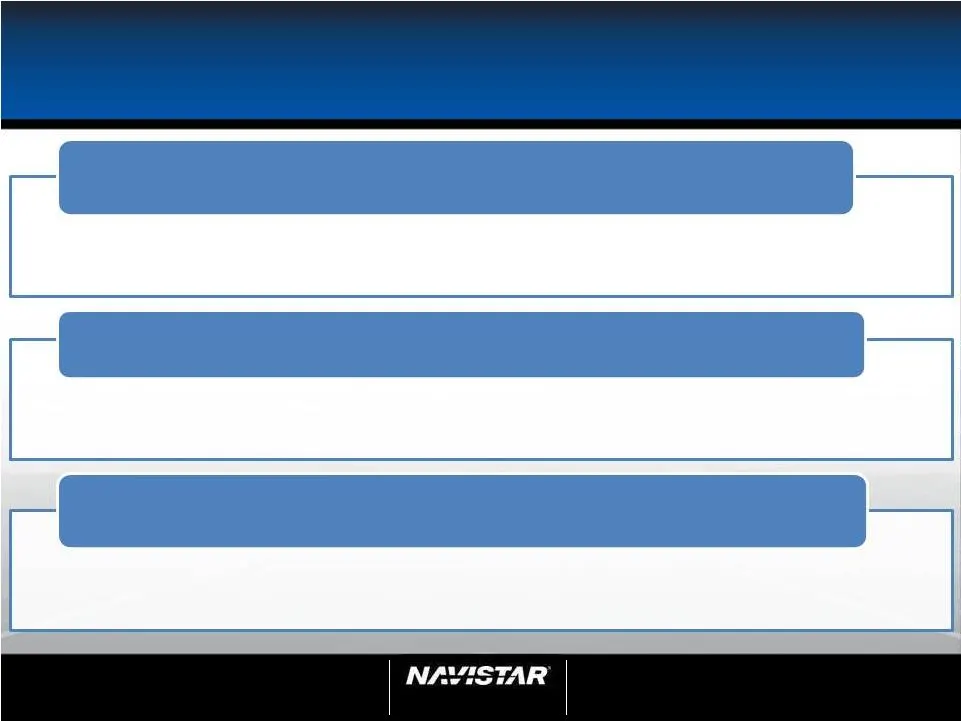
NYSE: NAV 93 Analyst Day February 1, 2012 93 Capital Allocation Priorities Value is best created by executing the strategy Ensure adequate liquidity Optimize the capital structure to drive value for shareholders • Improving the return on invested capital – expand core business margins • Expanding cu
Slide 94: 2011 & 2012 Key Items
NYSE: NAV 94 Analyst Day February 1, 2012 2011 & 2012 Key Items Note: This slide contains non-GAAP information; please see the Reg G disclosure in the appendix for a detailed reconciliation. * Excludes restructuring-related charges of $57 million. 2011 Business Drivers 2012 Business Drivers • Indust
Slide 95: 2012 Guidance – $5.00 - $5.75 EPS
NYSE: NAV Analyst Day February 1, 2012 2012 Guidance – $5.00 - $5.75 EPS Note: This slide contains non-GAAP information; please see the Reg G disclosure in the appendix for a detailed reconciliation. 95 2012 Guidance (adjusted non-GAAP) $15.0 - $16.0 $1,000 - $1,150 $350 - $400 ~ 70 $5.00 - $5.75 $2
Slide 96: Profitability Factors
NYSE: NAV Analyst Day February 1, 2012 Profitability Factors Note: This slide contains non-GAAP information; please see the Reg G disclosure in the appendix for a detailed reconciliation. 96 Q1 Full Year 2011 Adj. Net Income (Millions) $12 $402 2011 Adj. Diluted EPS $0.16 $5.28 Truck - N.A. volume /
Slide 97: Manufacturing Cash Flow
NYSE: NAV 97 Analyst Day February 1, 2012 97 Manufacturing Cash Flow Note: This slide contains non-GAAP information; please see the Reg G disclosure in the appendix for a detailed reconciliation. Free Cash Flow $375M ~$1,200 ~$1,200 $950 $300 $275 $210 $75 $90 $0 $500 $1,000 $1,500 $2,000 2011 Mfg C
Slide 98: Continued Success in 2012
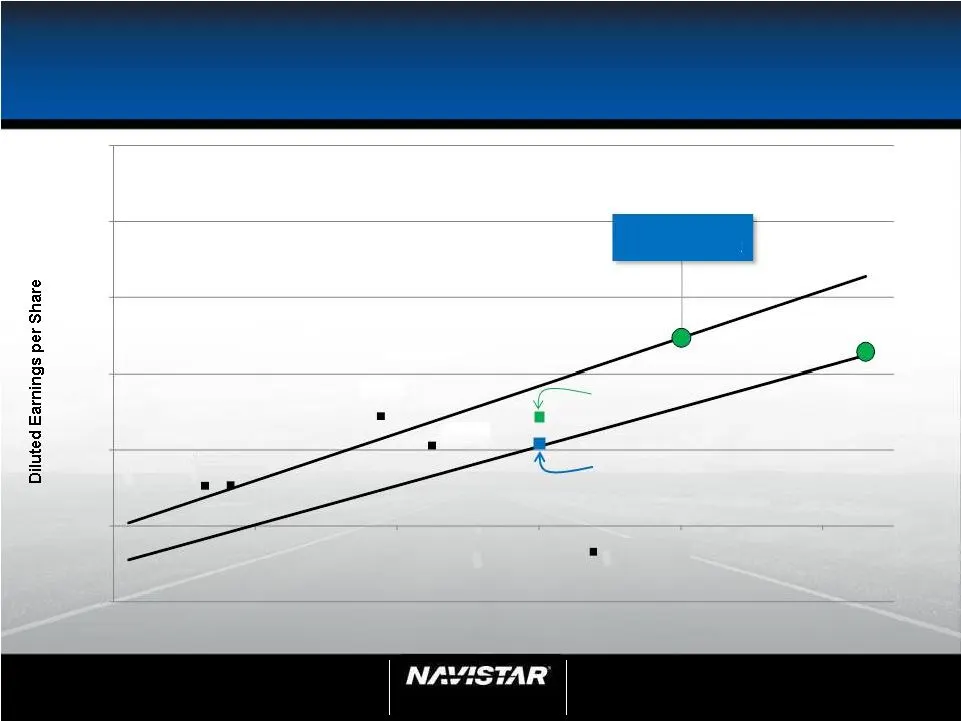
NYSE: NAV 98 Analyst Day February 1, 2012 98 Continued Success in 2012 Note: This slide contains non-GAAP information; please see the Reg G disclosure in the appendix for a detailed reconciliation. 2007, 2008, 2009 and 2011 excluded certain charges. 2012 FY Guidance and Pro-Forma does not include en
Slide 99: Manufacturing Segment Profit
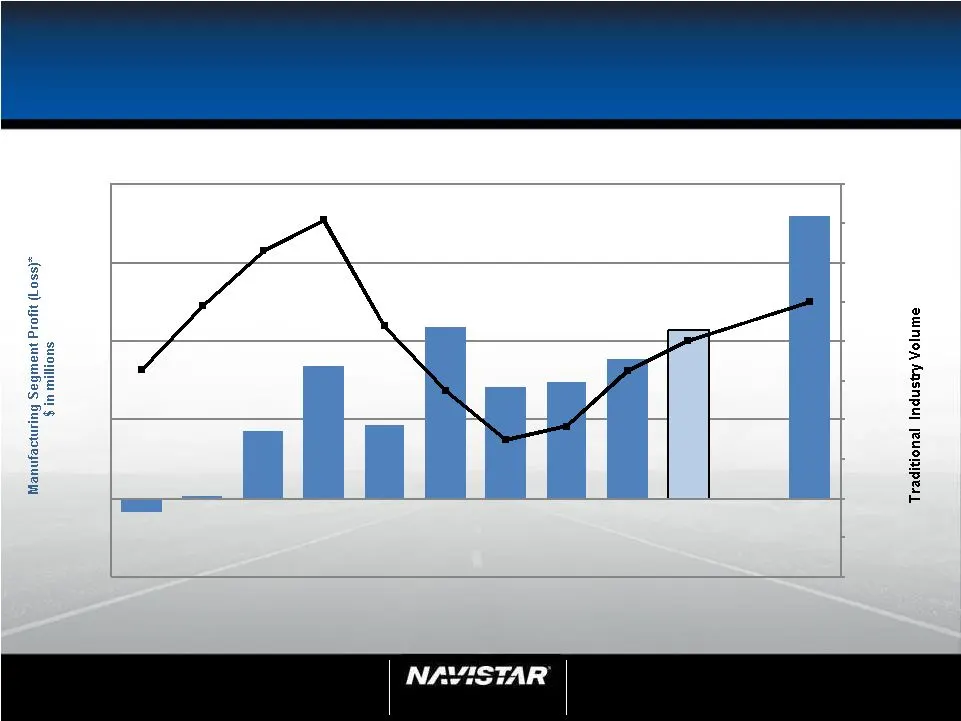
NYSE: NAV 99 Analyst Day February 1, 2012 99 Manufacturing Segment Profit* Note: This slide contains non-GAAP information; please see the Reg G disclosure in the appendix for a detailed reconciliation. * As Adjusted ($93) $11 $421 $838 $462 $1,088 $707 $741 $882 $1,075 $1,800 - 50,000 100,000 150,00
Slide 100: Positioned Well for the Future FY 2012
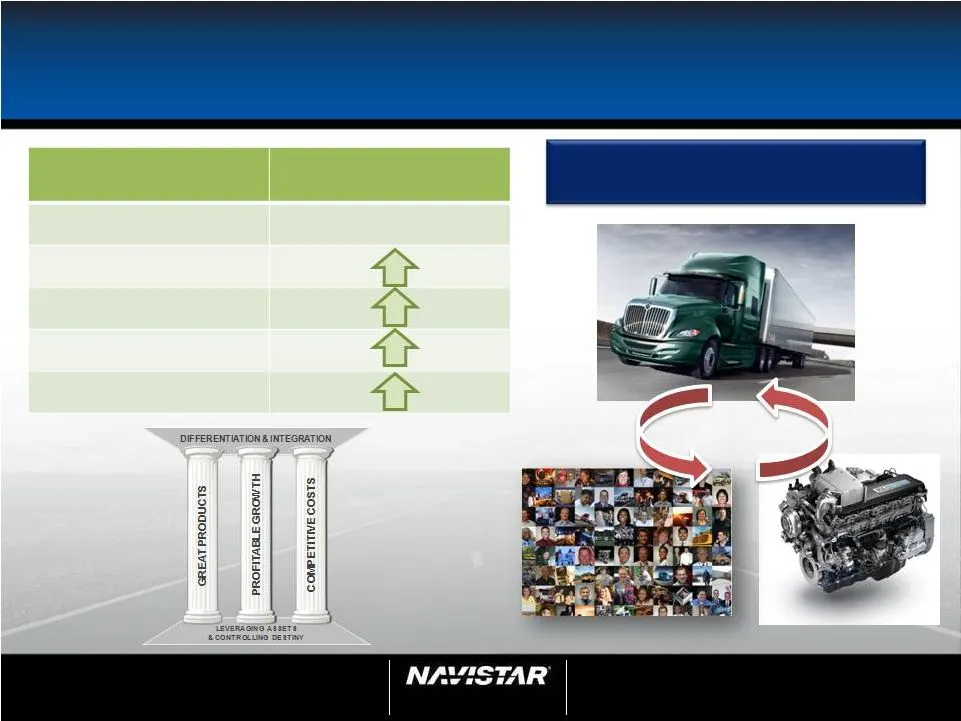
NYSE: NAV 100 Analyst Day February 1, 2012 100 Positioned Well for the Future FY 2012 Building the foundation for our future through integration Military N. A. Truck Engines Parts Global ~$1.5B Integration Integration

Slide 101: Q&A
NYSE: NAV 101 Analyst Day February 1, 2012 101 Q&A

Slide 102: Appendix
NYSE: NAV 102 Analyst Day February 1, 2012 102 Appendix
Slide 103: SEC Regulation G Non-GAAP Reconciliation
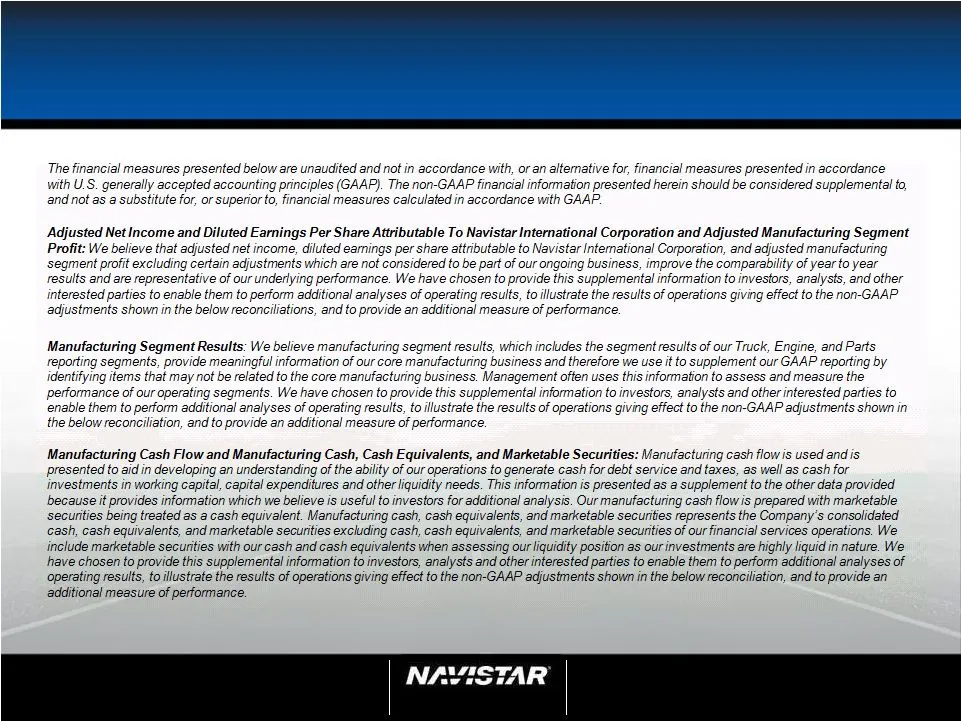
NYSE: NAV 103 Analyst Day February 1, 2012 103 SEC Regulation G Non-GAAP Reconciliation
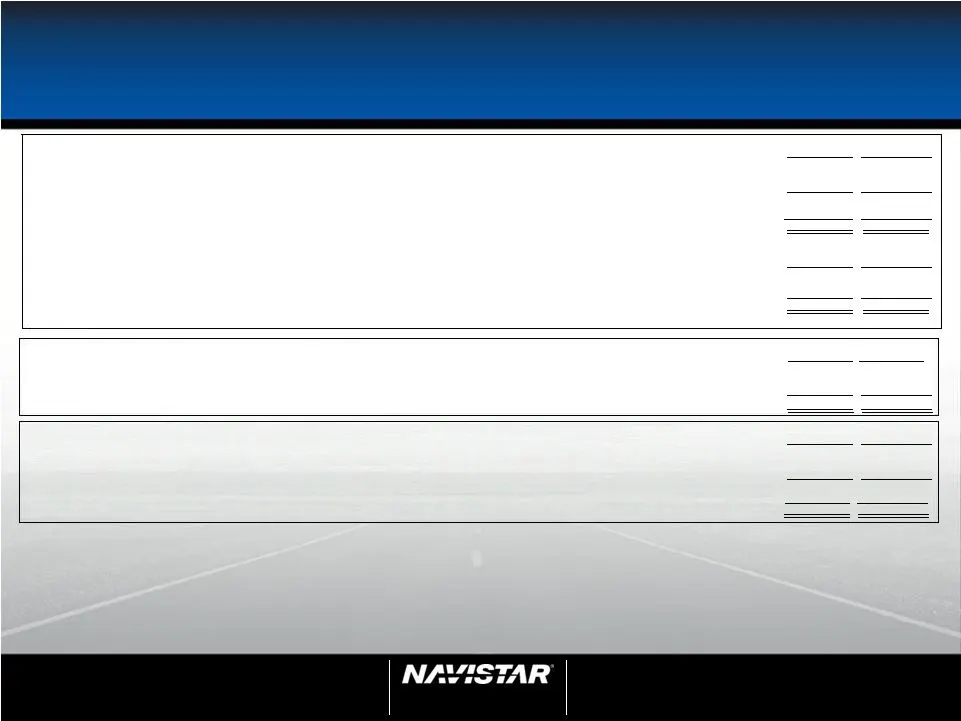
Slide 104: SEC Regulation G – 2012 Guidance & 2012 Pro Forma
NYSE: NAV 104 Analyst Day February 1, 2012 SEC Regulation G – 2012 Guidance & 2012 Pro Forma (A) Engineering integration costs relate to the consolidation of our truck and engine engineering operations as well as the move of our world headquarters, as we continue to develop plans for efficient trans
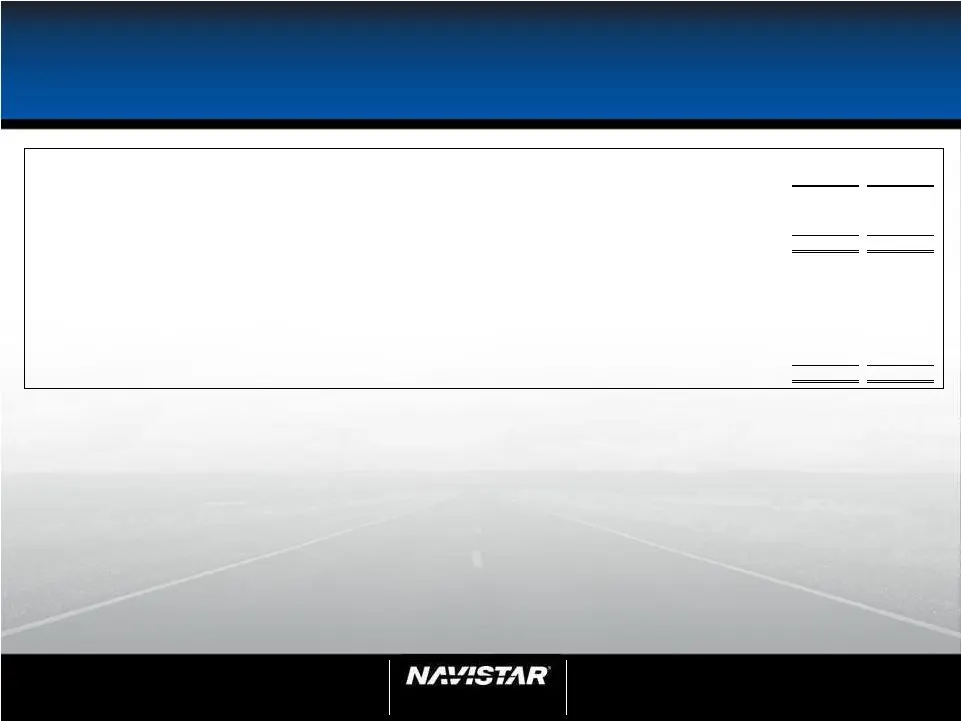
Slide 105: SEC Regulation G – Diluted EPS & Manufacturing Segment Profit vs. Traditional Industry
NYSE: NAV 105 Analyst Day February 1, 2012 105 SEC Regulation G – Diluted EPS & Manufacturing Segment Profit vs. Traditional Industry Original Target Revised Target U.S. & Canada Industry 414,500 350,000 Sales and revenues, net $15 + $20 + Diluted earnings per share attributable to Navistar Internat
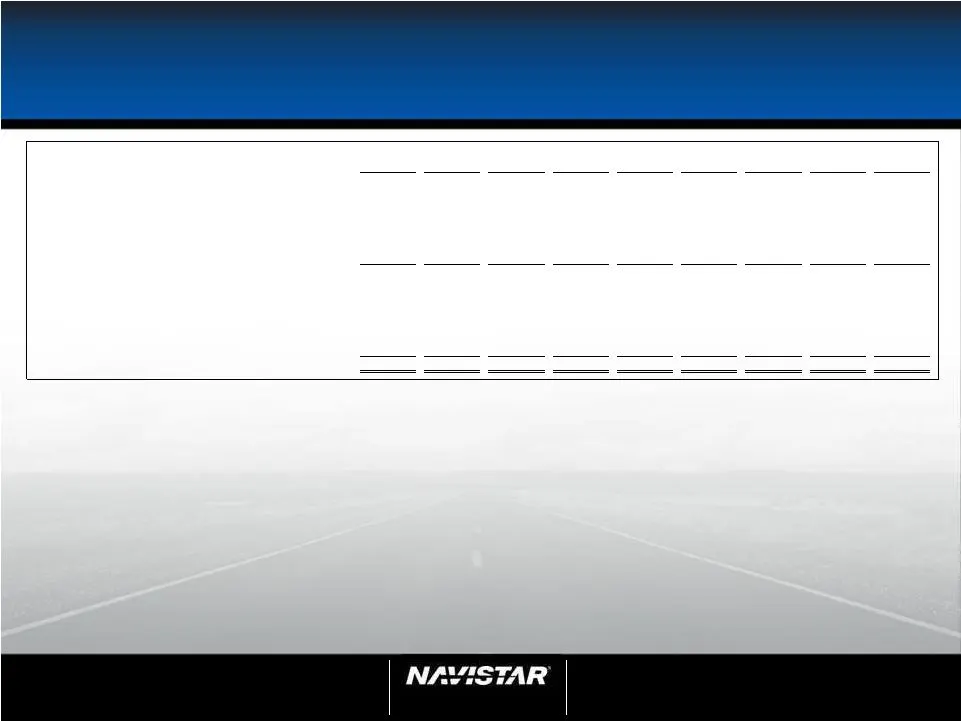
Slide 106: SEC Regulation G – Adjusted Manufacturing Segment Profit – 2003-2011
NYSE: NAV 106 Analyst Day February 1, 2012 106 SEC Regulation G – Adjusted Manufacturing Segment Profit – 2003-2011 (A) Ford settlement, restructuring and related charges (benefits) include the impact of our settlement with Ford in 2009 as well as charges and benefits recognized related to restructu
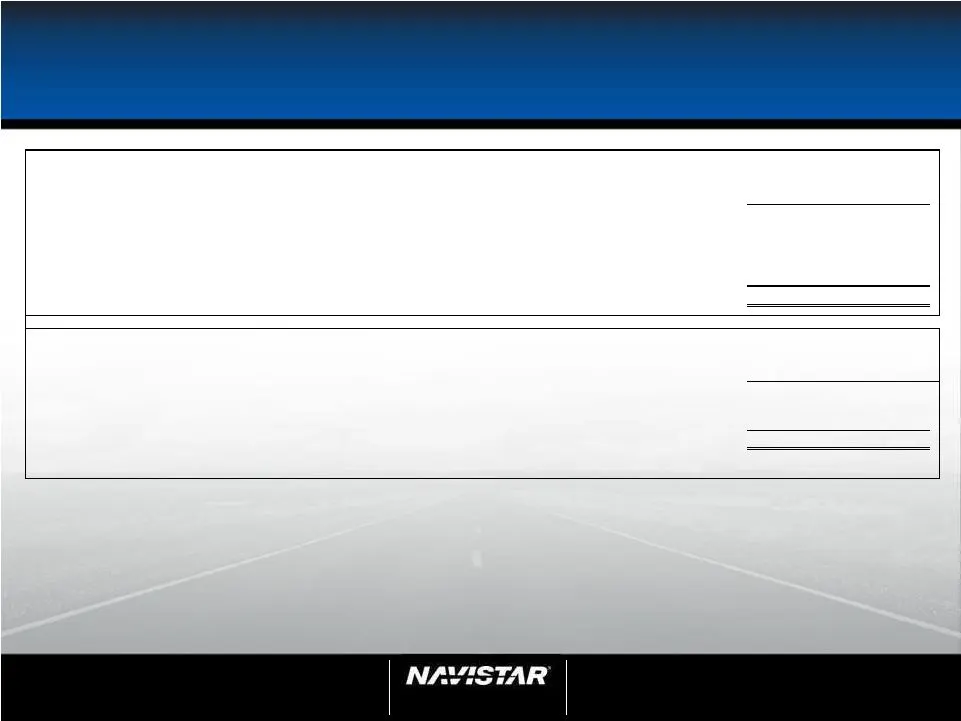
Slide 107: SEC Regulation G – Adjusted Diluted Earnings Per Share – Q1-2011
NYSE: NAV 107 Analyst Day February 1, 2012 107 SEC Regulation G – Adjusted Diluted Earnings Per Share – Q1-2011 (A) Engineering integration costs relate to the consolidation of our truck and engine engineering operations as well as the move of our world headquarters. For the Three Months Ended Janua
Slide 108: SEC Regulation G – Adjusted Diluted Earnings Per Share – 2007-2011
NYSE: NAV 108 Analyst Day February 1, 2012 SEC Regulation G – Adjusted Diluted Earnings Per Share – 2007-2011 See slide 110 for explanation of adjustments. 2011 2010 2009 2008 2007 (in millions) Net income (loss) attributable to Navistar International Corporation $ 1,723 $ 223 $ 320 $ 134 $ (120) Pl
Slide 109: SEC Regulation G – Return on Invested Capital
NYSE: NAV 109 Analyst Day February 1, 2012 109 SEC Regulation G – Return on Invested Capital See slide 110 for explanation of adjustments. * Return on Invested Capital equals NOPAT divided by invested capital (PIC plus debt). ROIC is based on AVERAGE invested capital for each year, where the average

Slide 110: SEC Regulation G – Adjusted Manufacturing Segment Profit & ROIC (Continued)
NYSE: NAV 110 Analyst Day February 1, 2012 110 SEC Regulation G – Adjusted Manufacturing Segment Profit (2003-2011) & ROIC – (Continued) (A) Ford settlement, restructuring and related charges (benefits) include the impact of our settlement with Ford in 2009 as well as charges and benefits recognized
Slide 111: SEC Regulation G – Adjusted Net Income – 2011
NYSE: NAV 111 Analyst Day February 1, 2012 111 SEC Regulation G – Adjusted Net Income – 2011 (A) In the third quarter of 2011, we recognized an income tax benefit of $1.476 billion from the release of a portion of our income tax valuation allowance. In the fourth quarter of 2011, we recognized an ad
Slide 112: SEC Regulation G – Manufacturing Cash
NYSE: NAV 112 Analyst Day February 1, 2012 112 SEC Regulation G – Manufacturing Cash October 31, 2011 (in millions) Manufacturing segment cash and cash equivalents $ Financial services segment cash and cash equivalents Consolidated cash and cash equivalents $ Manufacturing marketable securities $ Fi
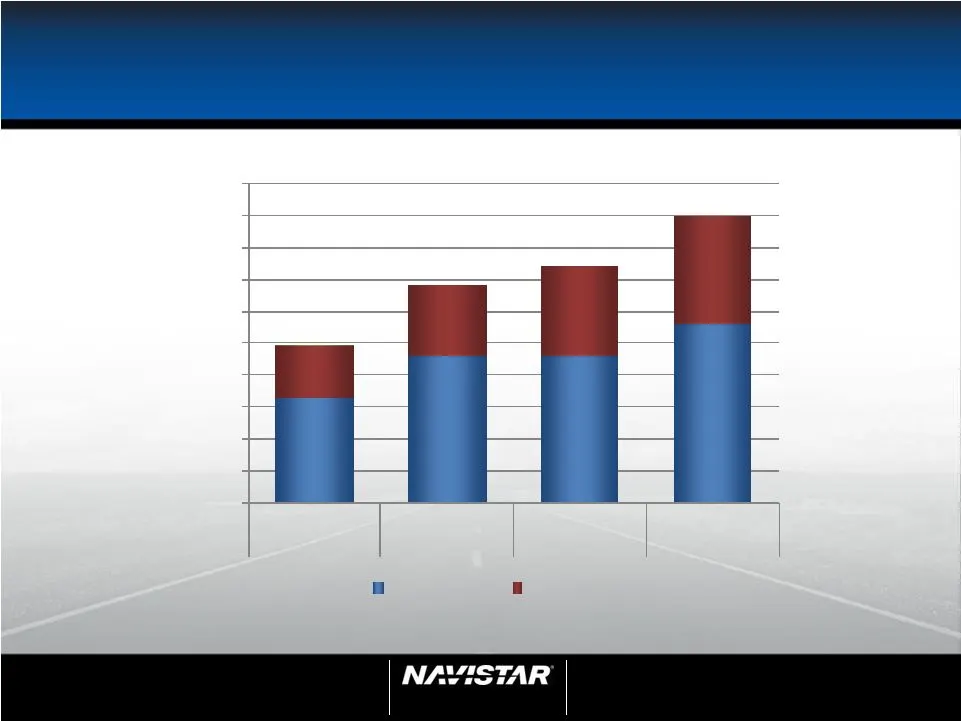
Slide 113: FY 2012 Forecast - Truck Chargeouts
NYSE: NAV Analyst Day February 1, 2012 FY 2012 Forecast - Truck Chargeouts Note: Charegouts for FY 2012 exclude RV towable units. 113 5,000 10,000 15,000 20,000 25,000 30,000 35,000 40,000 45,000 50,000 2012 Forecast 2012 Forecast 2012 Forecast 2012 Forecast Q1 Q2 Q3 Q4 Traditional Expansionary

Slide 114: Frequently Asked Questions
NYSE: NAV 114 Analyst Day February 1, 2012 114 Frequently Asked Questions Q1: How many Dealcor dealers did you have as of October 31, 2011? A: Of our 287 primary NAFTA dealers, we have ownership interest in 7 DealCor dealers as of December 31, 2011. Q2: How do you fund your wholesale business? A: We
Slide 115: Frequently Asked Questions
NYSE: NAV 115 Analyst Day February 1, 2012 115 Frequently Asked Questions Q7: What is the current Joint Light Tactical Vehicle (JLTV) program status? A: A revised final request for proposals for the Engineering, Manufacturing and Development (EMD) phase was issued on January 26, 2012. Q8: What are y

Slide 116: Frequently Asked Questions
NYSE: NAV 116 Analyst Day February 1, 2012 116 Frequently Asked Questions Q11: Why did the Company release a significant portion of its domestic deferred tax valuation allowance? A: Q12: A: Beginning in 2012, we would estimate future effective tax rates to fall in the upper 20% to low 30% range. Q13

Slide 117: Frequently Asked Questions
NYSE: NAV 117 Analyst Day February 1, 2012 117 Frequently Asked Questions Q16: How will $2.3 billion of deferred tax assets be used to offset future taxable income? A: Simply put, deferred tax assets represent the value of future tax deductions attributable to items that have already been expensed o

Slide 118: Frequently Asked Questions
NYSE: NAV 118 Analyst Day February 1, 2012 118 Frequently Asked Questions Q21: What causes the variance between manufacturing cash interest payments and GAAP interest expense? A: Q22: What are the $225 million of Recovery Zone Facility Bonds (RZFBs) Series 2010 due October 15, 2040 being used for? A
Source: SEC EDGAR · 8-K filed Feb 1, 2012
More decks from Navistar International Corporation
 Q2 2021 Earnings Presentation20 slides · Jun 8, 2021
 Q1 2021 Earnings Presentation20 slides · Mar 9, 2021
 Q4 2020 Earnings Presentation22 slides · Dec 17, 2020
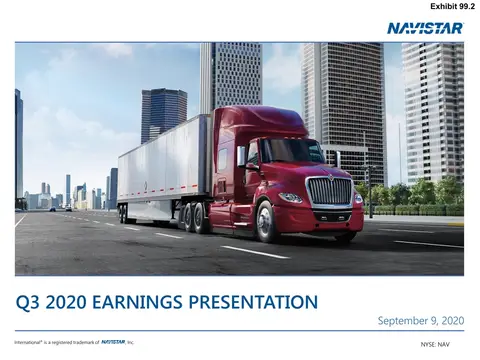 Q3 2020 Earnings Presentation21 slides · Sep 9, 2020
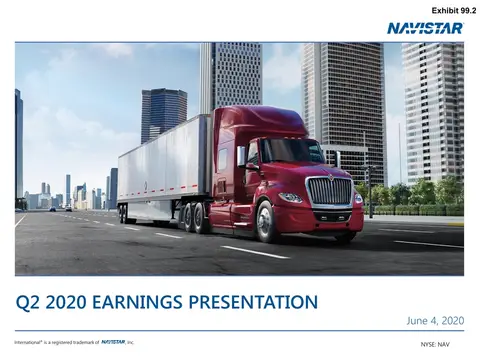 Q2 2020 Earnings Presentation21 slides · Jun 4, 2020
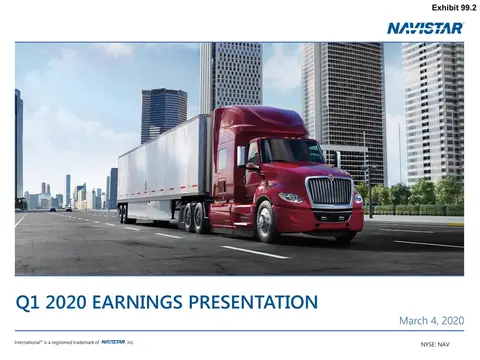 Q1 2020 Earnings Presentation21 slides · Mar 4, 2020