Pepco — 2011 Wells Fargo MLP, E&P, Services & Utility Symposium
31 slides from Pepco's conference presentation, Dec 6, 2011
Slide 1: 2011 Wells Fargo MLP, E&P, Services & Utility Symposium
NEW YORK, NY• DECEMBER 7, 2011 2011 Wells Fargo MLP, E&P, Services & Utility Symposium
Slide 2: Safe Harbor Statement/Regulation G Information
Safe Harbor Statement/Regulation G Information Some of the statements contained in today’s presentation with respect to Pepco Holdings, Pepco, Delmarva Power and Atlantic City Electric, and each of their respective subsidiaries, are forward-looking statements within the meaning of the U.S. federal s
Slide 3: PHI's Strategic Focus
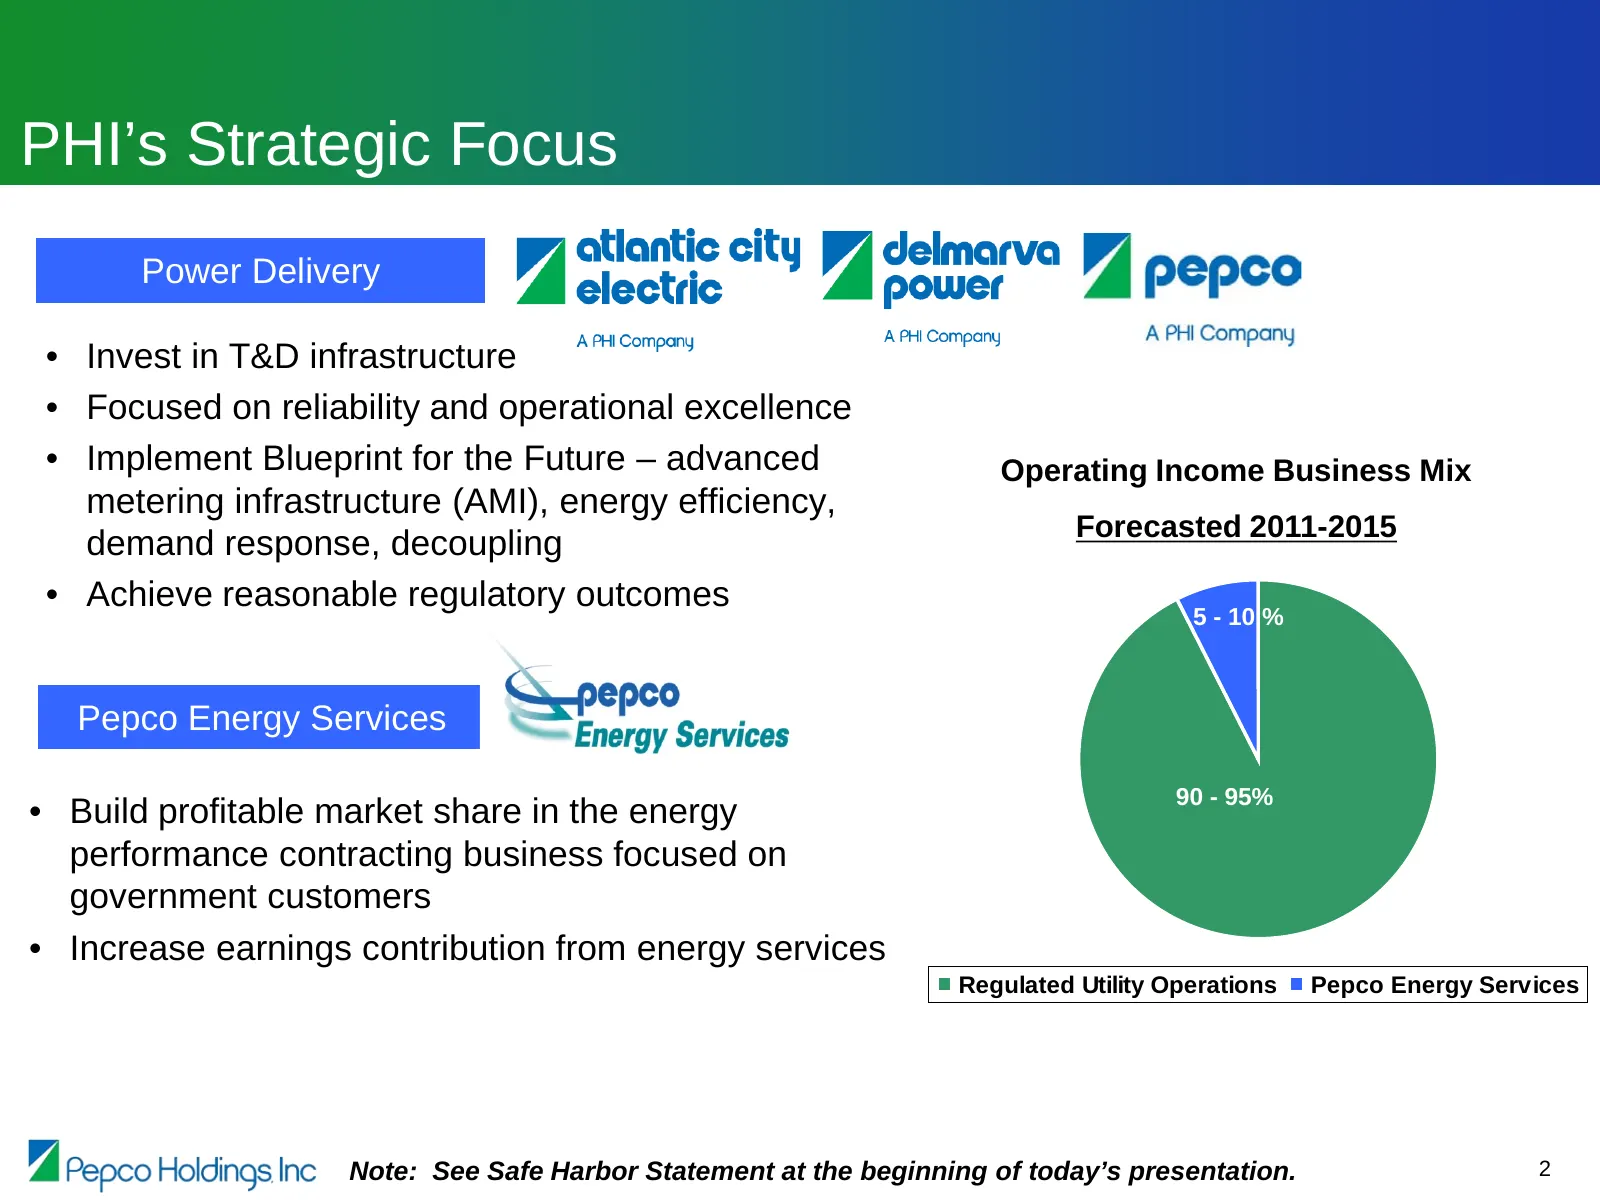
PHI’s Strategic Focus Power Delivery • Invest in T&D infrastructure • Focused on reliability and operational excellence • Implement Blueprint for the Future – advanced Operating Income Business Mix metering infrastructure (AMI), energy efficiency, Forecasted 2011-2015 demand response, decoupling • A
Slide 4: Reliability Enhancement Plan – Improving System Reliability is a Top Priority
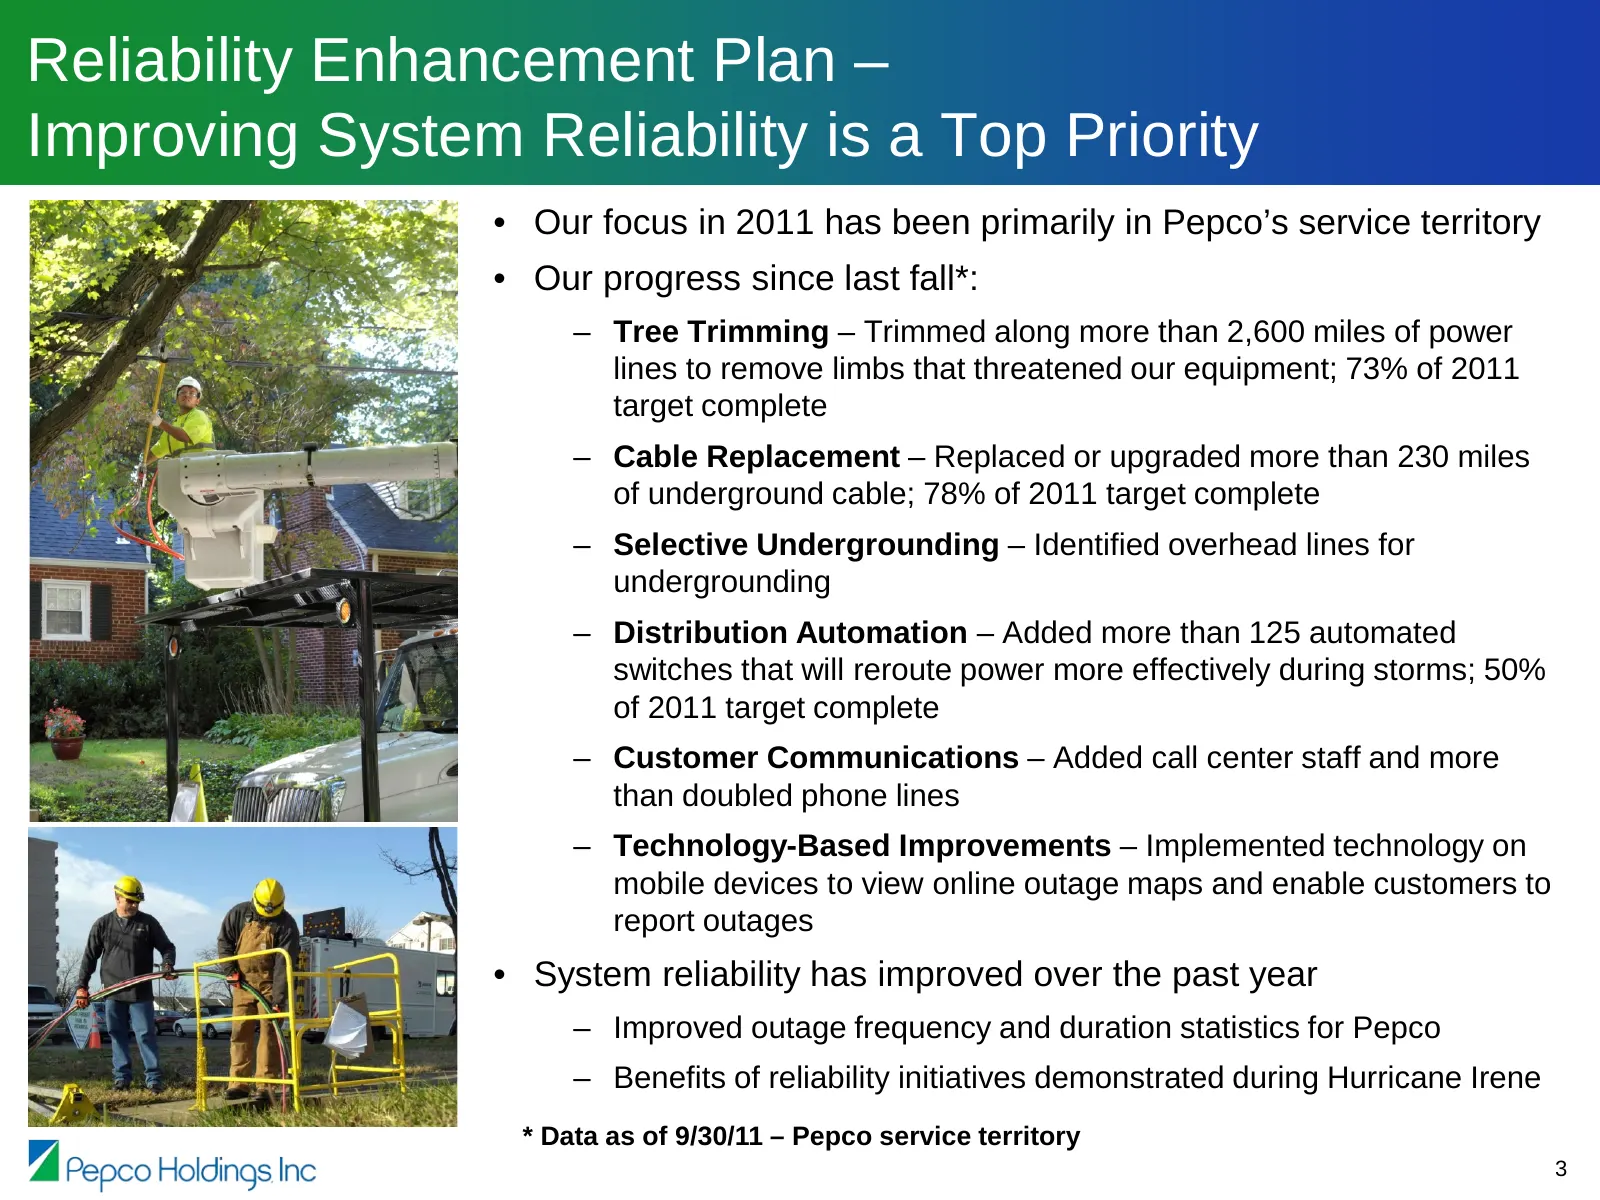
Reliability Enhancement Plan – Improving System Reliability is a Top Priority • Our focus in 2011 has been primarily in Pepco’s service territory • Our progress since last fall*: – Tree Trimming – Trimmed along more than 2,600 miles of power lines to remove limbs that threatened our equipment; 73% o
Slide 5: Hurricane Irene – Storm Response
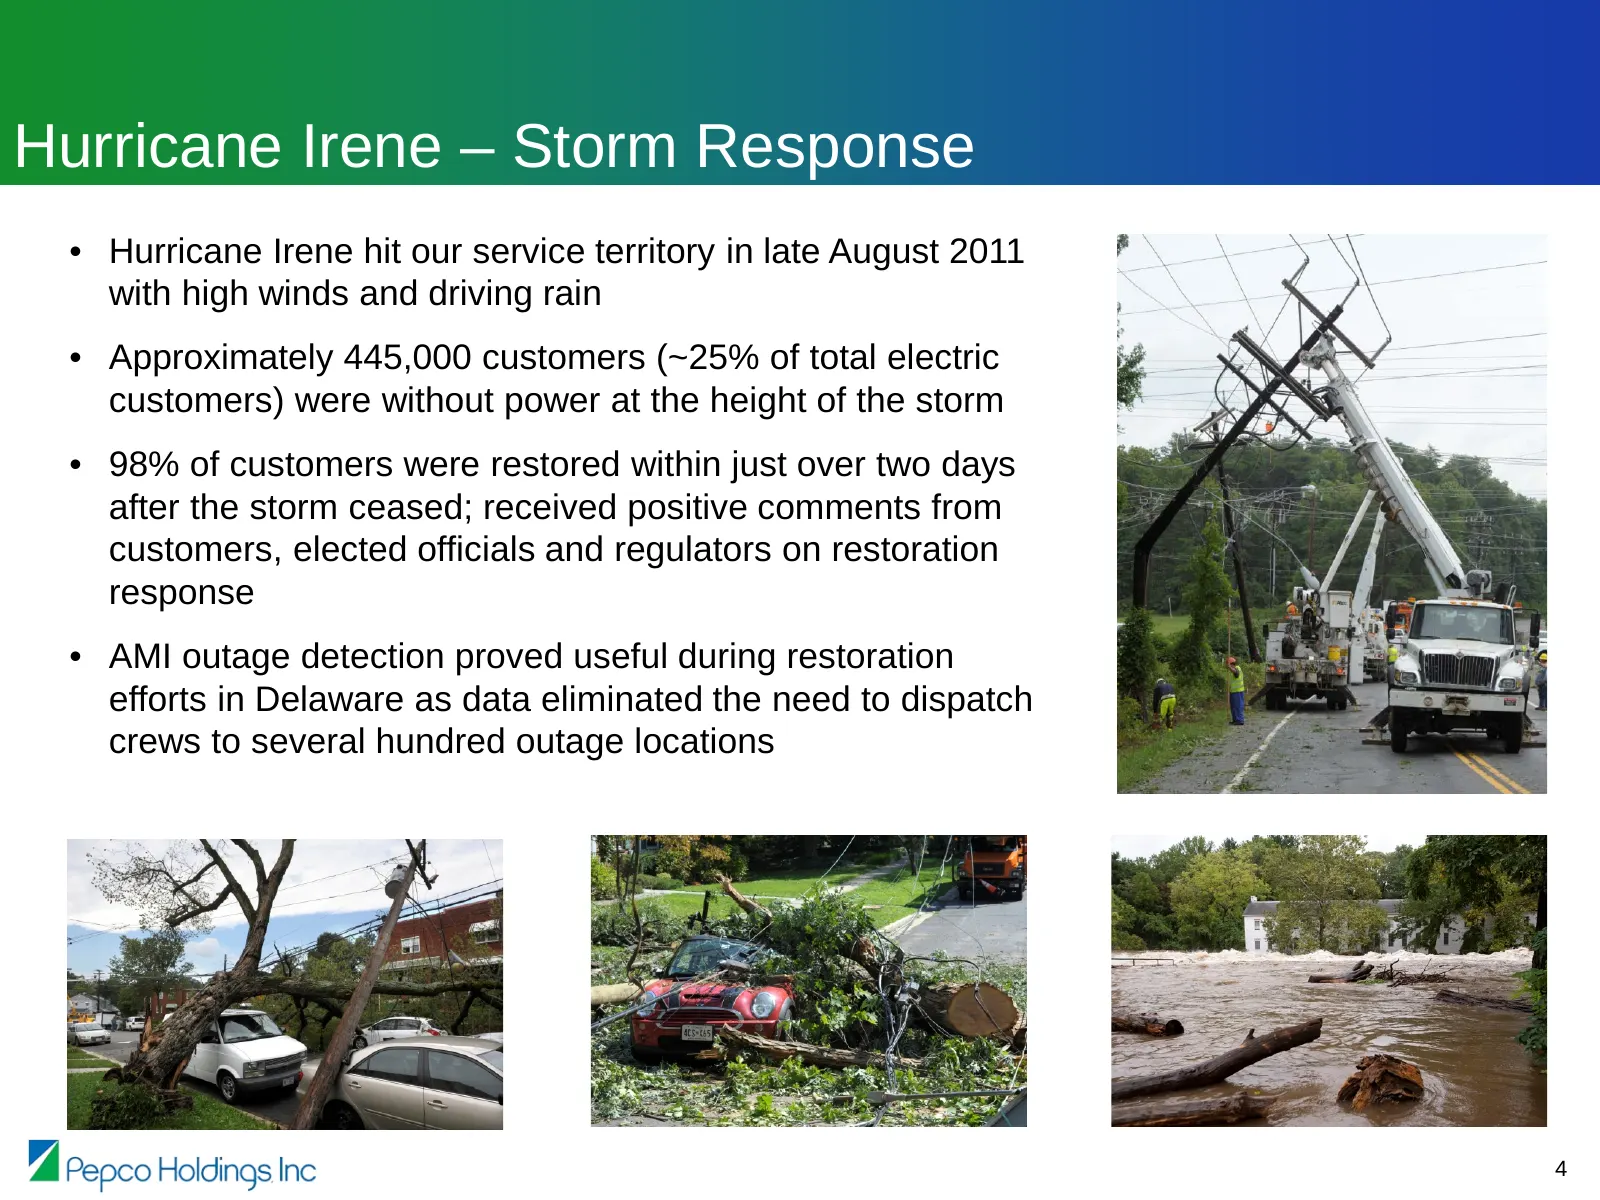
Hurricane Irene – Storm Response • Hurricane Irene hit our service territory in late August 2011 with high winds and driving rain • Approximately 445,000 customers (~25% of total electric customers) were without power at the height of the storm • 98% of customers were restored within just over two d
Slide 6: Hurricane Irene – Estimated Incremental Cost
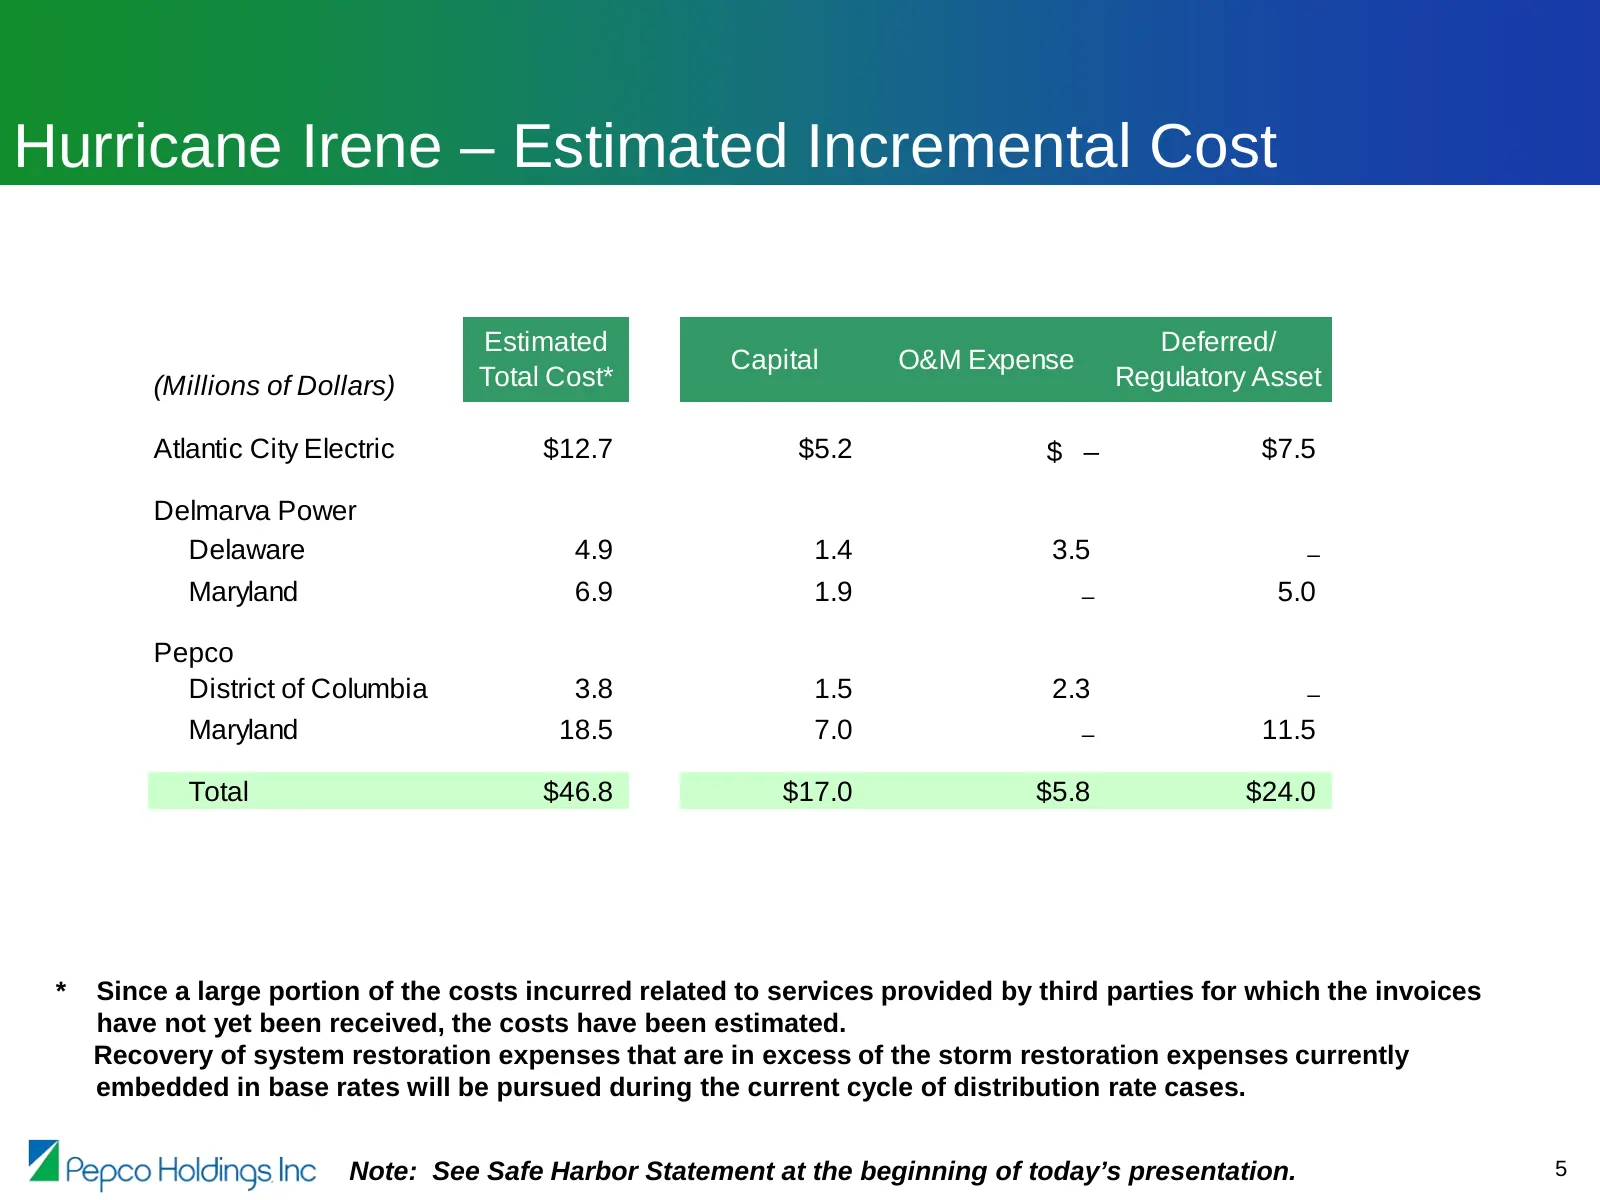
Hurricane Irene – Estimated Incremental Cost Estimated Deferred/ Capital O&M Expense (Millions of Dollars) Total Cost* Regulatory Asset Atlantic City Electric $12.7 $5.2 $ – $7.5 Delmarva Power Delaware 4.9 1.4 3.5 – Maryland 6.9 1.9 – 5.0 Pepco District of Columbia 3.8 1.5 2.3 – Maryland 18.5 7.0 –
Slide 7: Pepco – Maryland Reliability Case 9240
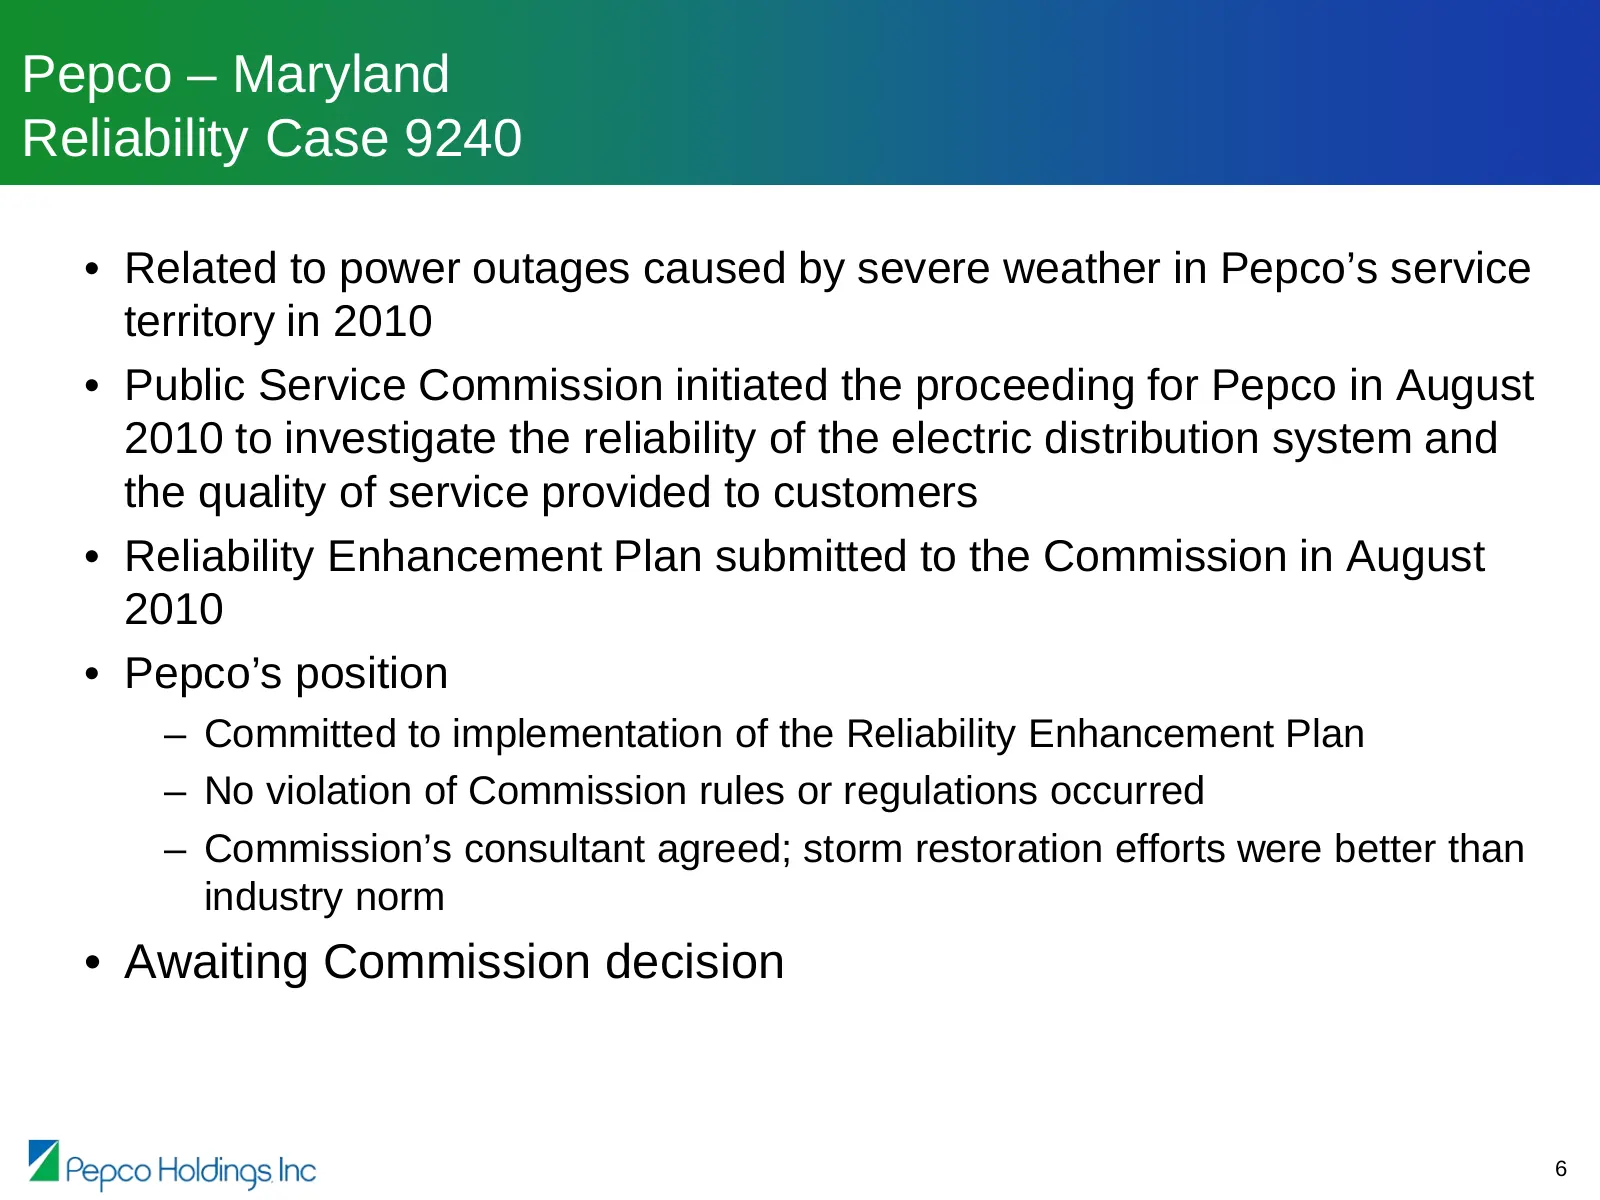
Pepco – Maryland Reliability Case 9240 • Related to power outages caused by severe weather in Pepco’s service territory in 2010 • Public Service Commission initiated the proceeding for Pepco in August 2010 to investigate the reliability of the electric distribution system and the quality of service
Slide 8: Power Delivery - O&M
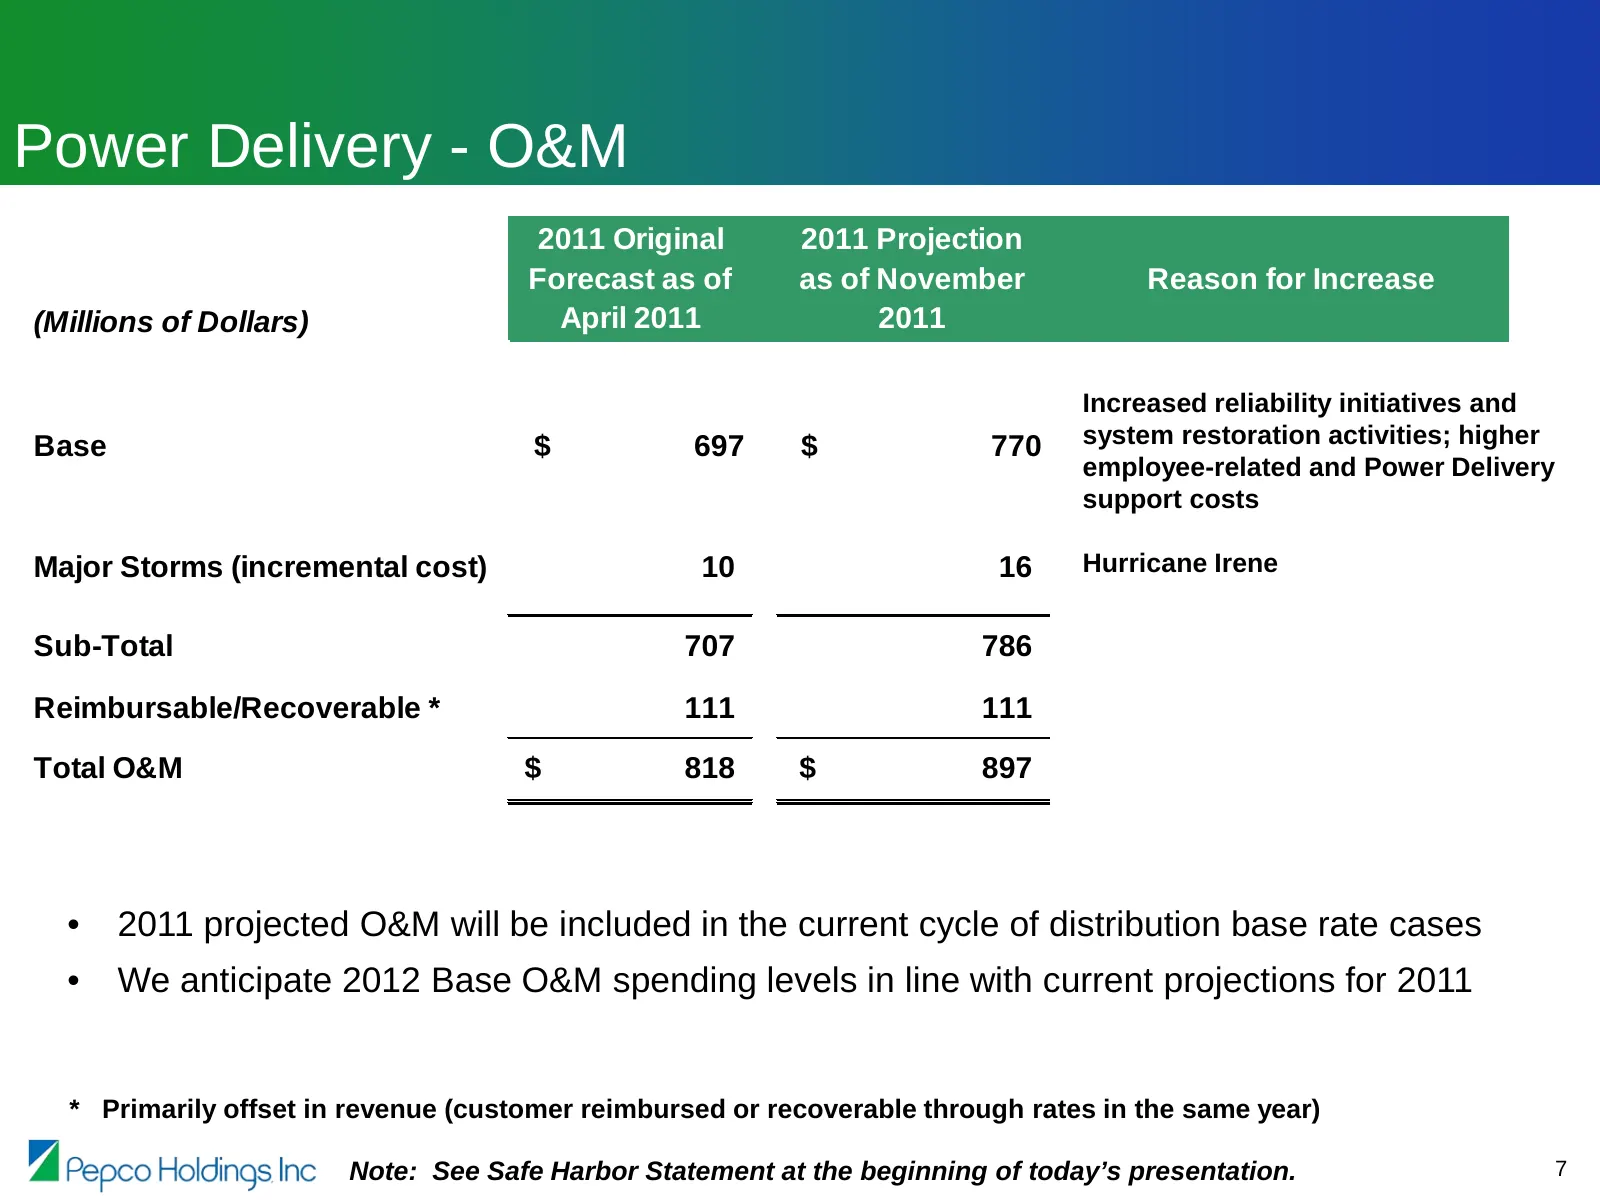
Power Delivery - O&M 2011 Original 2011 Projection Forecast as of as of November Reason for Increase (Millions of Dollars) April 2011 2011 Increased reliability initiatives and Base $ 697 $ 770 system restoration activities; higher employee-related and Power Delivery support costs Major Storms (incr
Slide 9: Advanced Metering Infrastructure – Status by Jurisdiction
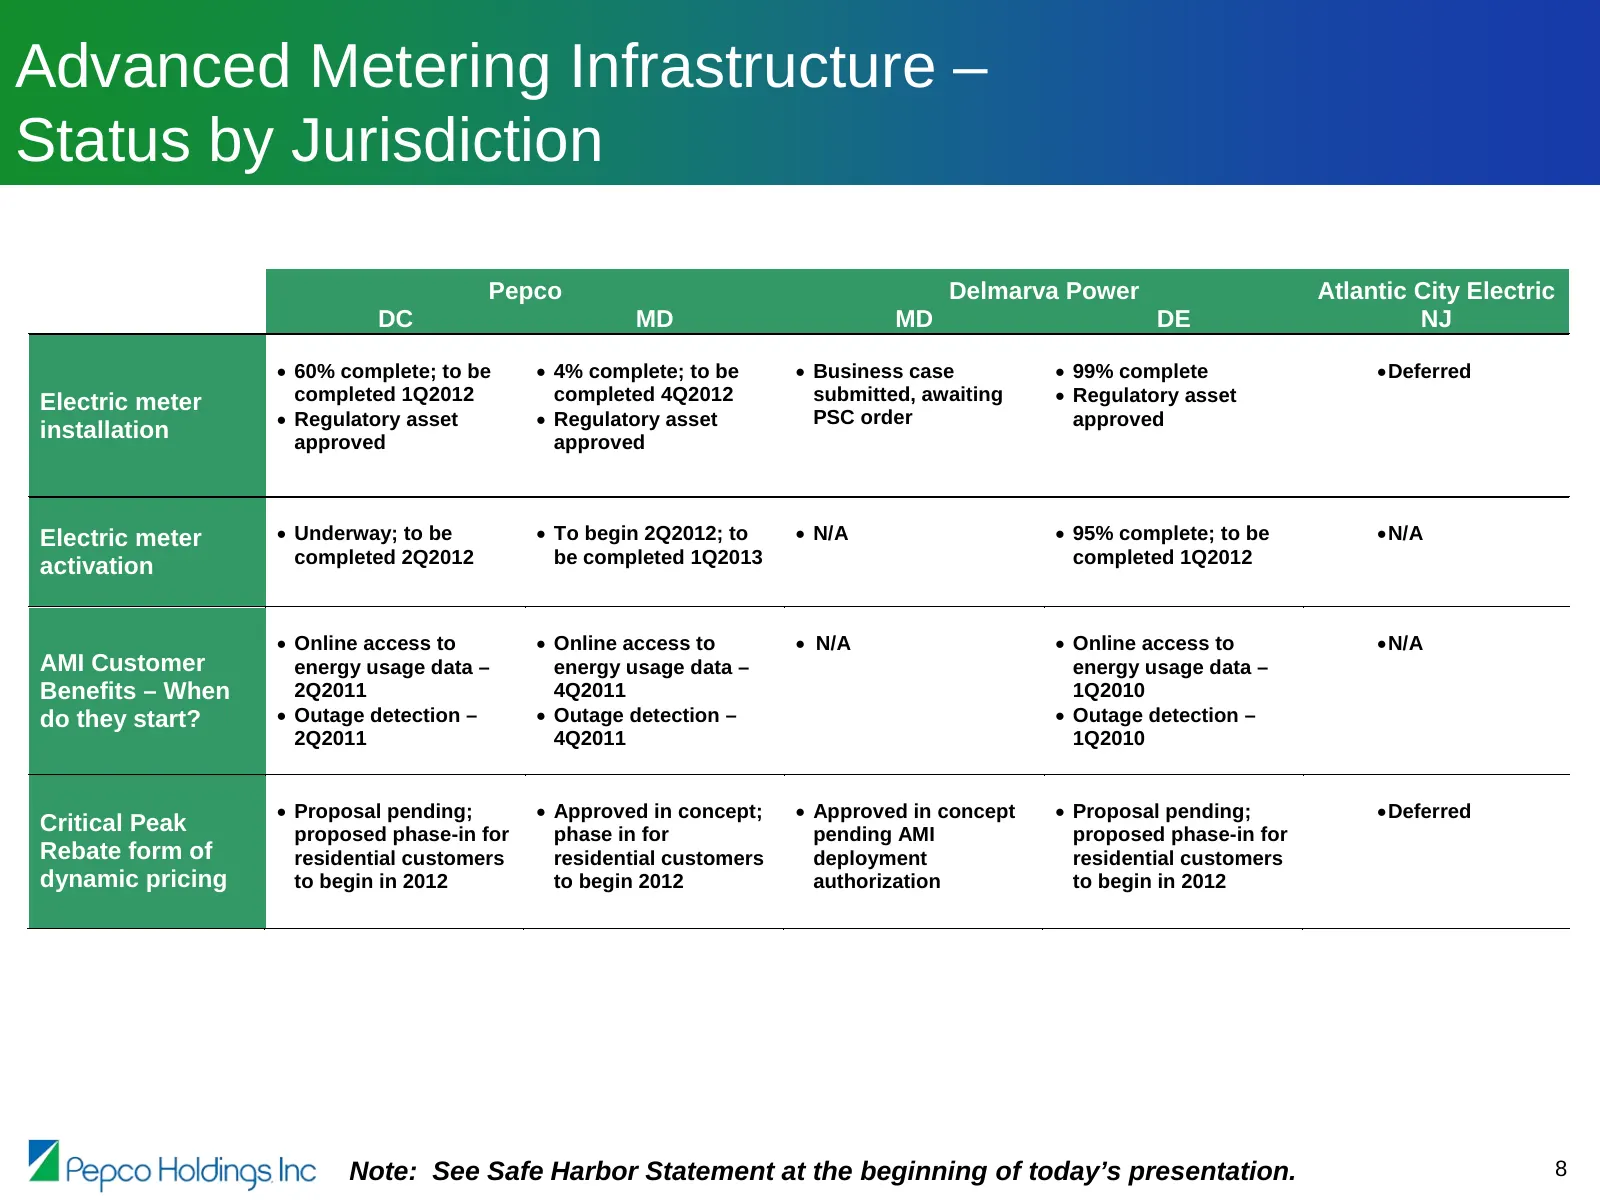
Advanced Metering Infrastructure – Status by Jurisdiction Pepco Delmarva Power Atlantic City Electric DC MD MD DE NJ • 60% complete; to be • 4% complete; to be • Business case • 99% complete • Deferred Electric meter completed 1Q2012 completed 4Q2012 submitted, awaiting • Regulatory asset • Regulato
Slide 10: Mid-Atlantic Power Pathway – Project Update
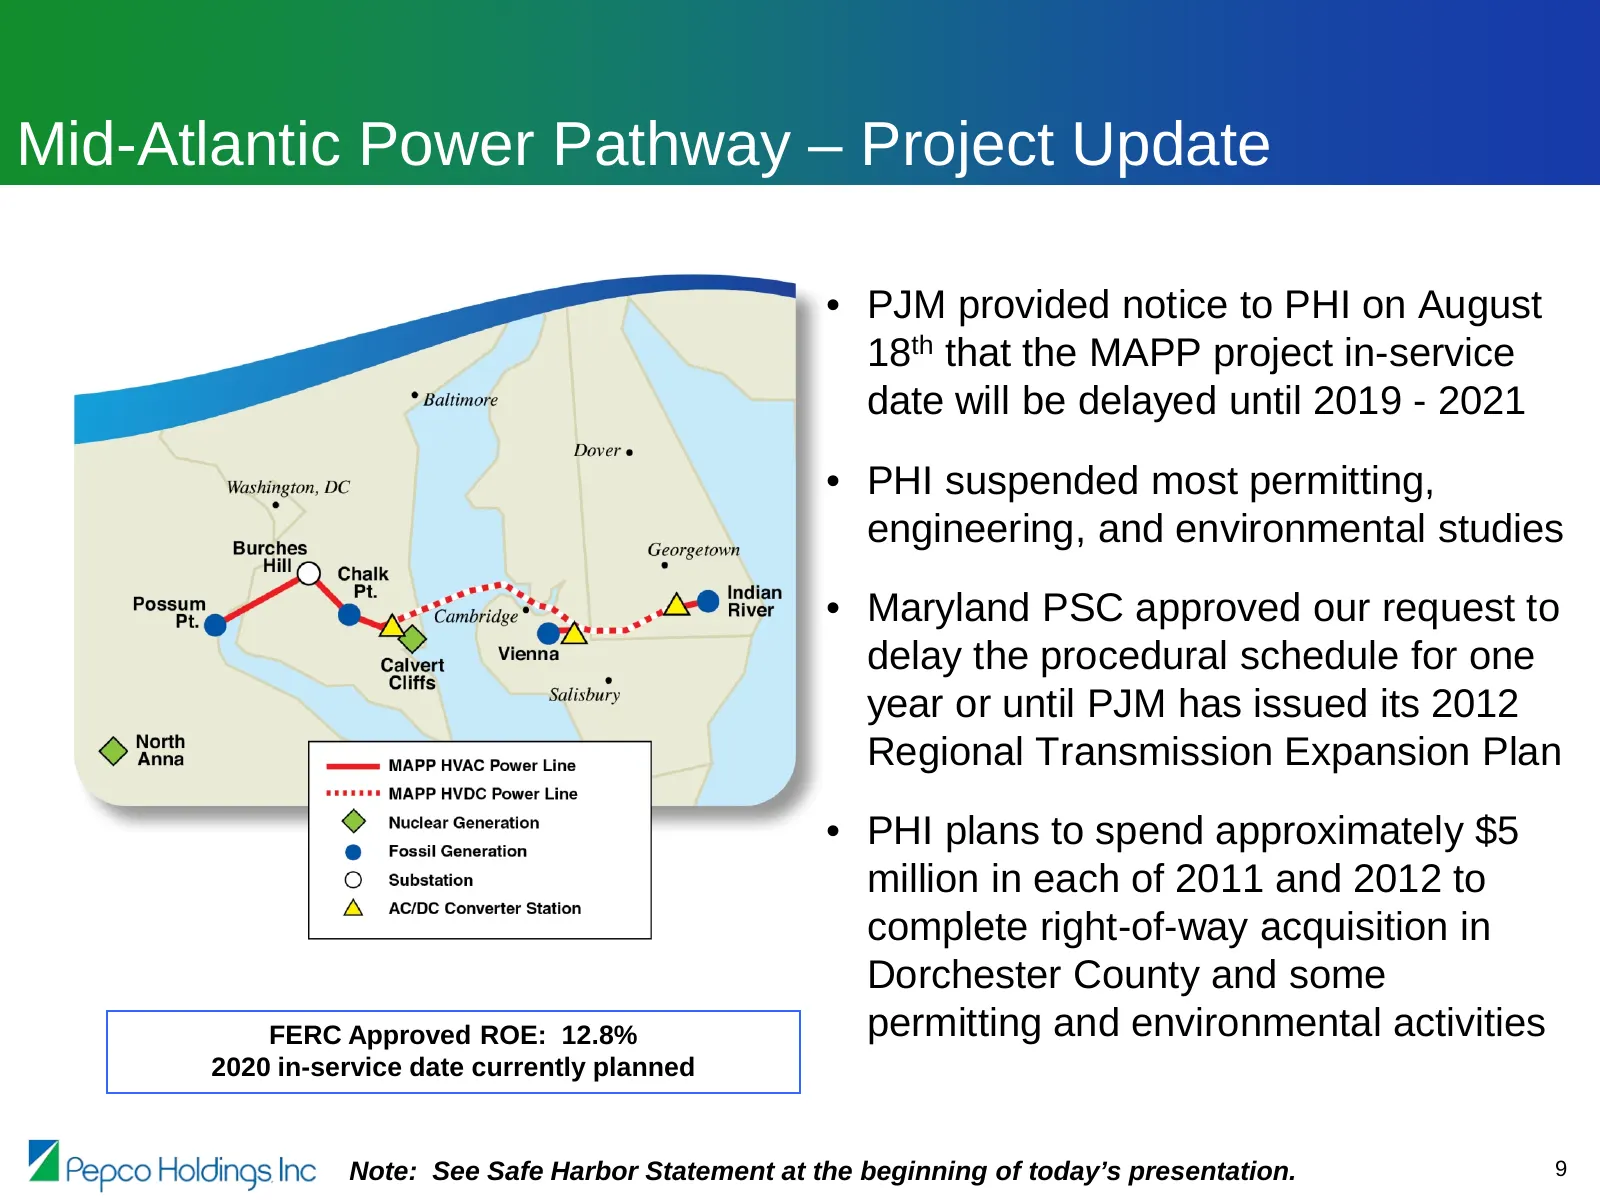
Mid-Atlantic Power Pathway – Project Update • PJM provided notice to PHI on August 18th that the MAPP project in-service date will be delayed until 2019 - 2021 • PHI suspended most permitting, engineering, and environmental studies • Maryland PSC approved our request to delay the procedural schedule
Slide 11: Capital Expenditures Forecast – Updated November 2011
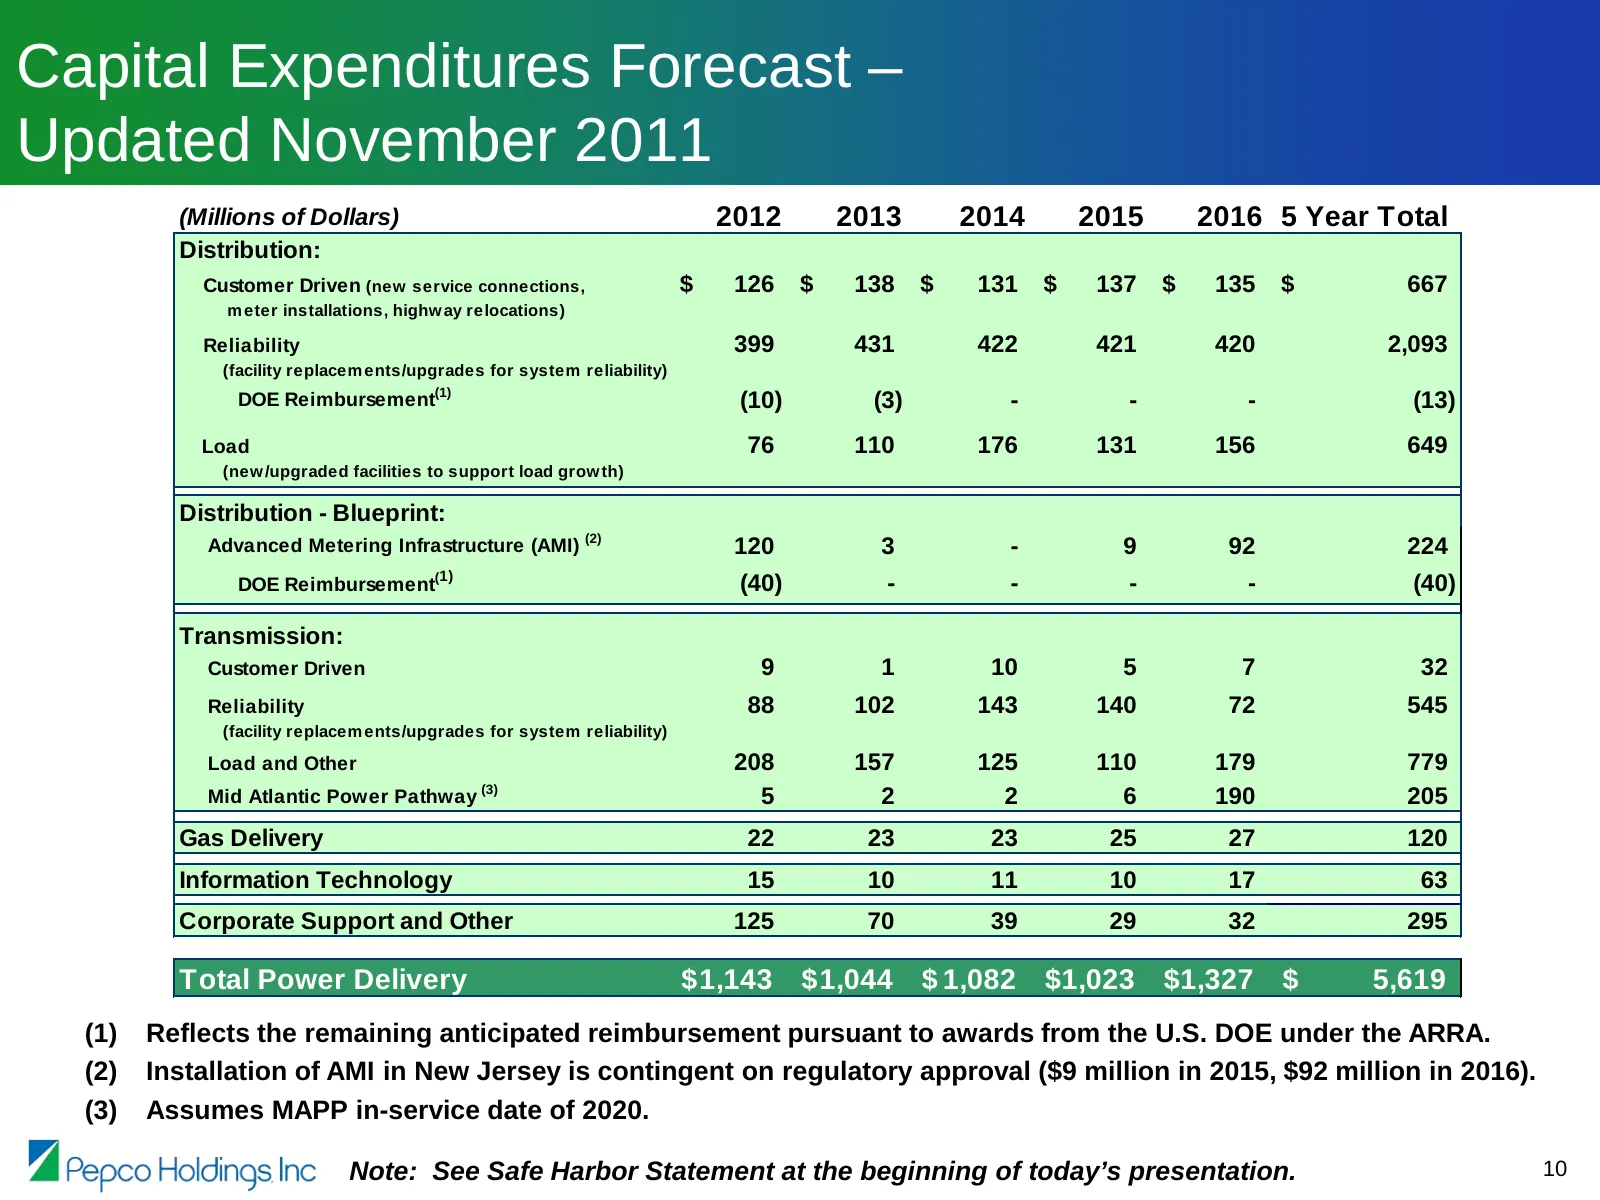
Capital Expenditures Forecast – Updated November 2011 (Millions of Dollars) 2012 2013 2014 2015 2016 5 Year Total Distribution: Customer Driven (new service connections, $ 126 $ 138 $ 131 $ 137 $ 135 $ 667 m eter installations, highw ay relocations) Reliability 399 431 422 421 420 2,093 (facility re
Slide 12: Forecast Capital Expenditures Comparison
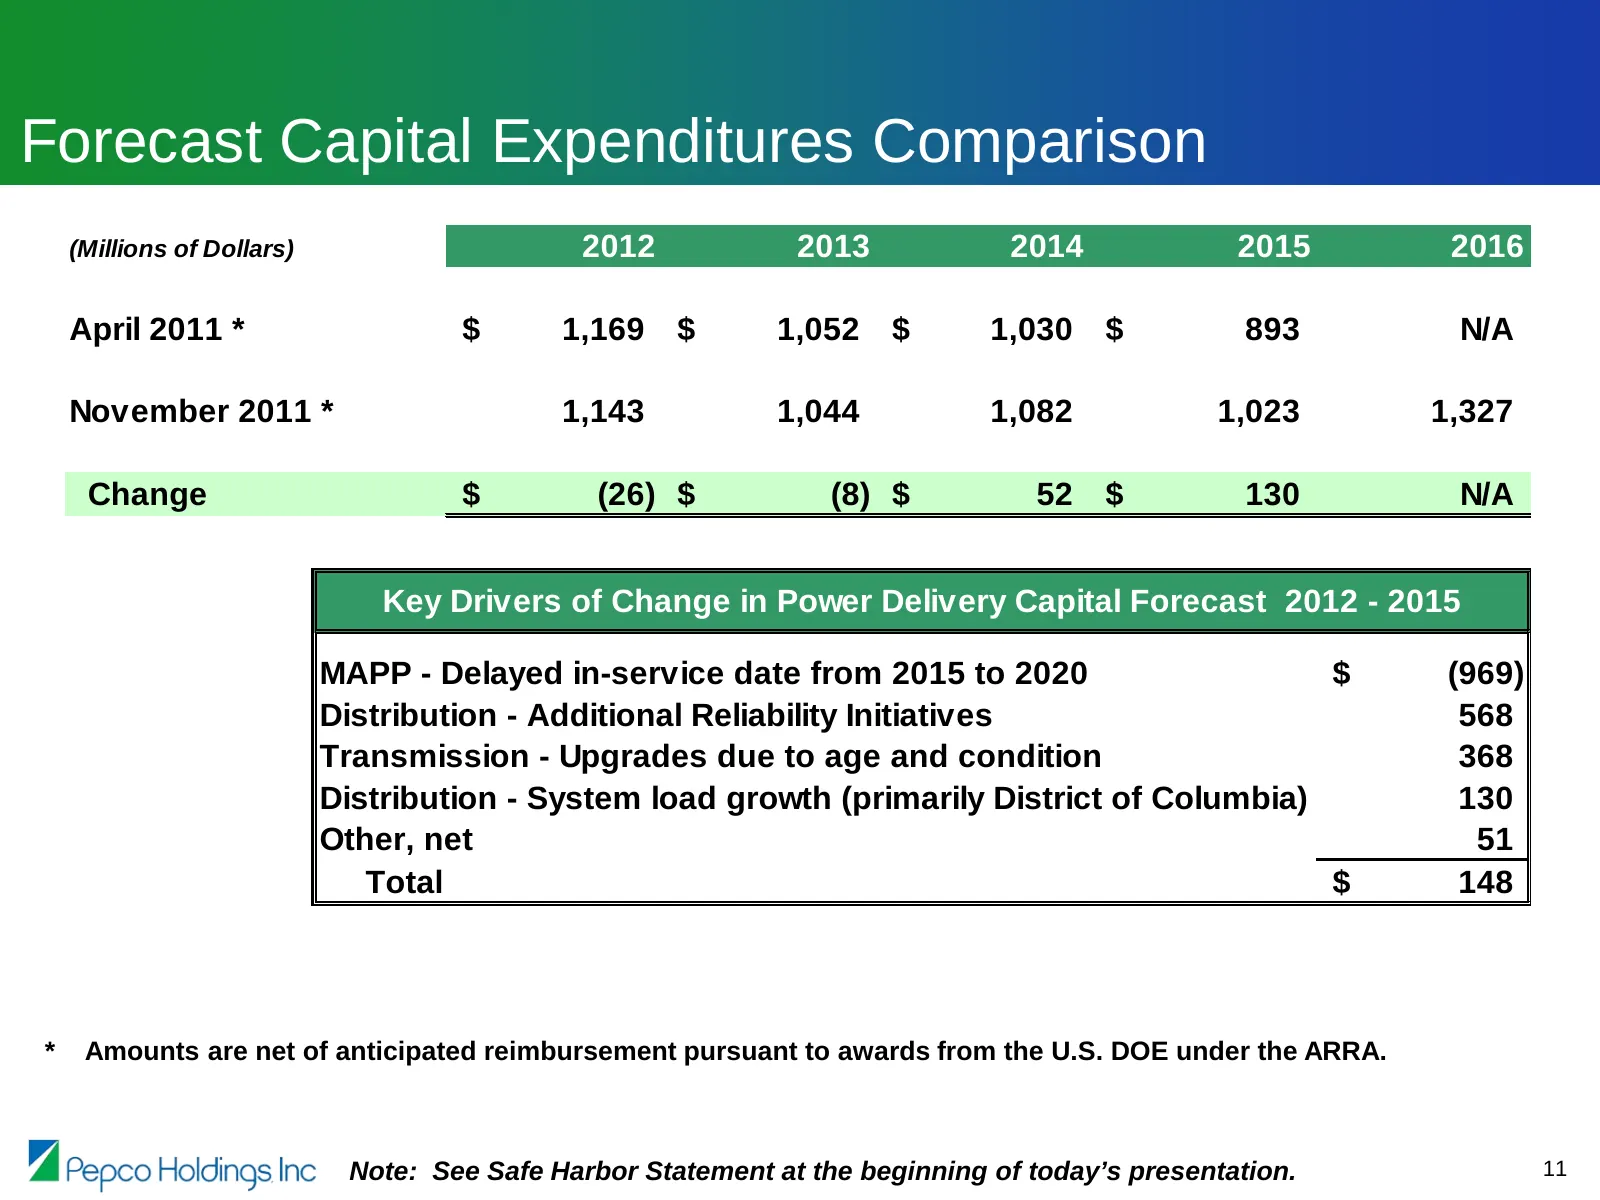
Forecast Capital Expenditures Comparison (Millions of Dollars) 2012 2013 2014 2015 2016 April 2011 * $ 1,169 $ 1,052 $ 1,030 $ 893 N/A November 2011 * 1,143 1,044 1,082 1,023 1,327 Change $ (26) $ (8) $ 52 $ 130 N/A Key Drivers of Change in Power Delivery Capital Forecast 2012 - 2015 MAPP - Delayed
Slide 13: Distribution Rate Cases – Pending Pepco – District of Columbia
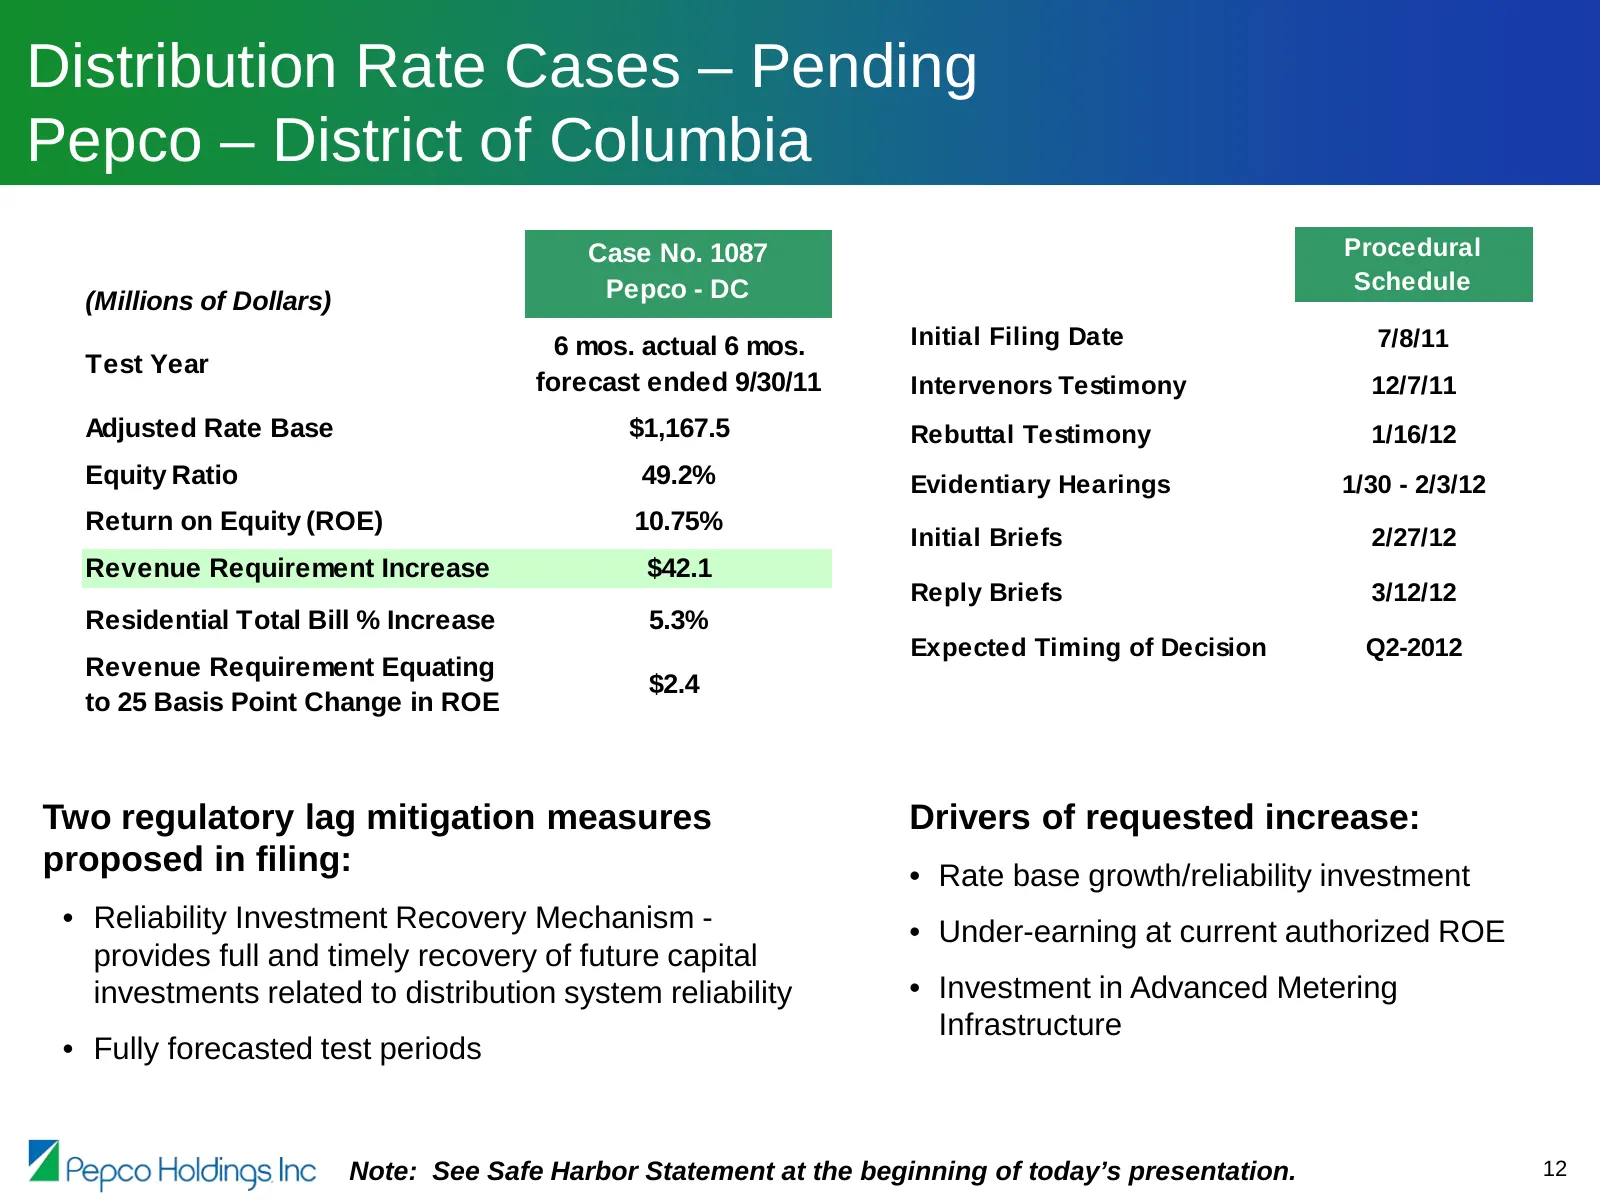
Distribution Rate Cases – Pending Pepco – District of Columbia Case No. 1087 Procedural Pepco - DC Schedule (Millions of Dollars) 6 mos. actual 6 mos. Initial Filing Date 7/8/11 Test Year forecast ended 9/30/11 Intervenors Testimony 12/7/11 Adjusted Rate Base $1,167.5 Rebuttal Testimony 1/16/12 Equi
Slide 14: Distribution Rate Cases – Pending Atlantic City Electric – New Jersey
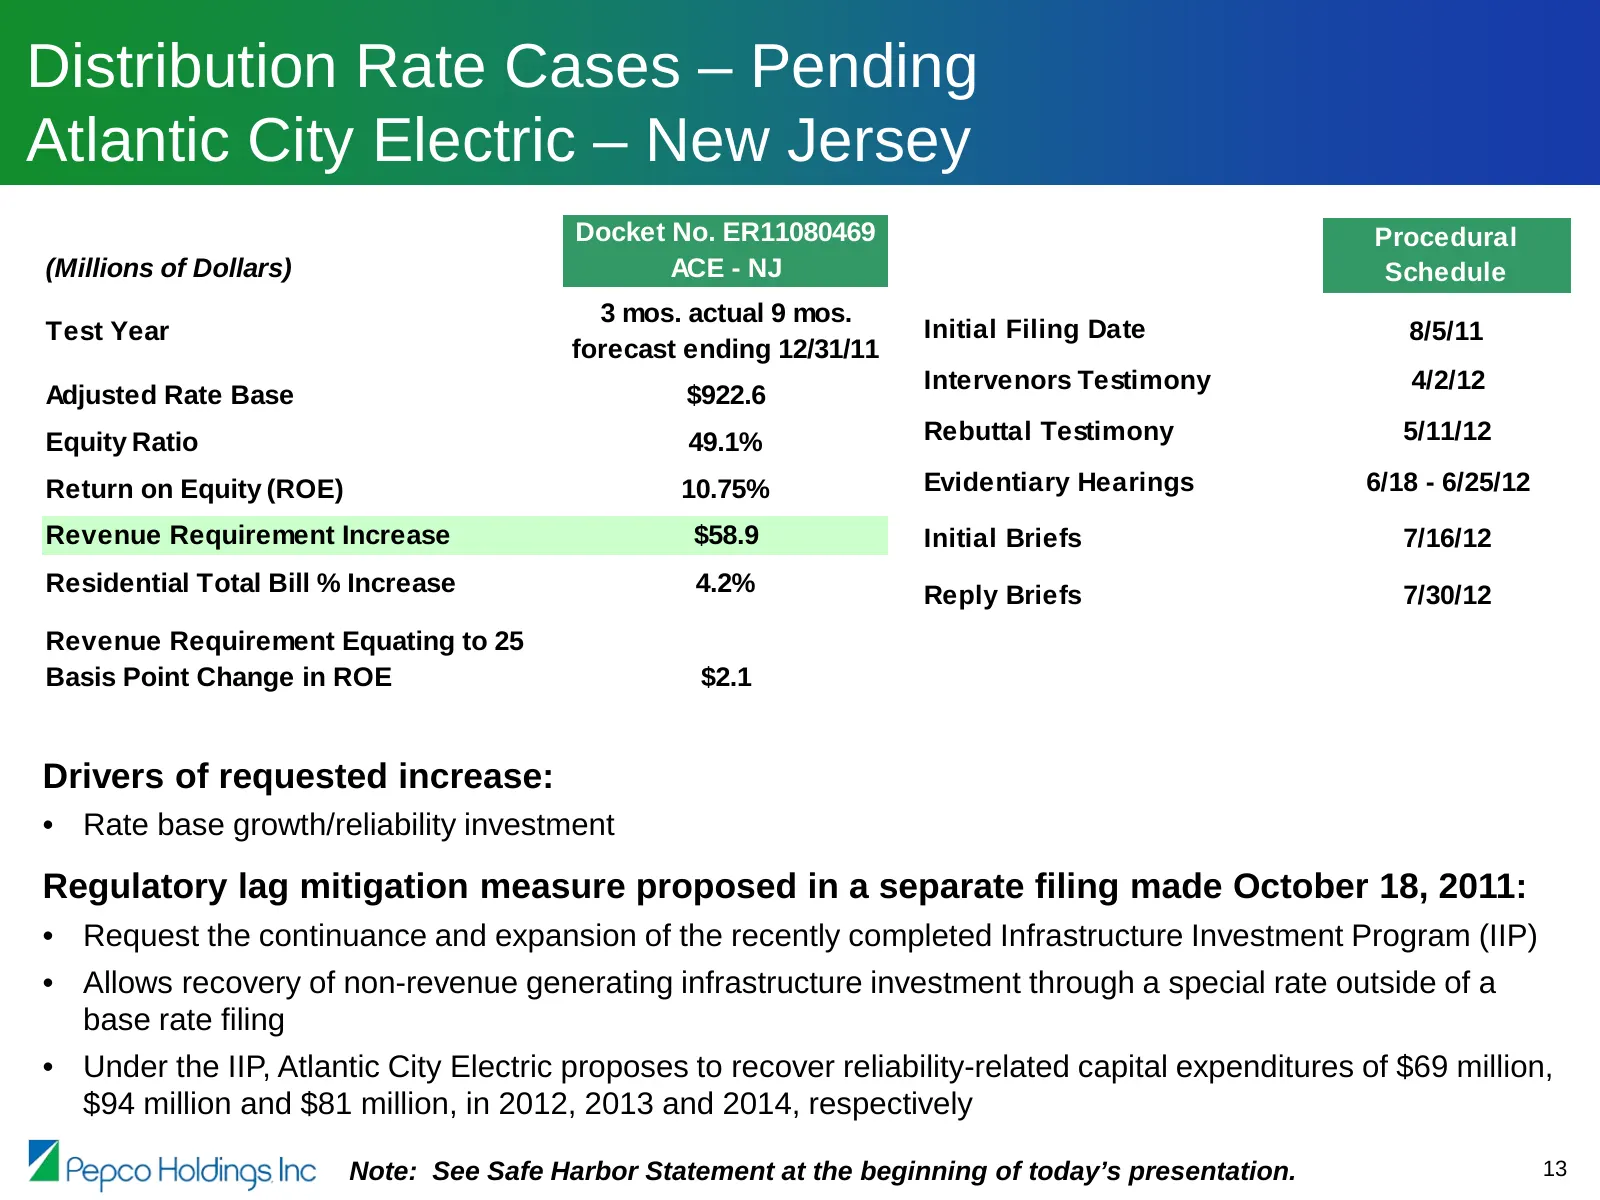
Distribution Rate Cases – Pending Atlantic City Electric – New Jersey Docket No. ER11080469 Procedural (Millions of Dollars) ACE - NJ Schedule 3 mos. actual 9 mos. Test Year Initial Filing Date 8/5/11 forecast ending 12/31/11 Intervenors Testimony 4/2/12 Adjusted Rate Base $922.6 Equity Ratio 49.1%
Slide 15: Distribution Rate Cases – Pending Delmarva Power – Delaware Electric
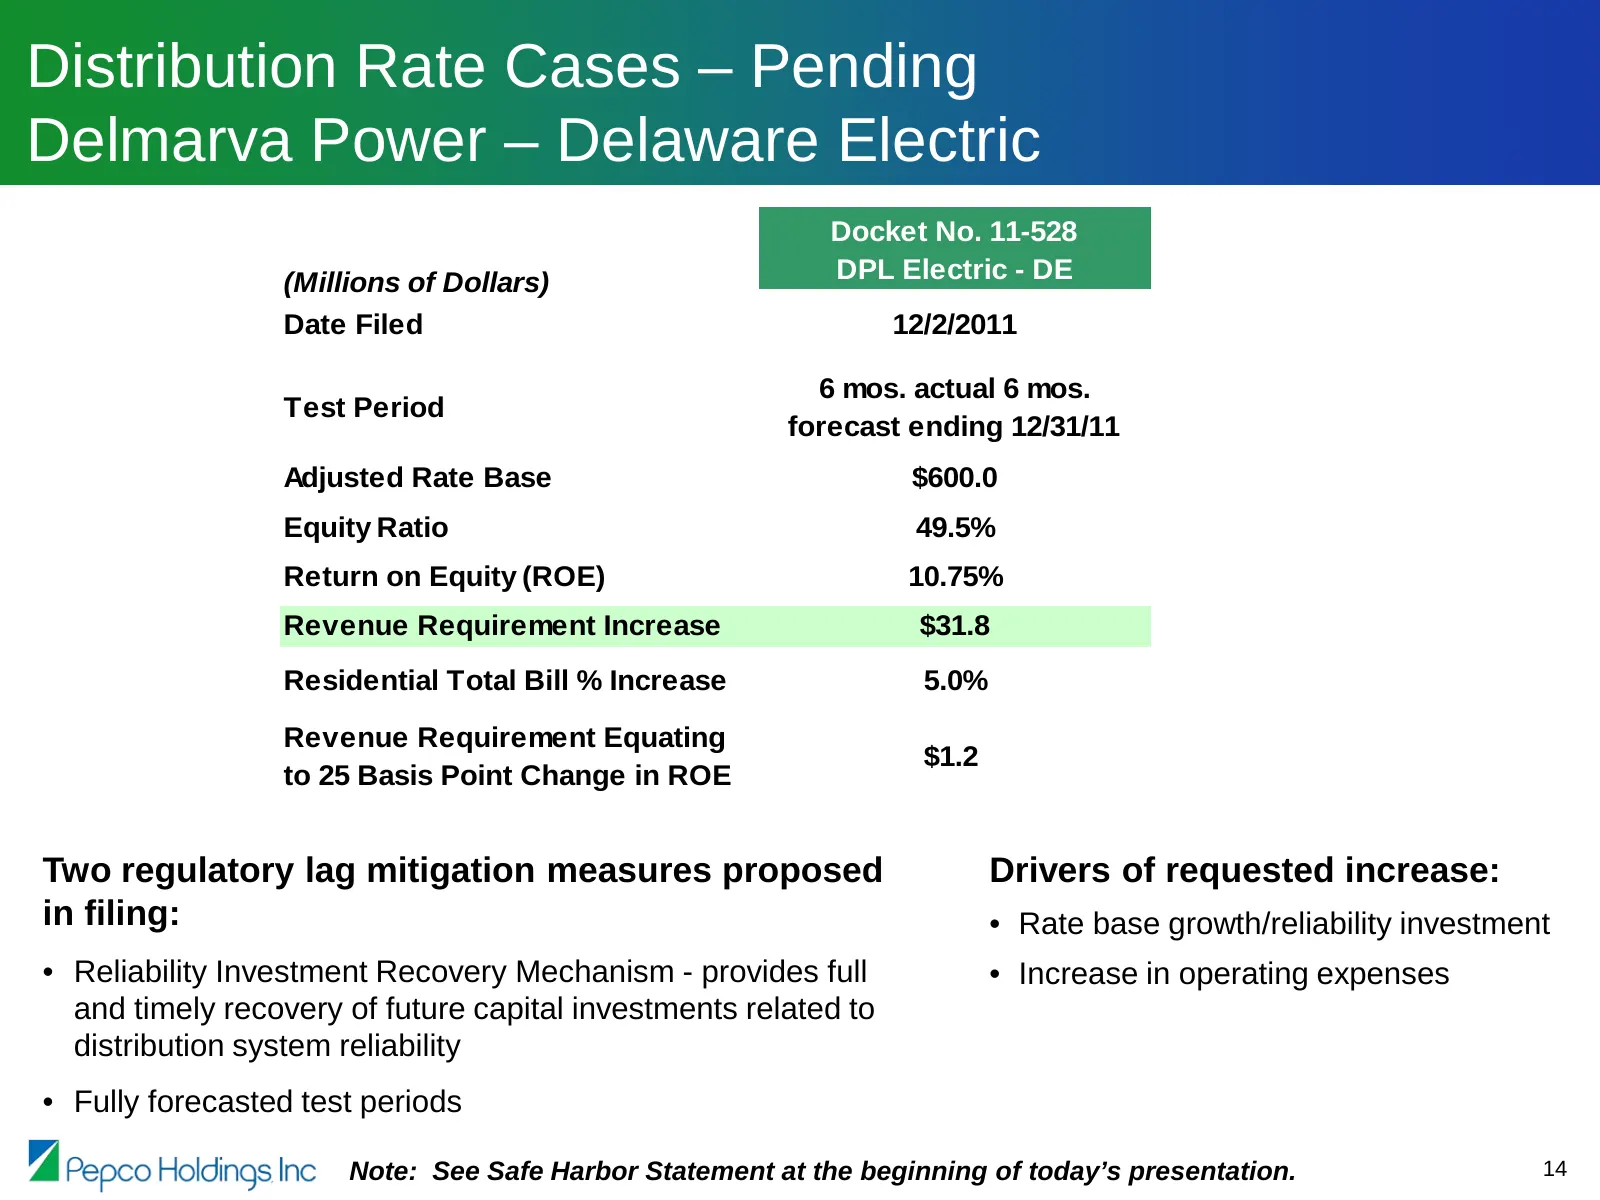
Distribution Rate Cases – Pending Delmarva Power – Delaware Electric Docket No. 11-528 (Millions of Dollars) DPL Electric - DE Date Filed 12/2/2011 6 mos. actual 6 mos. Test Period forecast ending 12/31/11 Adjusted Rate Base $600.0 Equity Ratio 49.5% Return on Equity (ROE) 10.75% Revenue Requirement
Slide 16: Distribution Rate Cases – The Current Cycle
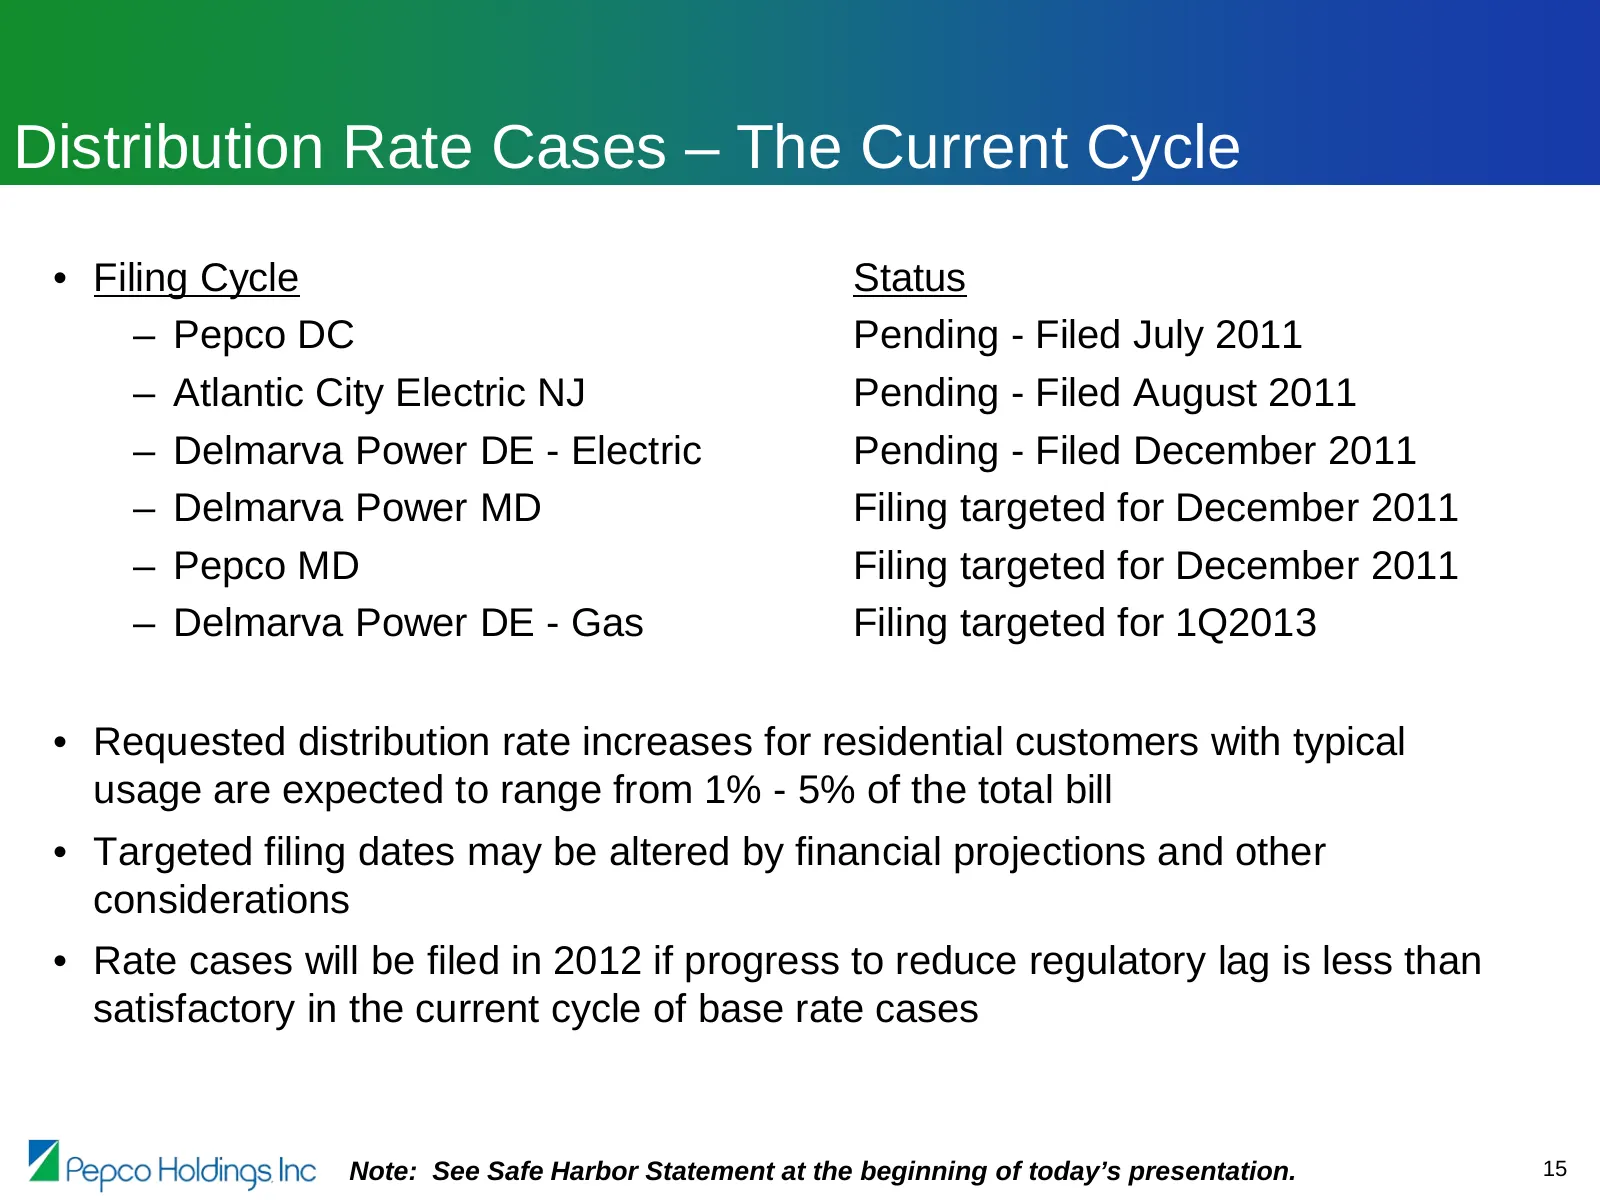
Distribution Rate Cases – The Current Cycle • Filing Cycle Status – Pepco DC Pending - Filed July 2011 – Atlantic City Electric NJ Pending - Filed August 2011 – Delmarva Power DE - Electric Pending - Filed December 2011 – Delmarva Power MD Filing targeted for December 2011 – Pepco MD Filing targeted
Slide 17: Pepco Energy Services – Overview
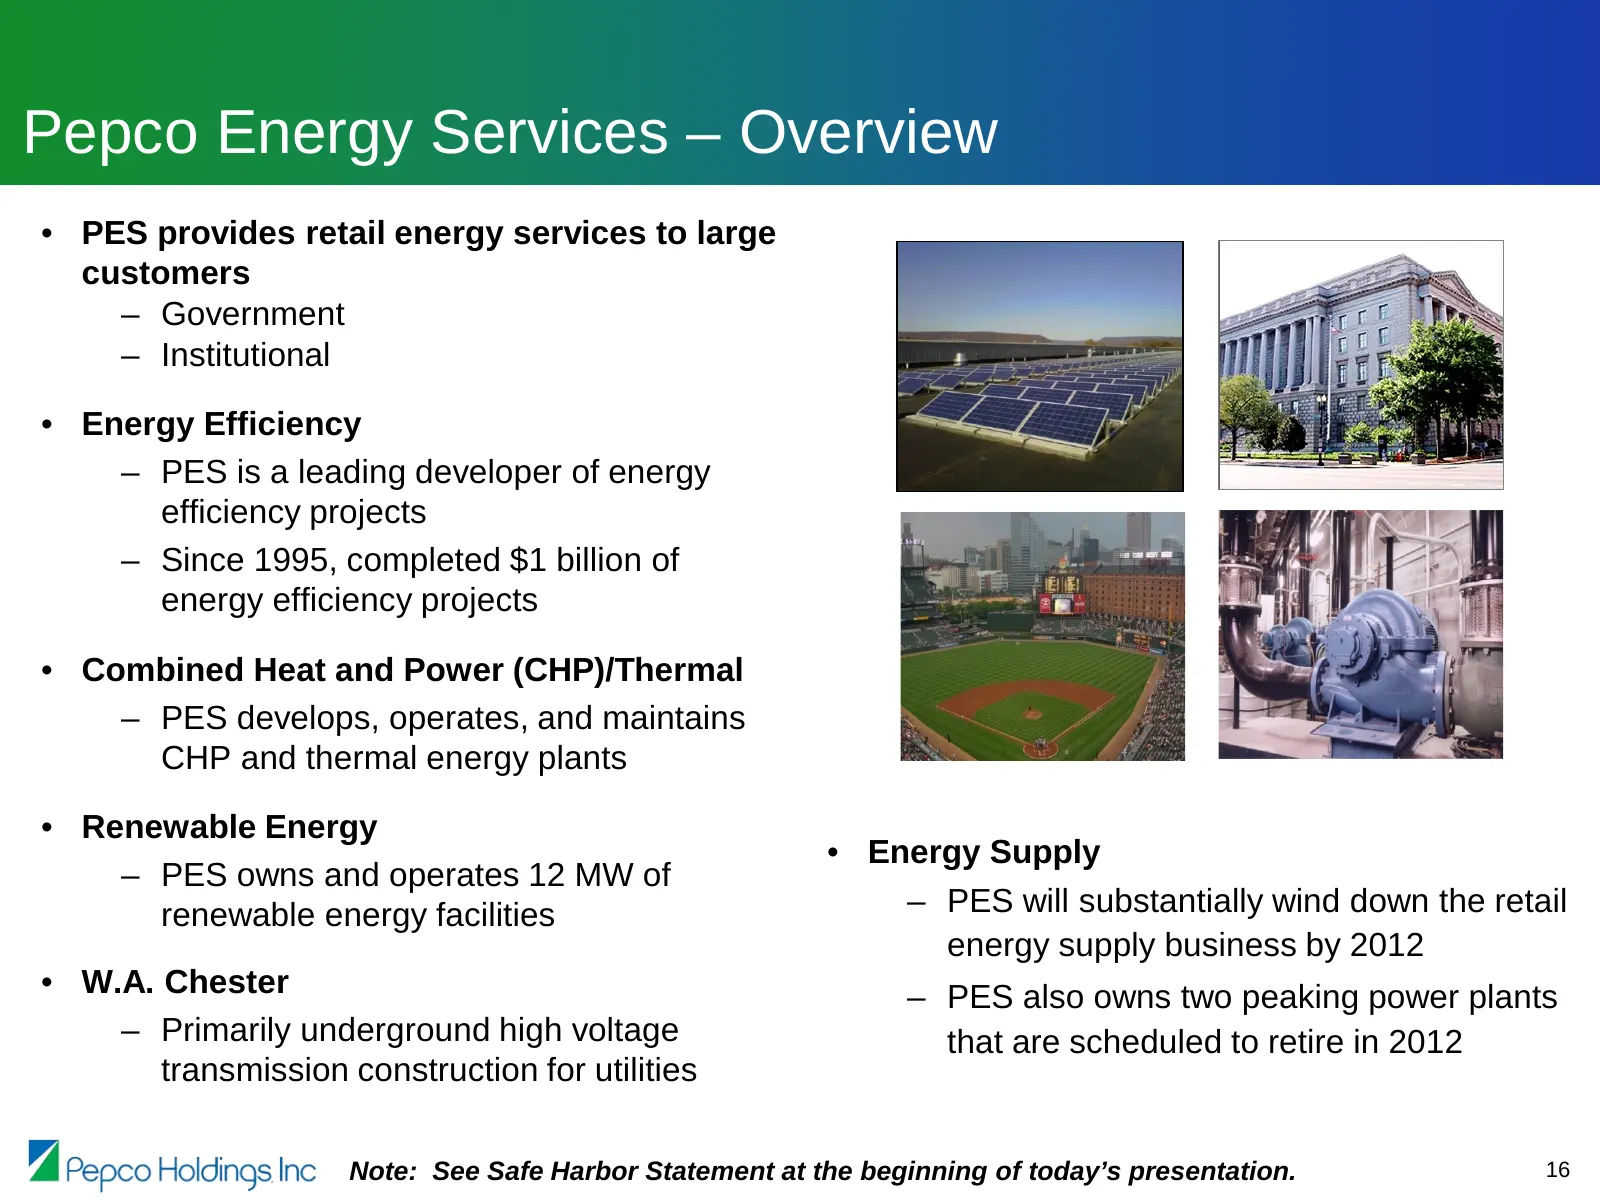
Pepco Energy Services – Overview • PES provides retail energy services to large customers – Government – Institutional • Energy Efficiency – PES is a leading developer of energy efficiency projects – Since 1995, completed $1 billion of energy efficiency projects • Combined Heat and Power (CHP)/Therm
Slide 18: Pepco Energy Services – Energy Services Earnings Components
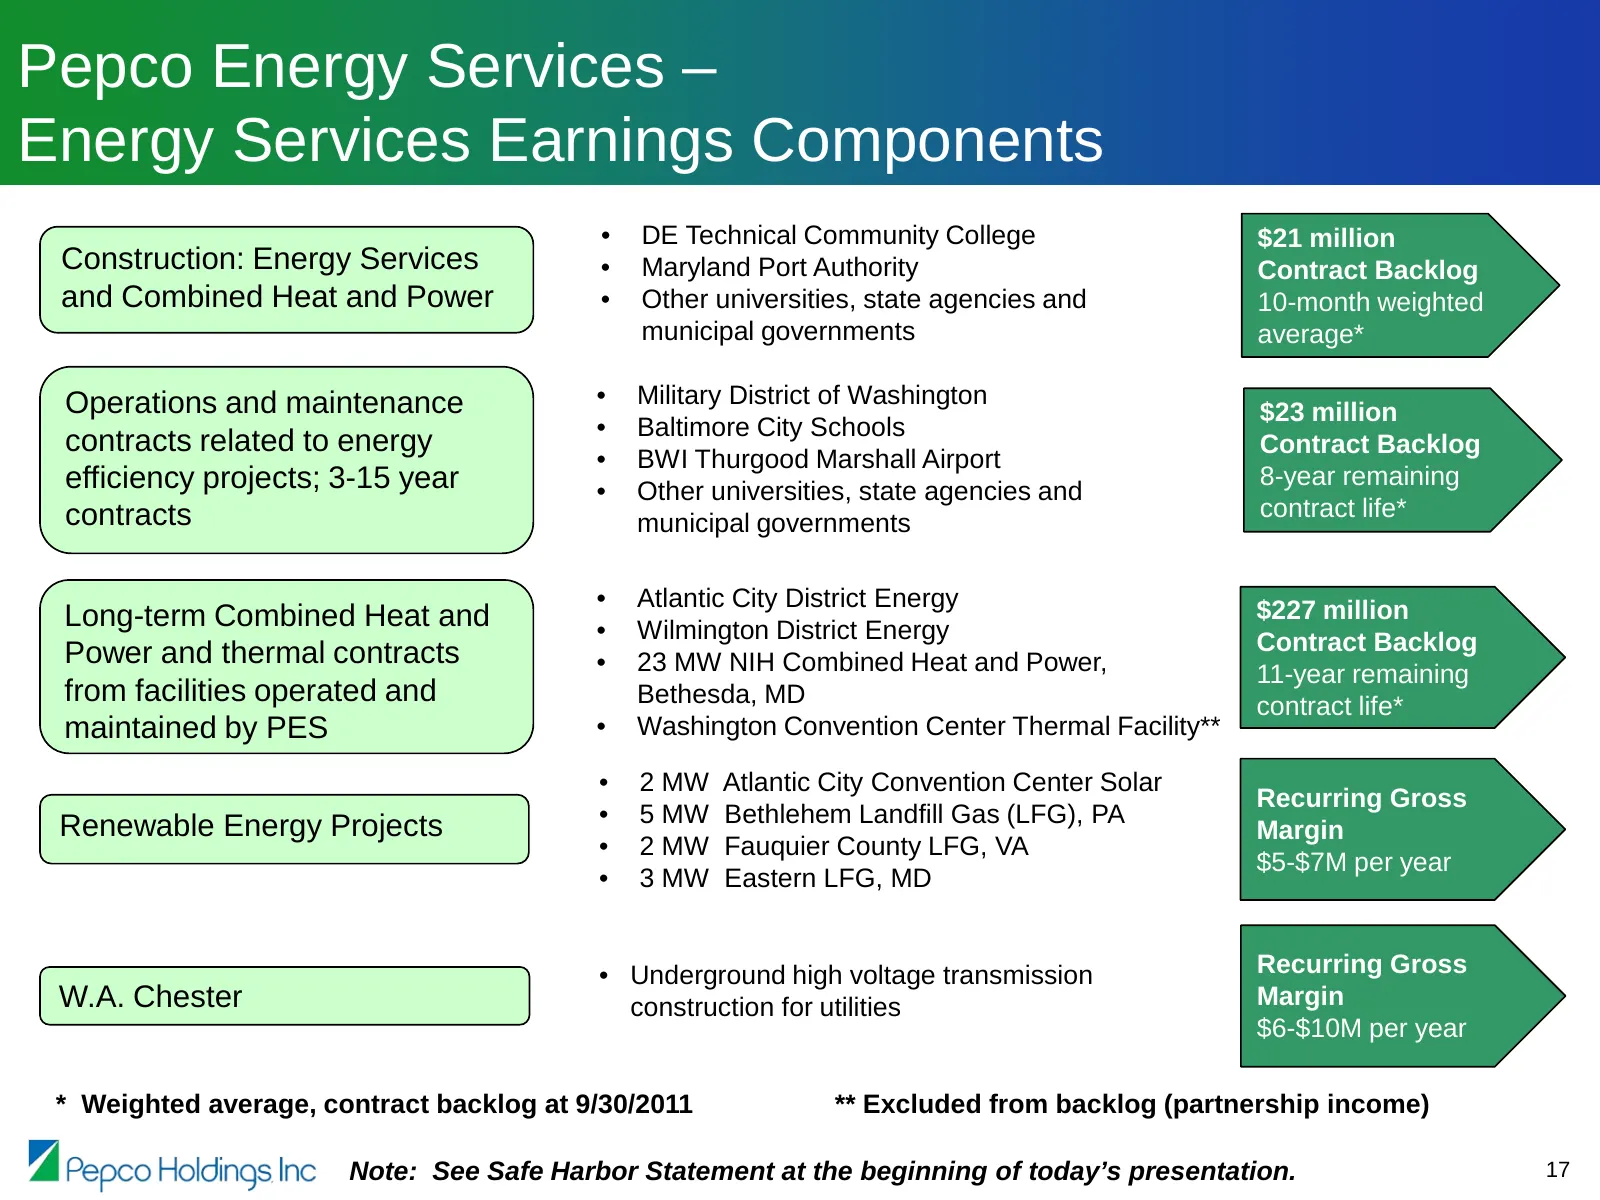
Pepco Energy Services – Energy Services Earnings Components • DE Technical Community College $21 million Construction: Energy Services • Maryland Port Authority Contract Backlog and Combined Heat and Power • Other universities, state agencies and 10-month weighted municipal governments average* Oper
Slide 19: Pepco Energy Services – Business Development and Marketing Update
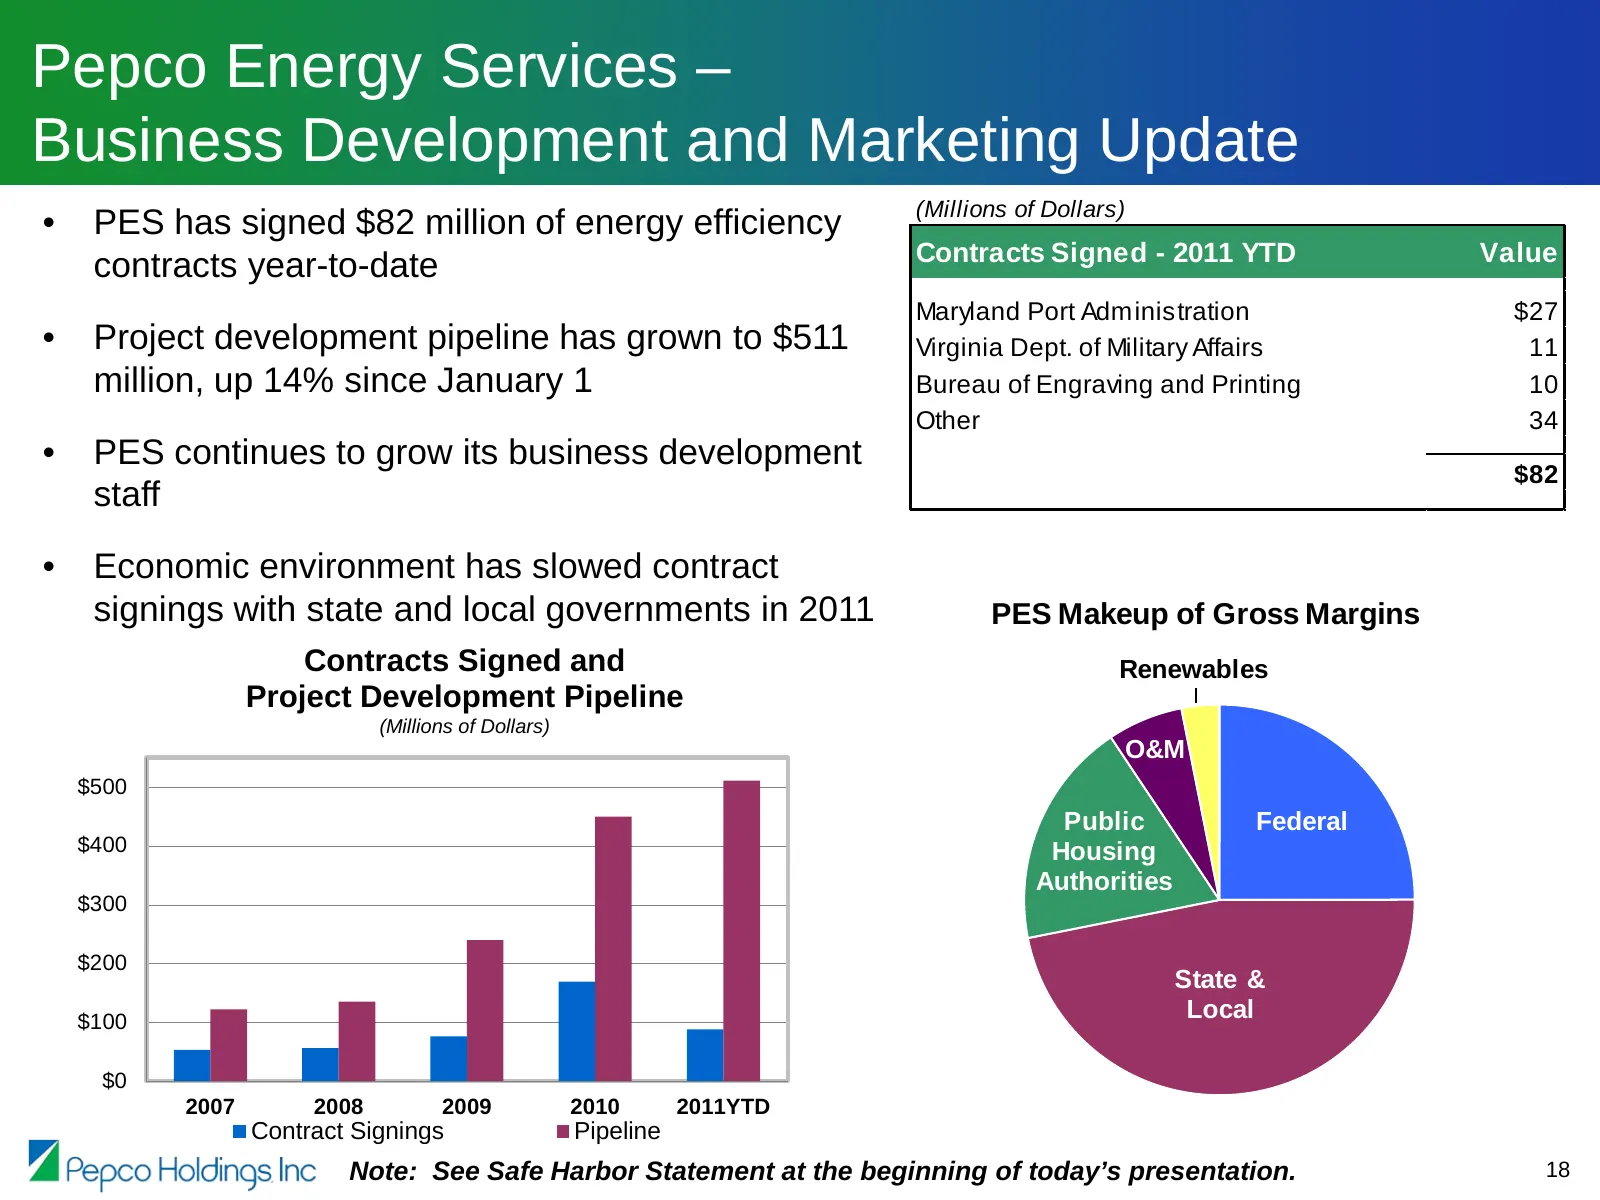
Pepco Energy Services – Business Development and Marketing Update (Millions of Dollars) • PES has signed $82 million of energy efficiency Contracts Signed - 2011 YTD Value contracts year-to-date Maryland Port Administration $27 • Project development pipeline has grown to $511 Virginia Dept. of Milit
Slide 20: Pepco Energy Services – Typical Energy Efficiency Project
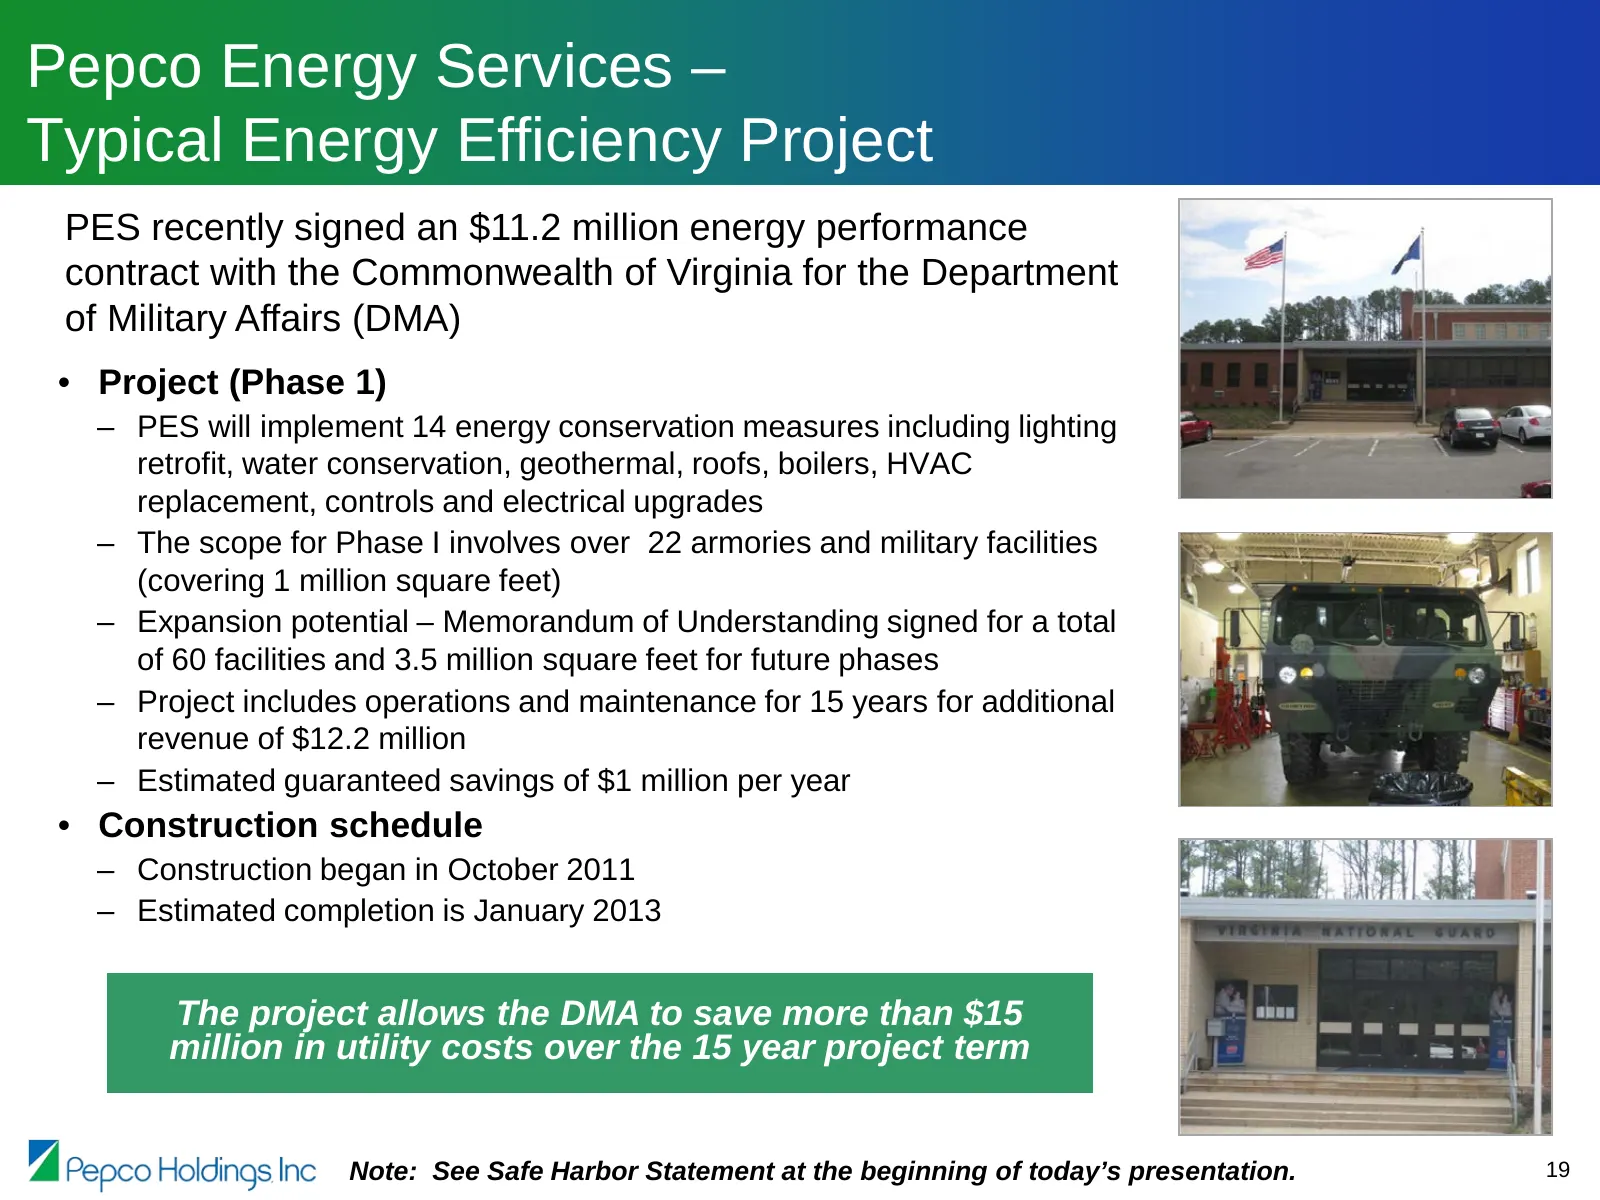
Pepco Energy Services – Typical Energy Efficiency Project PES recently signed an $11.2 million energy performance contract with the Commonwealth of Virginia for the Department of Military Affairs (DMA) • Project (Phase 1) – PES will implement 14 energy conservation measures including lighting retrof
Slide 21: Pepco Energy Services – Update of Retail Supply Wind Down/Power Plant Retirement
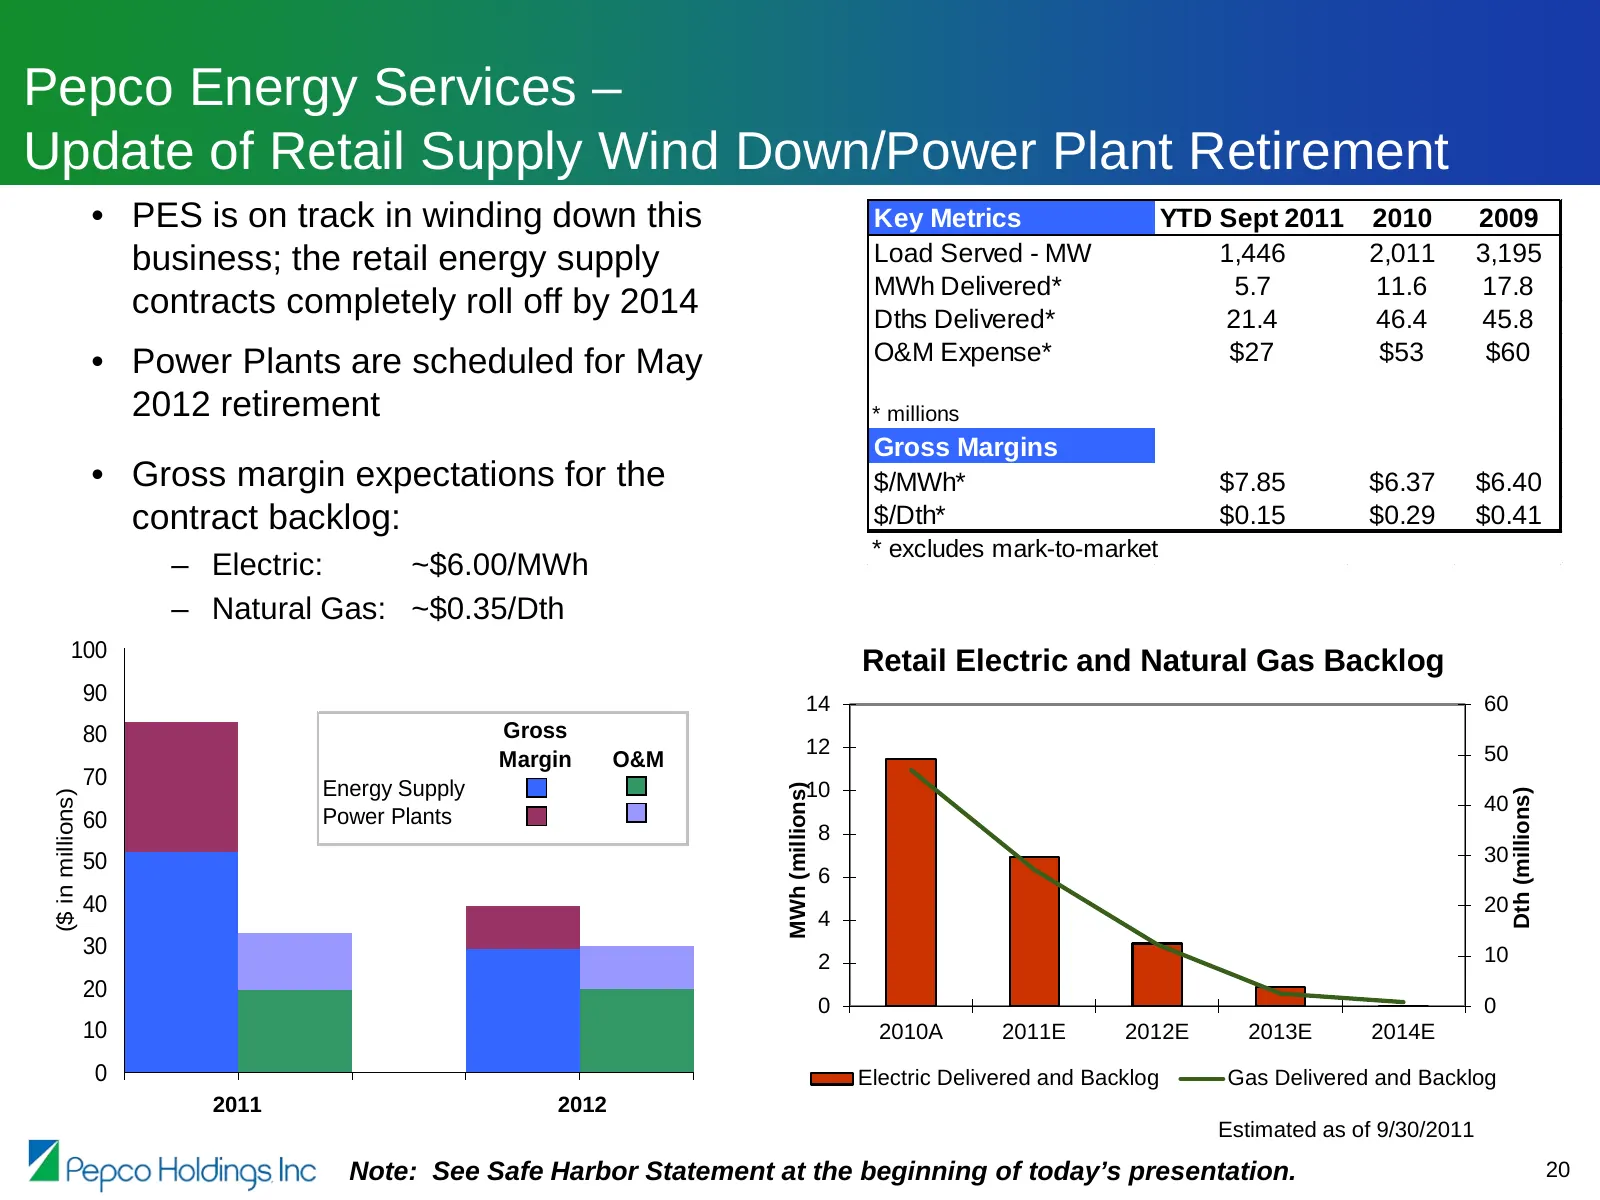
Pepco Energy Services – Update of Retail Supply Wind Down/Power Plant Retirement • PES is on track in winding down this Key Metrics YTD Sept 2011 2010 2009 business; the retail energy supply Load Served - MW 1,446 2,011 3,195 MWh Delivered* 5.7 11.6 17.8 contracts completely roll off by 2014 Dths De
Slide 22: Cross-Border Energy Lease Status
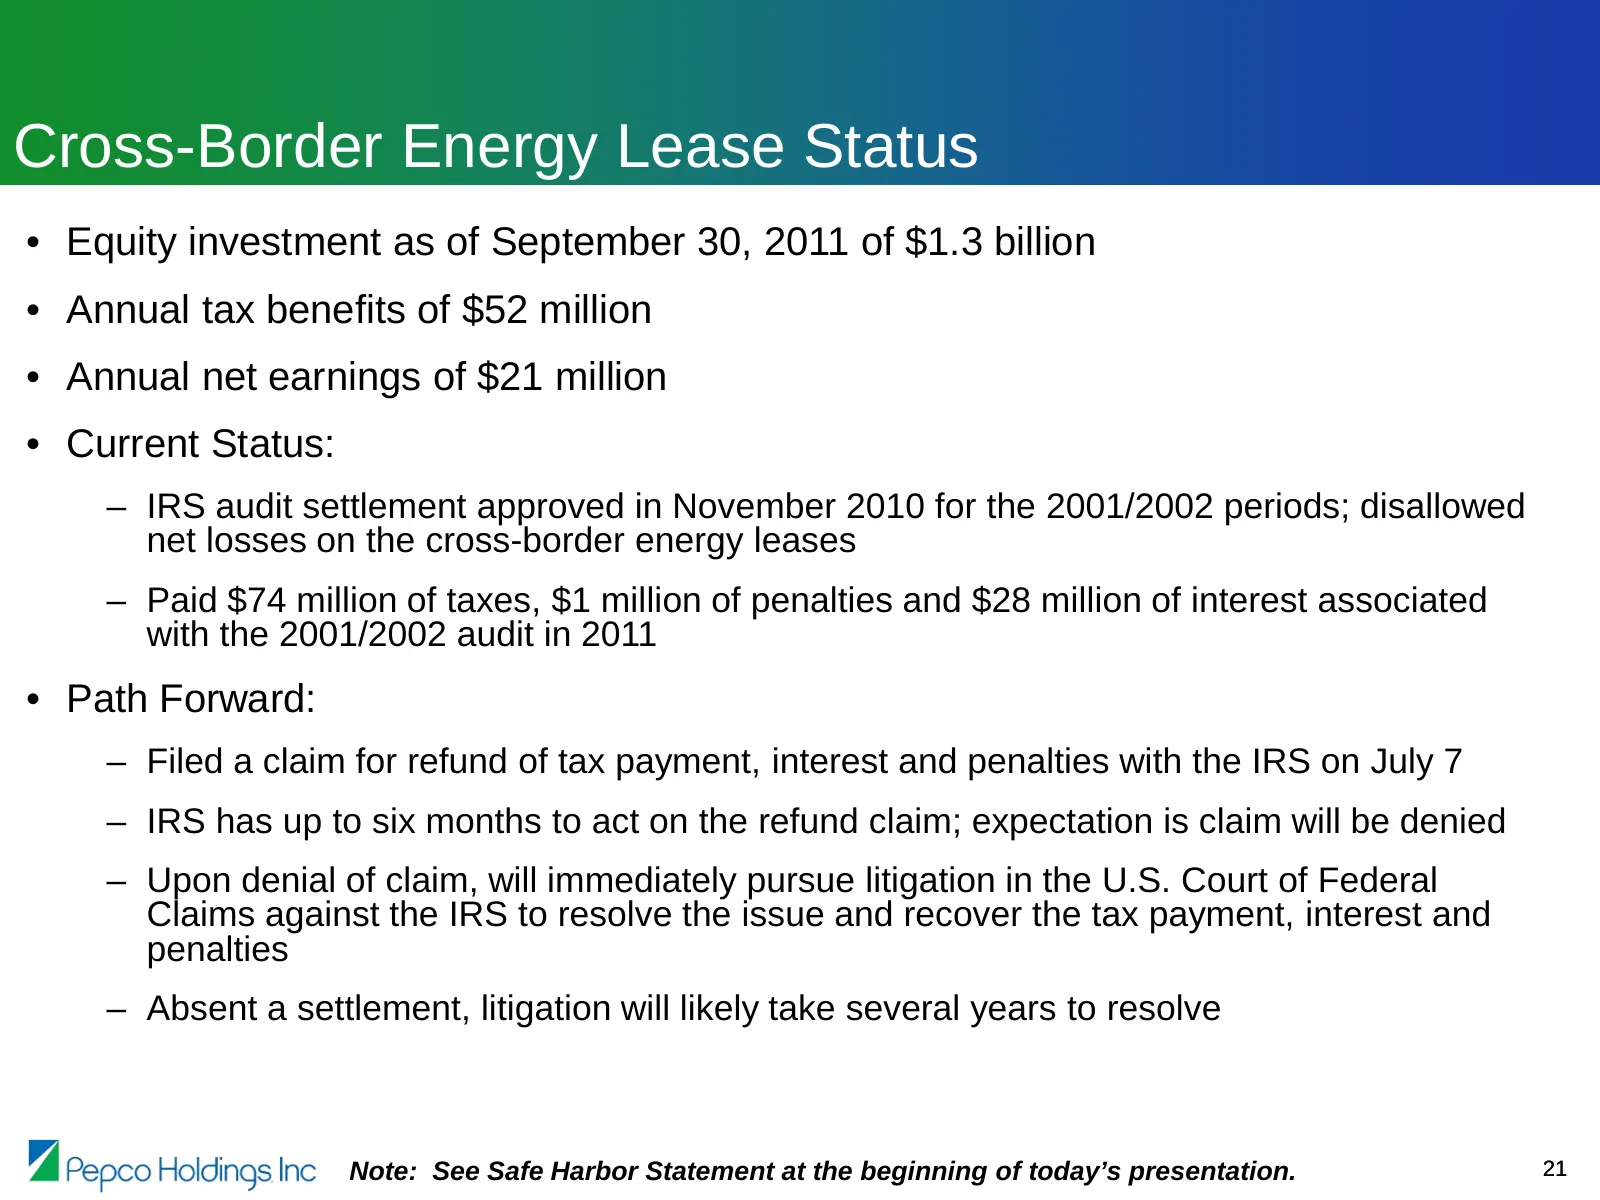
Cross-Border Energy Lease Status • Equity investment as of September 30, 2011 of $1.3 billion • Annual tax benefits of $52 million • Annual net earnings of $21 million • Current Status: – IRS audit settlement approved in November 2010 for the 2001/2002 periods; disallowed net losses on the cross-bor
Slide 23: 2012 Financing Activity
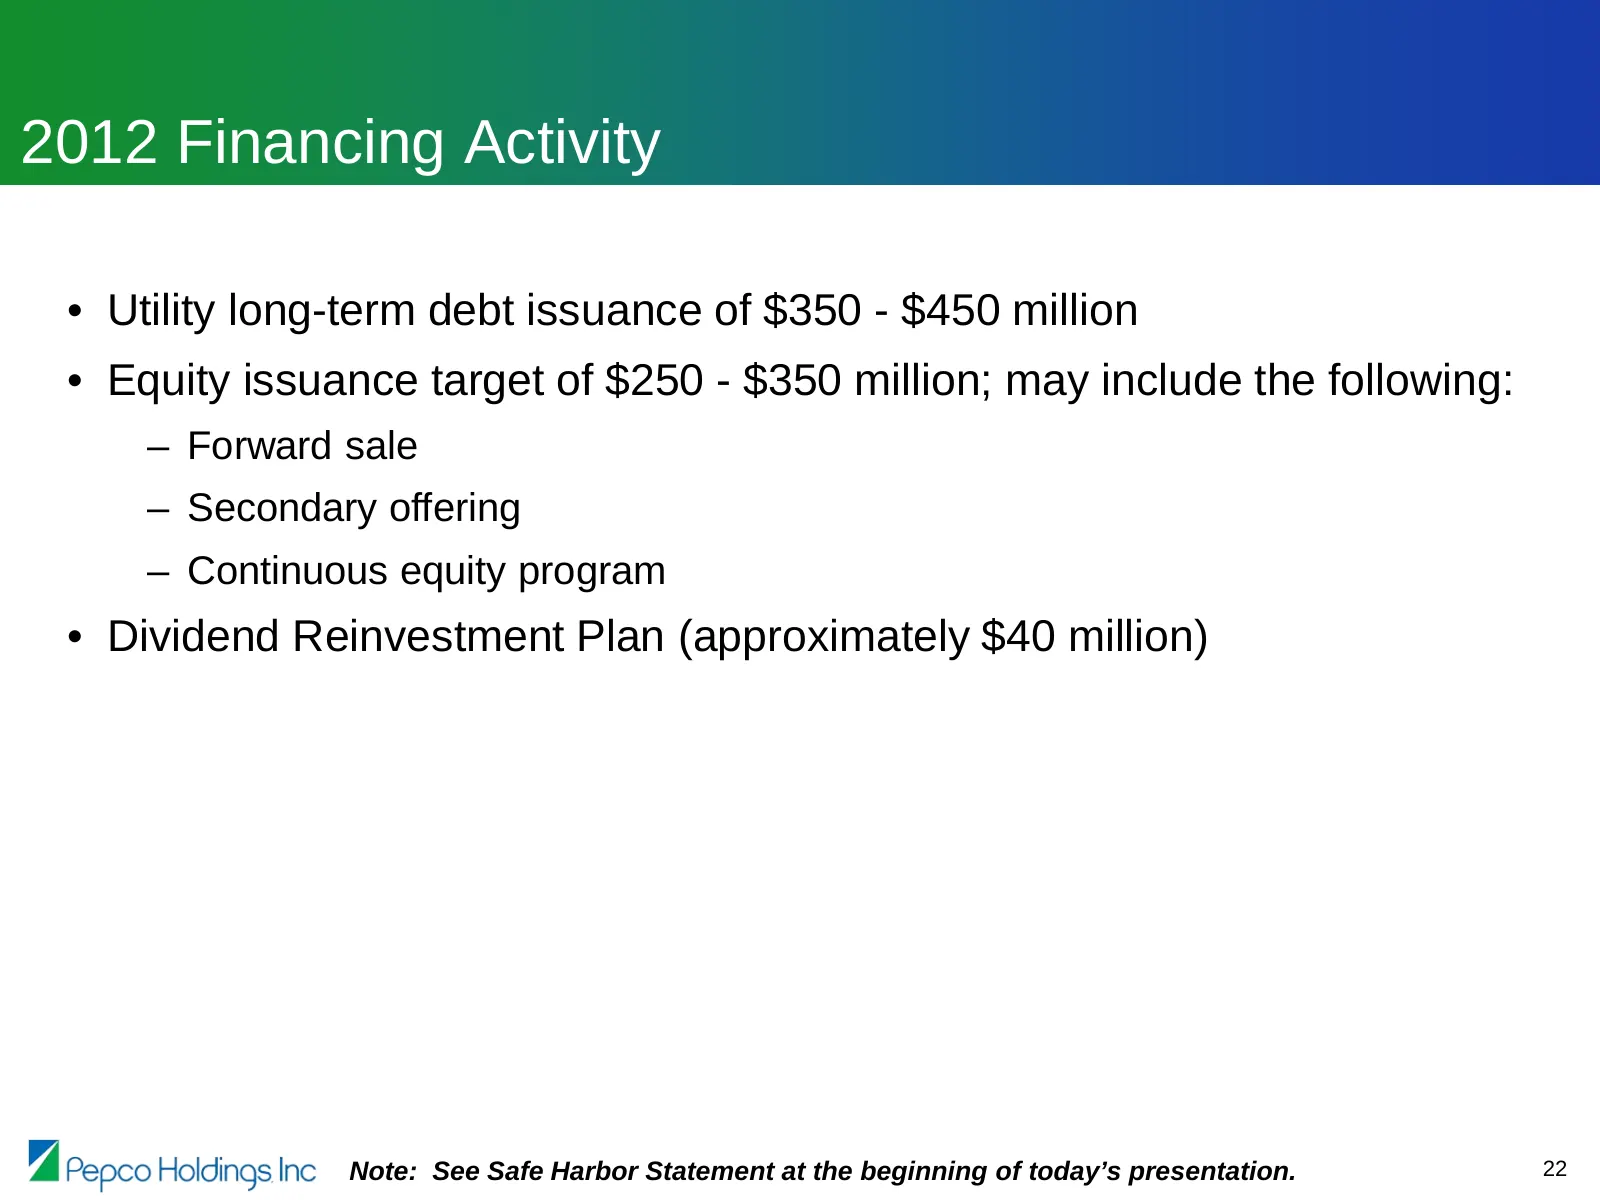
2012 Financing Activity • Utility long-term debt issuance of $350 - $450 million • Equity issuance target of $250 - $350 million; may include the following: – Forward sale – Secondary offering – Continuous equity program • Dividend Reinvestment Plan (approximately $40 million) Note: See Safe Harbor
Slide 24: 2011 Earnings Guidance
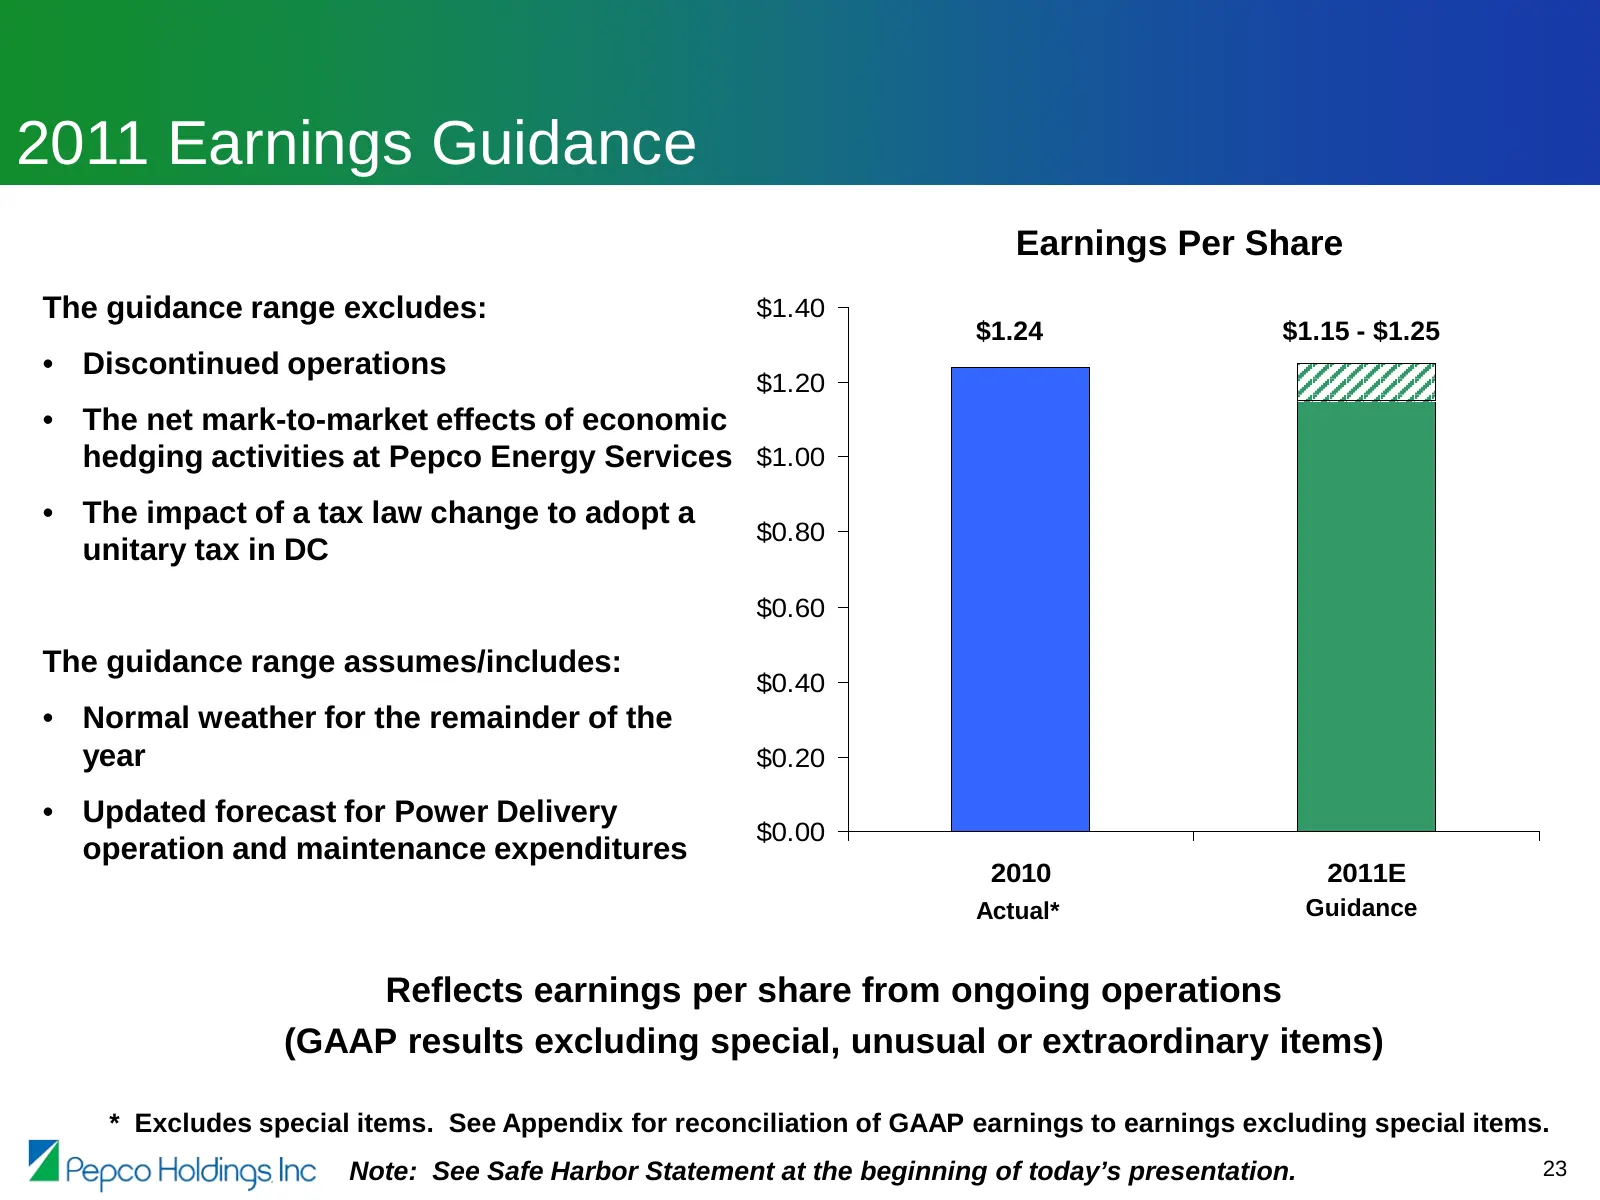
2011 Earnings Guidance Earnings Per Share The guidance range excludes: $1.40 $1.24 $1.15 - $1.25 • Discontinued operations $1.20 • The net mark-to-market effects of economic hedging activities at Pepco Energy Services $1.00 • The impact of a tax law change to adopt a $0.80 unitary tax in DC $0.60 Th
Slide 25: Delivering Value
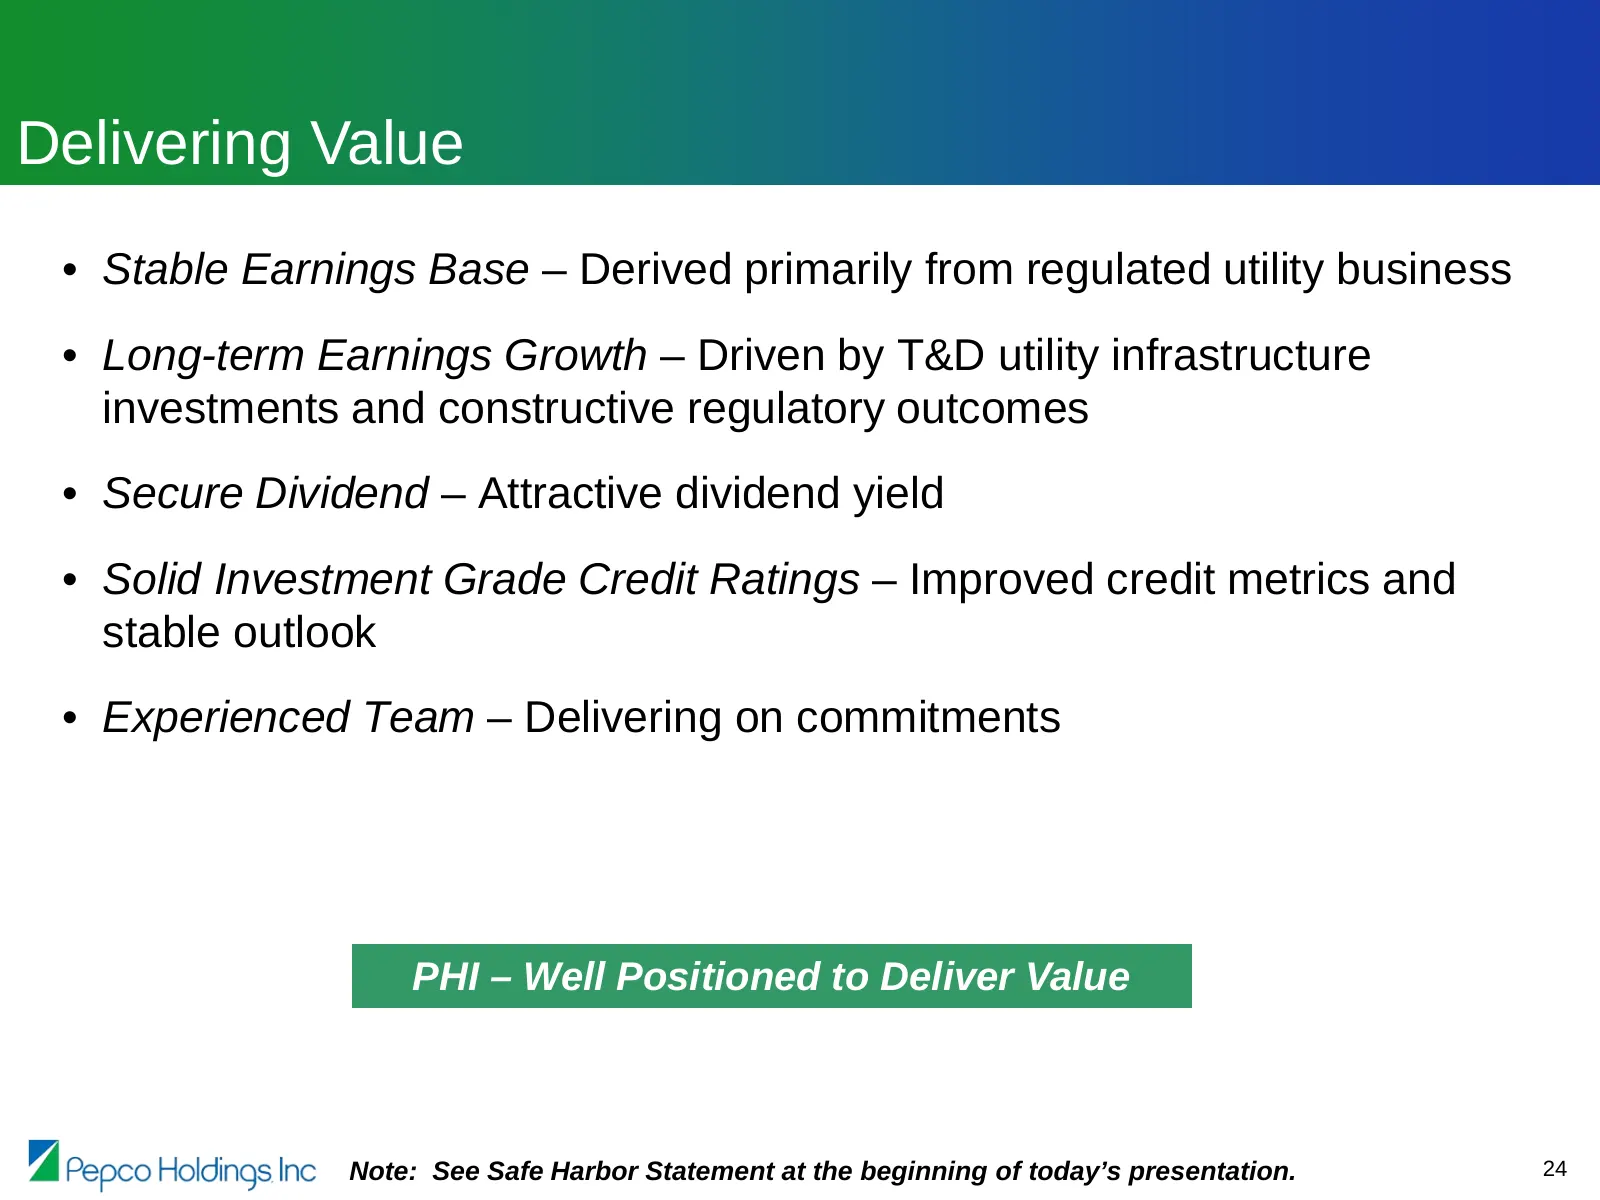
Delivering Value • Stable Earnings Base – Derived primarily from regulated utility business • Long-term Earnings Growth – Driven by T&D utility infrastructure investments and constructive regulatory outcomes • Secure Dividend – Attractive dividend yield • Solid Investment Grade Credit Ratings – Impr

Slide 26: Appendix
Appendix y| Pepco Holdings Inc
Slide 27: Cross-Border Energy Lease Portfolio
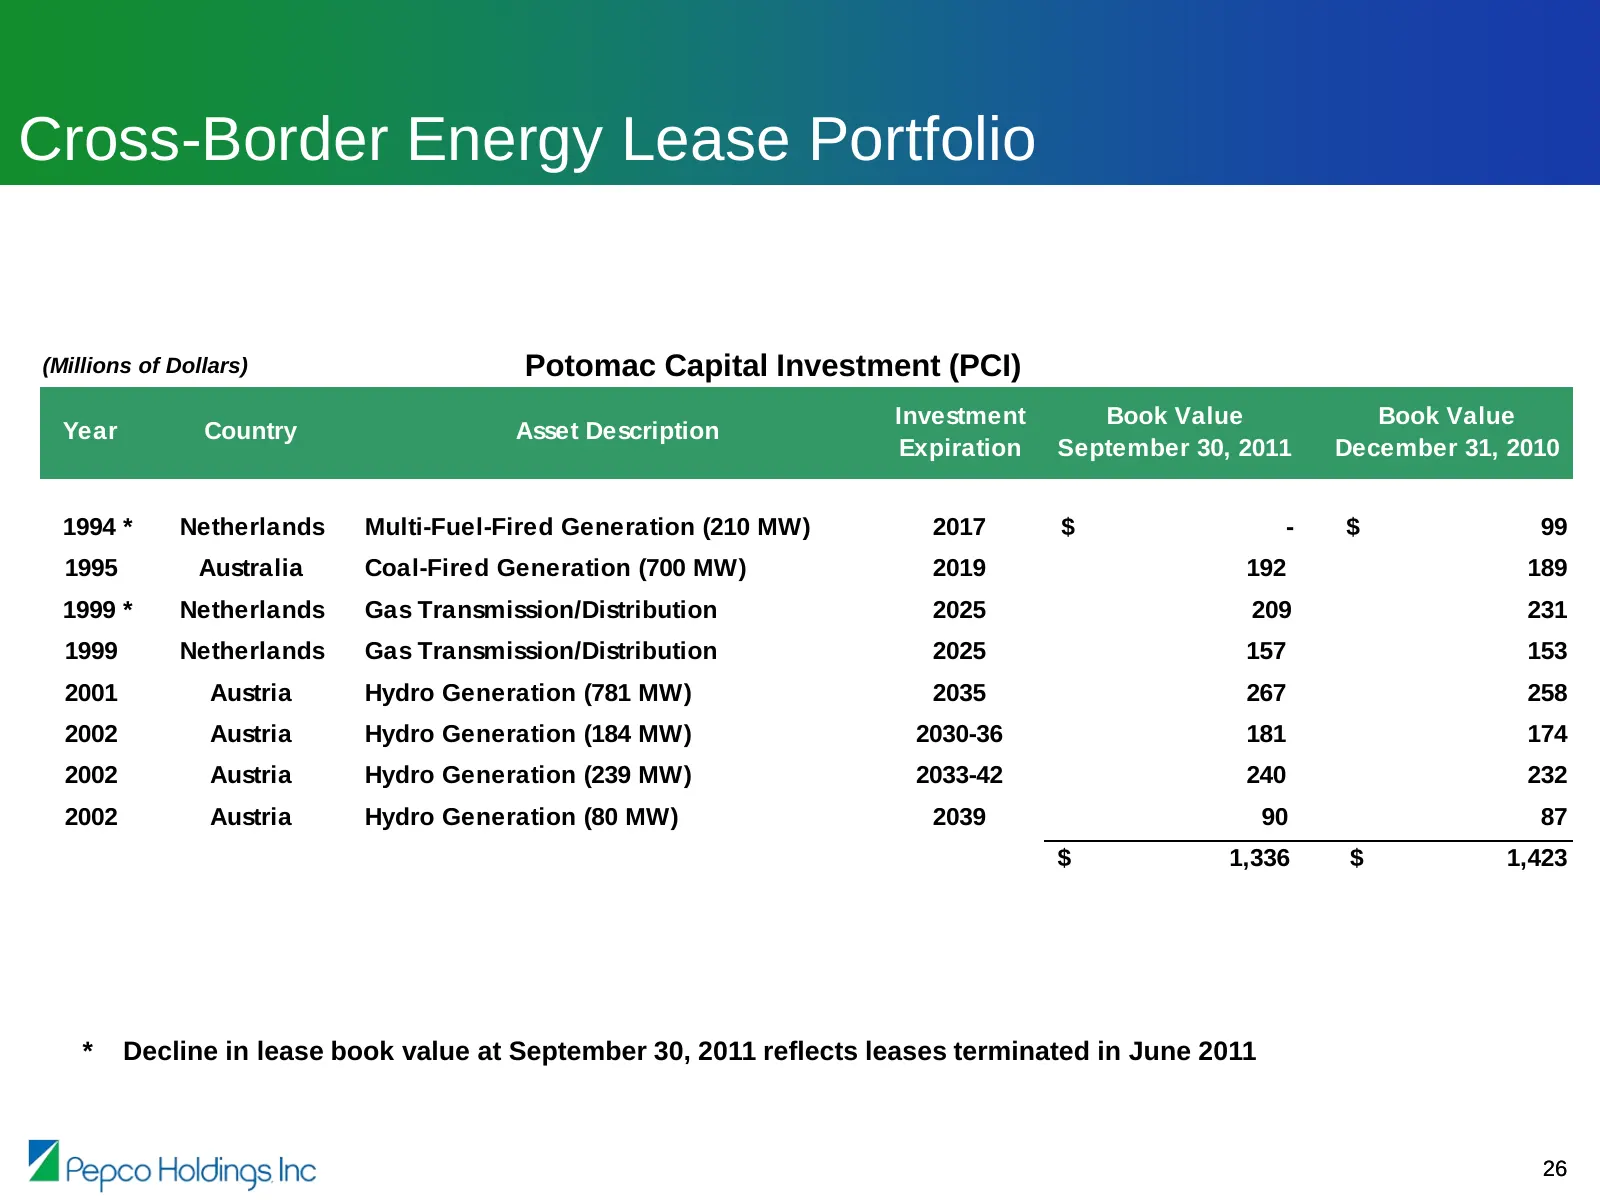
Cross-Border Energy Lease Portfolio (Millions of Dollars) Potomac Capital Investment (PCI) Investment Book Value Book Value Year Country Asset Description Expiration September 30, 2011 December 31, 2010 1994 * Netherlands Multi-Fuel-Fired Generation (210 MW) 2017 $ - $ 99 1995 Australia Coal-Fired G
Slide 28: Distribution Rate Cases – Recent Decision Delmarva Power – Maryland
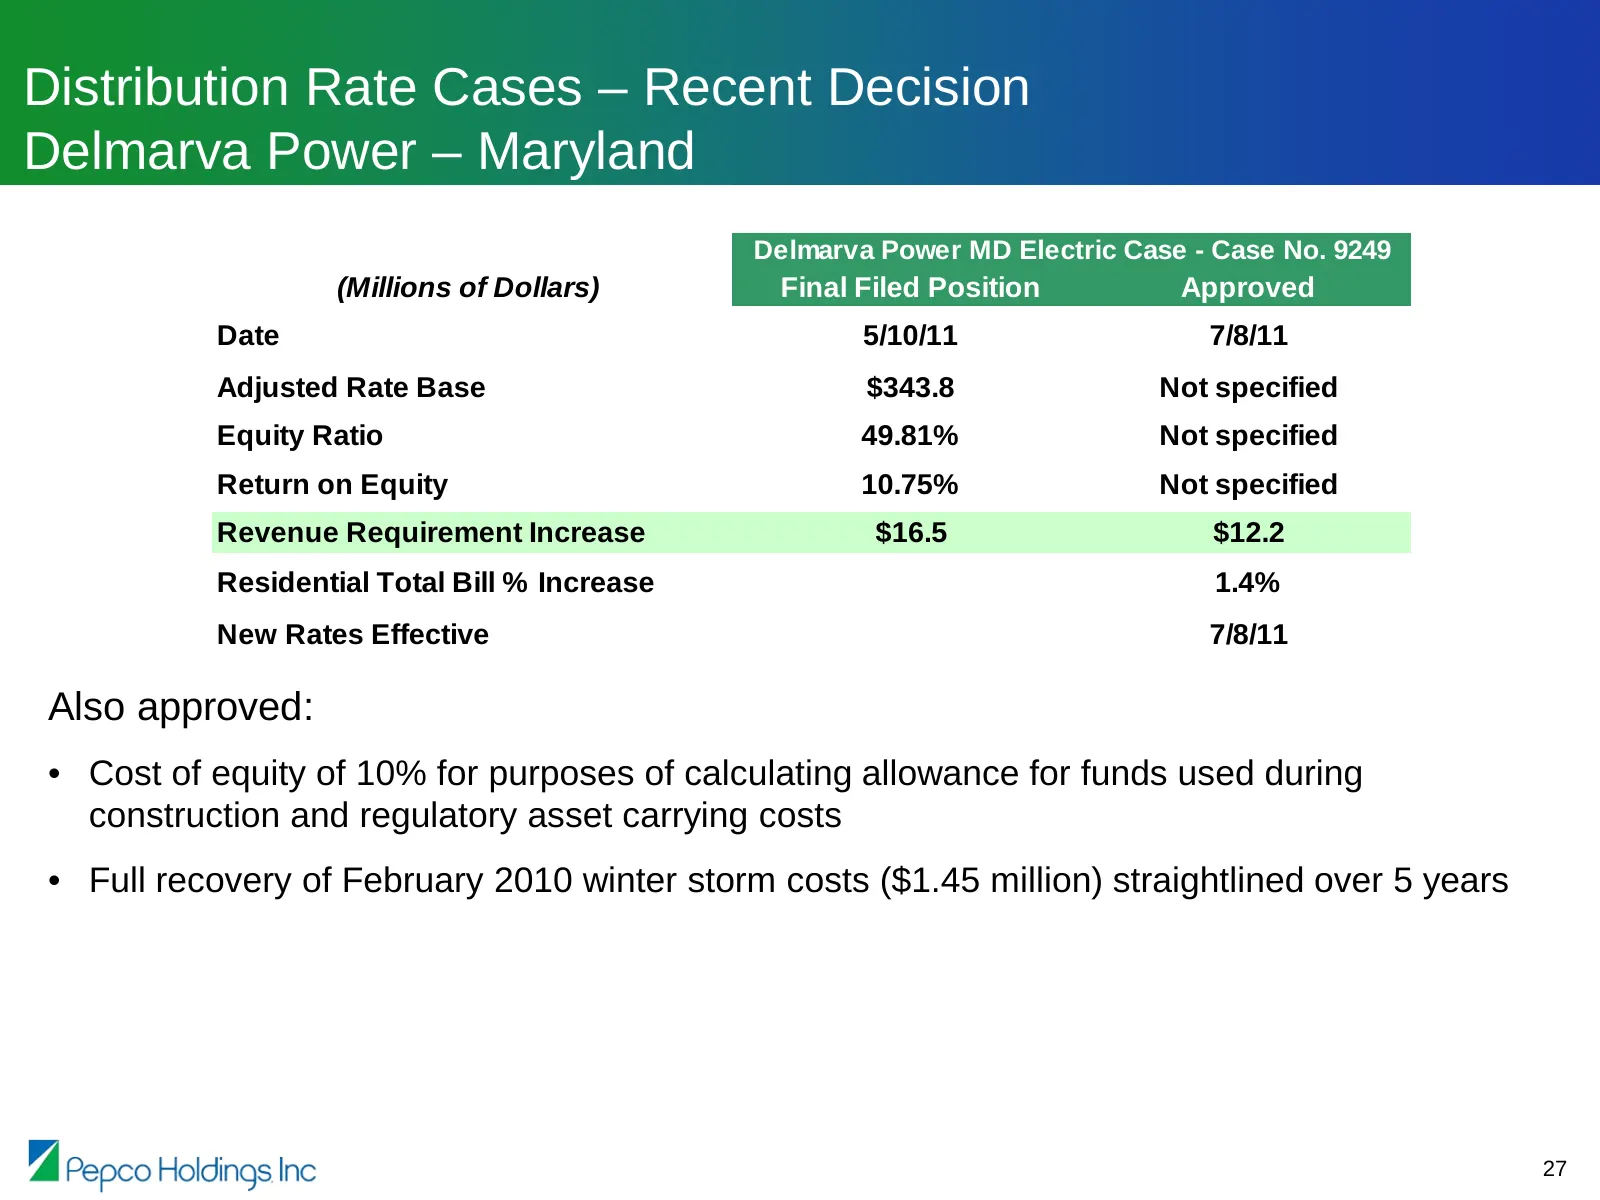
Distribution Rate Cases – Recent Decision Delmarva Power – Maryland Delmarva Power MD Electric Case - Case No. 9249 (Millions of Dollars) Final Filed Position Approved Date 5/10/11 7/8/11 Adjusted Rate Base $343.8 Not specified Equity Ratio 49.81% Not specified Return on Equity 10.75% Not specified
Slide 29: Distribution Rate Cases – Recent Decision Delmarva Power – Delaware Gas
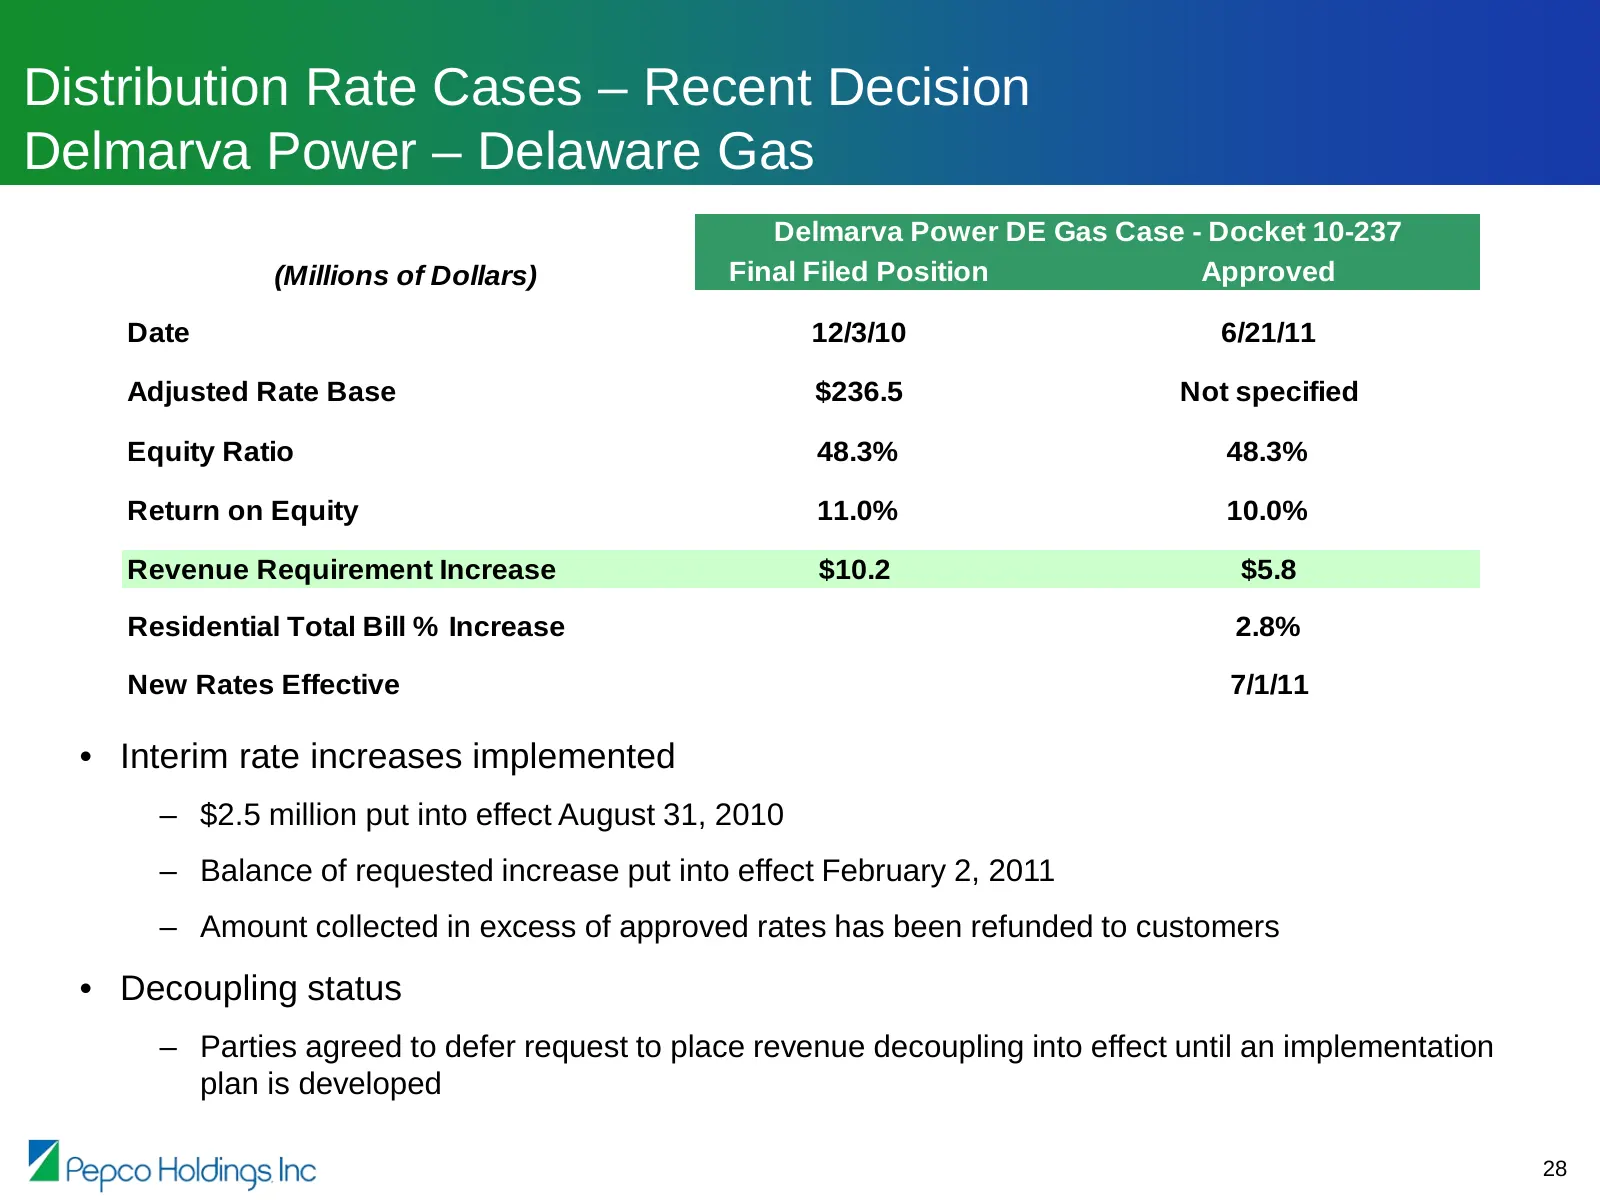
Distribution Rate Cases – Recent Decision Delmarva Power – Delaware Gas Delmarva Power DE Gas Case - Docket 10-237 (Millions of Dollars) Final Filed Position Approved Date 12/3/10 6/21/11 Adjusted Rate Base $236.5 Not specified Equity Ratio 48.3% 48.3% Return on Equity 11.0% 10.0% Revenue Requiremen
Slide 30: Reliability Standards
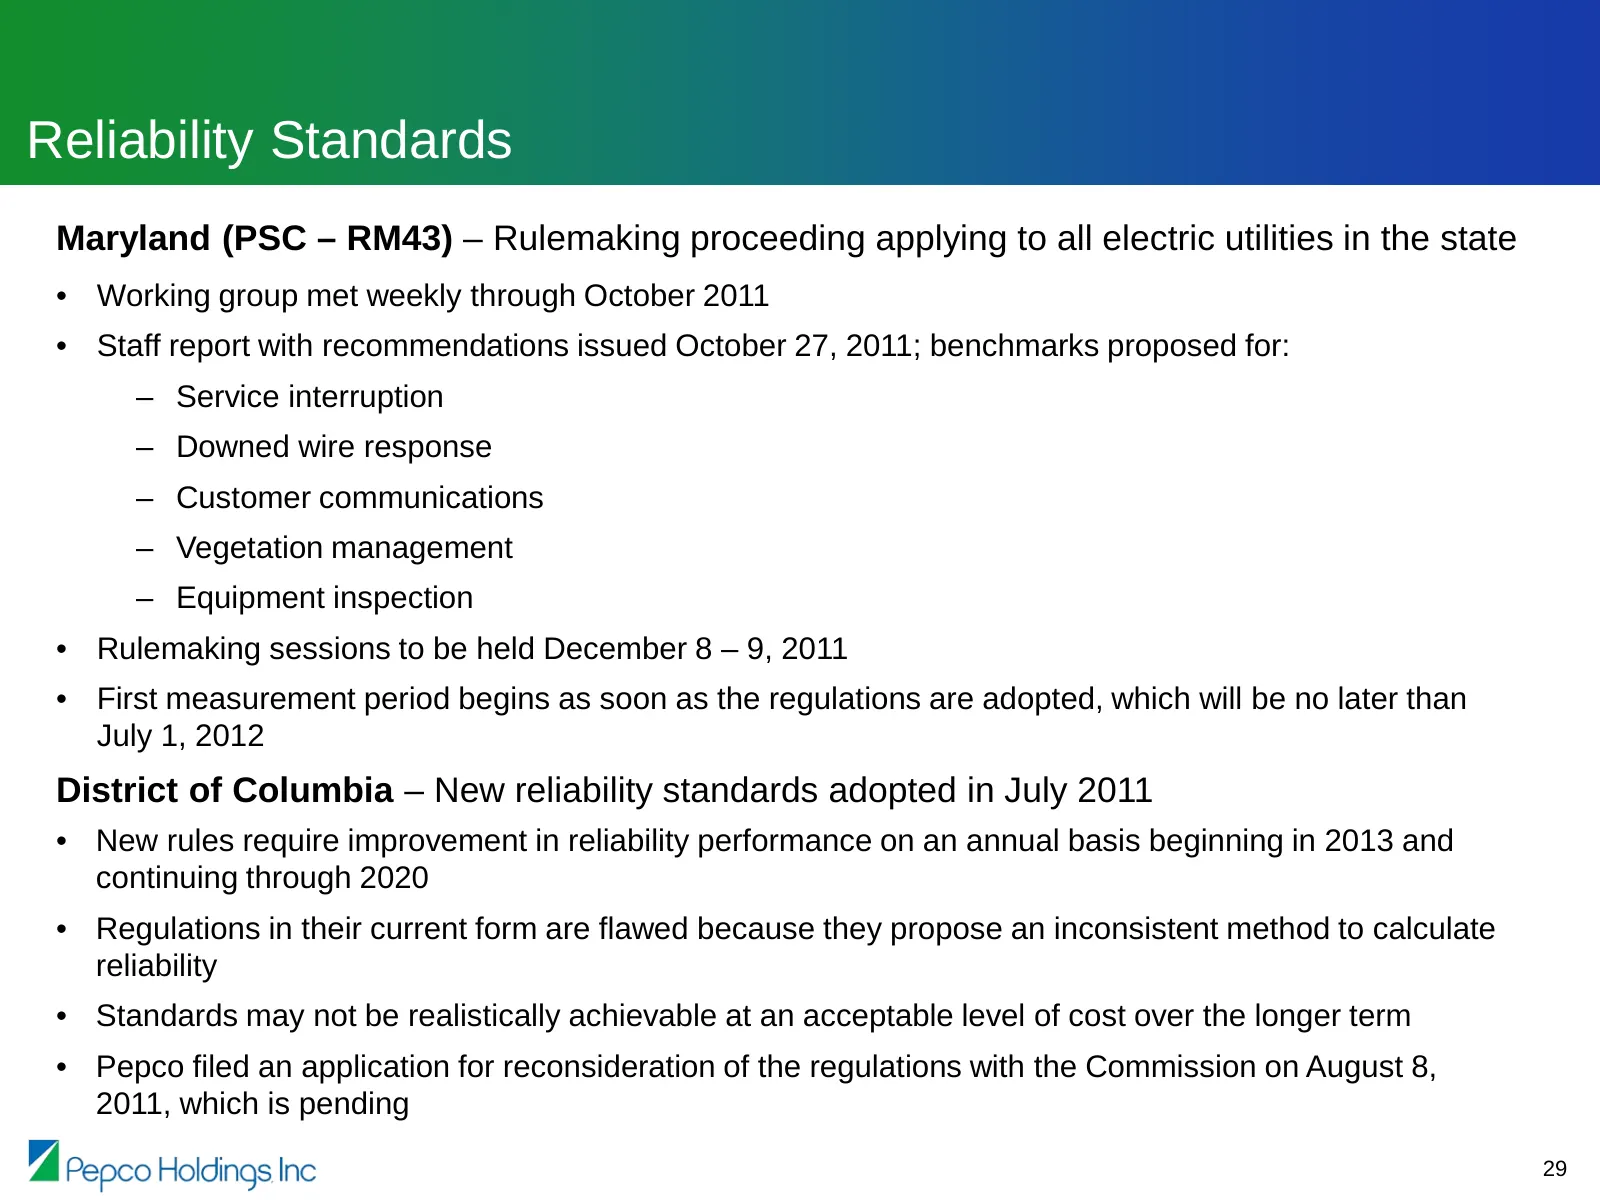
Reliability Standards Maryland (PSC – RM43) – Rulemaking proceeding applying to all electric utilities in the state • Working group met weekly through October 2011 • Staff report with recommendations issued October 27, 2011; benchmarks proposed for: – Service interruption – Downed wire response – Cu
Slide 31: Reconciliation of GAAP Earnings to Earnings Excluding Special Items
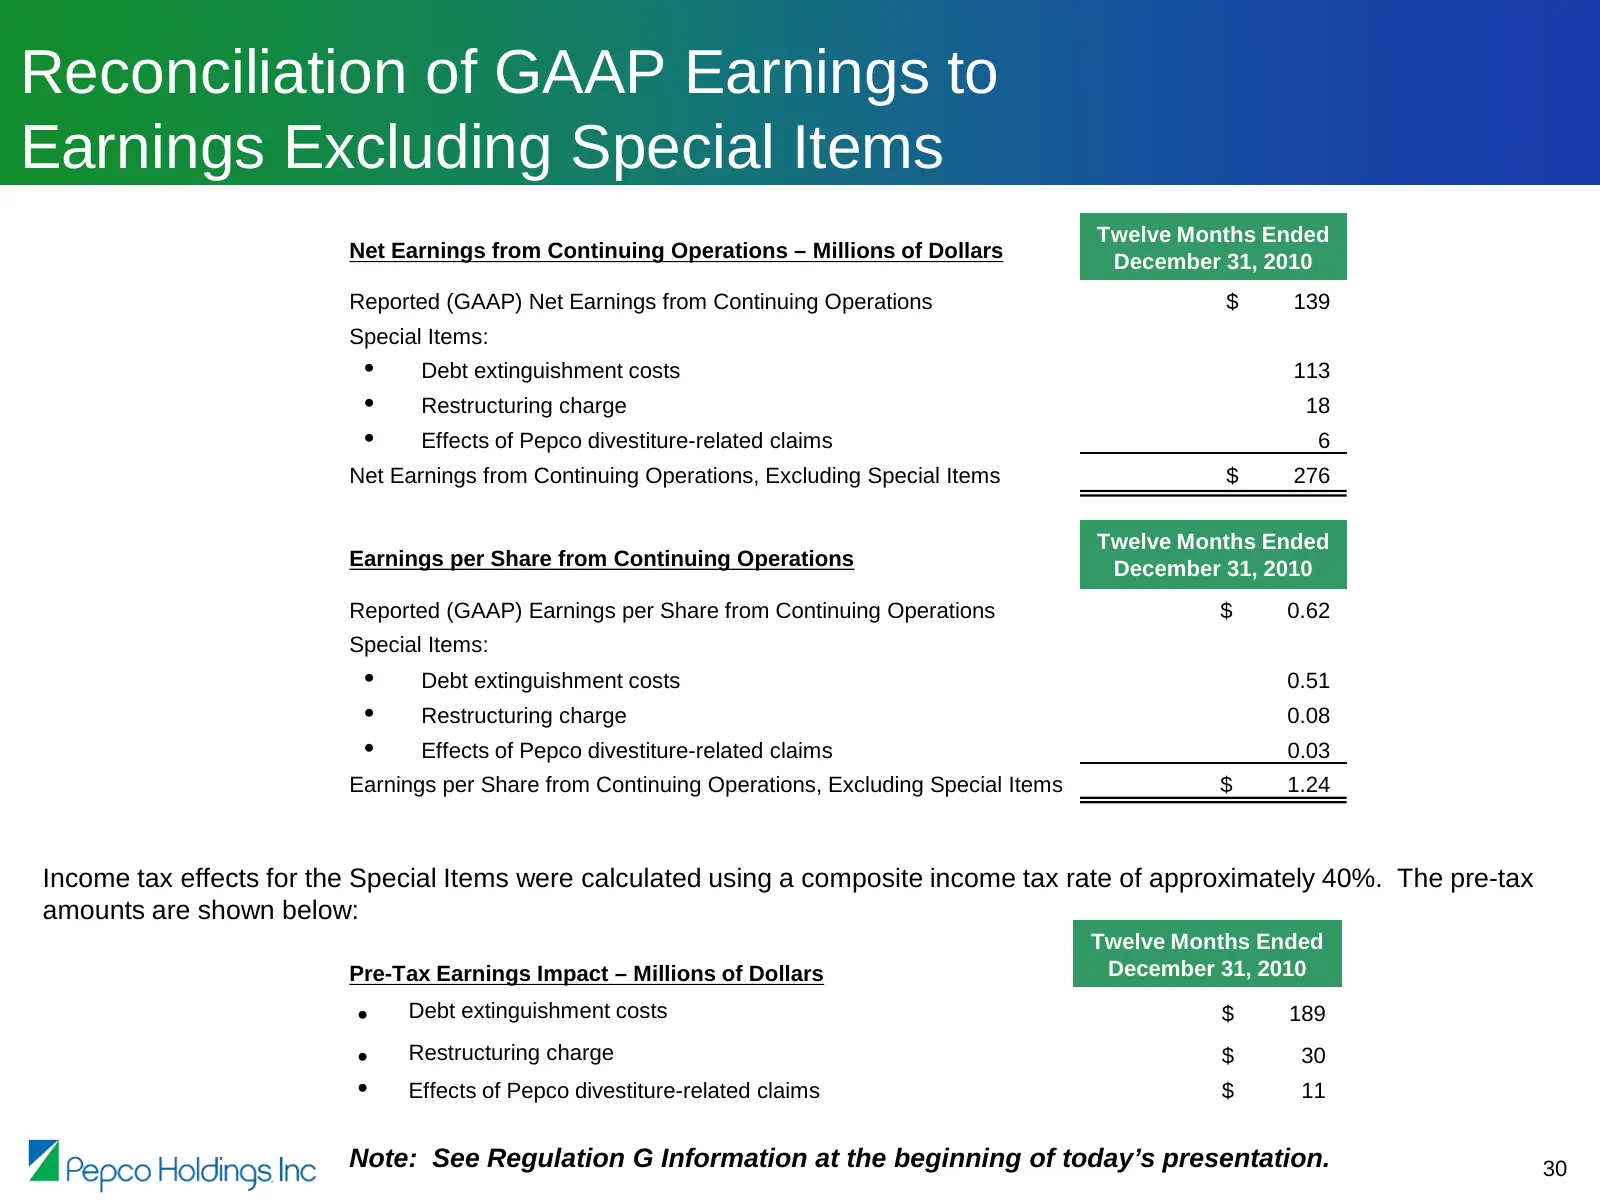
Reconciliation of GAAP Earnings to Earnings Excluding Special Items Twelve Months Ended Net Earnings from Continuing Operations – Millions of Dollars December 31, 2010 Reported (GAAP) Net Earnings from Continuing Operations $ 139 Special Items: • Debt extinguishment costs 113 • Restructuring charge
Source: SEC EDGAR · 8-K filed Dec 6, 2011
More decks from Pepco Holdings Inc
 Merger or Acquisition (August 2014)15 slides · Aug 19, 2014
 Merger or Acquisition (May 2014)44 slides · May 23, 2014
 Q1 2014 Earnings Presentation14 slides · May 7, 2014
 Williams Capital Group Midwest Utilities Seminar (April 2014)35 slides · Apr 9, 2014
 Investor Day (March 2014)109 slides · Mar 21, 2014
 Morgan Stanley Utilities Conference 201439 slides · Feb 28, 2014