Triton International Ltd. · NYSE:TRTN/PA
Triton International — Investor Presentation (February 2019)
26 slides from Triton International's investor presentation, February 2019
Slide 1: Investor Presentation February 2019
INVESTOR PRESENTATION February 2019 1
Slide 2: Disclaimer
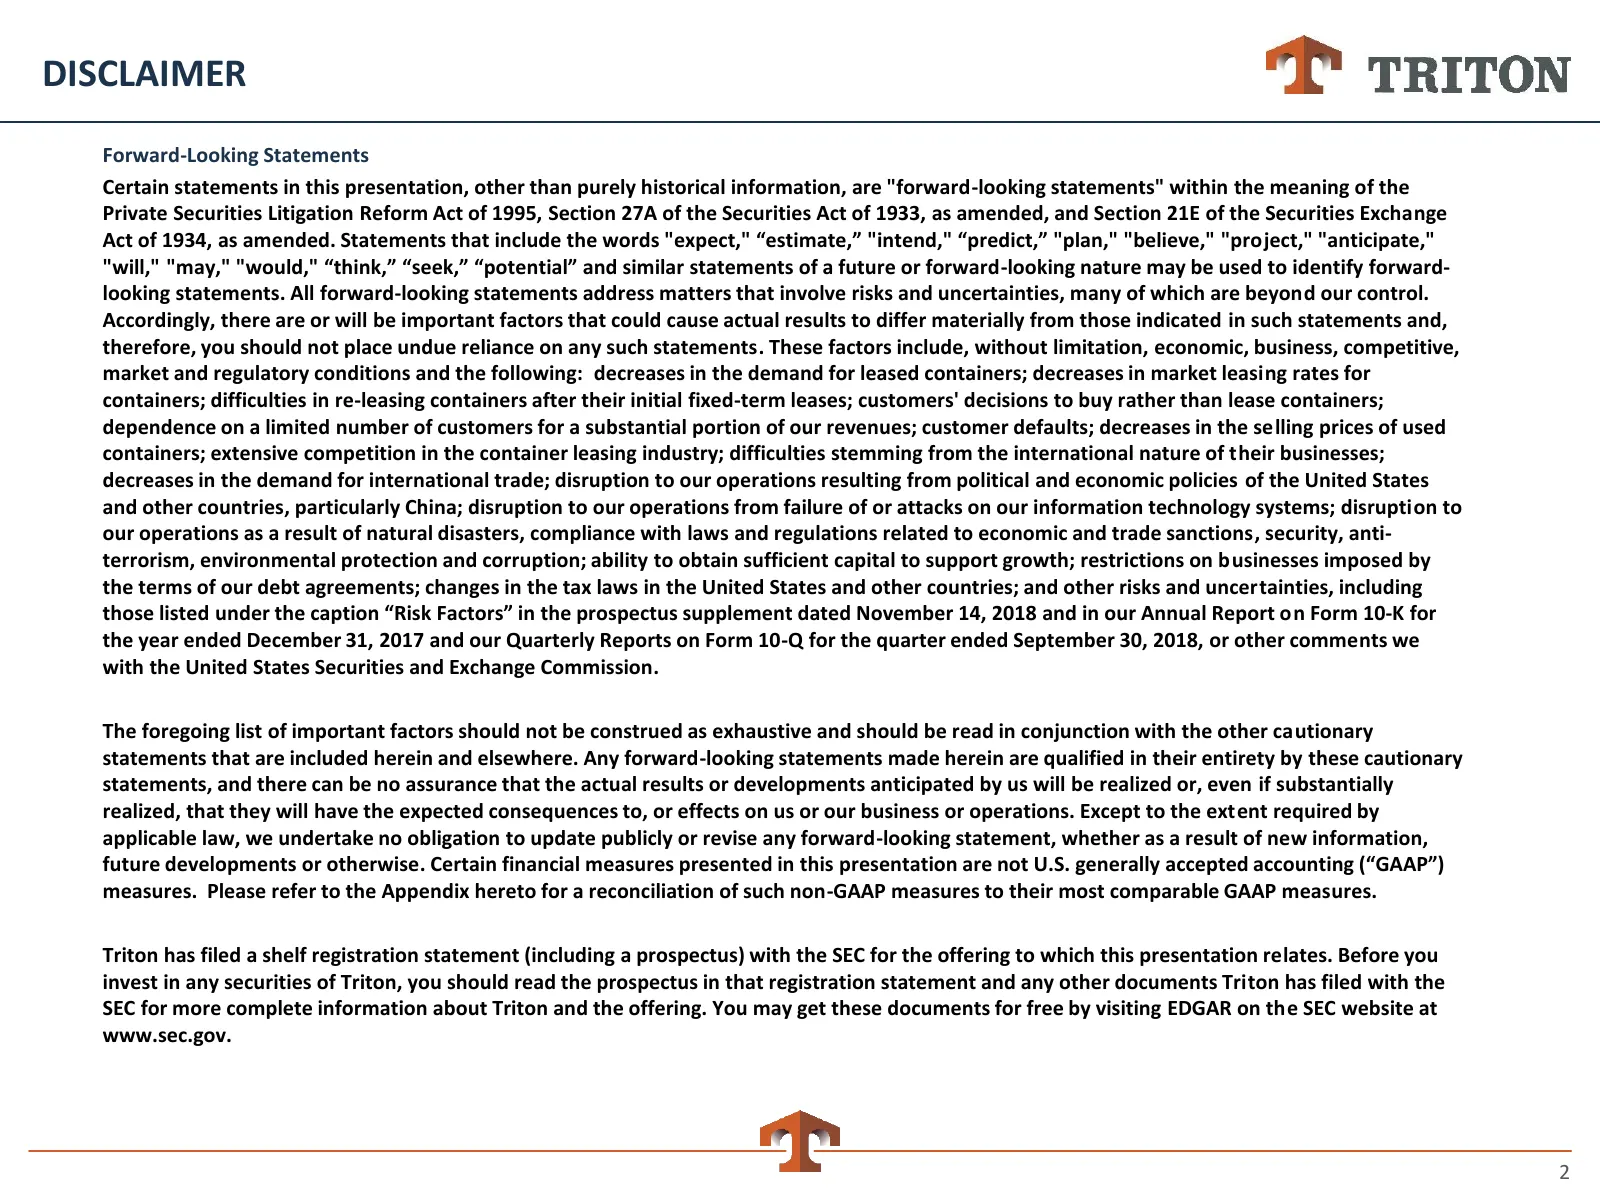
DISCLAIMER Forward-Looking Statements Certain statements in this presentation, other than purely historical information, are "forward-looking statements" within the meaning of the Private Securities Litigation Reform Act of 1995, Section 27A of the Securities Act of 1933, as amended, and Section 21E
Slide 3: Overview
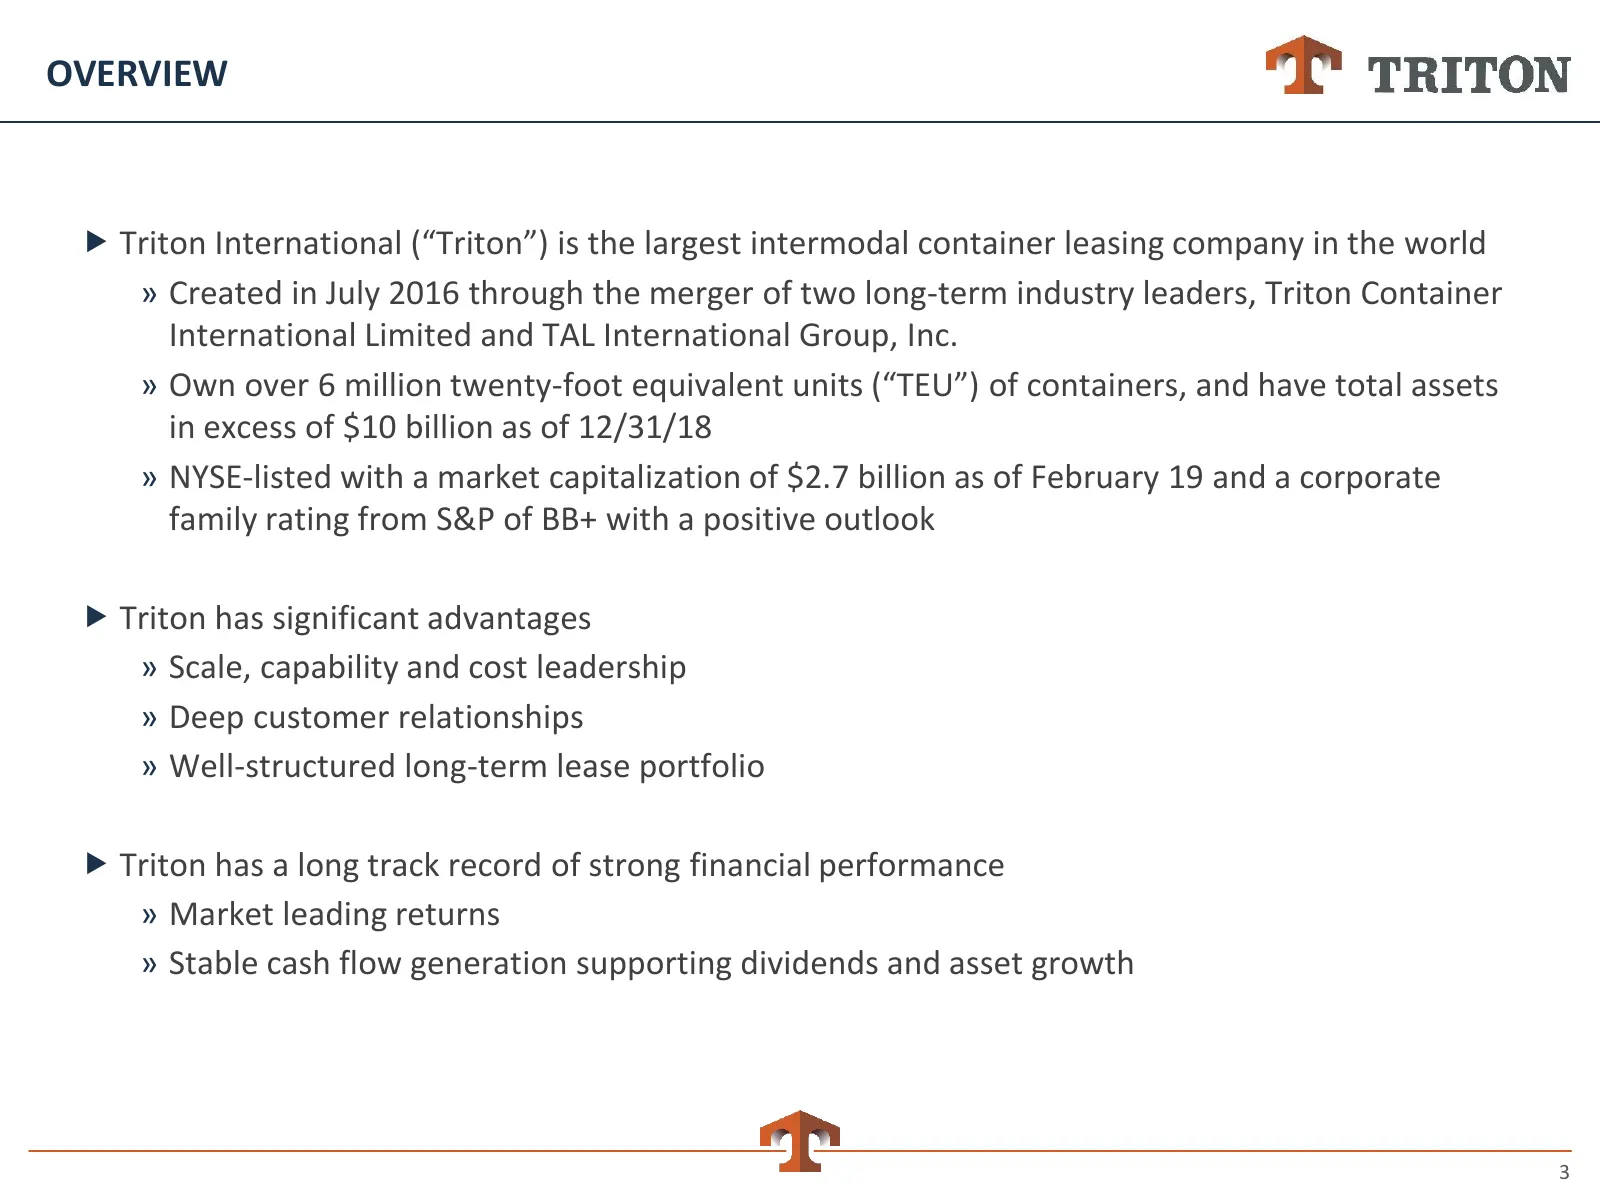
OVERVIEW Triton International (“Triton”) is the largest intermodal container leasing company in the world » Created in July 2016 through the merger of two long-term industry leaders, Triton Container International Limited and TAL International Group, Inc. » Own over 6 million twenty-foot equivalen
Slide 4: Corporate Snapshot
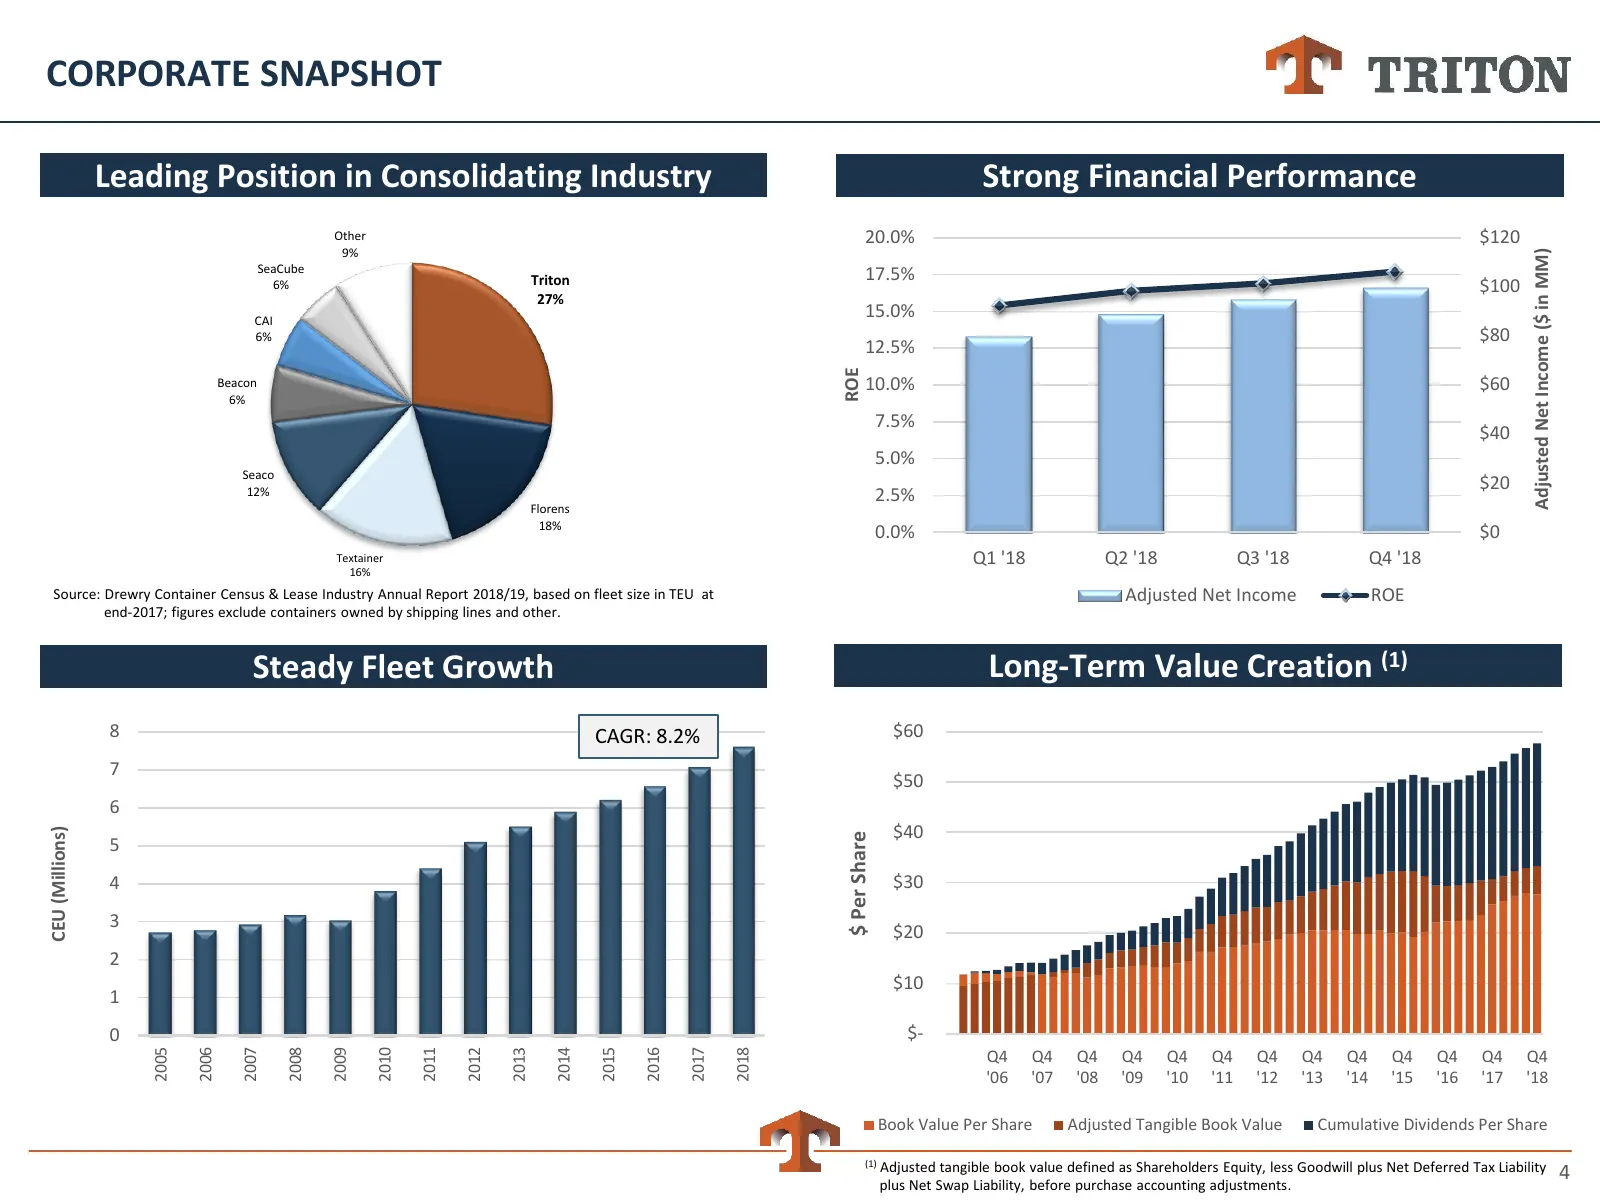
CORPORATE SNAPSHOT Leading Position in Consolidating Industry Strong Financial Performance Other 20.0% $120 9% Adjusted Net Income ($ in MM) SeaCube Triton 17.5% 6% $100 27% CAI 15.0% 6% $80 12.5% ROE Beacon 10.0% $60 6% 7.5% $40 5.0% Seaco 12% $20 2.5% Florens 18% 0.0% $0 Textainer Q1 '18 Q2 '18 Q3
Slide 5: Triton Container Fleet and Lease Portfolio
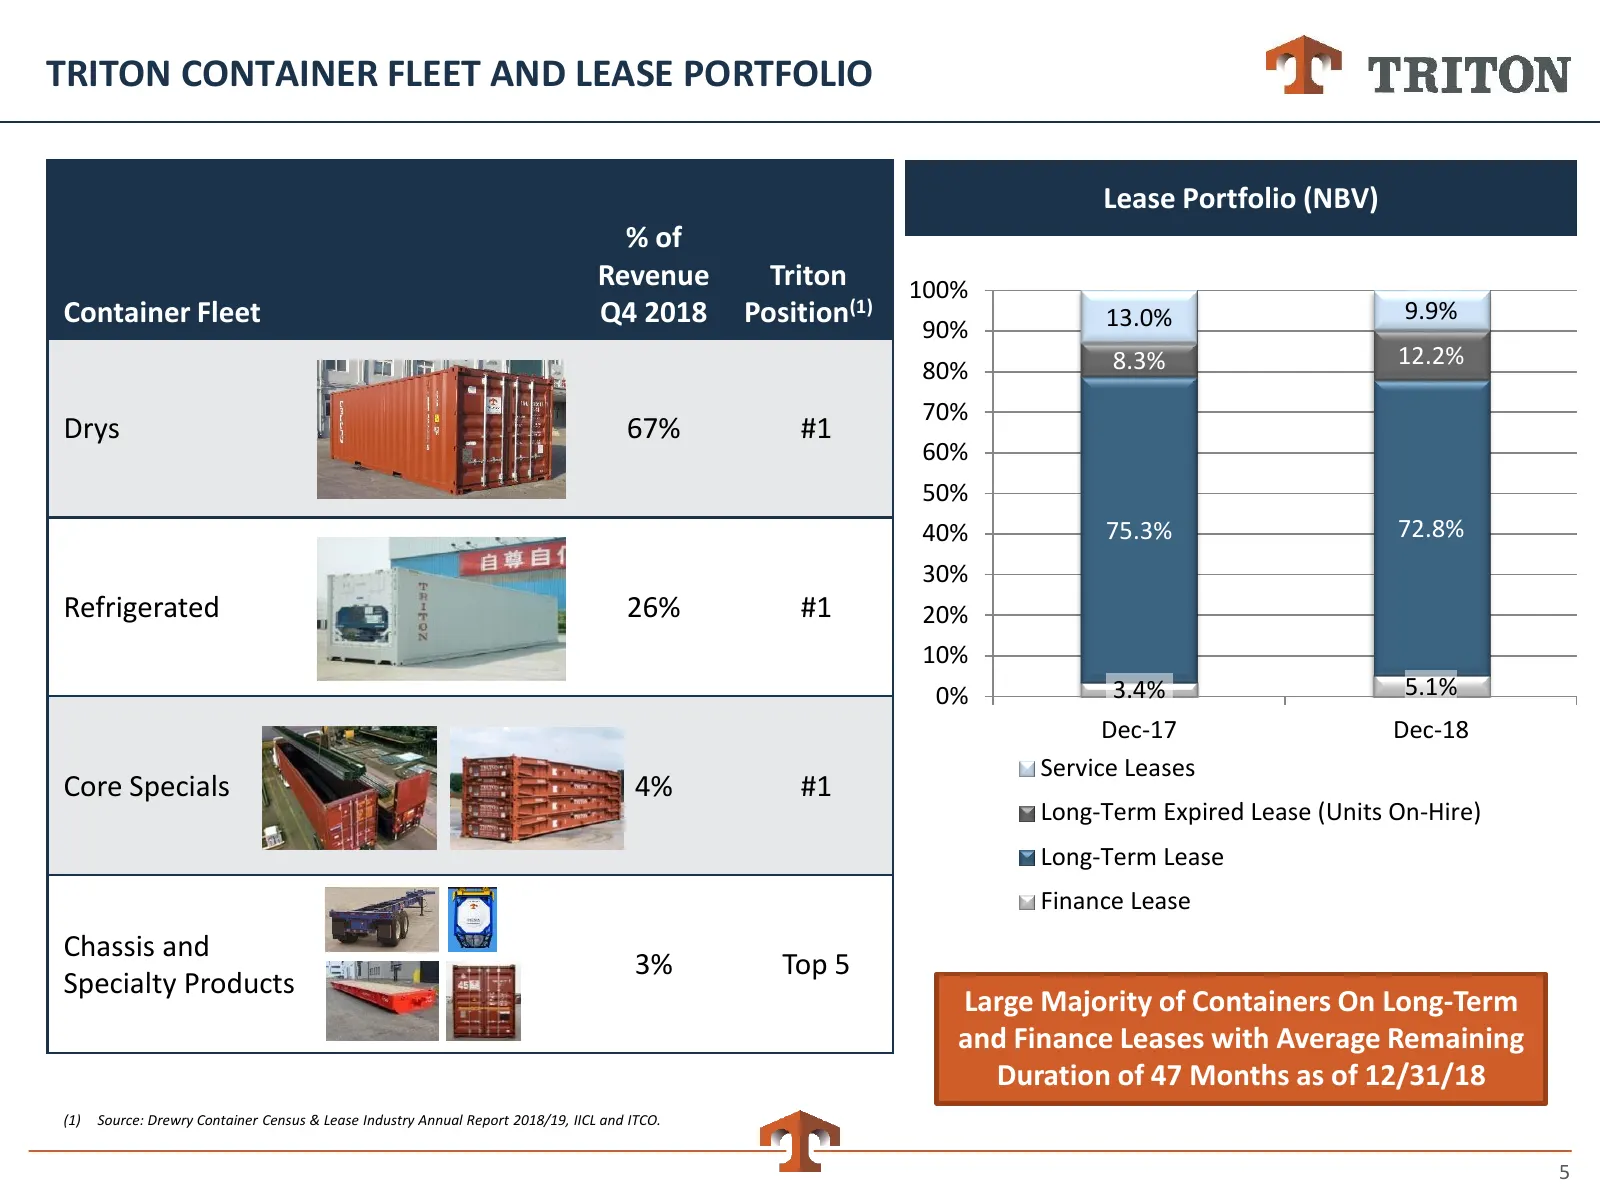
TRITON CONTAINER FLEET AND LEASE PORTFOLIO Lease Portfolio (NBV) % of Revenue Triton 100% Container Fleet Q4 2018 Position(1) 13.0% 9.9% 90% 8.3% 12.2% 80% 70% Drys 67% #1 60% 50% 40% 75.3% 72.8% 30% Refrigerated 26% #1 20% 10% 0% 3.4% 5.1% Dec-17 Dec-18 Service Leases Core Specials 4% #1 Long-Term
Slide 6: Operating Performance
OPERATING PERFORMANCE Triton’s operating performance was strong in 2018 » Container demand supported by solid trade growth and increased reliance on leasing » Utilization averaged 98.6% » Average used dry container sale prices increased 21% We achieved another successful year of value-added inve
Slide 7: Containerized Trade Growth Projected to Remain Solid
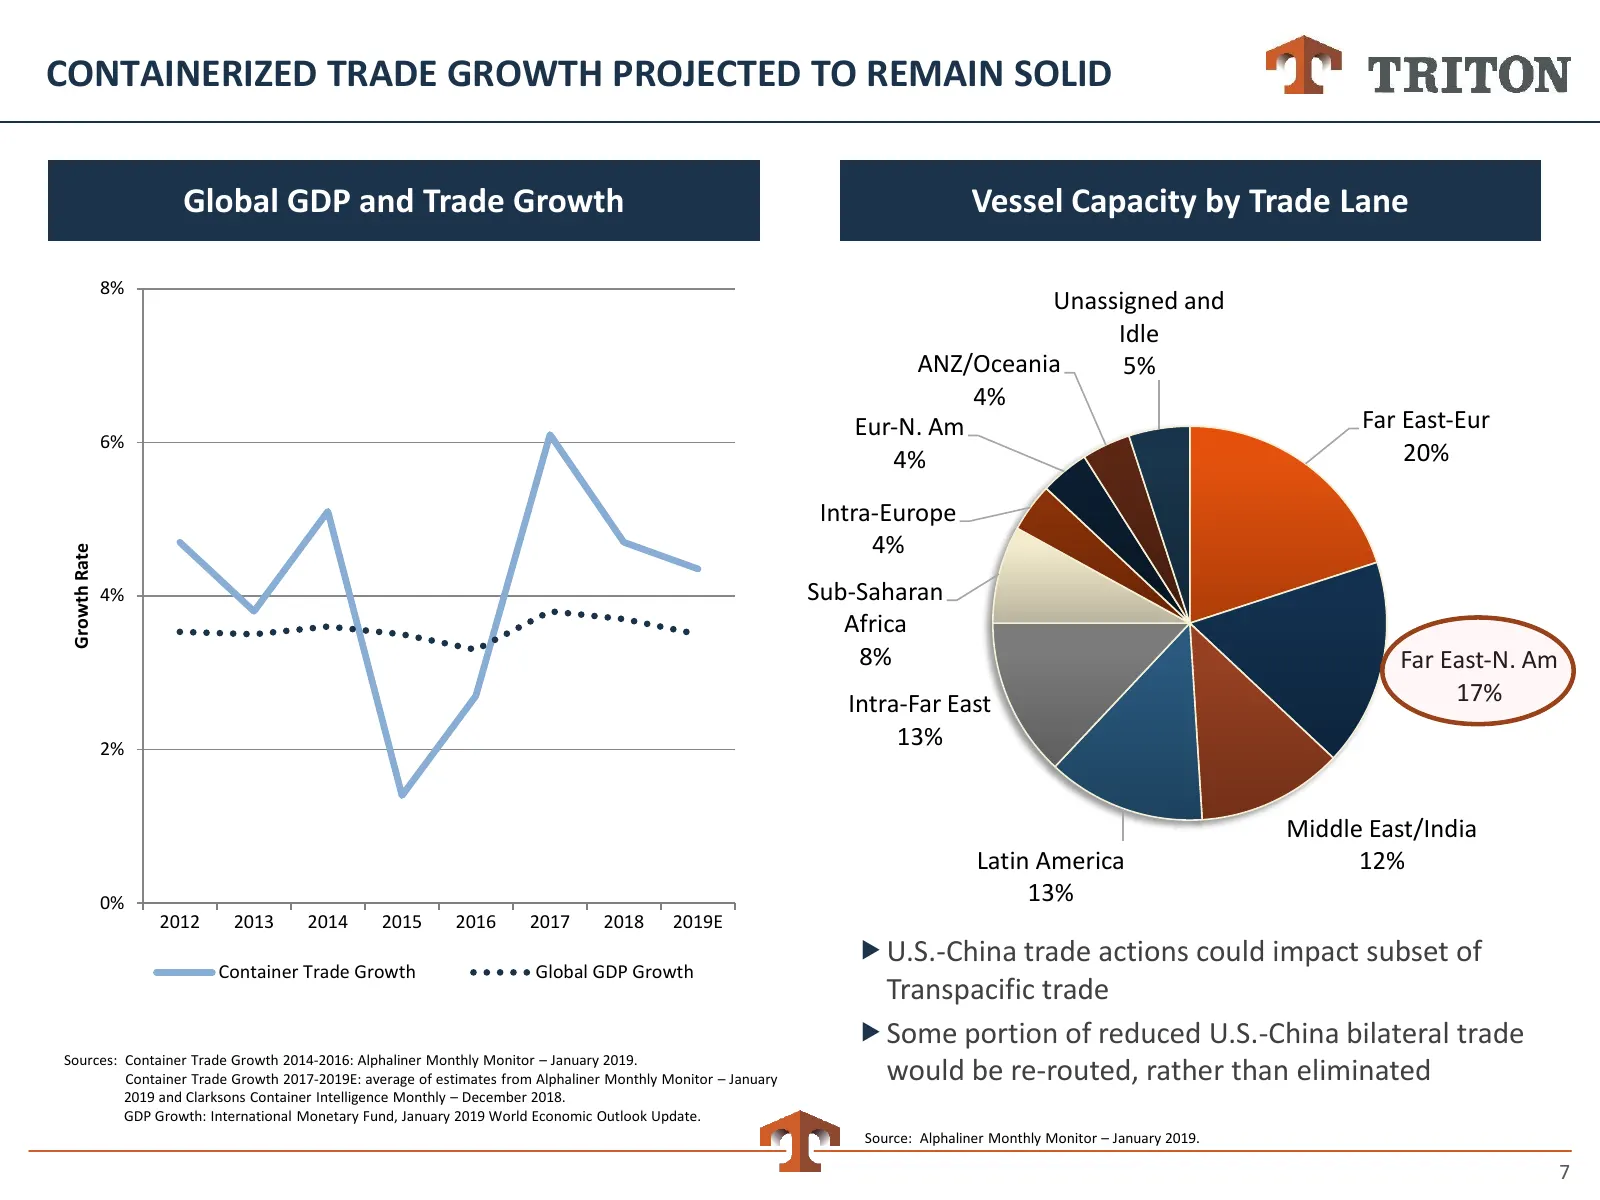
CONTAINERIZED TRADE GROWTH PROJECTED TO REMAIN SOLID Global GDP and Trade Growth Vessel Capacity by Trade Lane 8% Unassigned and Idle ANZ/Oceania 5% 4% Eur‐N. Am Far East‐Eur 6% 4% 20% Intra‐Europe 4% Growth Rate 4% Sub‐Saharan Africa 8% Far East‐N. Am Intra‐Far East 17% 2% 13% Middle East/India Lat
Slide 8: Conversion to Leasing Generates Incremental Demand
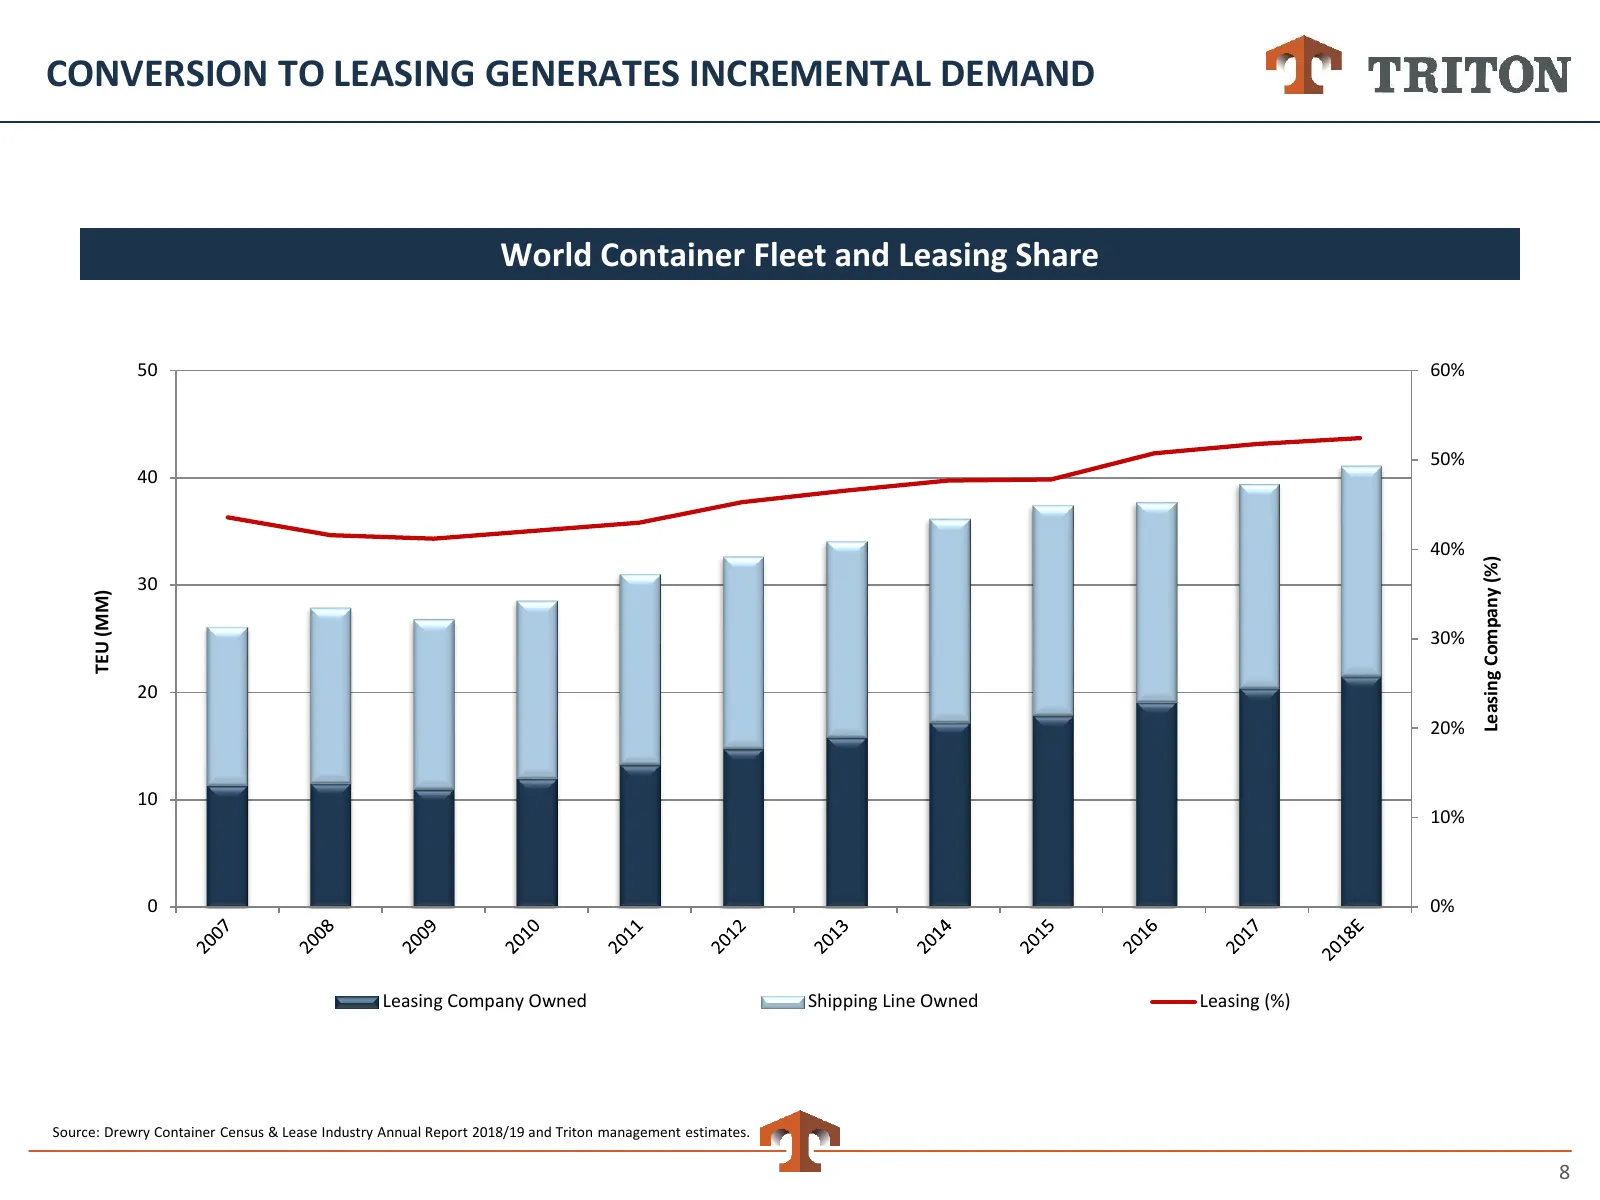
CONVERSION TO LEASING GENERATES INCREMENTAL DEMAND World Container Fleet and Leasing Share 50 60% 50% 40 40% Leasing Company (%) 30 TEU (MM) 30% 20 20% 10 10% 0 0% Leasing Company Owned Shipping Line Owned Leasing (%) Source: Drewry Container Census & Lease Industry Annual Report 2018/19 and Triton
Slide 9: Triton's Key Operating Metrics
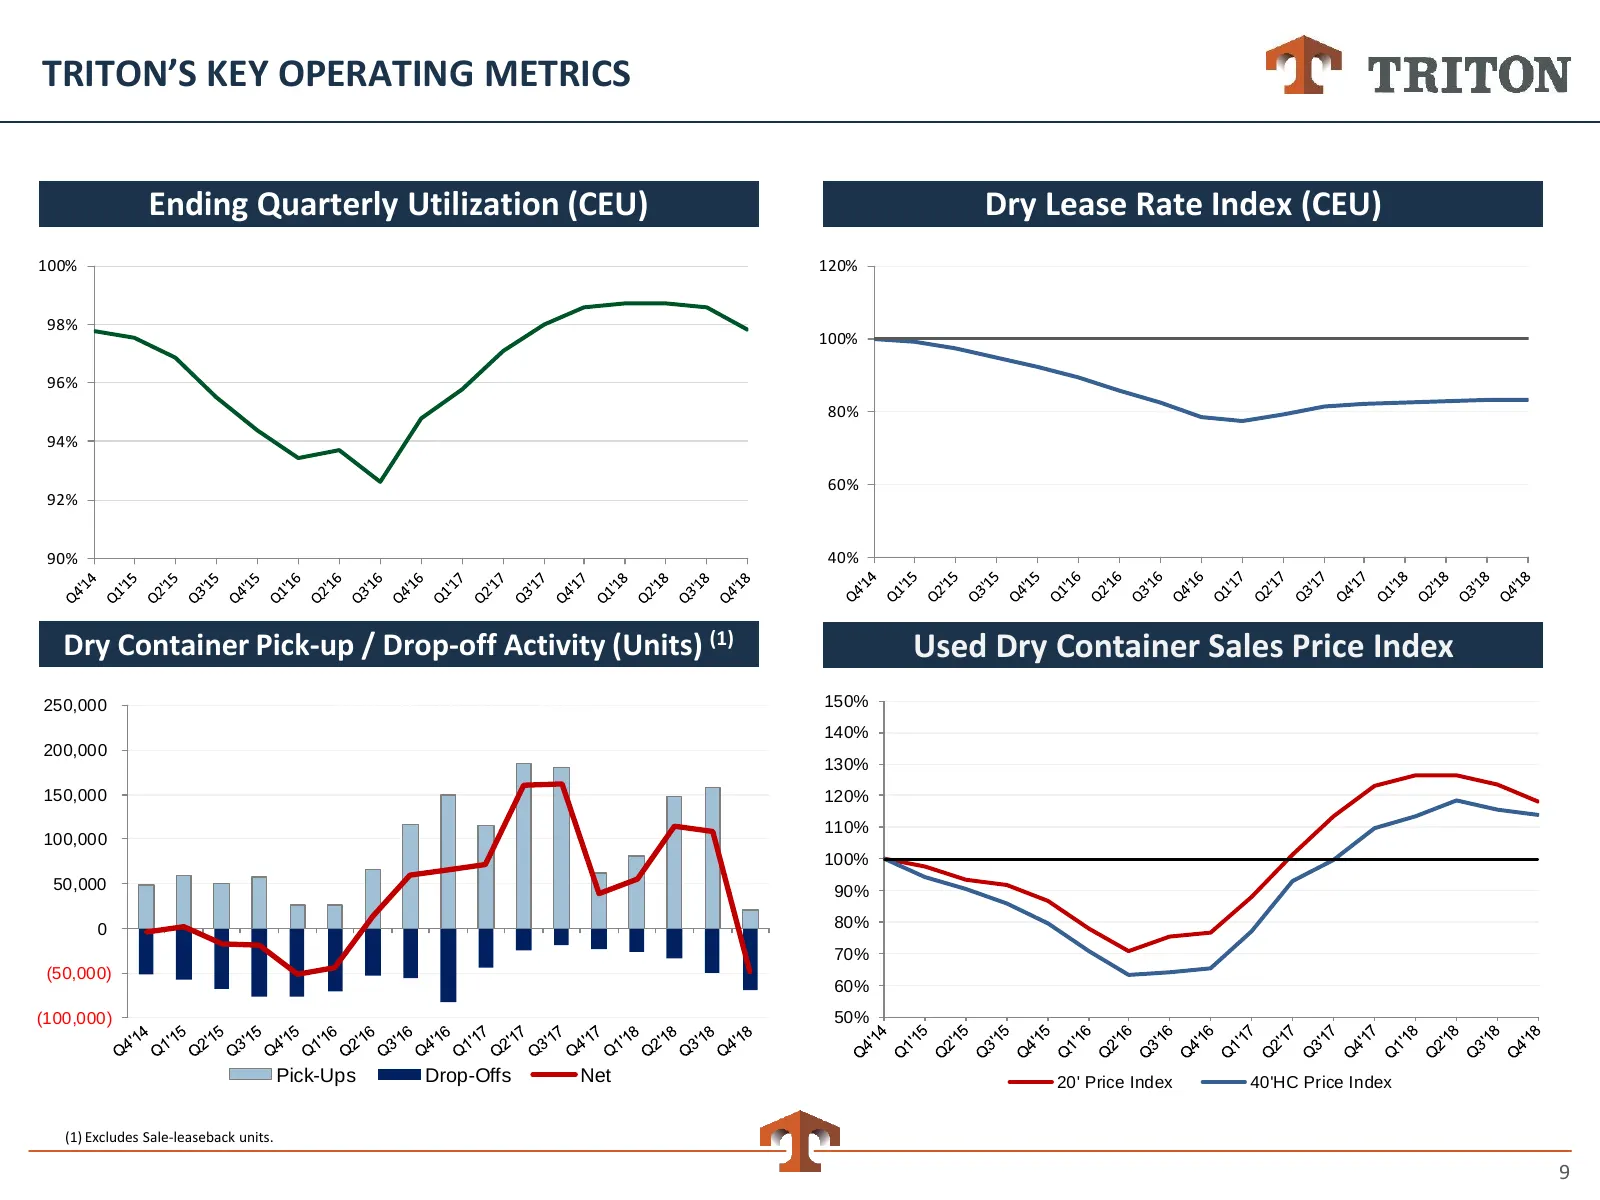
TRITON’S KEY OPERATING METRICS Ending Quarterly Utilization (CEU) Dry Lease Rate Index (CEU) Ending Quarterly Utilization (CEU) Overall Lease Rate Index (CEU) 100% 120% 98% 100% 96% 80% 94% 60% 92% 90% 40% Dry Container Pick-up / Drop-off Activity (Units) (1) Used Dry Container Sales Price Index Dry
Slide 10: Supply Conditions Well Controlled
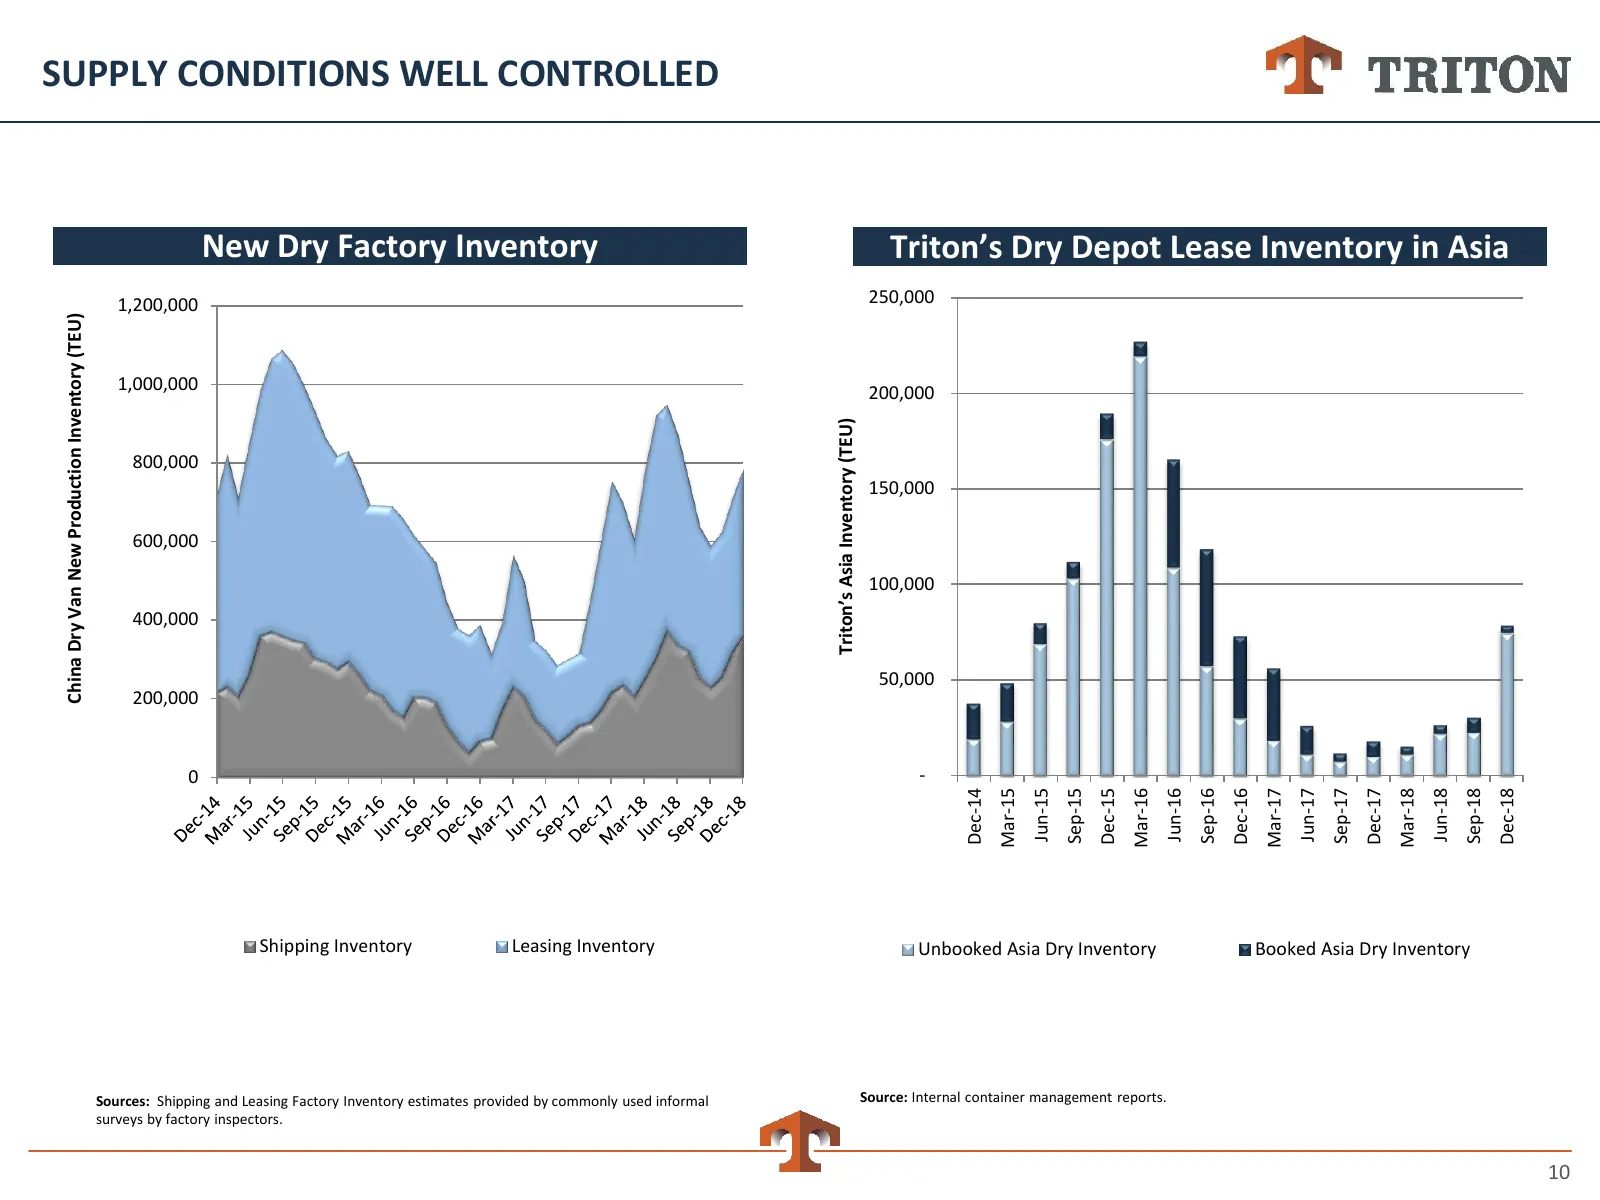
SUPPLY CONDITIONS WELL CONTROLLED New Dry Factory Inventory Triton’s Dry Depot Lease Inventory in Asia 1,200,000 250,000 China Dry Van New Production Inventory (TEU) 1,000,000 200,000 Triton’s Asia Inventory (TEU) 800,000 150,000 600,000 100,000 400,000 50,000 200,000 0 - Jun-15 Jun-16 Jun-17 Jun-18
Slide 11: Attractive Fundamentals Reinforced by Triton Advantages
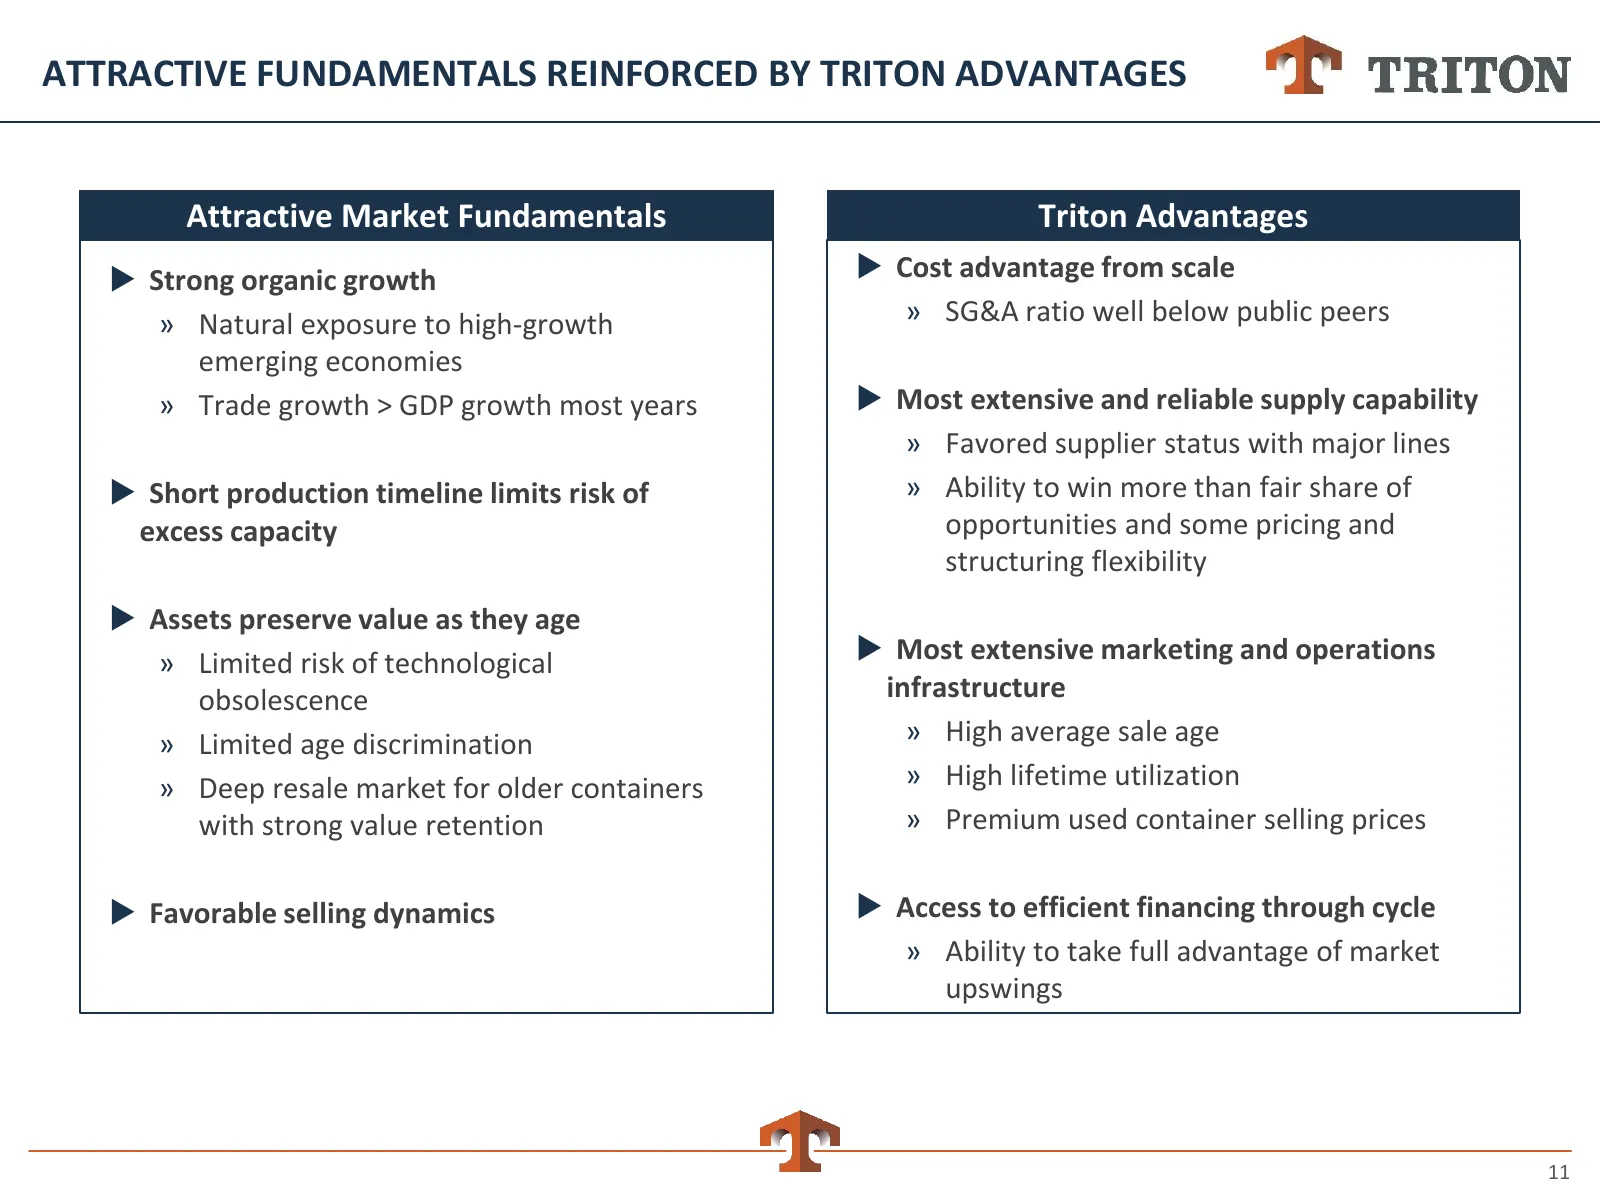
ATTRACTIVE FUNDAMENTALS REINFORCED BY TRITON ADVANTAGES Attractive Market Fundamentals Triton Advantages Strong organic growth Cost advantage from scale » Natural exposure to high-growth » SG&A ratio well below public peers emerging economies » Trade growth > GDP growth most years Most extensi
Slide 12: Customer Consolidation Favors Largest Suppliers
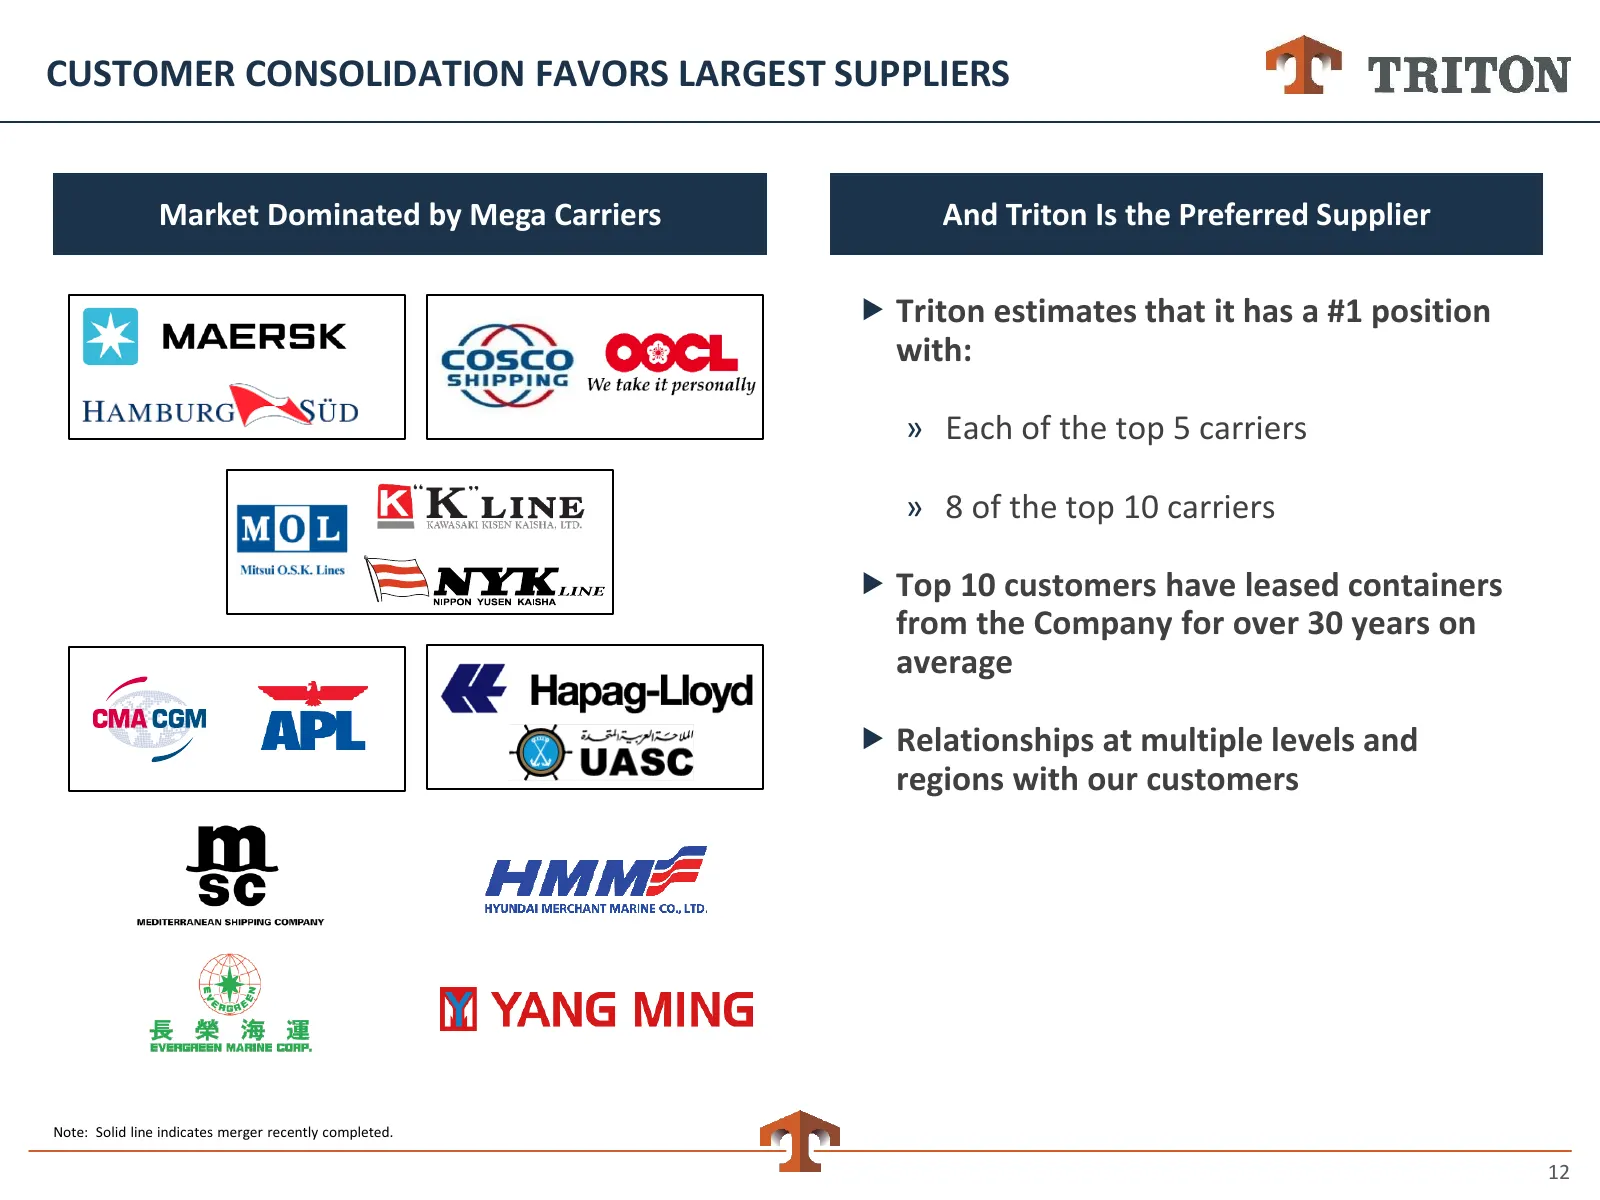
CUSTOMER CONSOLIDATION FAVORS LARGEST SUPPLIERS Market Dominated by Mega Carriers And Triton Is the Preferred Supplier Triton estimates that it has a #1 position with: » Each of the top 5 carriers » 8 of the top 10 carriers Top 10 customers have leased containers from the Company for over 30 yea
Slide 13: Scale and Growth Advantages
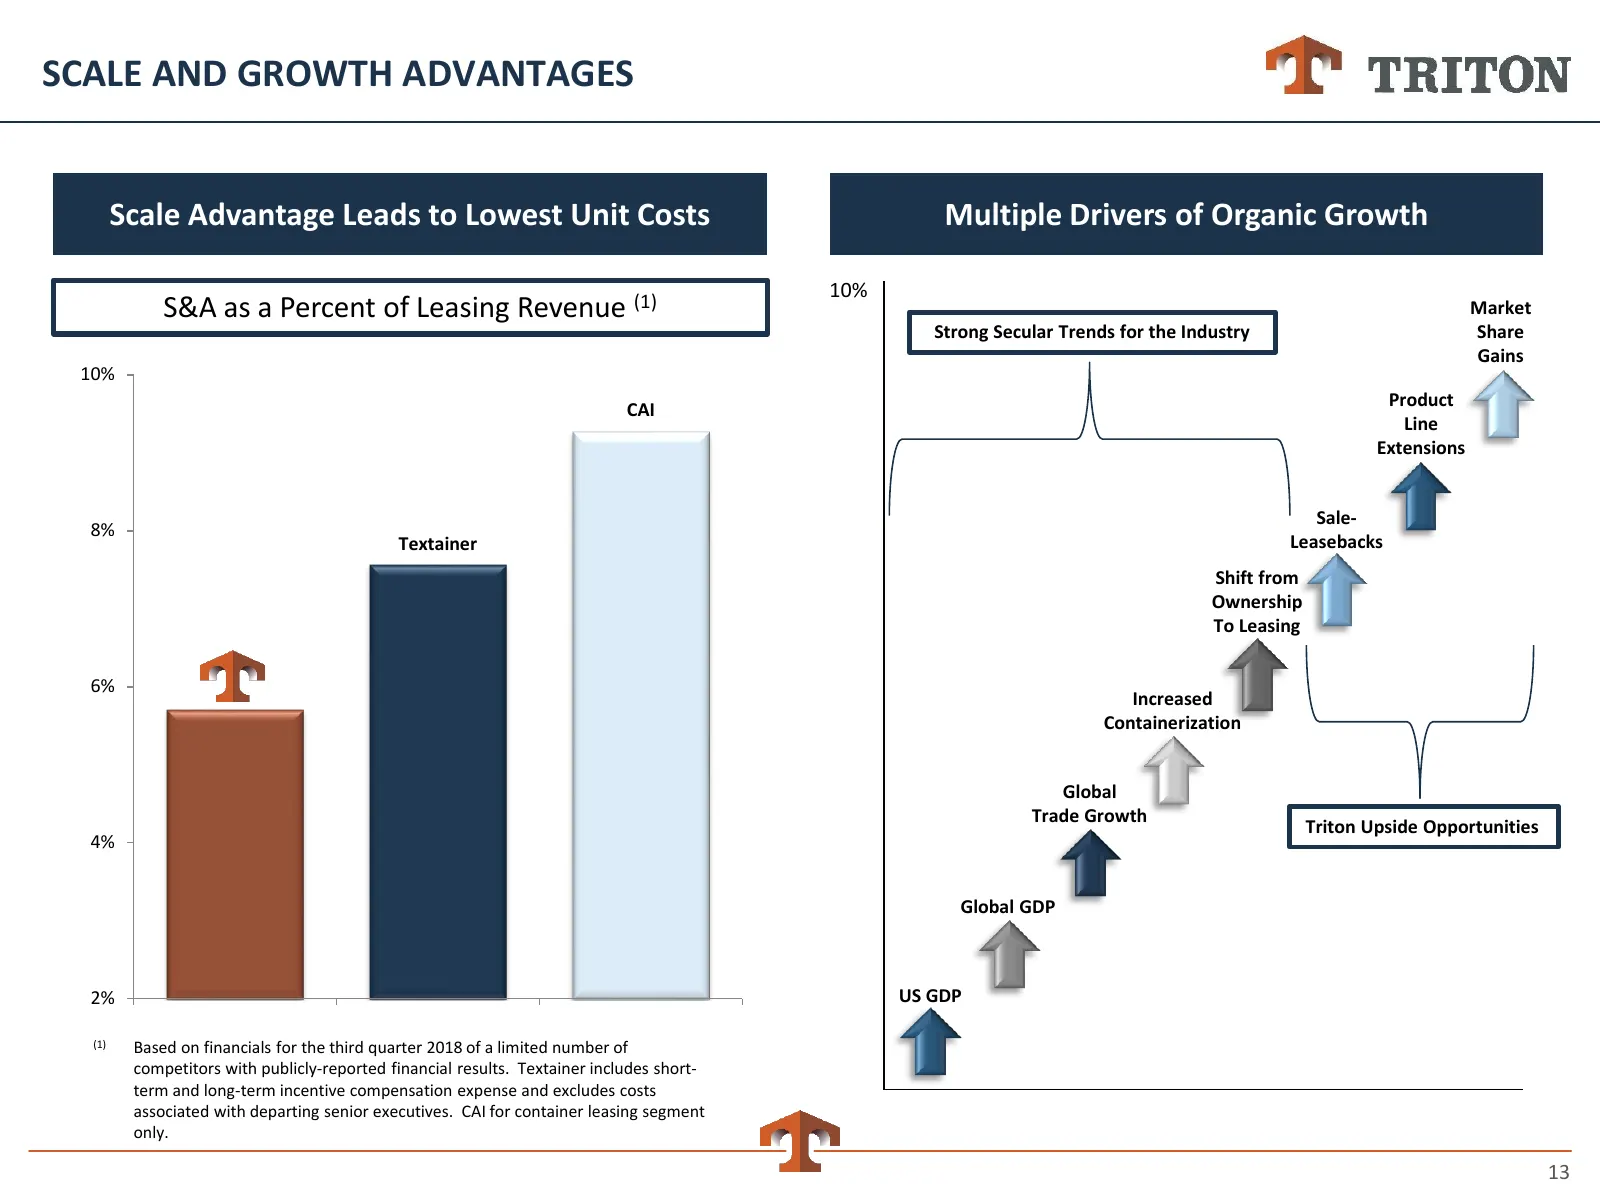
SCALE AND GROWTH ADVANTAGES Scale Advantage Leads to Lowest Unit Costs Multiple Drivers of Organic Growth 10% S&A as a Percent of Leasing Revenue (1) Market Strong Secular Trends for the Industry Share Gains 10% Product CAI Line Extensions Sale- 8% Textainer Leasebacks Shift from Ownership To Leasin
Slide 14: Consolidated Statements of Adjusted Net Income
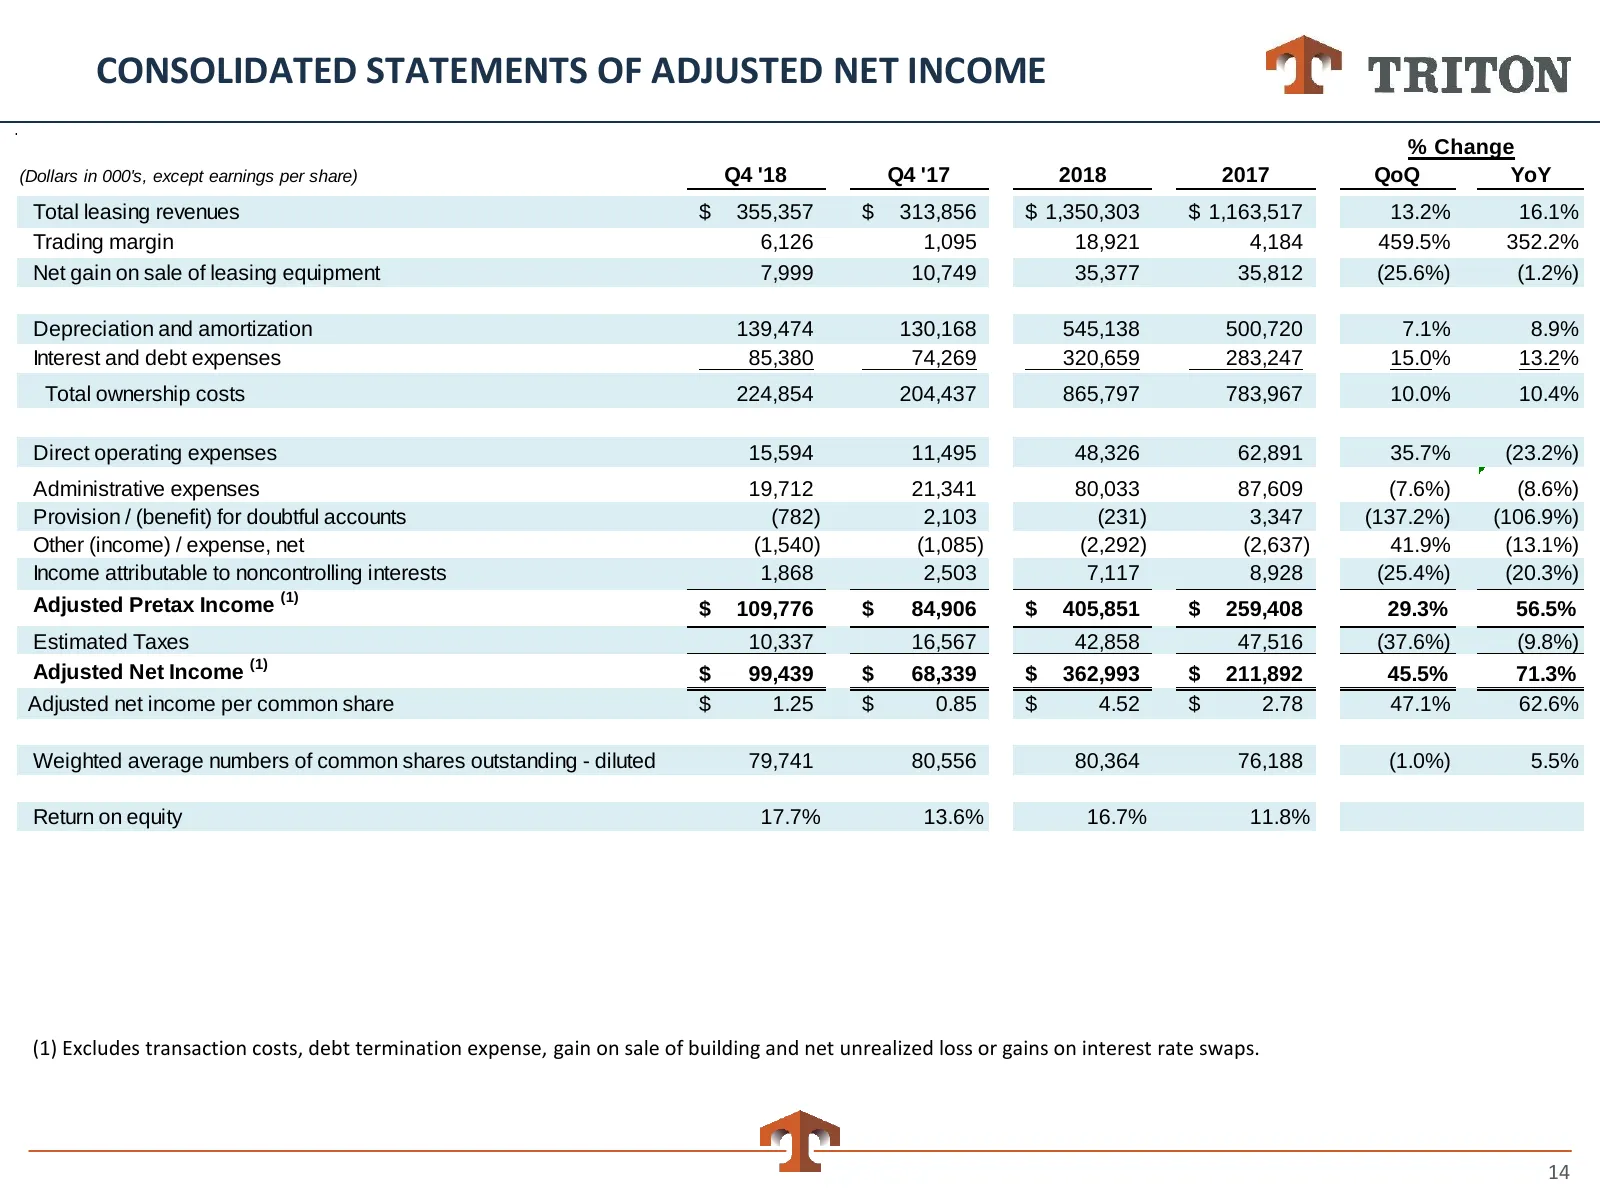
CONSOLIDATED STATEMENTS OF ADJUSTED NET INCOME % Change (Dollars in 000's, except earnings per share) Q4 '18 Q4 '17 2018 2017 QoQ YoY Total leasing revenues $ 355,357 $ 313,856 $ 1,350,303 $ 1,163,517 13.2% 16.1% Trading margin 6,126 1,095 18,921 4,184 459.5% 352.2% Net gain on sale of leasing equip
Slide 15: Consolidated Balance Sheet
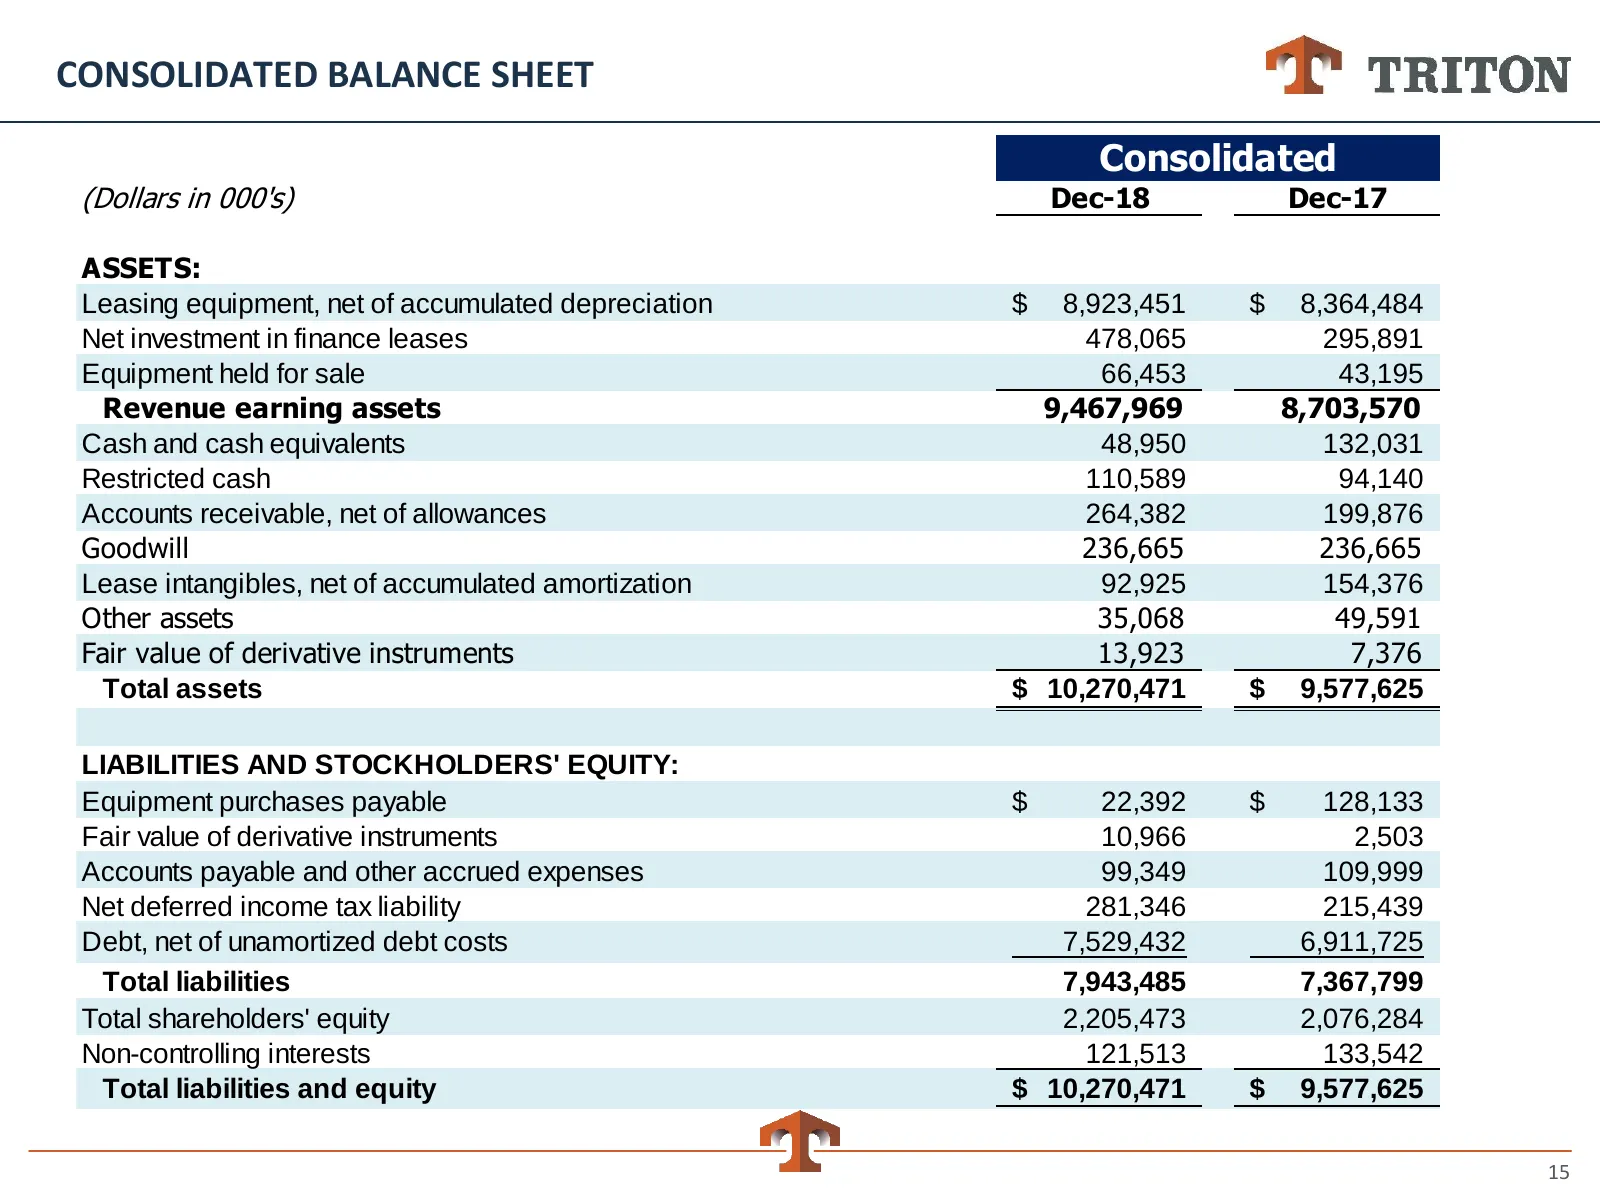
CONSOLIDATED BALANCE SHEET Consolidated (Dollars in 000's) Dec-18 Dec-17 ASSETS: Leasing equipment, net of accumulated depreciation $ 8,923,451 $ 8,364,484 Net investment in finance leases 478,065 295,891 Equipment held for sale 66,453 43,195 Revenue earning assets 9,467,969 8,703,570 Cash and cash
Slide 16: Strong and Stable Cash Flow Drives Value and Financial Stability
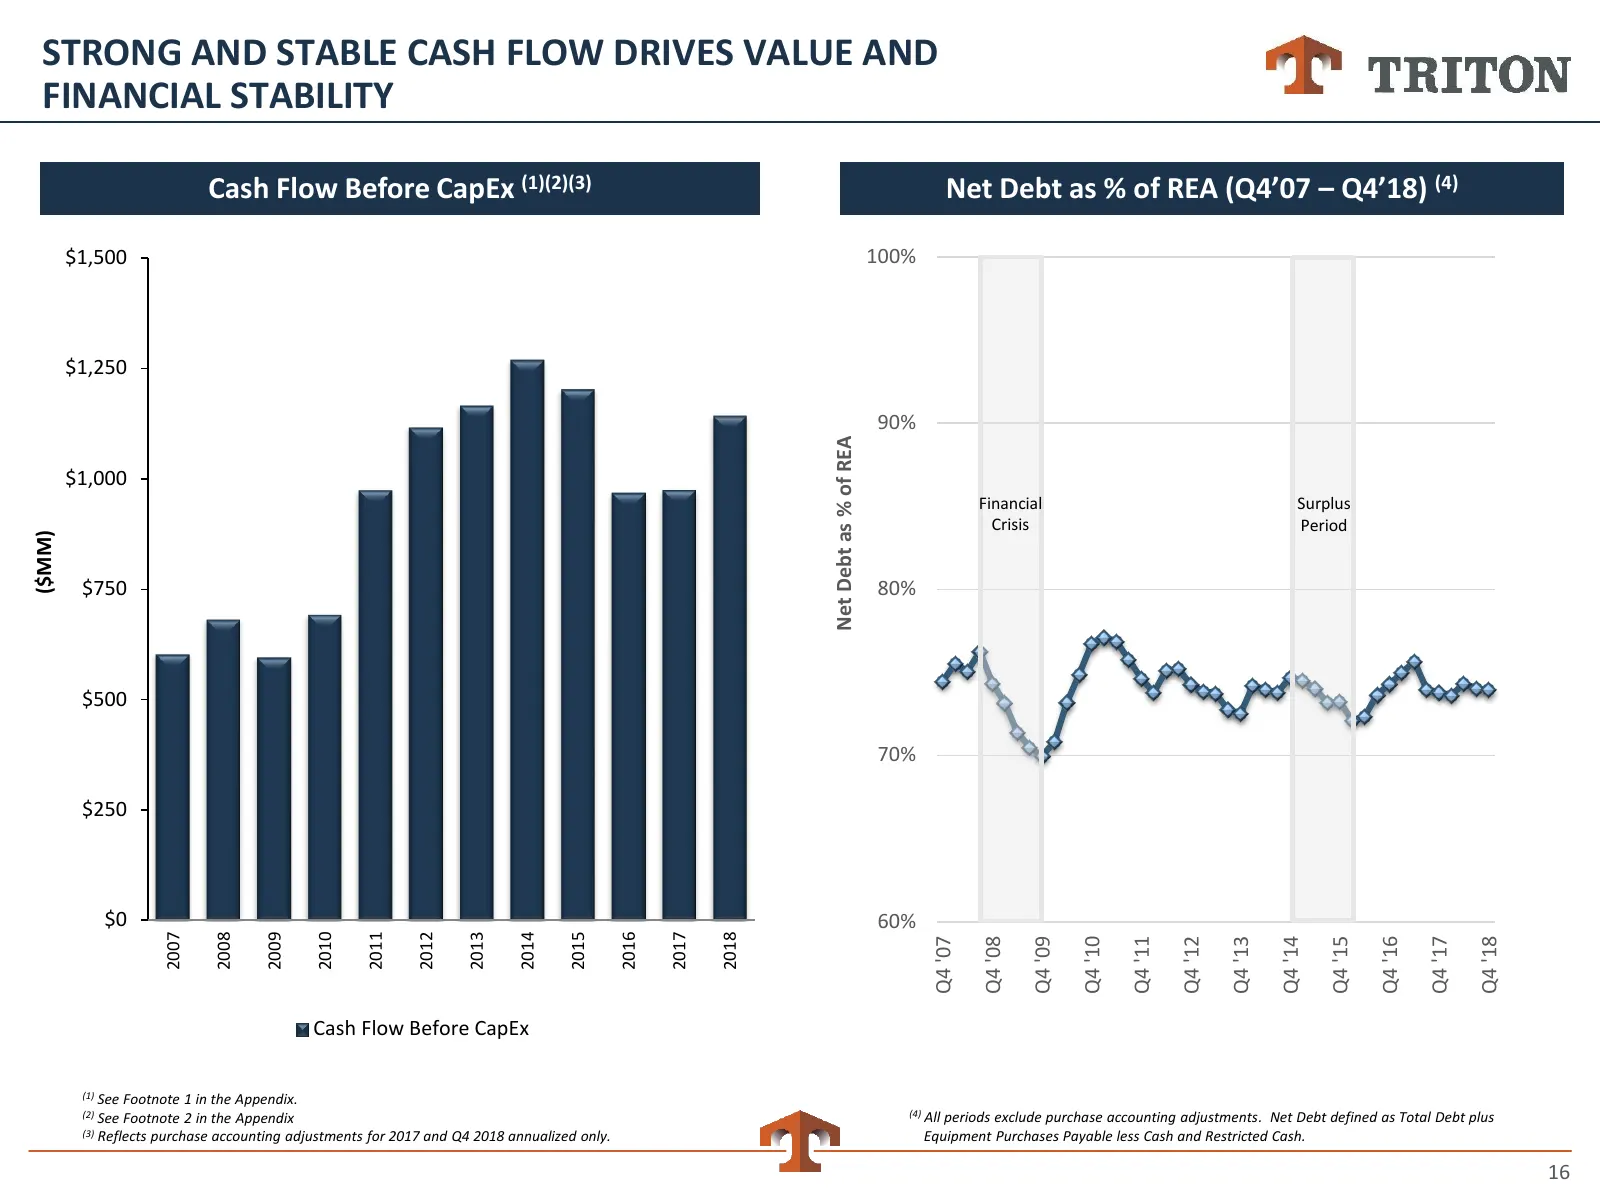
STRONG AND STABLE CASH FLOW DRIVES VALUE AND FINANCIAL STABILITY Cash Flow Before CapEx (1)(2)(3) Net Debt as % of REA (Q4’07 – Q4’18) (4) $1,500 100% $1,250 90% Net Debt as % of REA $1,000 Financial Surplus Crisis Period ($MM) $750 80% $500 70% $250 $0 60% 2007 2008 2009 2010 2011 2012 2013 2014 20
Slide 17: Conservative Capital Structure
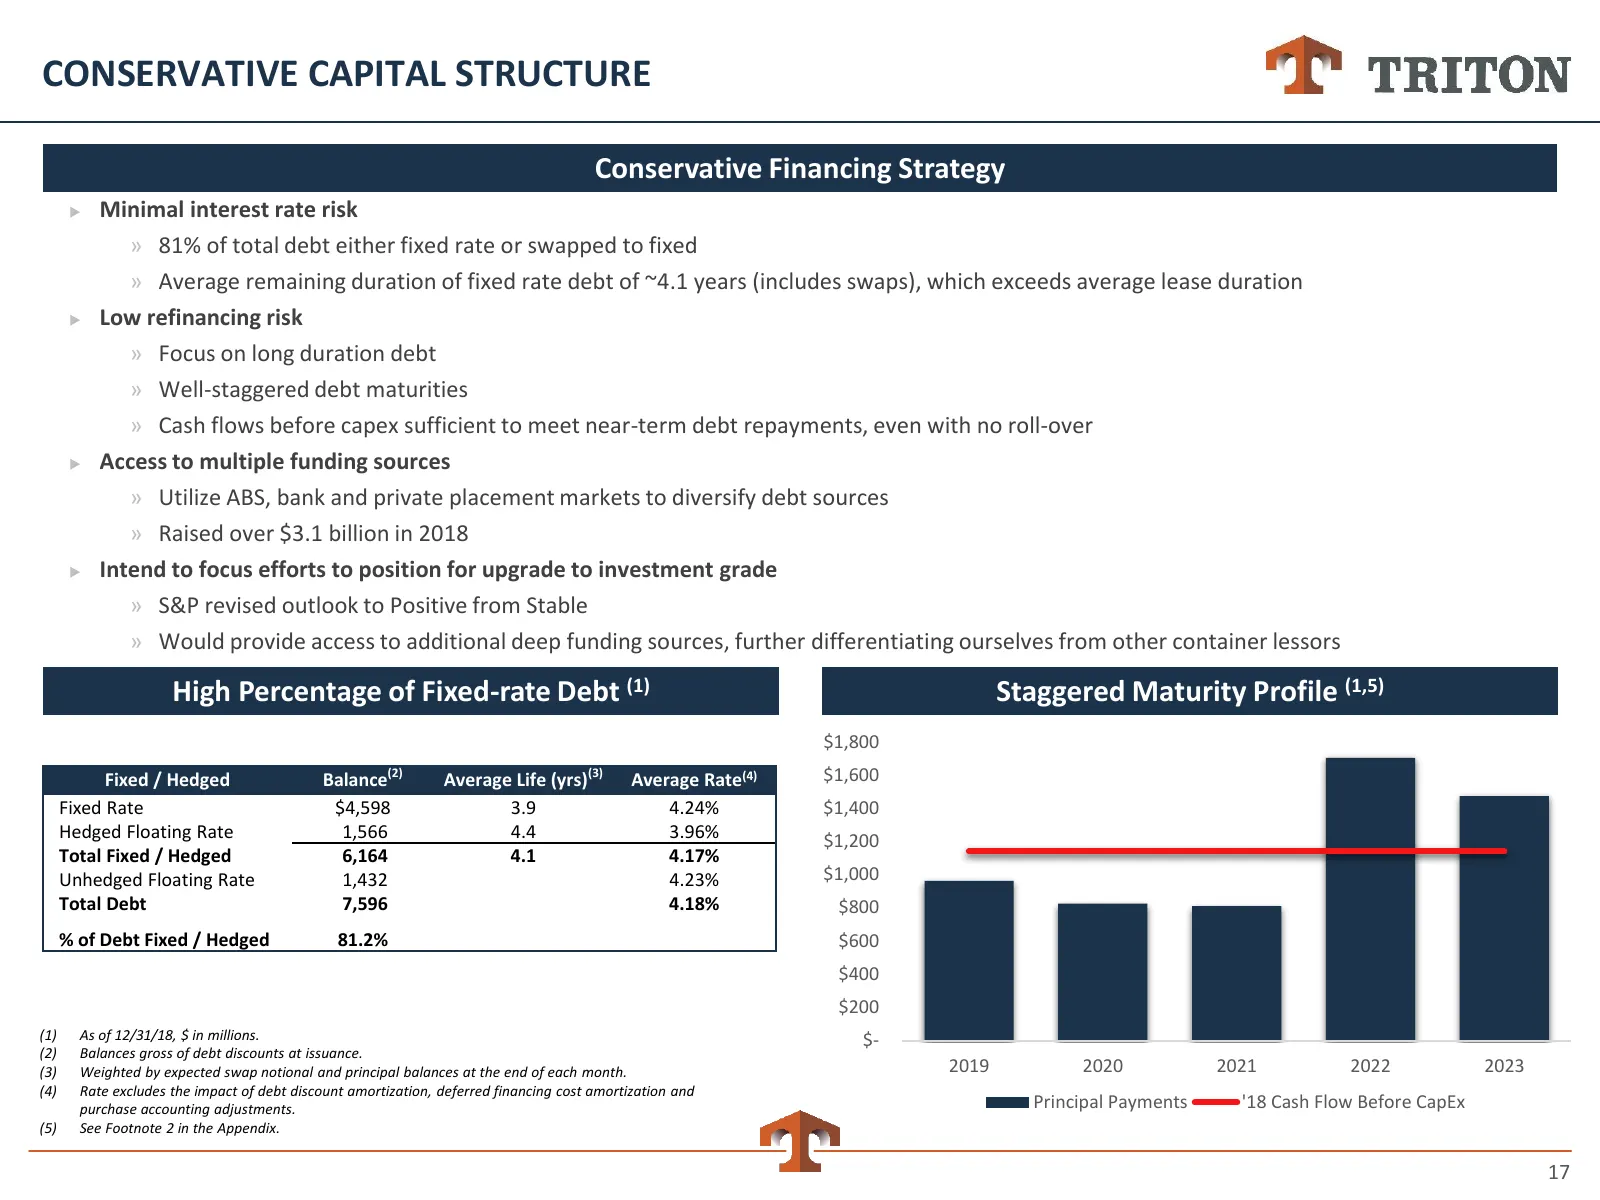
CONSERVATIVE CAPITAL STRUCTURE Conservative Financing Strategy Minimal interest rate risk » 81% of total debt either fixed rate or swapped to fixed » Average remaining duration of fixed rate debt of ~4.1 years (includes swaps), which exceeds average lease duration Low refinancing risk » Focus on
Slide 18: Well-Positioned to Create Long-Term Value
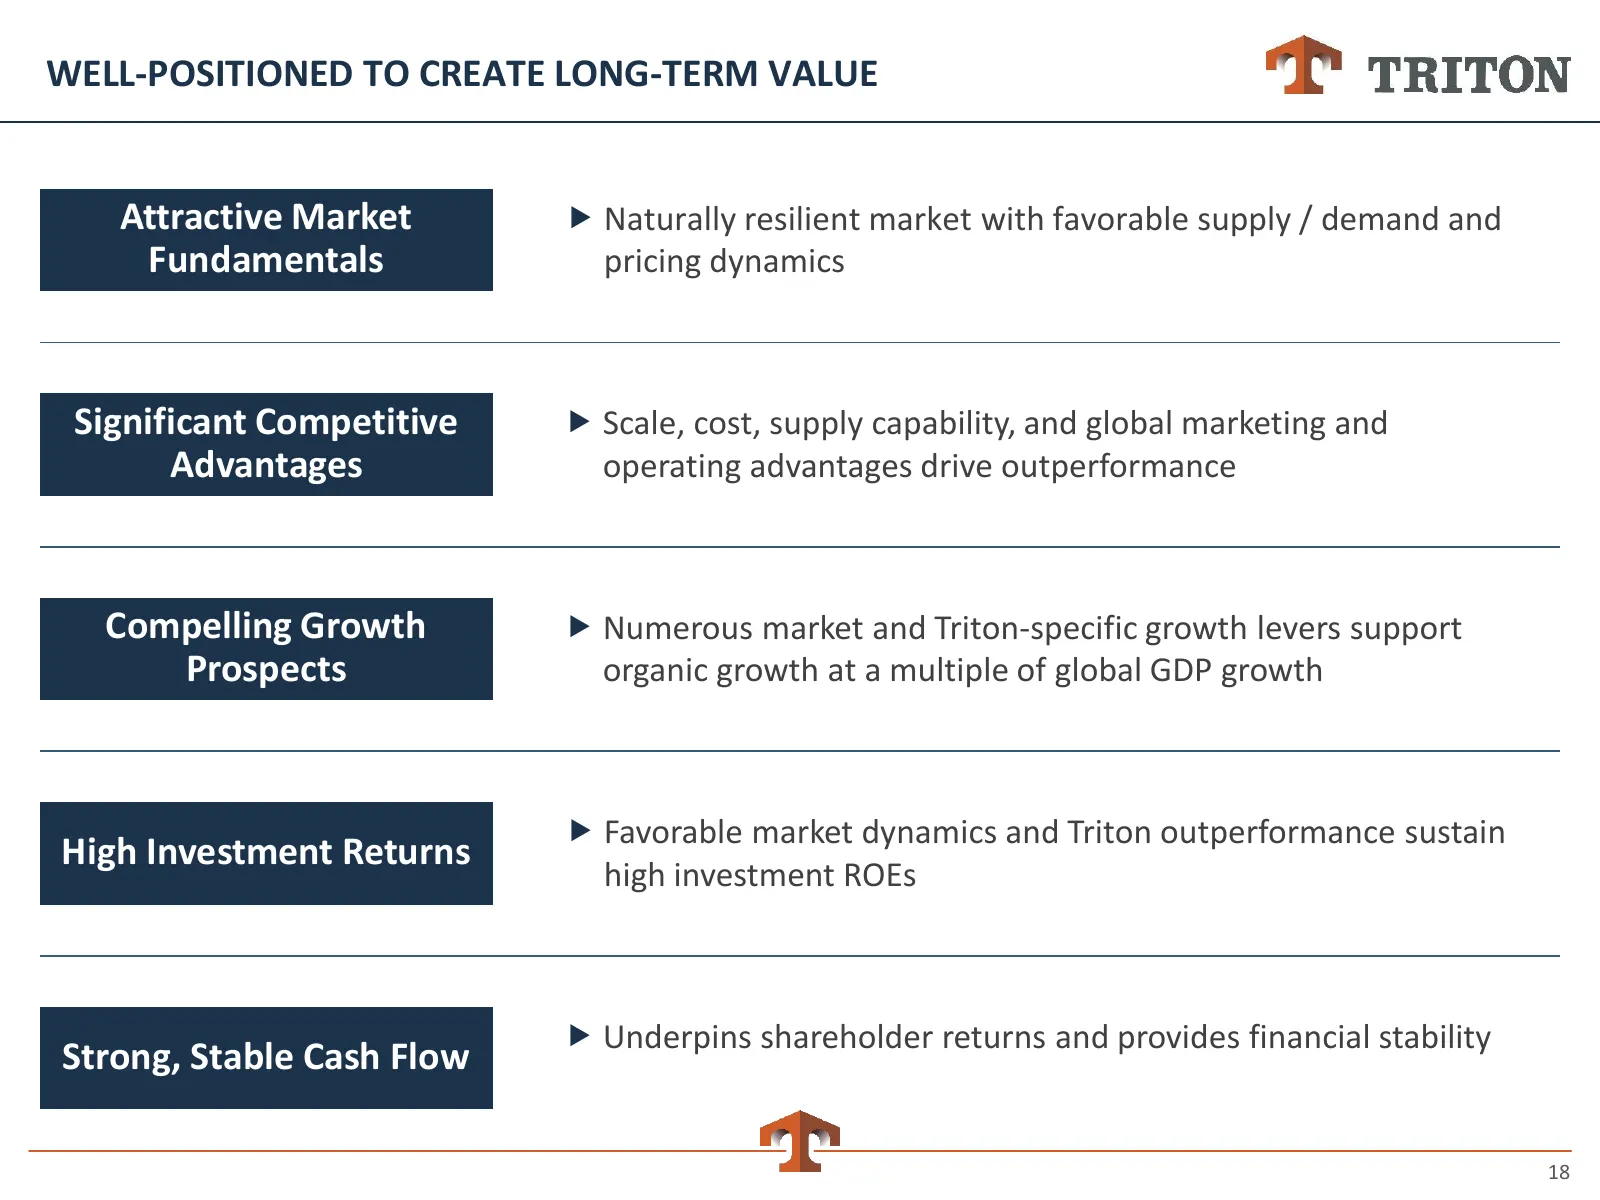
WELL-POSITIONED TO CREATE LONG-TERM VALUE Attractive Market Naturally resilient market with favorable supply / demand and Fundamentals pricing dynamics Significant Competitive Scale, cost, supply capability, and global marketing and Advantages operating advantages drive outperformance Compelling
Slide 19: Appendix
Appendix 19
Slide 20: Strong Internal Cash Flows
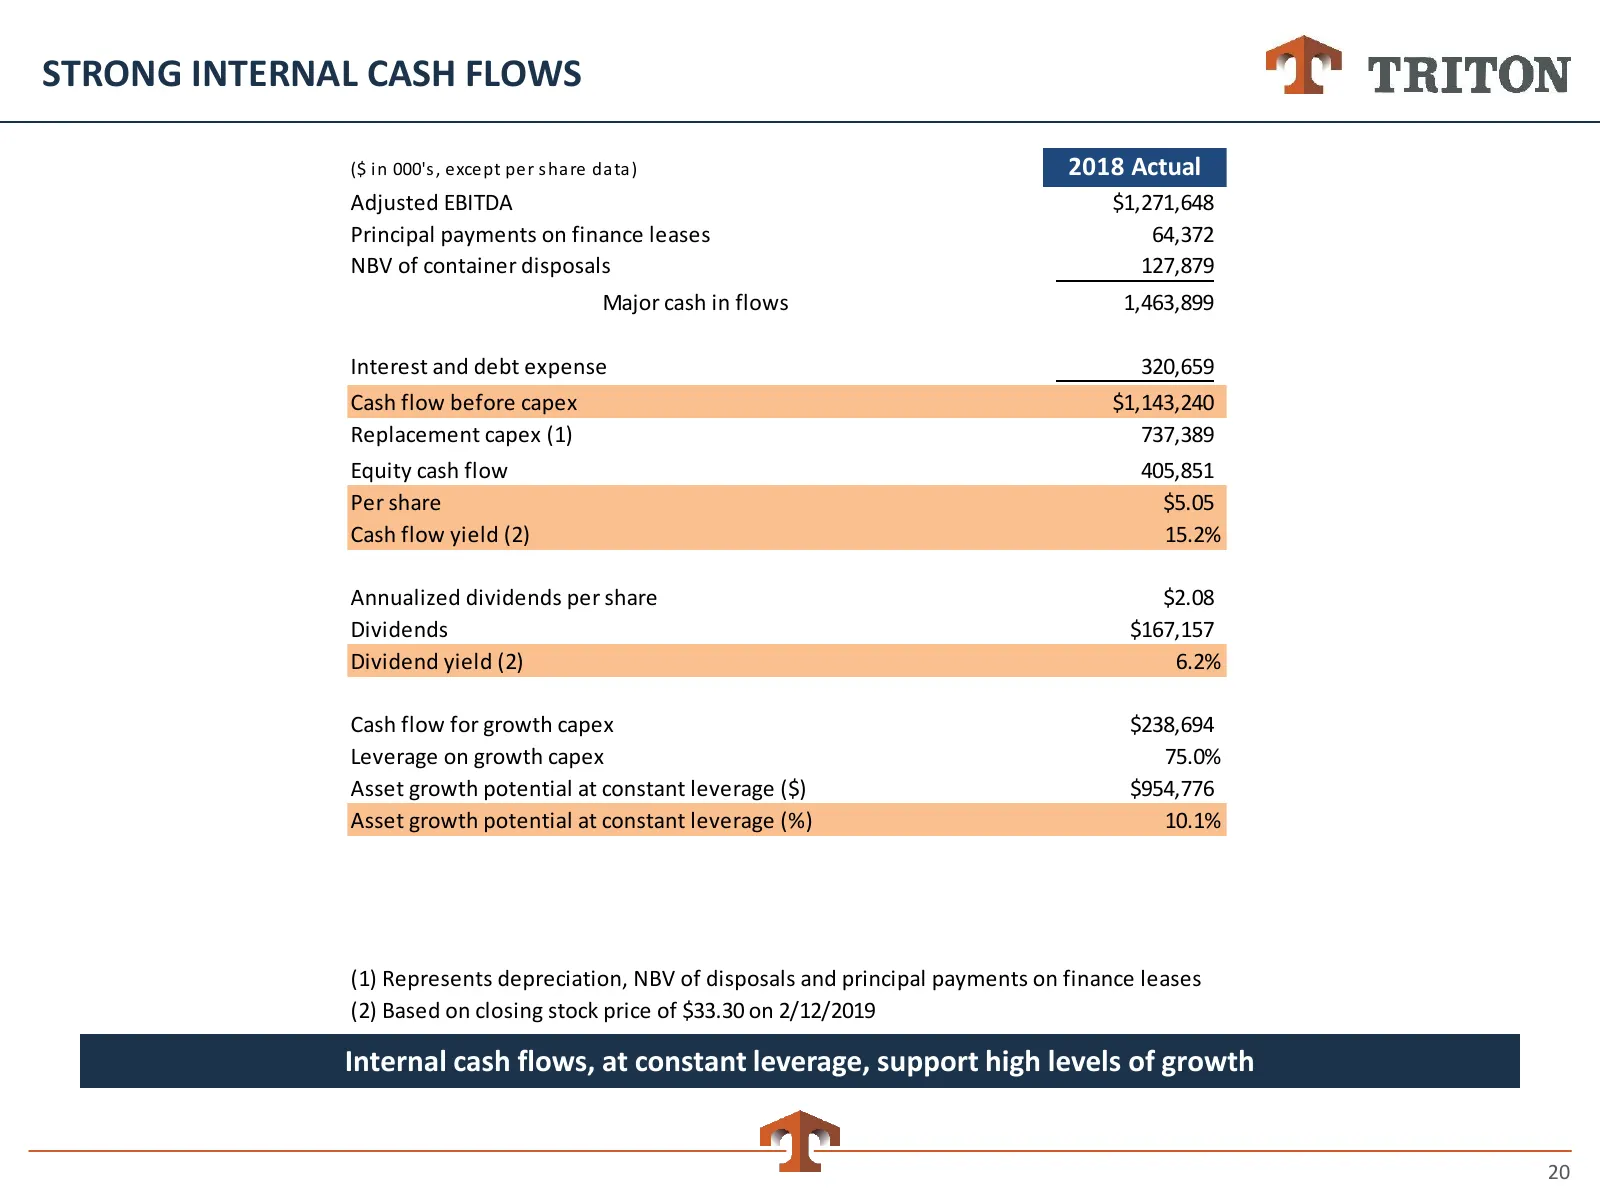
STRONG INTERNAL CASH FLOWS ($ i n 000's , except per s ha re da ta) 2018 Actual Adjusted EBITDA $1,271,648 Principal payments on finance leases 64,372 NBV of container disposals 127,879 Major cash in flows 1,463,899 Interest and debt expense 320,659 Cash flow before capex $1,143,240 Replacement cape
Slide 21: Lease Expiration Analysis
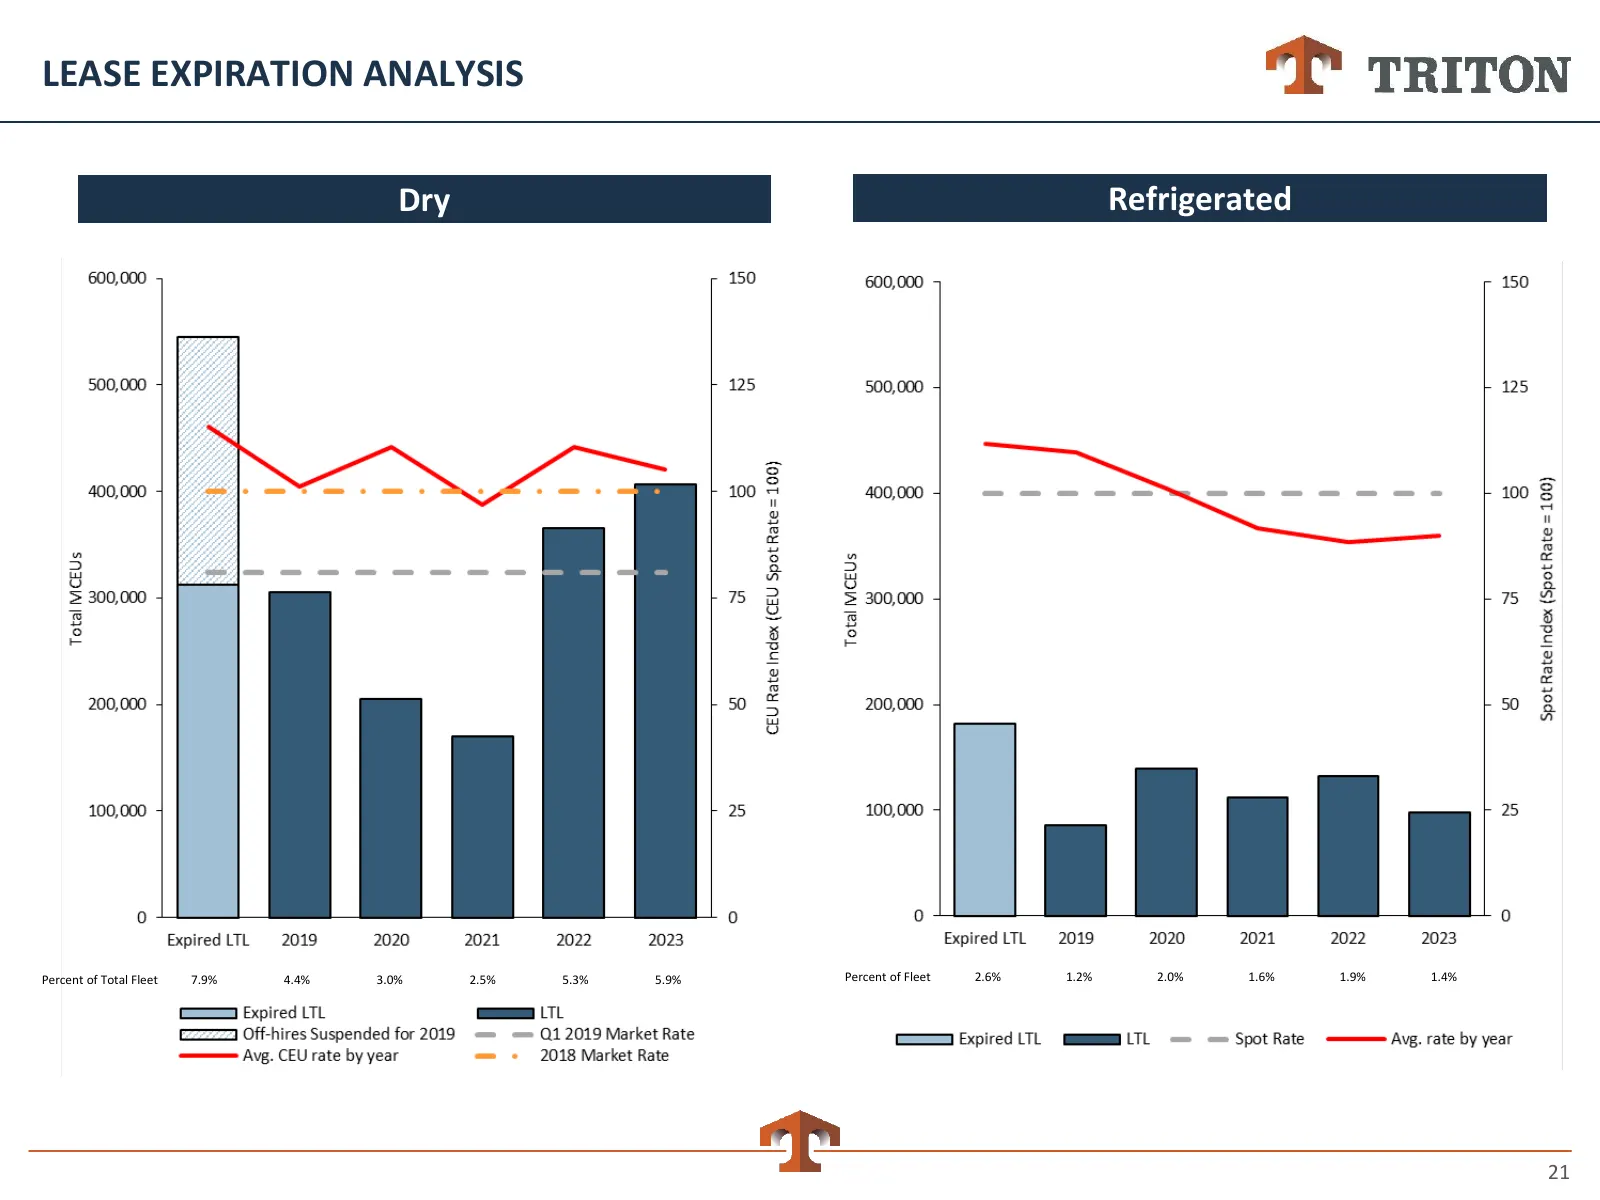
LEASE EXPIRATION ANALYSIS Dry Refrigerated Percent of Total Fleet 7.9% 4.4% 3.0% 2.5% 5.3% 5.9% Percent of Fleet 2.6% 1.2% 2.0% 1.6% 1.9% 1.4% 21
Slide 22: Factory Margins, After Steel Costs
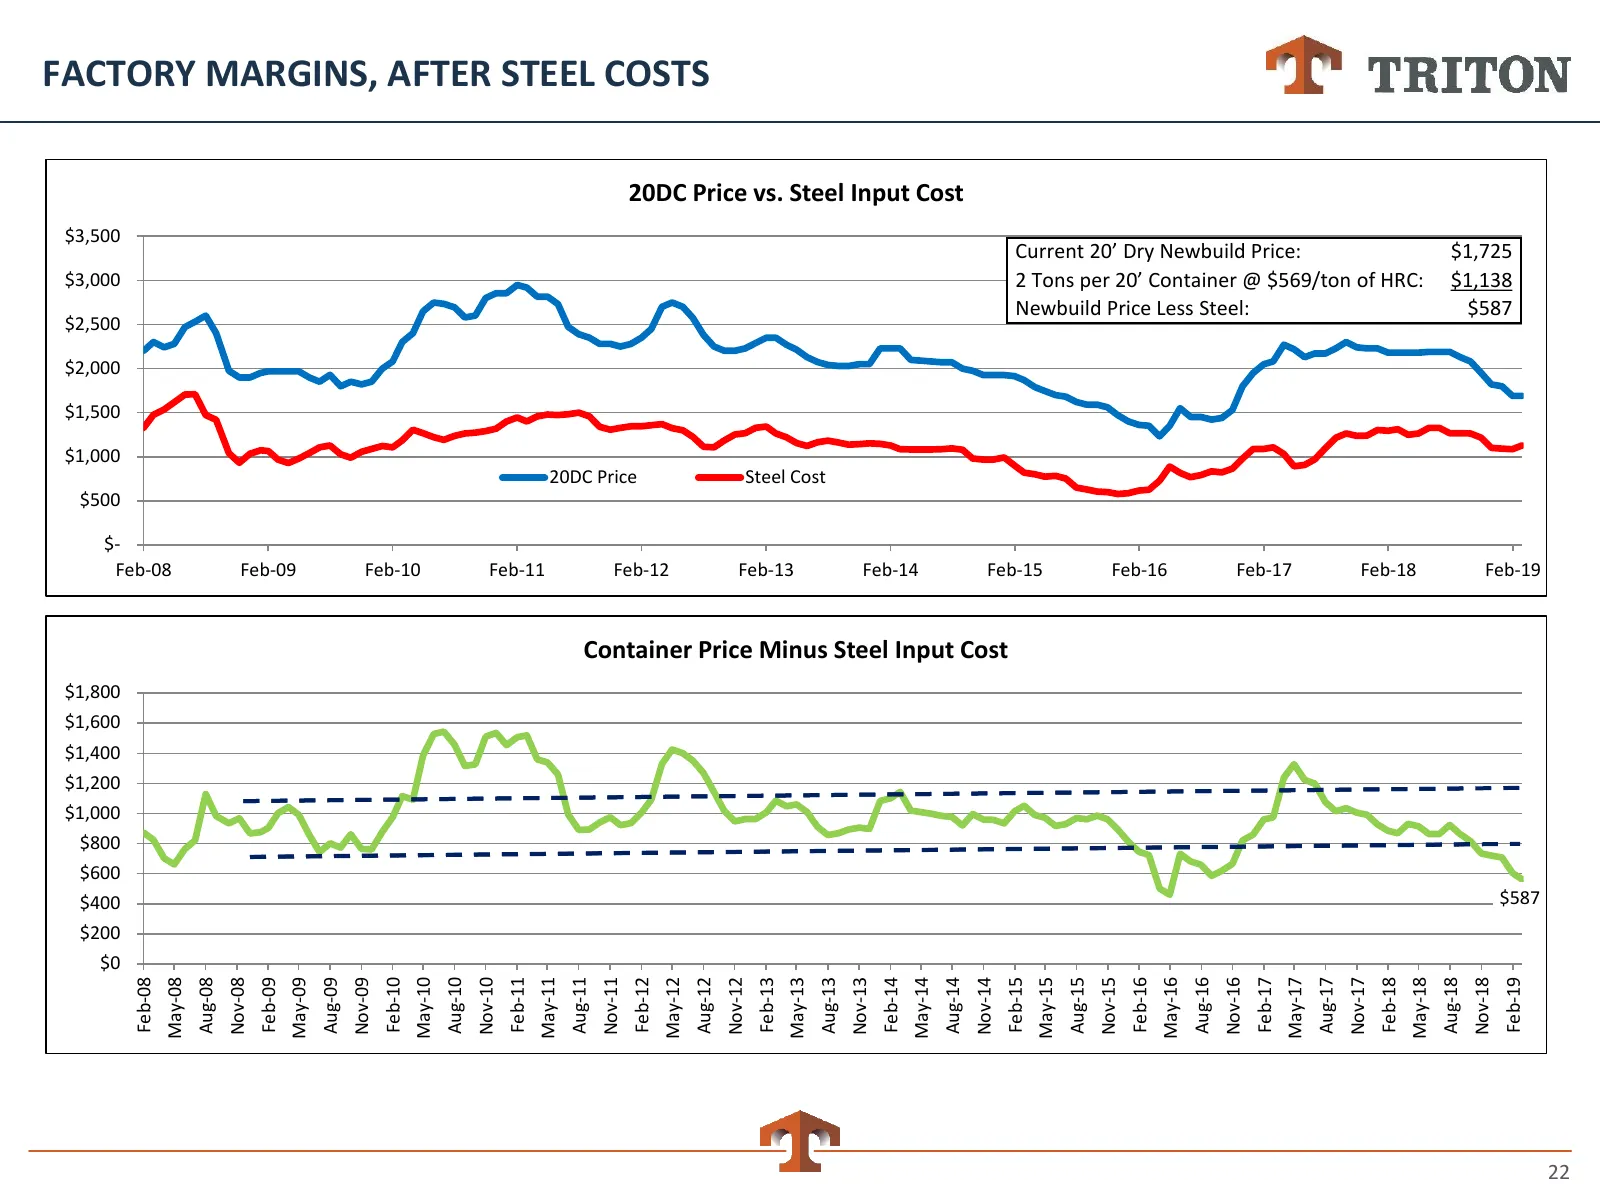
FACTORY MARGINS, AFTER STEEL COSTS 20DC Price vs. Steel Input Cost $3,500 Current 20’ Dry Newbuild Price: $1,725 $3,000 2 Tons per 20’ Container @ $569/ton of HRC: $1,138 Newbuild Price Less Steel: $587 $2,500 $2,000 $1,500 $1,000 20DC Price Steel Cost $500 $- Feb-08 Feb-09 Feb-10 Feb-11 Feb-12 Feb-
Slide 23: Consolidated Statements of Income
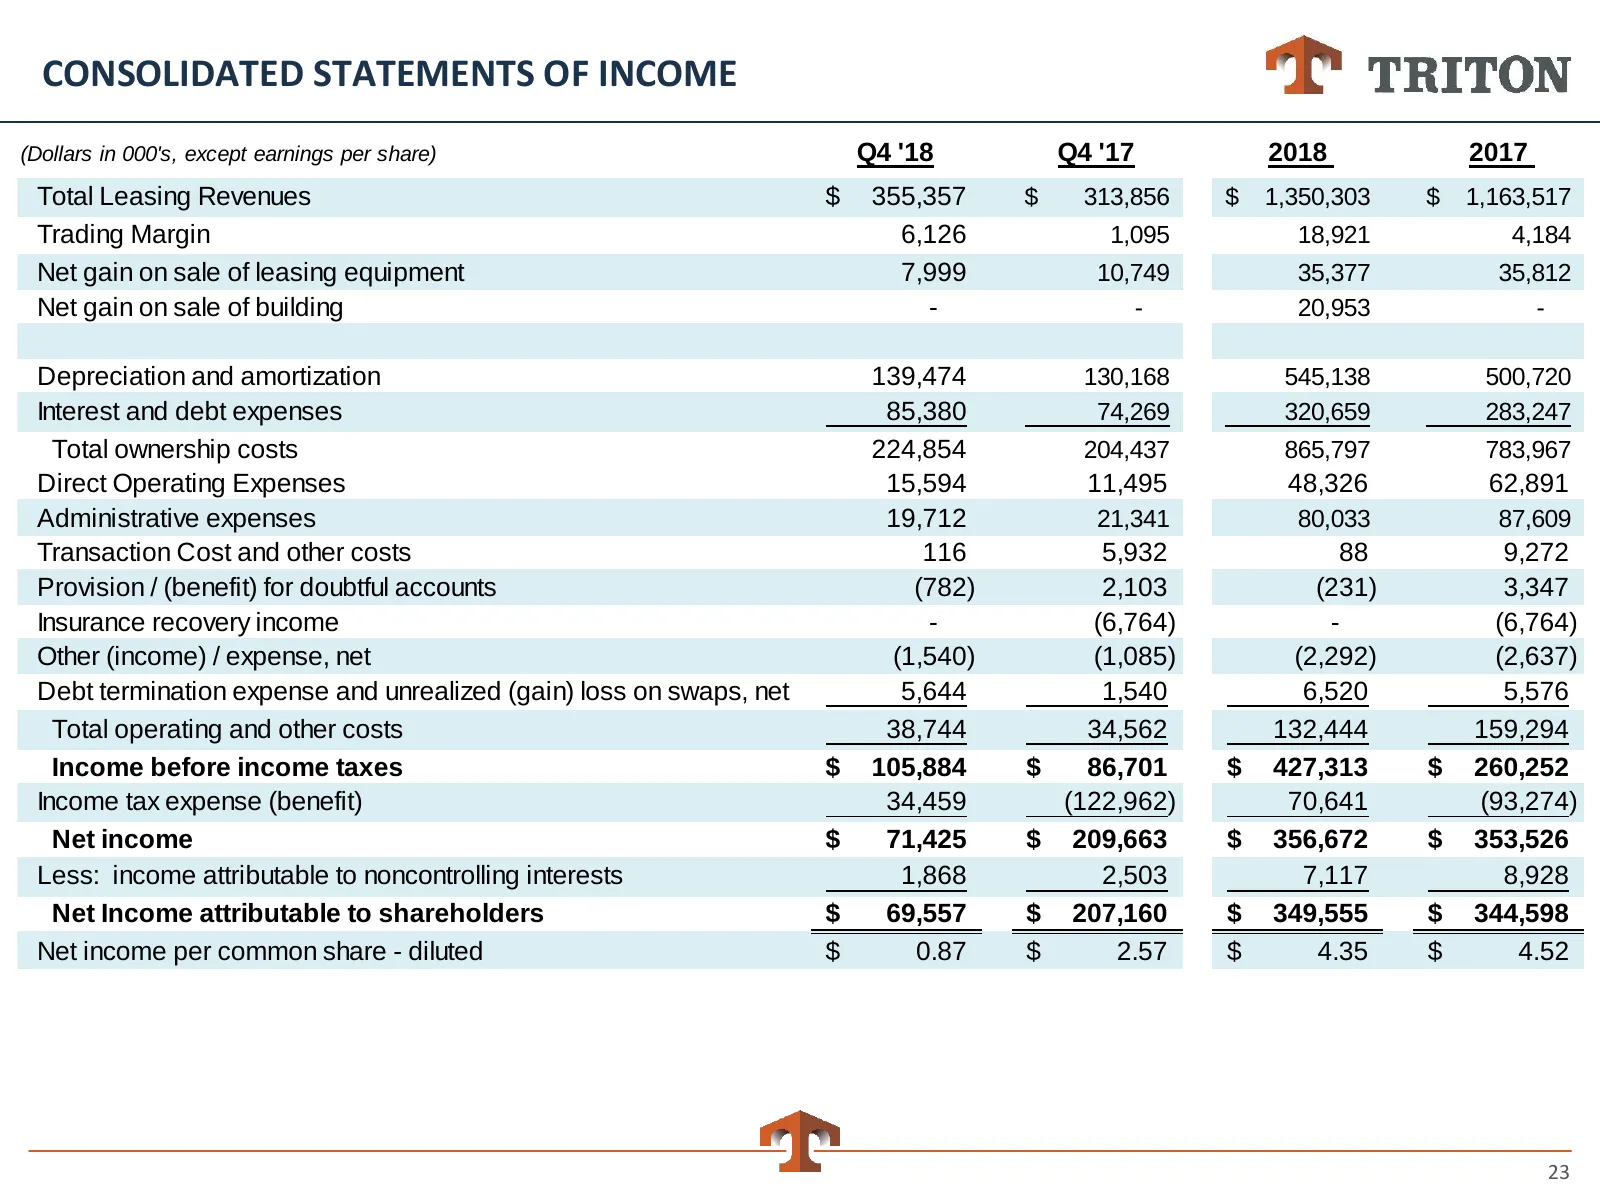
CONSOLIDATED STATEMENTS OF INCOME (Dollars in 000's, except earnings per share) Q4 '18 Q4 '17 2018 2017 Total Leasing Revenues $ 355,357 $ 313,856 $ 1,350,303 $ 1,163,517 Trading Margin 6,126 1,095 18,921 4,184 Net gain on sale of leasing equipment 7,999 10,749 35,377 35,812 Net gain on sale of buil
Slide 24: Reconciliation of Non-GAAP Financial Information
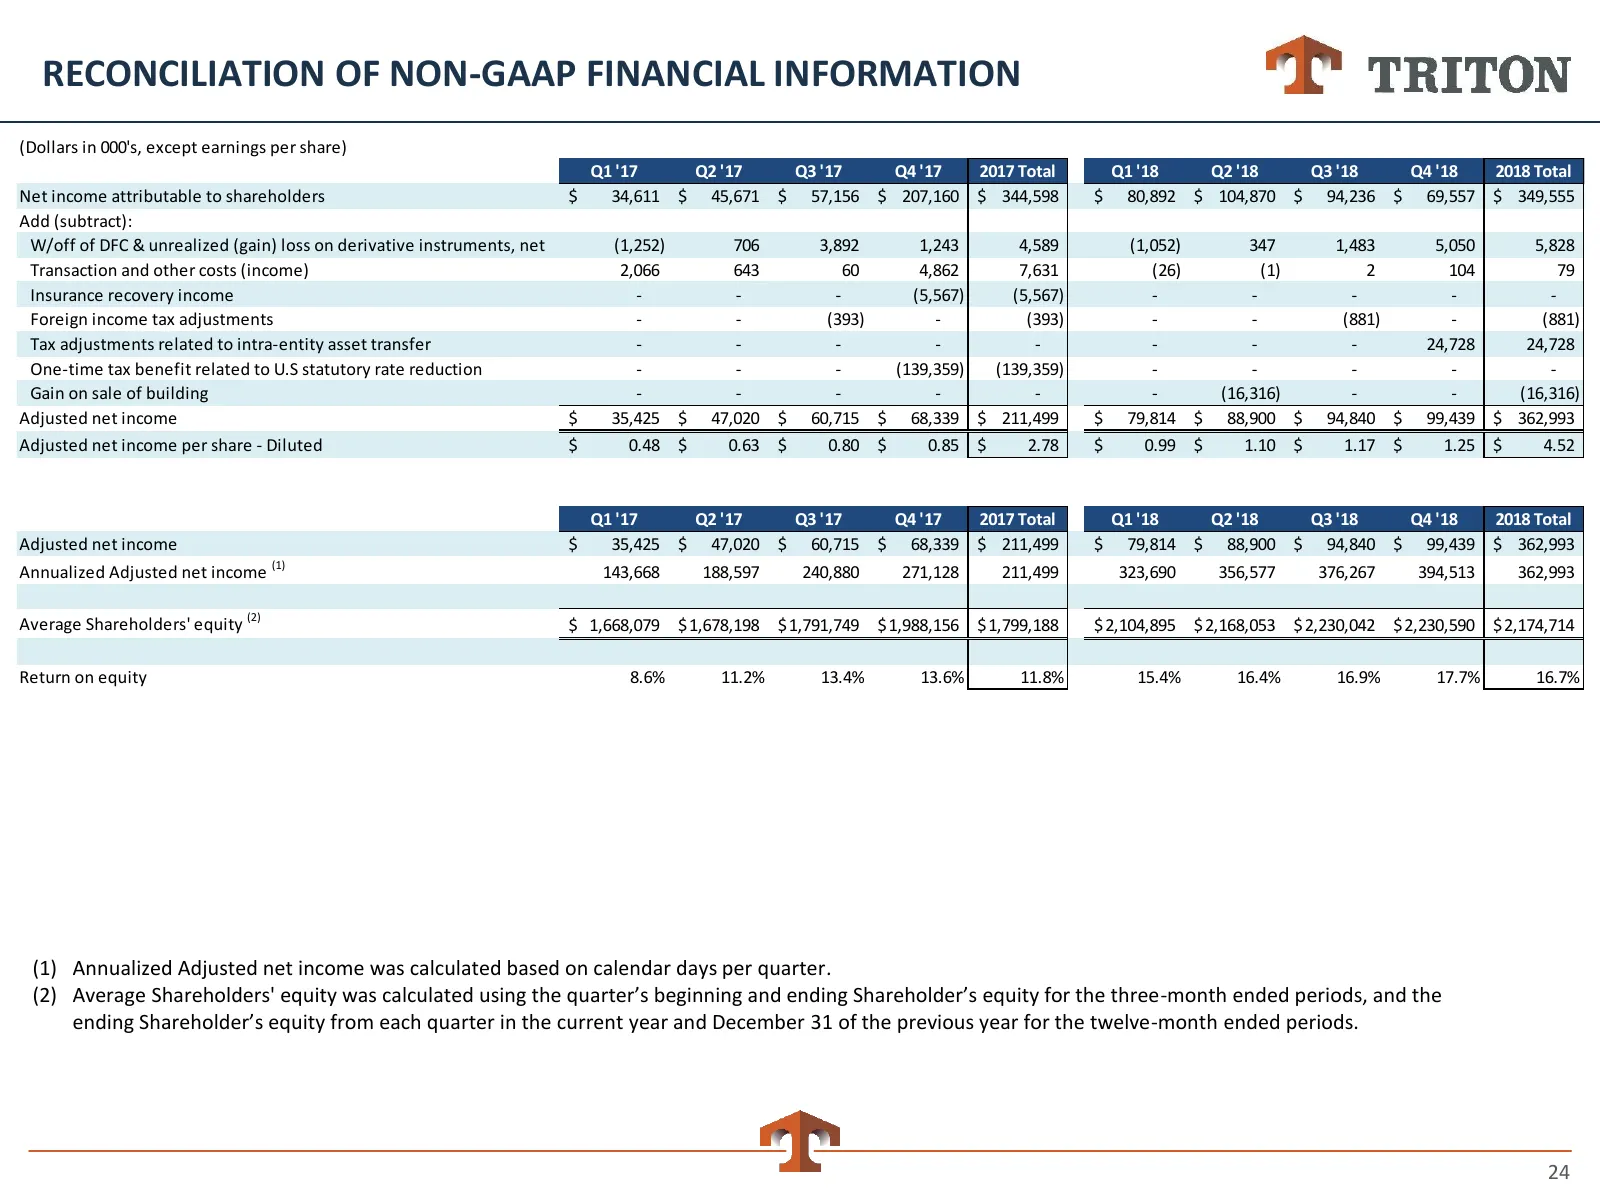
RECONCILIATION OF NON-GAAP FINANCIAL INFORMATION (Dollars in 000's, except earnings per share) Q1 '17 Q2 '17 Q3 '17 Q4 '17 2017 Total Q1 '18 Q2 '18 Q3 '18 Q4 '18 2018 Total Net income attributable to shareholders $ 34,611 $ 45,671 $ 57,156 $ 207,160 $ 344,598 $ 80,892 $ 104,870 $ 94,236 $ 69,557 $ 3
Slide 25: Reconciliation of Non-GAAP Financial Information
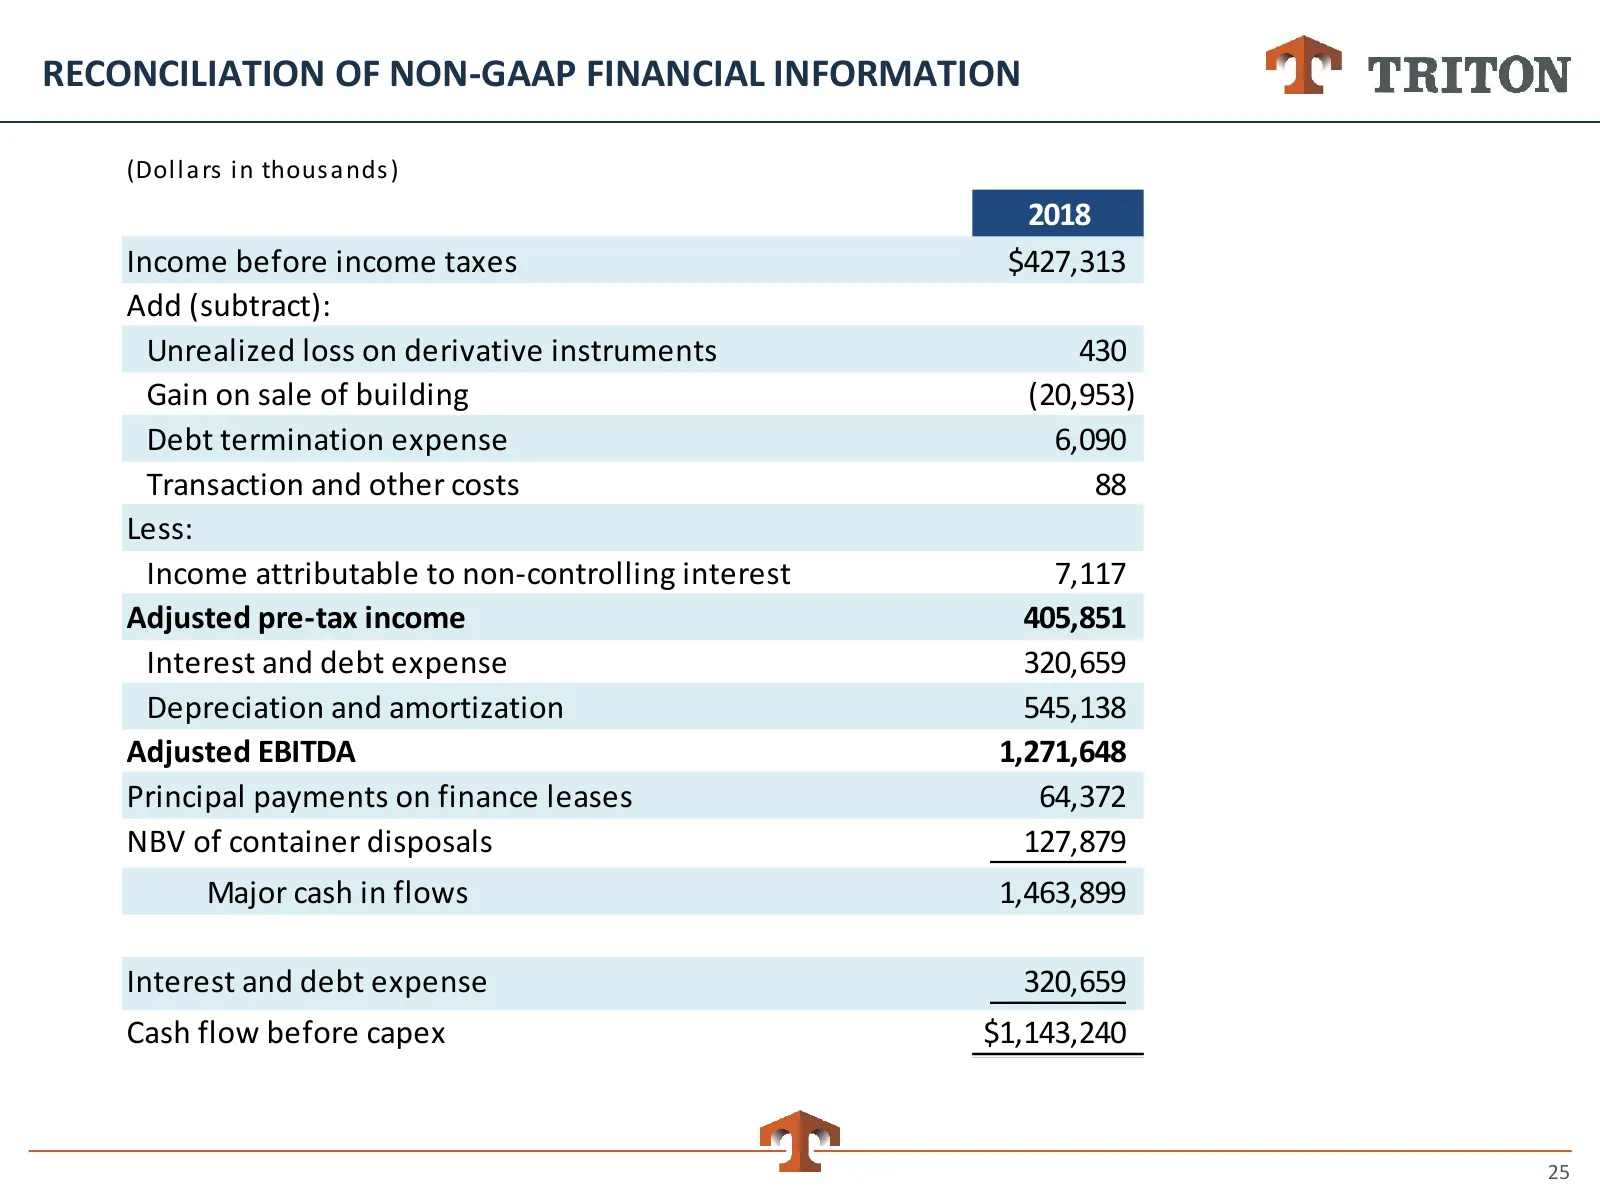
RECONCILIATION OF NON-GAAP FINANCIAL INFORMATION (Dol l a rs i n thous a nds ) 2018 Income before income taxes $427,313 Add (subtract): Unrealized loss on derivative instruments 430 Gain on sale of building (20,953) Debt termination expense 6,090 Transaction and other costs 88 Less: Income attributa
Slide 26: Footnotes
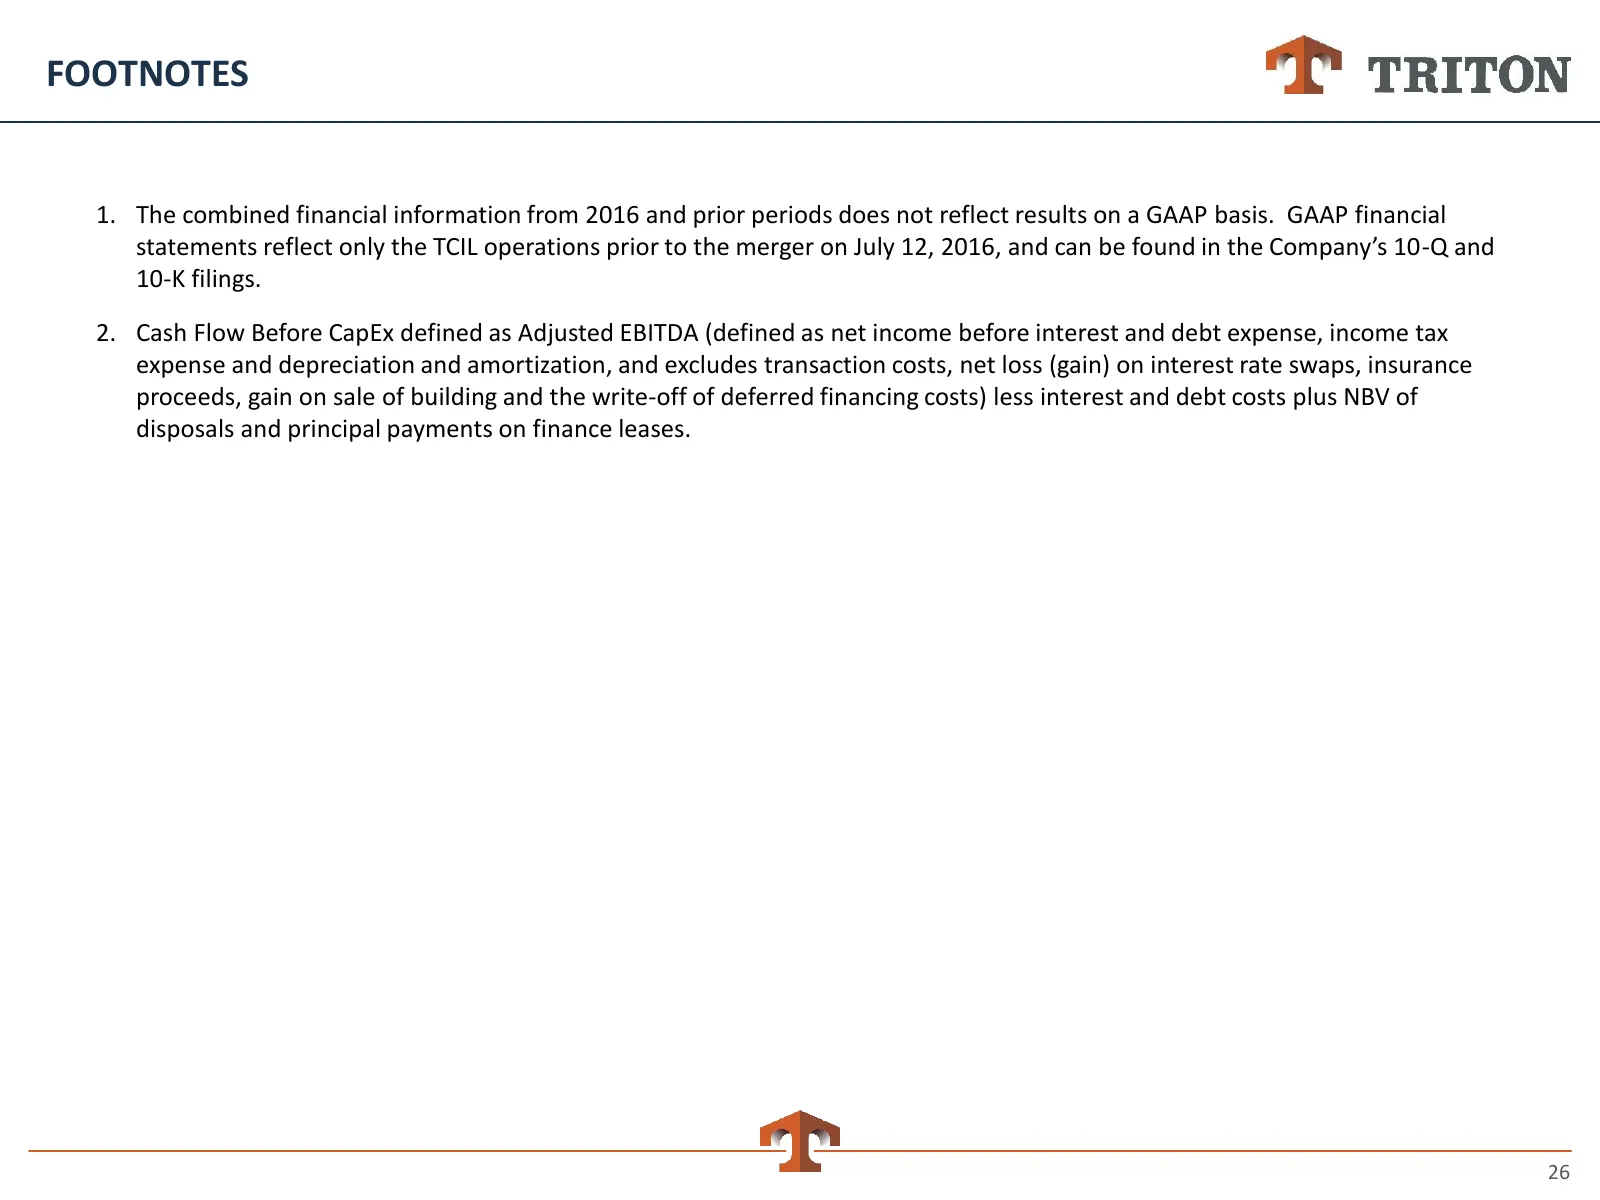
FOOTNOTES 1. The combined financial information from 2016 and prior periods does not reflect results on a GAAP basis. GAAP financial statements reflect only the TCIL operations prior to the merger on July 12, 2016, and can be found in the Company’s 10-Q and 10-K filings. 2. Cash Flow Before CapEx de
Source: Internet Archive copy of tritoninternational.com
More decks from Triton International Ltd.
 Q3 2026 Earnings Presentation14 slides · November 2026
 Q2 2026 Earnings Presentation14 slides · August 2026
 Q1 2026 Earnings Presentation14 slides · May 2026
 Q4 2025 Earnings Presentation12 slides · February 2026
 Investor Presentation (January 2026)12 slides · January 2026
 Q2 2025 Earnings Presentation13 slides · September 2025