Pepco — 2012 Wells Fargo Pipeline, MLP and Energy Symposium
34 slides from Pepco's conference presentation, Dec 4, 2012

Slide 1: 2012 Wells Fargo Pipeline, MLP and Energy Symposium
2012 Wells Fargo Pipeline, MLP and Energy Symposium DECEMBER 5 • NEW YORK, NY
Slide 2: Safe Harbor Statement/Regulation G Information
Safe Harbor Statement/Regulation G Information Some of the statements contained in today’s presentation with respect to Pepco Holdings, Pepco, Delmarva Power and Atlantic City Electric, including each of their respective subsidiaries, are forward-looking statements within the meaning of the U.S. fed
Slide 3: PHI's Strategic Focus
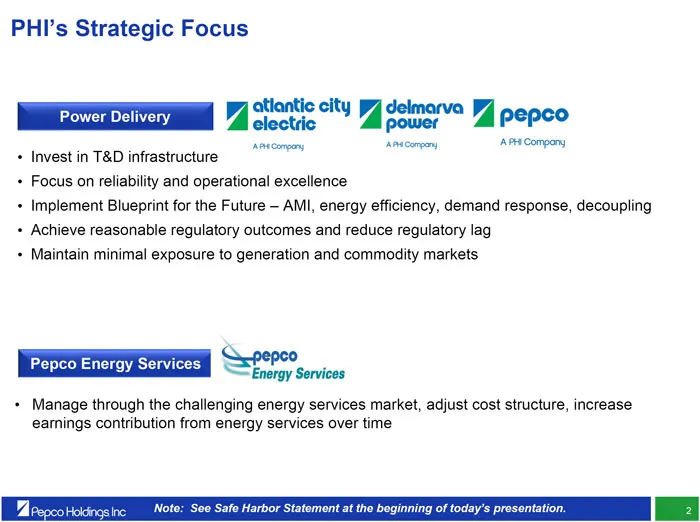
PHI’s Strategic Focus Power Delivery • Invest in T&D infrastructure • Focus on reliability and operational excellence • Implement Blueprint for the Future – AMI, energy efficiency, demand response, decoupling • Achieve reasonable regulatory outcomes and reduce regulatory lag • Maintain minimal expos
Slide 4: Hurricane Sandy – Estimated Cost of Restoration
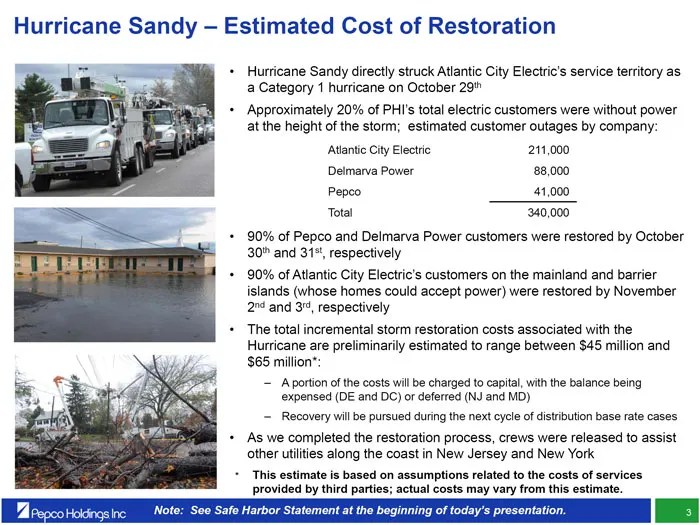
Hurricane Sandy – Estimated Cost of Restoration • Hurricane Sandy directly struck Atlantic City Electric’s service territory as a Category 1 hurricane on October 29 th • Approximately 20% of PHI’s total electric customers were without power at the height of the storm; estimated customer outages by c
Slide 5: Power Delivery – Growth Opportunity
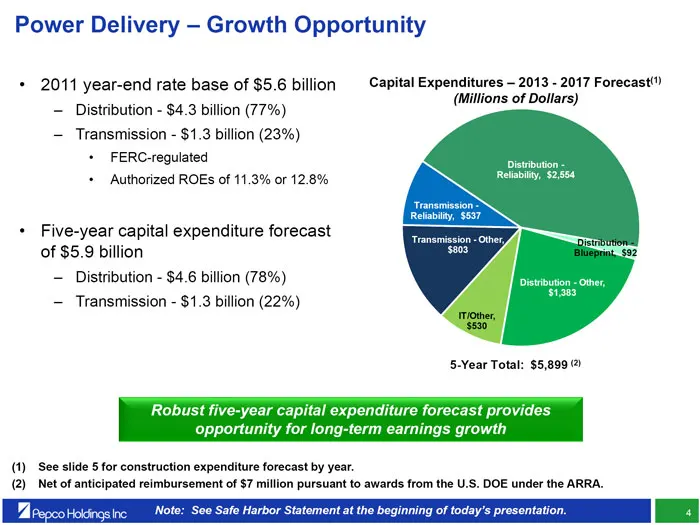
Power Delivery – Growth Opportunity • 2011 year-end rate base of $5.6 billion – Distribution - $4.3 billion (77%) – Transmission - $1.3 billion (23%) • FERC-regulated • Authorized ROEs of 11.3% or 12.8% • Five-year capital expenditure forecast of $5.9 billion – Distribution - $4.6 billion (78%) – Tr
Slide 6: Construction Expenditure Forecast
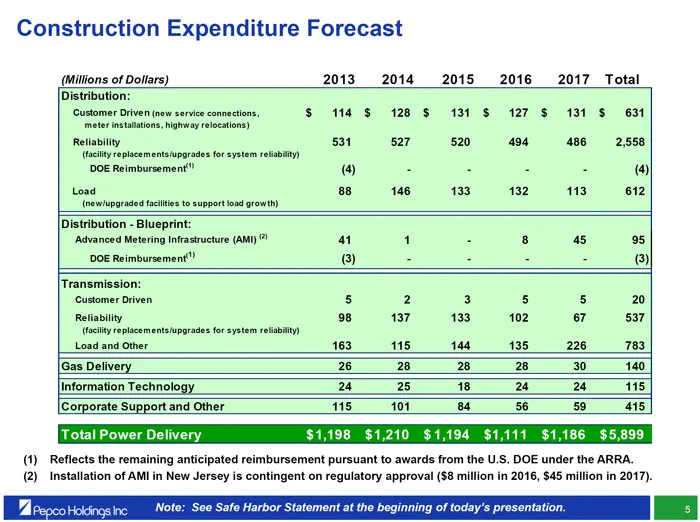
Construction Expenditure Forecast (Millions of Dollars) 2013 2014 2015 2016 2017 Total Distribution: Customer Driven (new service connections, $ 114 $ 128 $ 131 $ 127 $ 131 $ 631 meter installations, highway relocations) Reliability 531 527 520 494 486 2,558 (facility replacements/upgrades for syste
Slide 7: Forecast Capital Expenditures Comparison
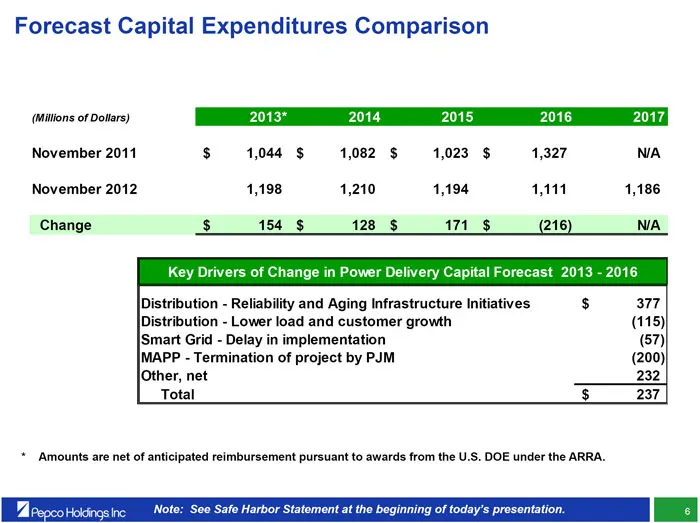
Forecast Capital Expenditures Comparison (Millions of Dollars) 2013* 2014 2015 2016 2017 November 2011 $ 1,044 $ 1,082 $ 1,023 $ 1,327 N/A November 2012 1,198 1,210 1,194 1,111 1,186 Change $ 154 $ 128 $ 171 $ (216) N/A Key Drivers of Change in Power Delivery Capital Forecast 2013 - 2016 Distributio
Slide 8: Infrastructure Investment – The Driver of Growth
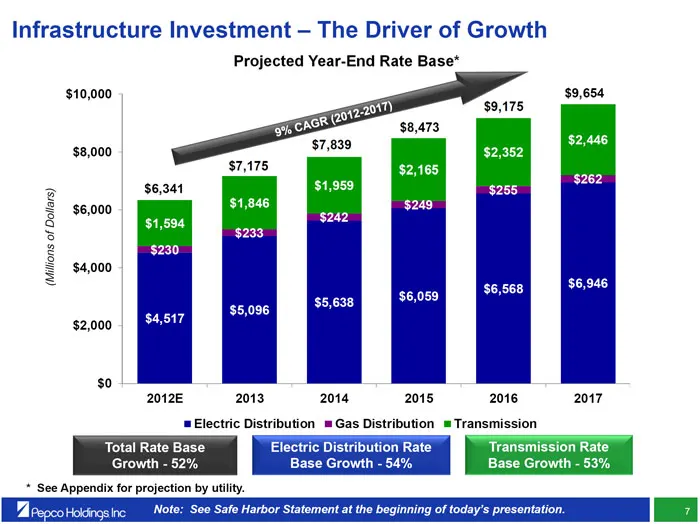
Infrastructure Investment – The Driver of Growth $10,000 $9,654 $2,446 $8,000 $262 $6,341 $1,959 $255 $1,846 $249 $6,000 $242 $1,594 $233 $230 (Millions of Dollars) $4,000 $6,568 $6,946 $6,059 $5,638 $5,096 $4,517 $2,000 $0 2012E 2013 2014 2015 2016 2017 Electric Distribution Gas Distribution Transm
Slide 9: Reliability Enhancement Plan (REP) – Performance Improvement to Date
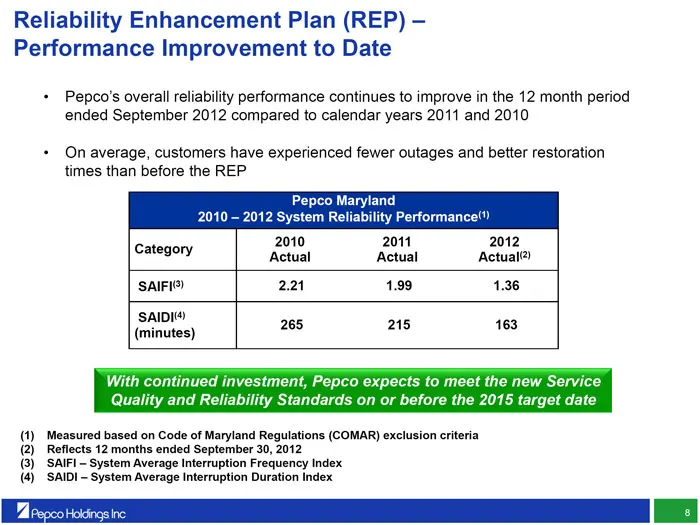
Reliability Enhancement Plan (REP) –Performance Improvement to Date • Pepco’s overall reliability performance continues to improve in the 12 month period ended September 2012 compared to calendar years 2011 and 2010 • On average, customers have experienced fewer outages and better restoration times
Slide 10: Advanced Metering Infrastructure (AMI)
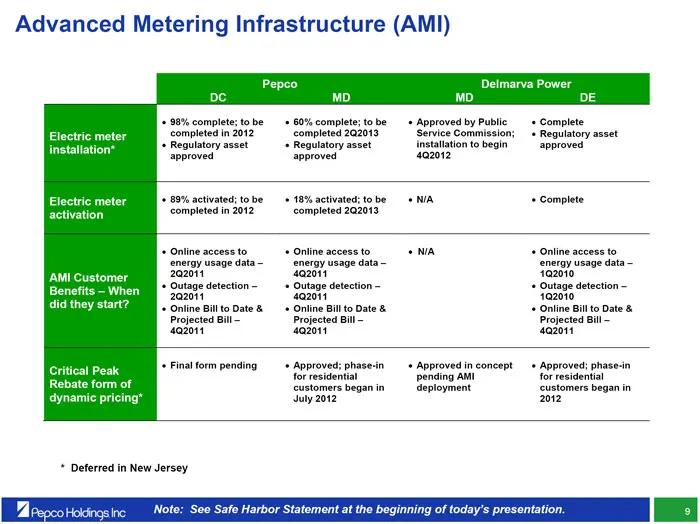
Advanced Metering Infrastructure (AMI) Pepco Delmarva Power DC MD MD DE 98% complete; to be 60% complete; to be Approved by Public Complete Electric meter completed in 2012 completed 2Q2013 Service Commission; Regulatory asset Regulatory asset Regulatory asset installation to begin app
Slide 11: Sales and Decoupling
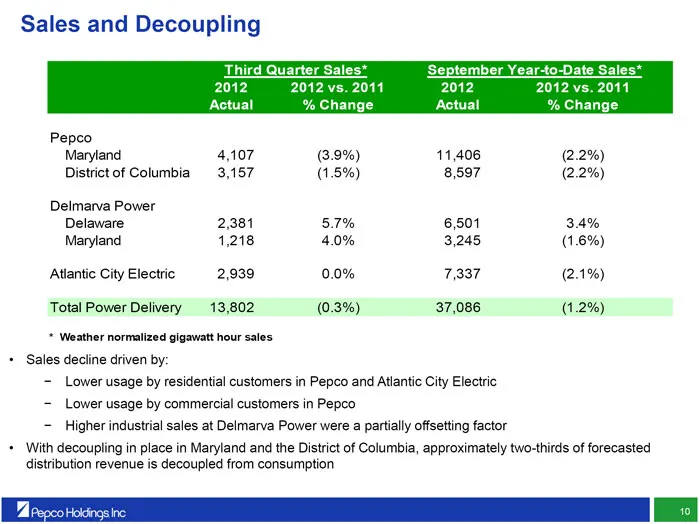
Sales and Decoupling Third Quarter Sales* September Year-to-Date Sales* 2012 2012 vs. 2011 2012 2012 vs. 2011 Actual % Change Actual % Change Pepco Maryland 4,107 (3.9%) 11,406 (2.2%) District of Columbia 3,157 (1.5%) 8,597 (2.2%) Delmarva Power Delaware 2,381 5.7% 6,501 3.4% Maryland 1,218 4.0% 3,2
Slide 12: Distribution Rate Cases – Pending Pepco – Maryland
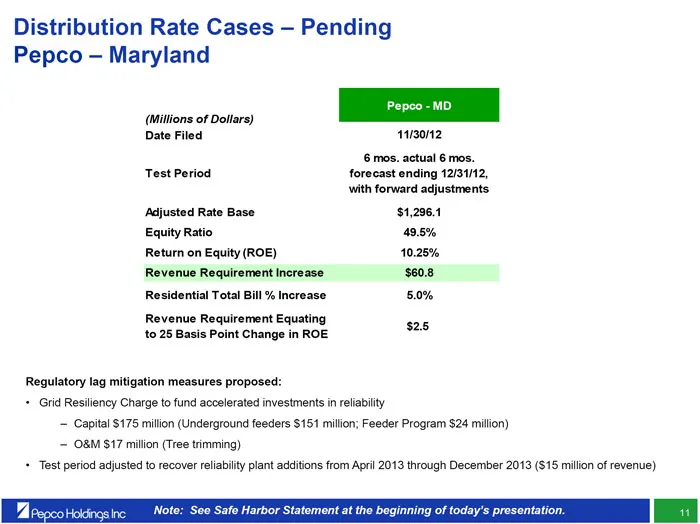
Distribution Rate Cases – Pending Pepco – Maryland Pepco - MD (Millions of Dollars) Date Filed 11/30/12 6 mos. actual 6 mos. Test Period forecast ending 12/31/12, with forward adjustments Adjusted Rate Base $1,296.1 Equity Ratio 49.5% Return on Equity (ROE) 10.25% Revenue Requirement Increase $60.8
Slide 13: Distribution Rate Cases – Approved Settlement Delmarva Power – Delaware
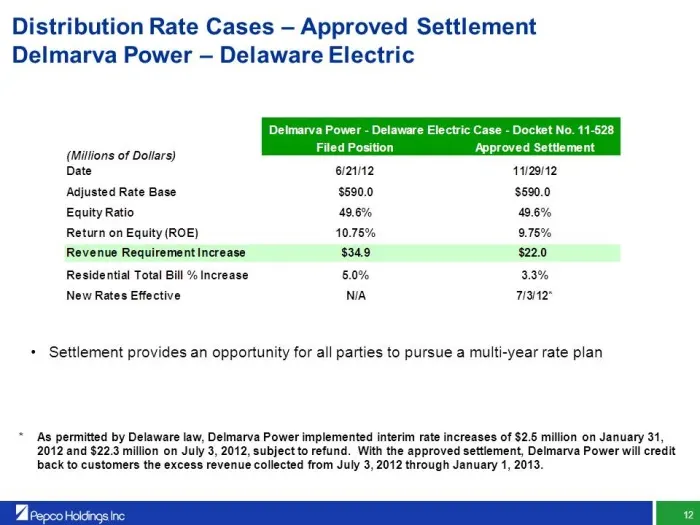
Distribution Rate Cases – Approved Settlement Delmarva Power – Delaware Electric Delmarva Power - Delaware Electric Case - Docket No. 11-528 Filed Position Approved Settlement (Millions of Dollars) Date 6/21/12 11/29/12 Adjusted Rate Base $590.0 $590.0 Equity Ratio 49.6% 49.6% Return on Equity (ROE)
Slide 14: Distribution Rate Cases – Recent Decision Atlantic City Electric – New Jersey
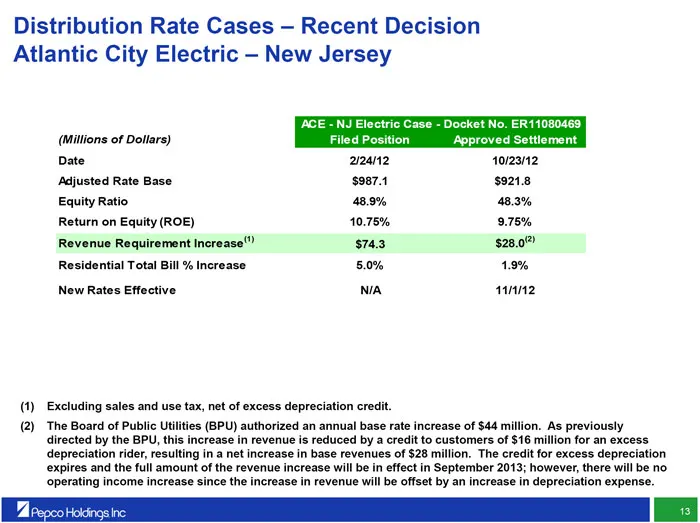
Distribution Rate Cases – Recent Decision Atlantic City Electric – New Jersey ACE - NJ Electric Case - Docket No. ER11080469 (Millions of Dollars) Filed Position Approved Settlement Date 2/24/12 10/23/12 Adjusted Rate Base $987.1 $921.8 Equity Ratio 48.9% 48.3% Return on Equity (ROE) 10.75% 9.75% Re
Slide 15: Distribution Rate Cases – Recent Decision Pepco – District of Columbia
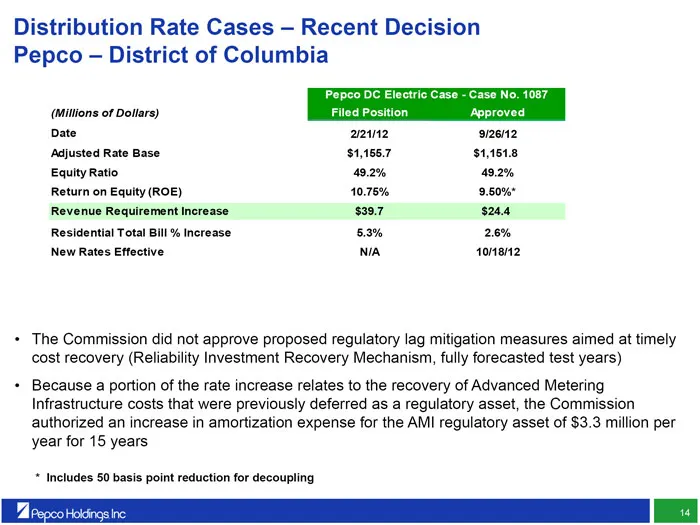
Distribution Rate Cases – Recent Decision Pepco – District of Columbia Pepco DC Electric Case - Case No. 1087 (Millions of Dollars) Filed Position Approved Date 2/21/12 9/26/12 Adjusted Rate Base $1,155.7 $1,151.8 Equity Ratio 49.2% 49.2% Return on Equity (ROE) 10.75% 9.50%* Revenue Requirement Incr
Slide 16: Distribution Rate Cases – Recent Decision Pepco – Maryland
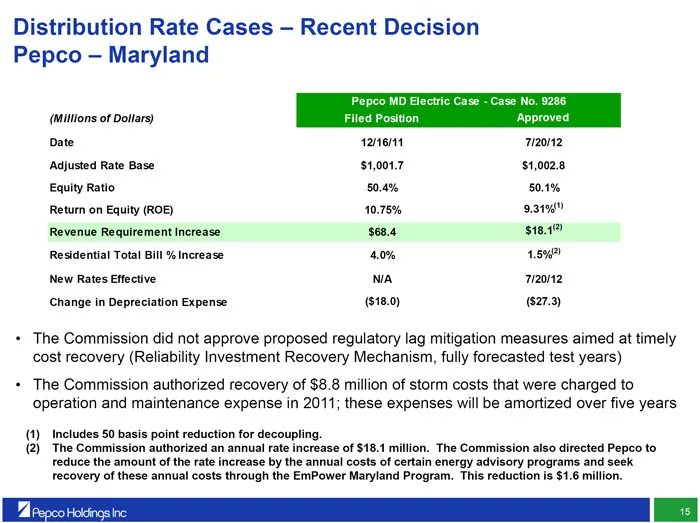
Distribution Rate Cases – Recent Decision Pepco – Maryland Pepco MD Electric Case - Case No. 9286 (Millions of Dollars) Filed Position Approved Date 12/16/11 7/20/12 Adjusted Rate Base $1,001.7 $1,002.8 Equity Ratio 50.4% 50.1% Return on Equity (ROE) 10.75% 9.31% (1) Revenue Requirement Increase $68
Slide 17: Distribution Rate Cases – Recent Decision Delmarva Power – Maryland
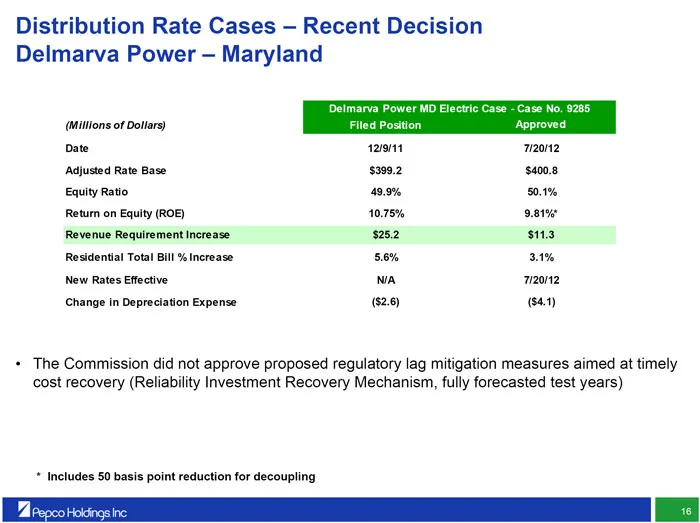
Distribution Rate Cases – Recent Decision Delmarva Power – Maryland Delmarva Power MD Electric Case - Case No. 9285 (Millions of Dollars) Filed Position Approved Date 12/9/11 7/20/12 Adjusted Rate Base $399.2 $400.8 Equity Ratio 49.9% 50.1% Return on Equity (ROE) 10.75% 9.81%* Revenue Requirement In
Slide 18: Regulatory Strategy for Distribution Rate Cases
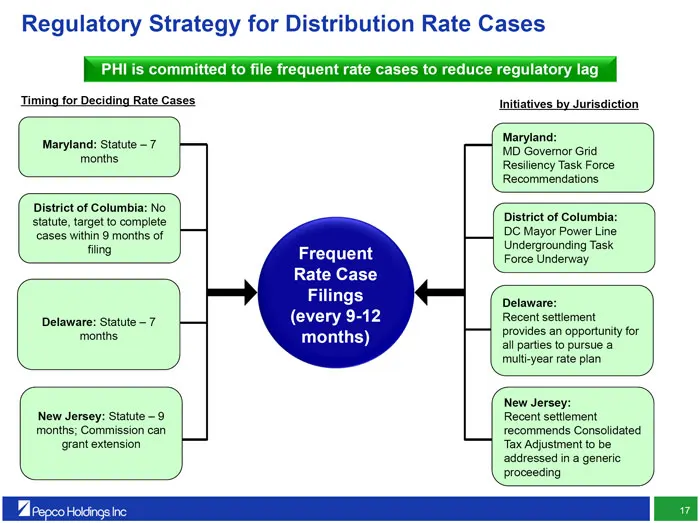
Regulatory Strategy for Distribution Rate Cases PHI is committed to file frequent rate cases to reduce regulatory lag Timing for Deciding Rate Cases Initiatives by Jurisdiction Maryland: Maryland: Statute – 7 MD Governor Grid months Resiliency Task Force Recommendations District of Columbia: No stat
Slide 19: The Next Cycle of Distribution Base Rate Cases
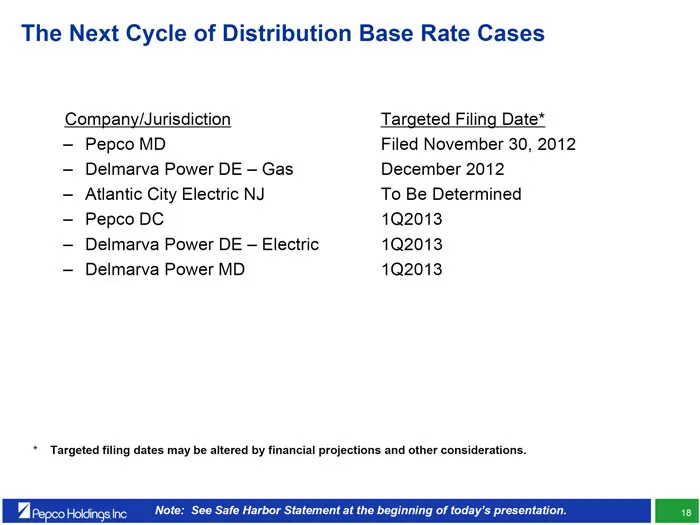
The Next Cycle of Distribution Base Rate Cases Company/Jurisdiction Targeted Filing Date* – Pepco MD Filed November 30, 2012 – Delmarva Power DE – Gas December 2012 – Atlantic City Electric NJ To Be Determined – Pepco DC 1Q2013 – Delmarva Power DE – Electric 1Q2013 – Delmarva Power MD 1Q2013 * Targe
Slide 20: Maryland Grid Resiliency Task Force
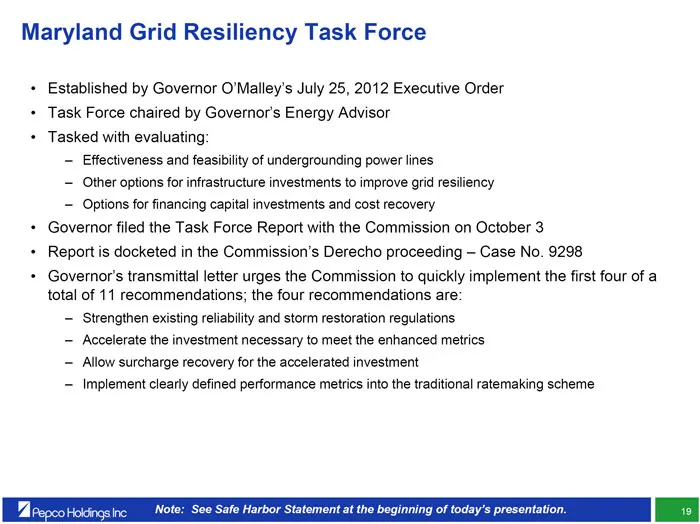
Maryland Grid Resiliency Task Force • Established by Governor O’Malley’s July 25, 2012 Executive Order • Task Force chaired by Governor’s Energy Advisor • Tasked with evaluating: – Effectiveness and feasibility of undergrounding power lines – Other options for infrastructure investments to improve g
Slide 21: District of Columbia Power Line Undergrounding Task Force
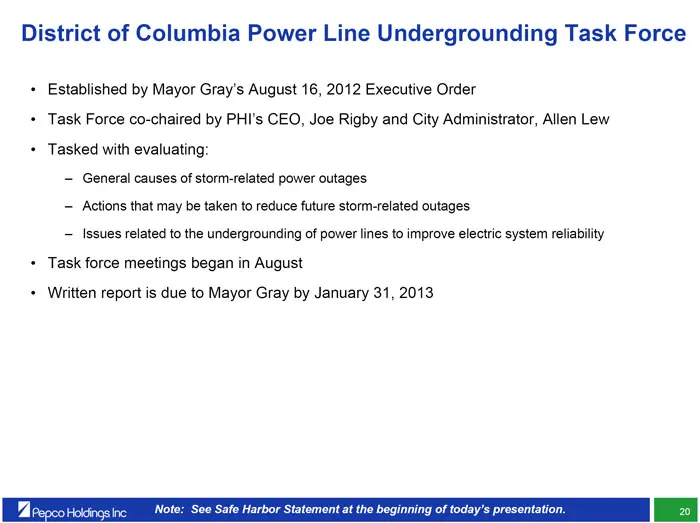
District of Columbia Power Line Undergrounding Task Force • Established by Mayor Gray’s August 16, 2012 Executive Order • Task Force co-chaired by PHI’s CEO, Joe Rigby and City Administrator, Allen Lew • Tasked with evaluating: – General causes of storm-related power outages – Actions that may be ta
Slide 22: Pepco Energy Services – Overview
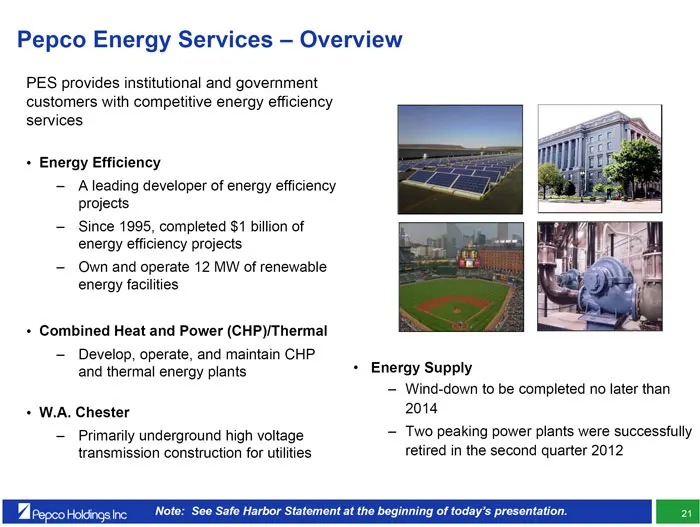
Pepco Energy Services – Overview PES provides institutional and government customers with competitive energy efficiency services • Energy Efficiency – A leading developer of energy efficiency projects – Since 1995, completed $1 billion of energy efficiency projects – Own and operate 12 MW of renewab
Slide 23: Pepco Energy Services – Business Development and Marketing Update
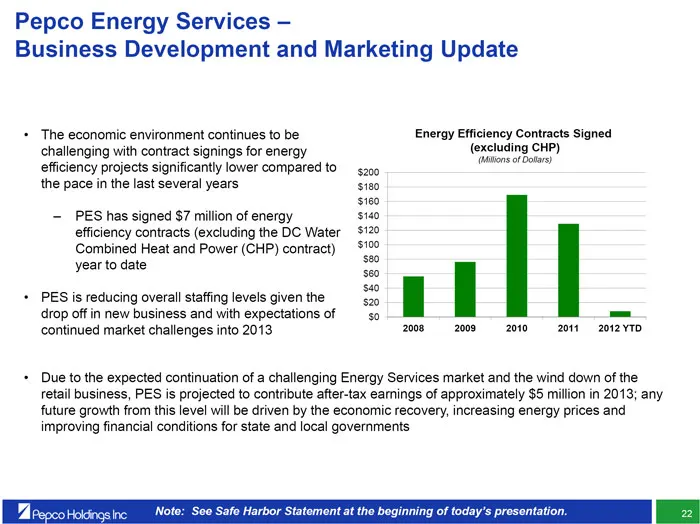
Pepco Energy Services – Business Development and Marketing Update • The economic environment continues to be challenging with contract signings for energy efficiency projects significantly lower compared to the pace in the last several years – PES has signed $7 million of energy efficiency contracts
Slide 24: Cross-Border Energy Lease Portfolio
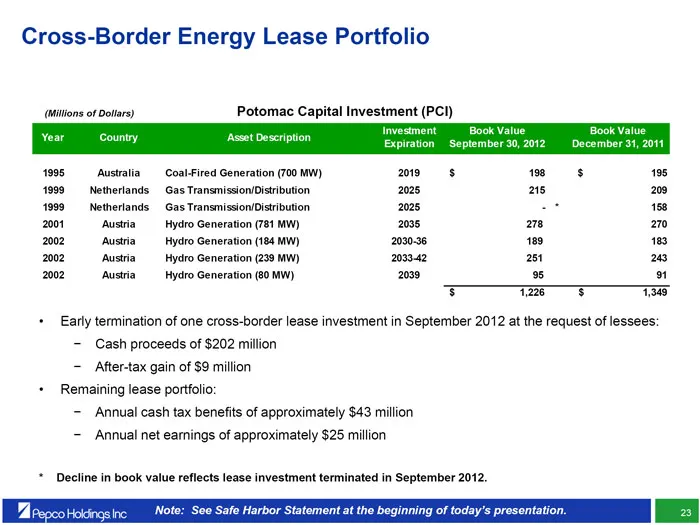
Cross-Border Energy Lease Portfolio (Millions of Dollars) Potomac Capital Investment (PCI) Investment Book Value Book Value Year Country Asset Description Expiration September 30, 2012 December 31, 2011 1995 Australia Coal-Fired Generation (700 MW) 2019 $ 198 $ 195 1999 Netherlands Gas Transmission/
Slide 25: 2012 Earnings Guidance
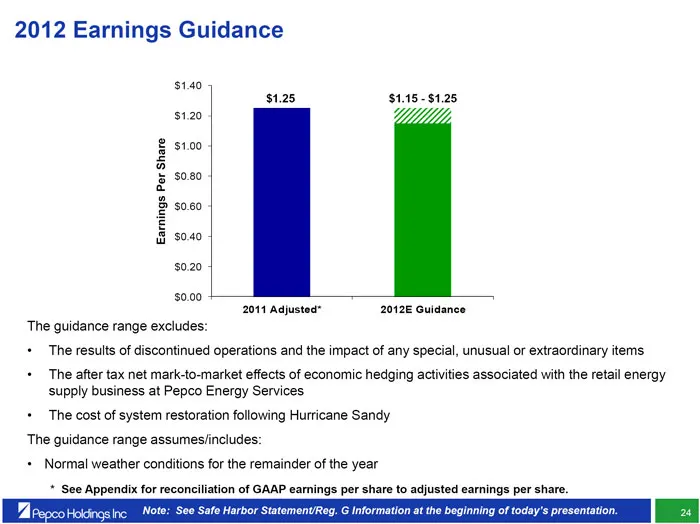
2012 Earnings Guidance $1.40 $1.25 $1.15 - $1.25 $1.20 $1.00 $0.80 $0.60 Earnings Per Share $0.40 $0.20 $0.00 2011 Adjusted* 2012E Guidance The guidance range excludes: • The results of discontinued operations and the impact of any special, unusual or extraordinary items • The after tax net mark-to-
Slide 26: Investment Highlights
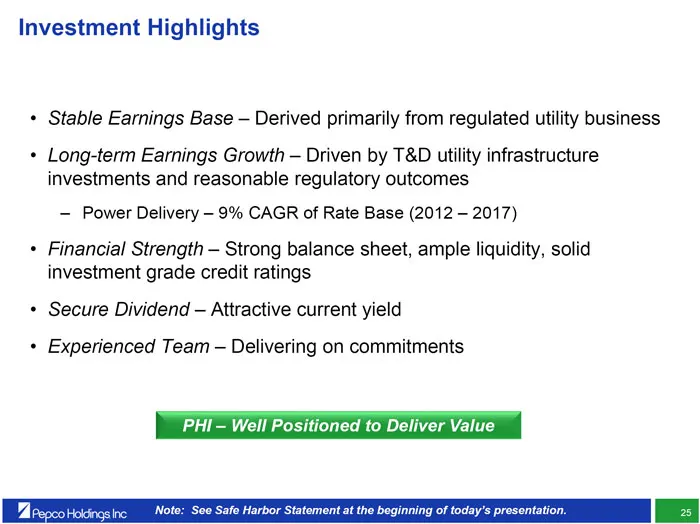
Investment Highlights • Stable Earnings Base – Derived primarily from regulated utility business • Long-term Earnings Growth – Driven by T&D utility infrastructure investments and reasonable regulatory outcomes – Power Delivery – 9% CAGR of Rate Base (2012 – 2017) • Financial Strength – Strong balan
Slide 27: Appendix
Appendix
Slide 28: Adjusted Earnings Per Share Variance – Three Months Ended September 30
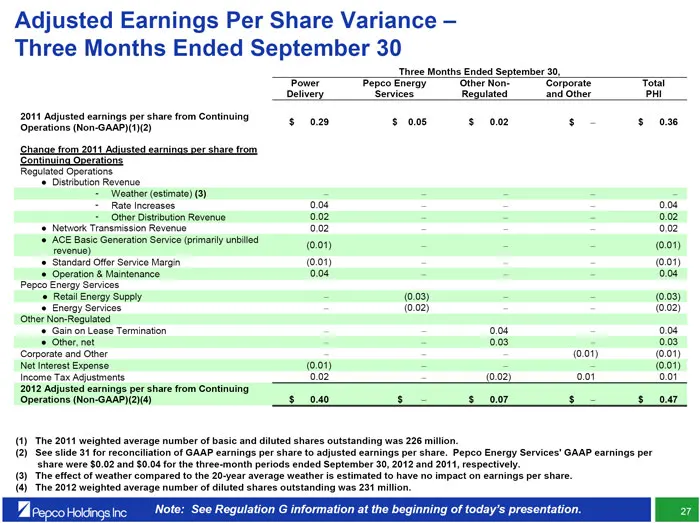
Adjusted Earnings Per Share Variance –Three Months Ended September 30 Three Months Ended September 30, Power Pepco Energy Other Non- Corporate Total Delivery Services Regulated and Other PHI 2011 Adjusted earnings per share from Continuing $ 0.29 $ 0.05 $ 0.02 $ $ 0.36 Operations (Non-GAAP)(1)(2)
Slide 29: Adjusted Earnings Per Share Variance – Nine Months Ended September 30
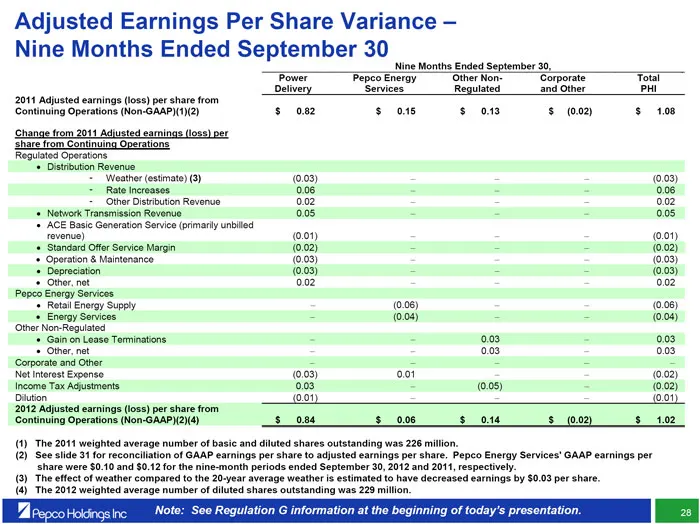
Adjusted Earnings Per Share Variance –Nine Months Ended September 30 Nine Months Ended September 30, Power Pepco Energy Other Non- Corporate Total Delivery Services Regulated and Other PHI 2011 Adjusted earnings (loss) per share from Continuing Operations (Non-GAAP)(1)(2) $ 0.82 $ 0.15 $ 0.13 $ (0.0
Slide 30: Projected Rate Base by Utility
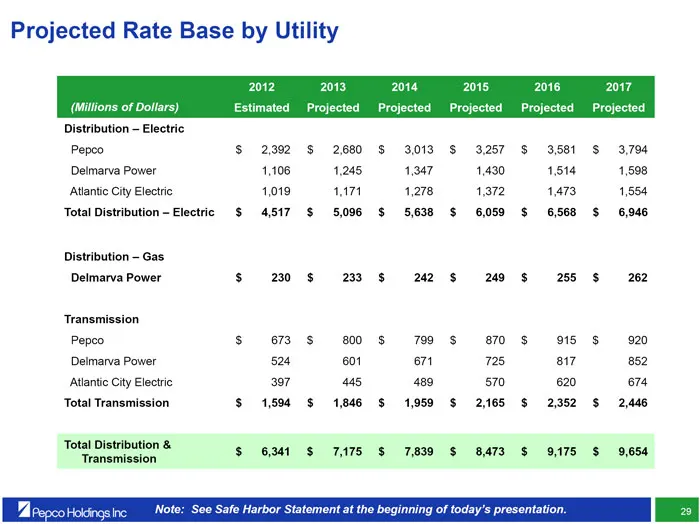
Projected Rate Base by Utility 2012 2013 2014 2015 2016 2017 (Millions of Dollars) Estimated Projected Projected Projected Projected Projected Distribution – Electric Pepco $ 2,392 $ 2,680 $ 3,013 $ 3,257 $ 3,581 $ 3,794 Delmarva Power 1,106 1,245 1,347 1,430 1,514 1,598 Atlantic City Electric 1,019
Slide 31: Closing the ROE Gap – An Earnings Growth Opportunity
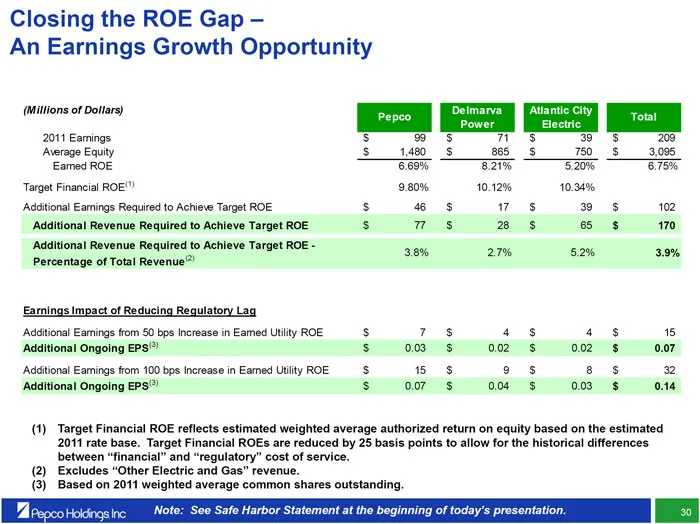
Closing the ROE Gap – An Earnings Growth Opportunity (Millions of Dollars) Delmarva Atlantic City Pepco Total Power Electric 2011 Earnings $ 99 $ 71 $ 39 $ 209 Average Equity $ 1,480 $ 865 $ 750 $ 3,095 Earned ROE 6.69% 8.21% 5.20% 6.75% Target Financial ROE (1) 9.80% 10.12% 10.34% Additional Earnin
Slide 32: Reconciliation of GAAP Earnings to Adjusted Earnings
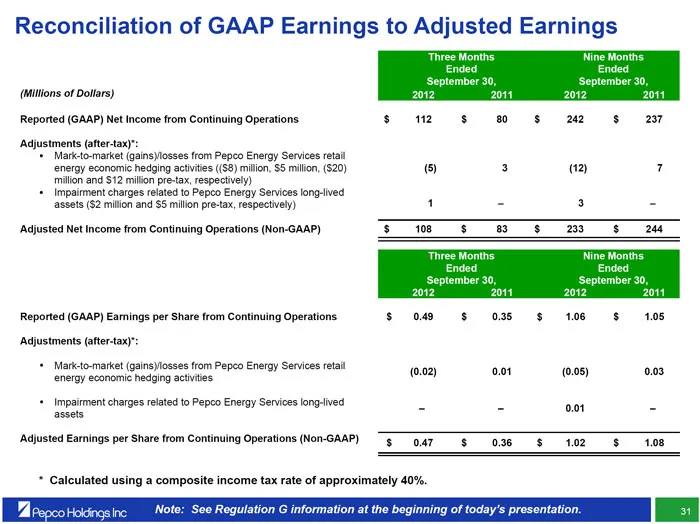
Reconciliation of GAAP Earnings to Adjusted Earnings Three Months Nine Months Ended Ended September 30, September 30, (Millions of Dollars) 2012 2011 2012 2011 Reported (GAAP) Net Income from Continuing Operations $ 112 $ 80 $ 242 $ 237 Adjustments (after-tax)*: • Mark-to-market (gains)/losses from
Slide 33: Reconciliation of GAAP EPS to Adjusted EPS
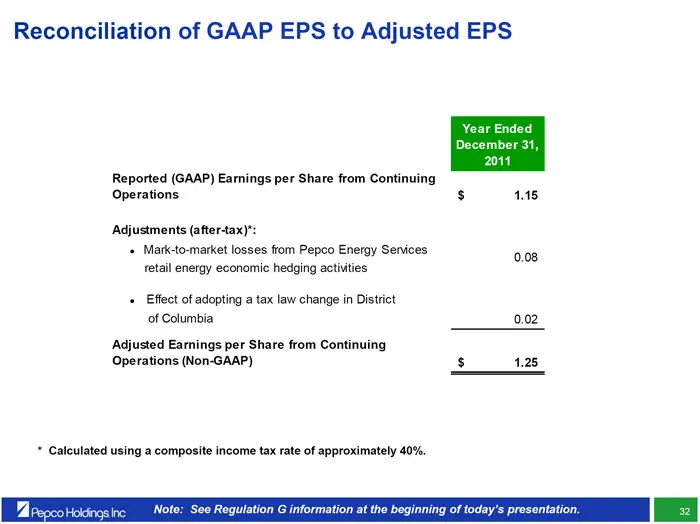
Reconciliation of GAAP EPS to Adjusted EPS Year Ended December 31, 2011 Reported (GAAP) Earnings per Share from Continuing Operations $ 1.15 Adjustments (after-tax)*: • Mark-to-market losses from Pepco Energy Services 0.08 retail energy economic hedging activities • Effect of adopting a tax law chan
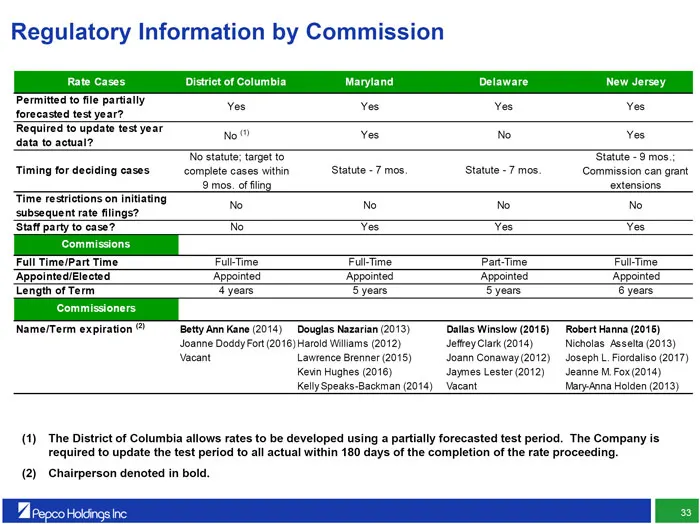
Slide 34: Regulatory Information by Commission
Regulatory Information by Commission Rate Cases District of Columbia Maryland Delaware New Jersey Permitted to file partially Yes Yes Yes Yes forecasted test year? Required to update test year No (1) Yes No Yes data to actual? No statute; target to Statute - 9 mos.; Timing for deciding cases complet
Source: SEC EDGAR · 8-K filed Dec 4, 2012
More decks from Pepco Holdings Inc
 Merger or Acquisition (August 2014)15 slides · Aug 19, 2014
 Merger or Acquisition (May 2014)44 slides · May 23, 2014
 Q1 2014 Earnings Presentation14 slides · May 7, 2014
 Williams Capital Group Midwest Utilities Seminar (April 2014)35 slides · Apr 9, 2014
 Investor Day (March 2014)109 slides · Mar 21, 2014
 Morgan Stanley Utilities Conference 201439 slides · Feb 28, 2014