Capital Bank Financial — Investor Presentation (February 2013)
27 slides from Capital Bank Financial's investor presentation, Feb 6, 2013

Slide 1: Capital Bank Financial Corp. Investor Presentation February 2013
@® CAPITAL BANK FINANCIAL CORP Investor Presentation February 2013
Slide 2: Safe Harbor Statement
Safe Harbor Statement Forward-Looking Statements. This presentation contains forward-looking statements. Any statements about our expectations, beliefs, plans, predictions, forecasts, objectives, assumptions or future events or performance are not historical facts and may be forward-looking. These s
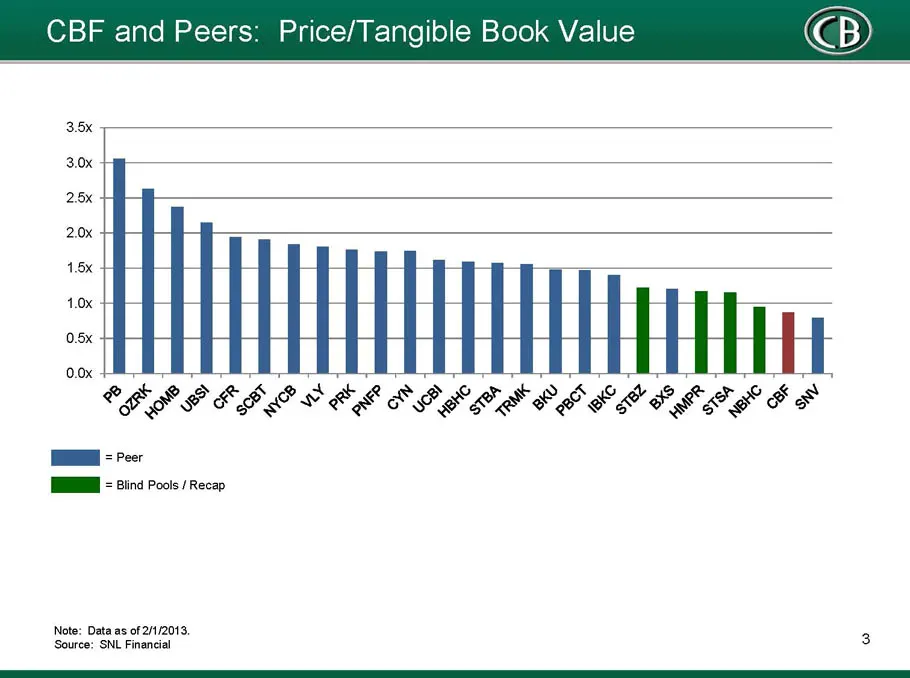
Slide 3: CBF and Peers: Price/Tangible Book Value
CBF and Peers: Price/Tangible Book Value I = Peer [EE = Blind Poois / Recap Note: Data as of 21/2013, 3 Source: SNL Financial
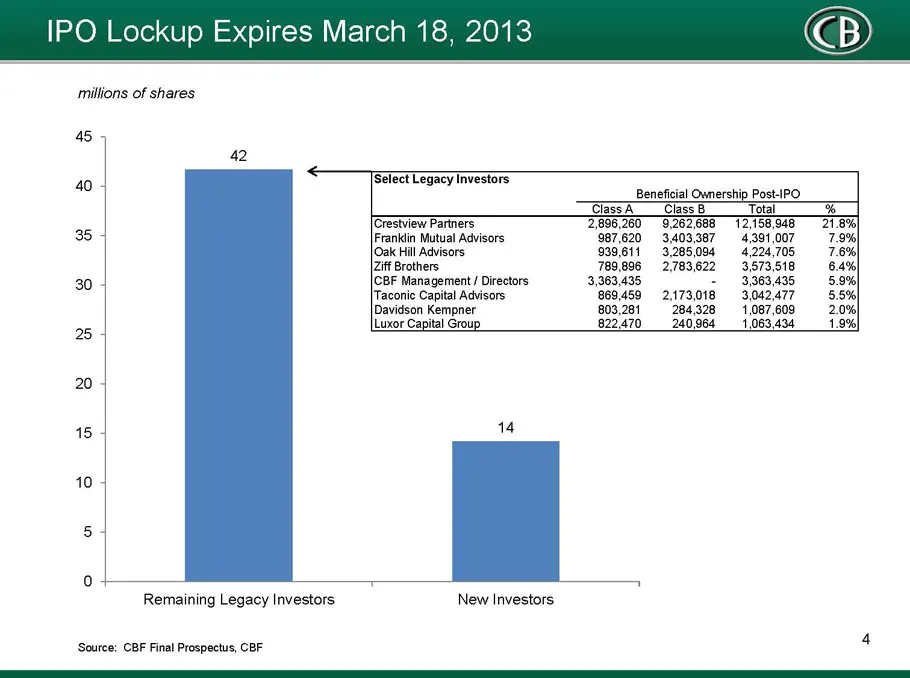
Slide 4: IPO Lockup Expires March 18, 2013
IPO Lockup Expires March 18, 2013 millions of shares 45 42 iG [Select Legacy Investors [Crestview Partners E 35 Franklin Mutual Advisors 3,403,387 4,391,007 7.9%| JOak Hill Advisors 3.285094 4.224.705 7.6% Ziff Brothers 2703622 3873518 6.4% 30 [CBF Management / Directors = 3363435 5.9% [Taconic Capi
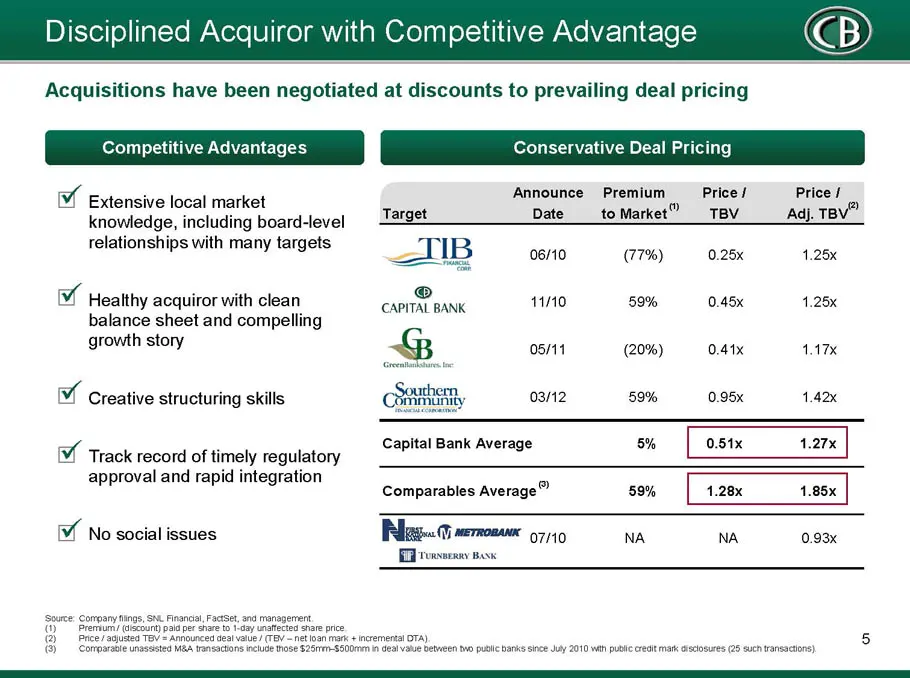
Slide 5: Disciplined Acquirer with Competitive Advantages
Disciplined Acqu Competitive Advantag Acquisitions have been negotiated at discounts to prevailing deal pricing Competitive Advantages Conservative Deal Pricing ia Esdensive local market Announce Premium Price/ Price / 5: o knowledge, including board-level Tatget Deto SE tOIN A tho nT Adj. TV" relat
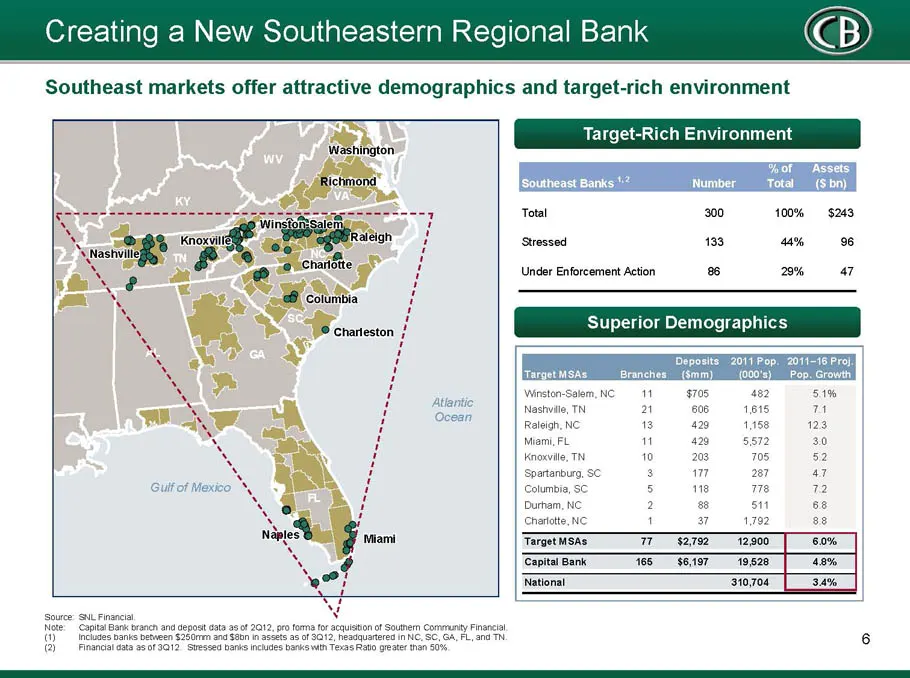
Slide 6: Southeast markets offer attractive demographics and target-rich environment
Southeast markets offer attractive demographics and target-rich environment Target-Rich Environmen' thot Assets. [Southeast Banks "2 Number Total __($ bn) Total 300 100% $243, Stressed 133 44% 96 Under Enforcement Action 86 20% = 47 Winston-Salom.NC 11 $708. 482 51% Nashwile, TN a 605 1,815 74 Ralei
Slide 7: Southern Community Branches Rebranded
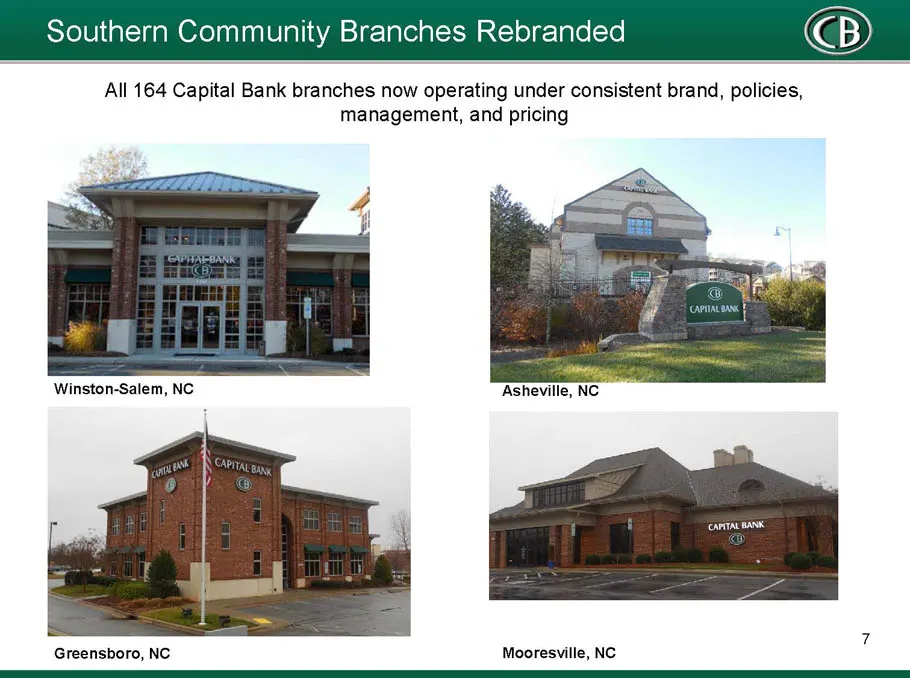
Southern Community Branches Rebranded All 164 Capital Bank branches now operating under consistent brand, policies, management, and pricing Winston-Salem, NC Greensboro, NC Mooresville, NC Nene a ea
Slide 8: Successful Customer Conversion
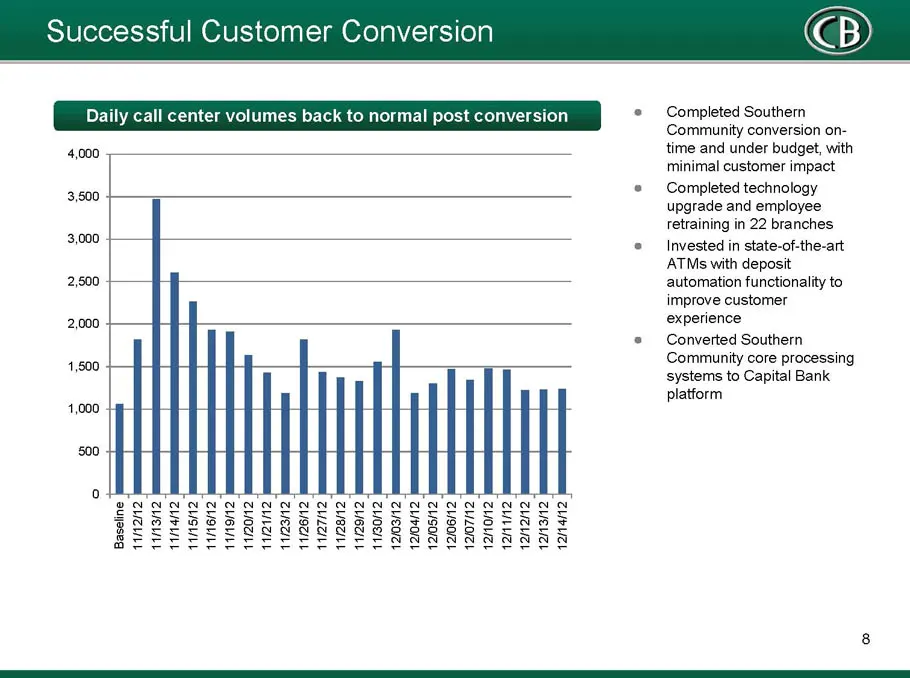
Successful Customer Conversion Daily call center volumes back to normal post conver: ° Completed Southern Community conversion on- 4000 time and under budget, with minimal customer impact on © Completed technology : upgrade and employee retraining in 22 branches $1000) © Invested in state-of-the-art
Slide 9: Fourth-Quarter Highlights
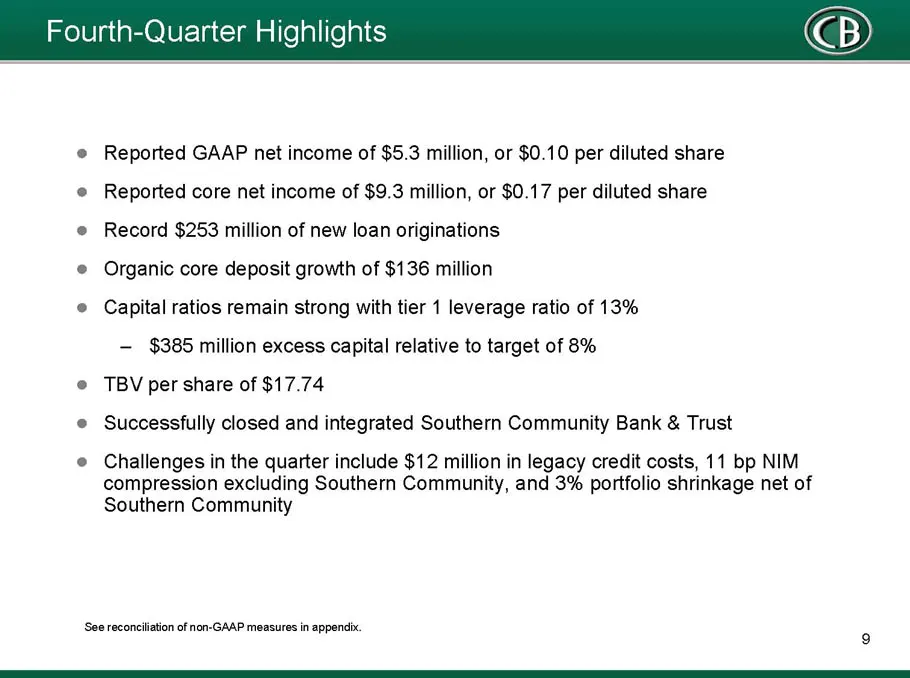
Fourth-Quarter Highlights e Reported GAAP net income of $5.3 million, or $0.10 per diluted share e Reported core net income of $9.3 million, or $0.17 per diluted share e Record $253 million of new loan originations e Organic core deposit growth of $136 million e Capital ratios remain strong with tie
Slide 10: Fourth-Quarter Earnings Summary
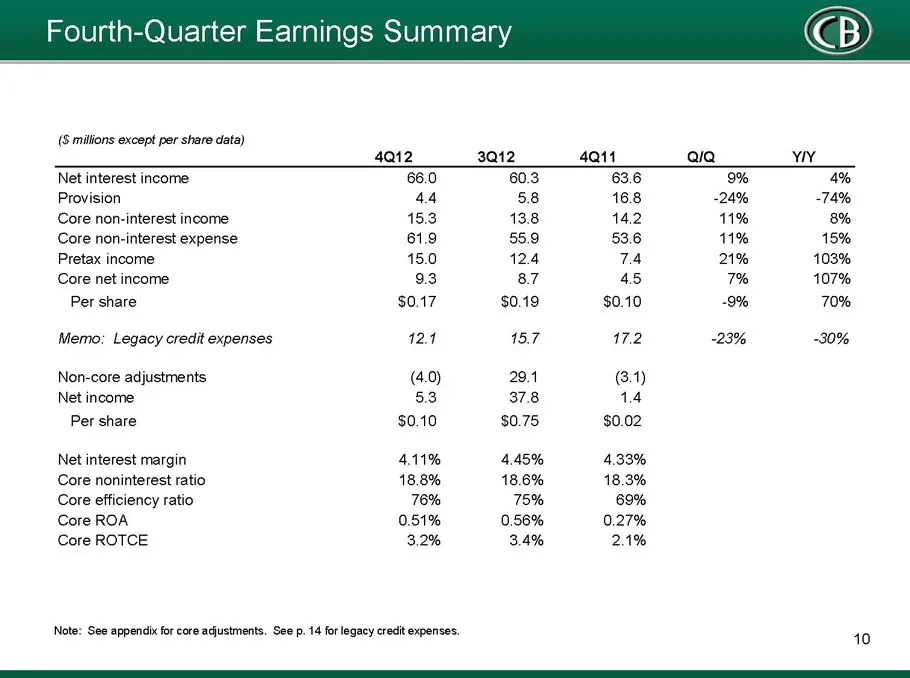
Fourth-Quarter Earnings Summa (S millions except per share data) 412 3Q12 4att aia YN Net interest income 66.0 603 636 0% 4% Provision 44 58 16.8 -28% 74% Core non- interest income 153 138 14.2 11% 8% Core non-interest expense 61.9 55.9 53.6 11% 15% Pretax income 15.0 12.4 74 21% 103% Core net incom
Slide 11: Strong Momentum in New Loan Production
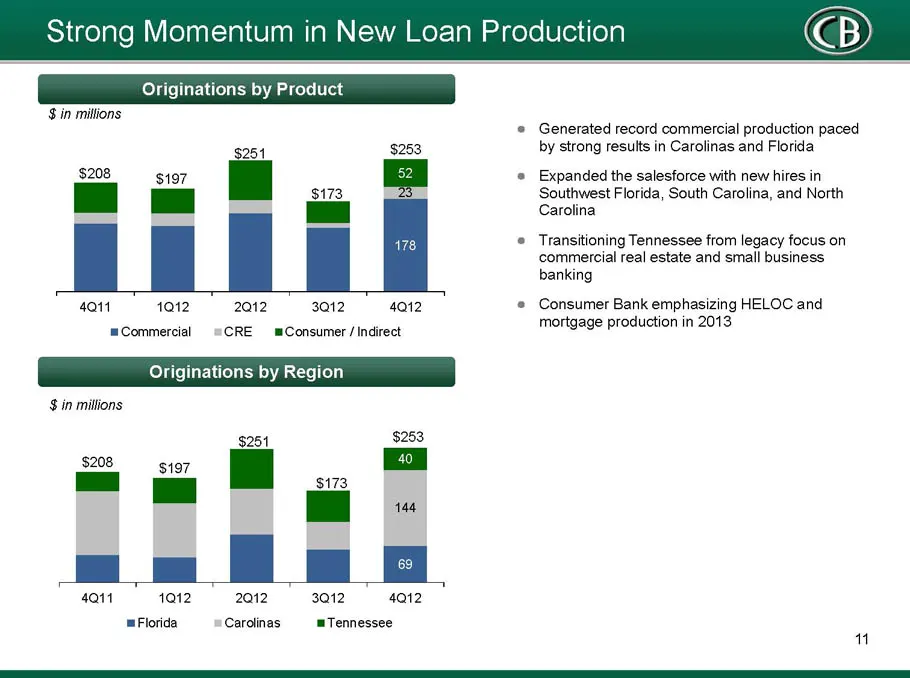
Strong Momentum in New Loan Production Originations by Product $ in milions © Generated record commercial production paced eat $253 by strong results in Carolinas and Florida $208 $197 El © Expanded the salesforce with new hires in ‘Southwest Florida, South Carolina, and North Carolina Transitioning
Slide 12: Portfolio Growth Impacted by Strategic Payoffs
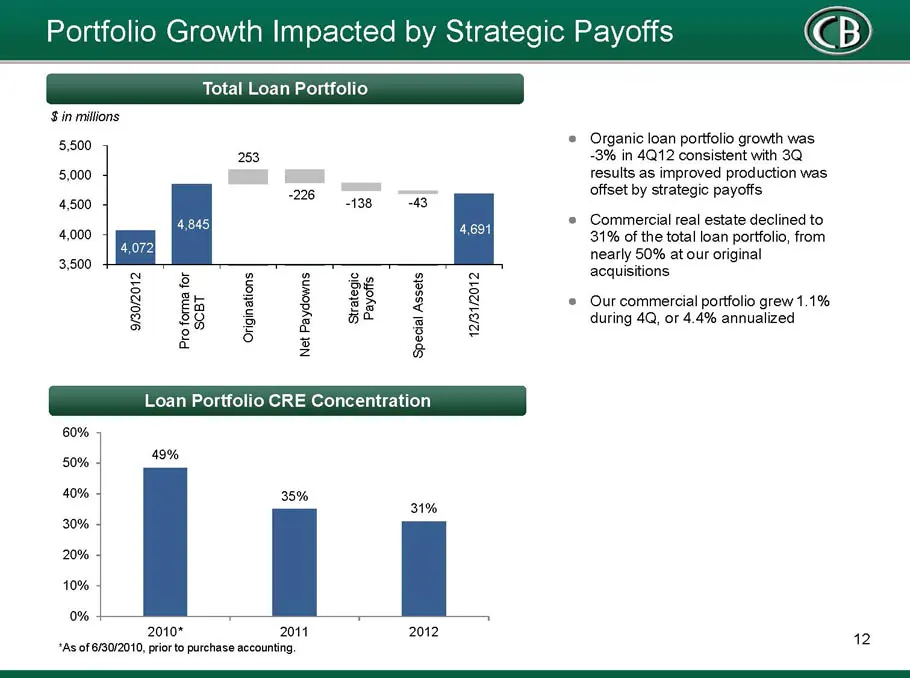
Portfolio Growth Impacted by Strategic Payoffs ital Loan Portfolio $ in millions _ © Organic loan portfolio growth was ° 253 -3% in 4Q12 consistent with 3Q 5,000 results as improved production was E offset by strategic payoffs 08 226 a as y strategic pay © Commercial real estate declined to 4,000 31
Slide 13: Strong Organic Core Deposit Growth
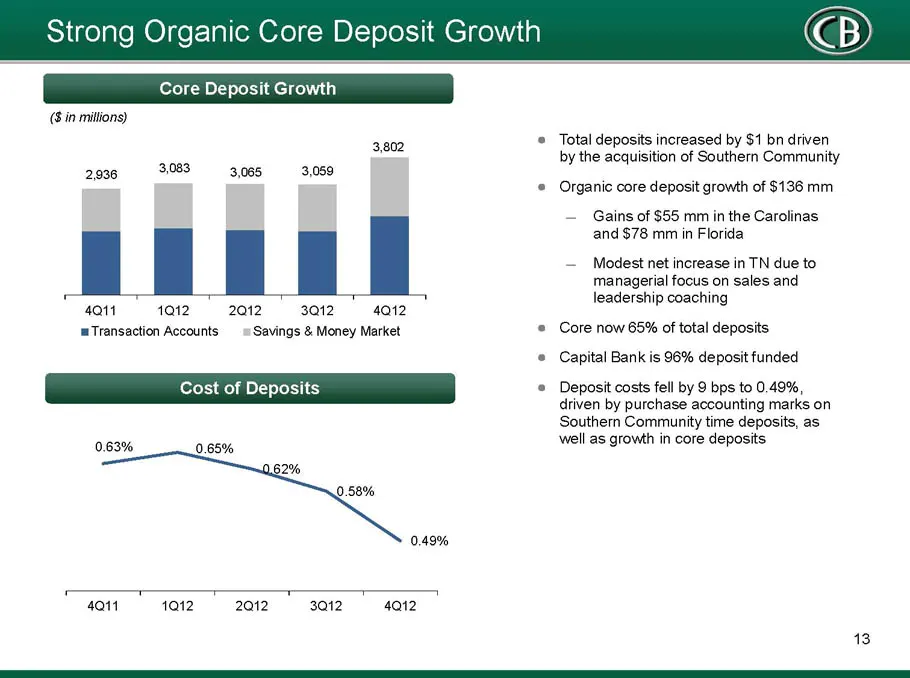
Strong Organic Core Deposit Growth Core Deposit Growth (Bin mitions) ee © Total deposits increased by $1 bn driven . by the acquisition of Southern Community © Organic core deposit growth of $136 mm — Gains of $55 mm in the Carolinas and $78 mm in Florida — Modest net increase in TN due to manageria
Slide 14: Ex Southern Community, NIM Continues to Normalize
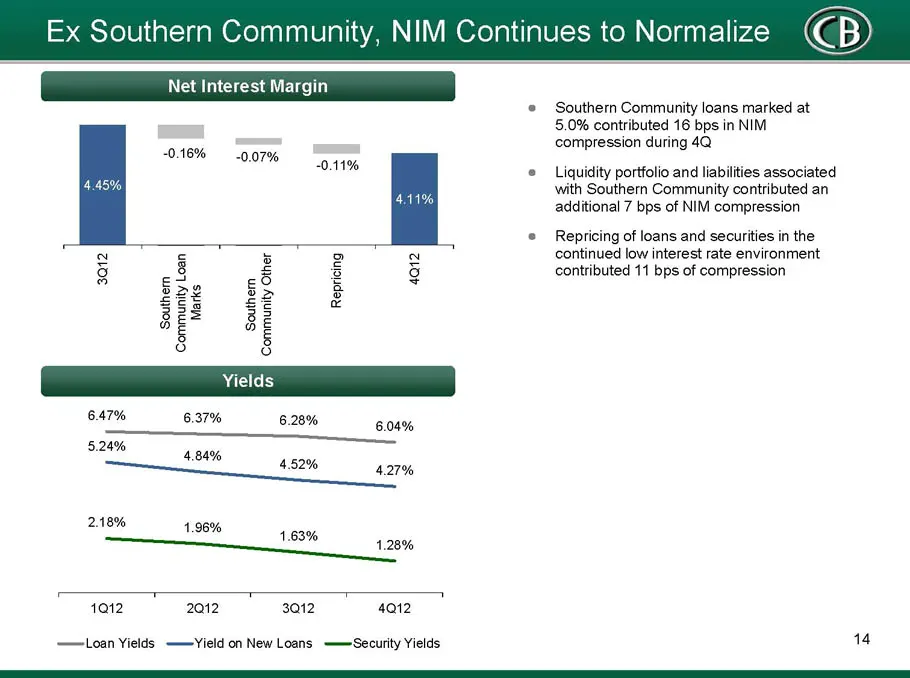
Ex Southern Community, NIM Continues to Normalize Net Interest Margin © Southern Community loans marked at 5.0% contributed 16 bps in NIM compression during 4Q 0.16% 0.07% 70.1196 Liquidity portfolio and liabilities associated ‘with Southern Community contributed an additional 7 bps of NIM compressi
Slide 15: Expanding Core Non-interest Income
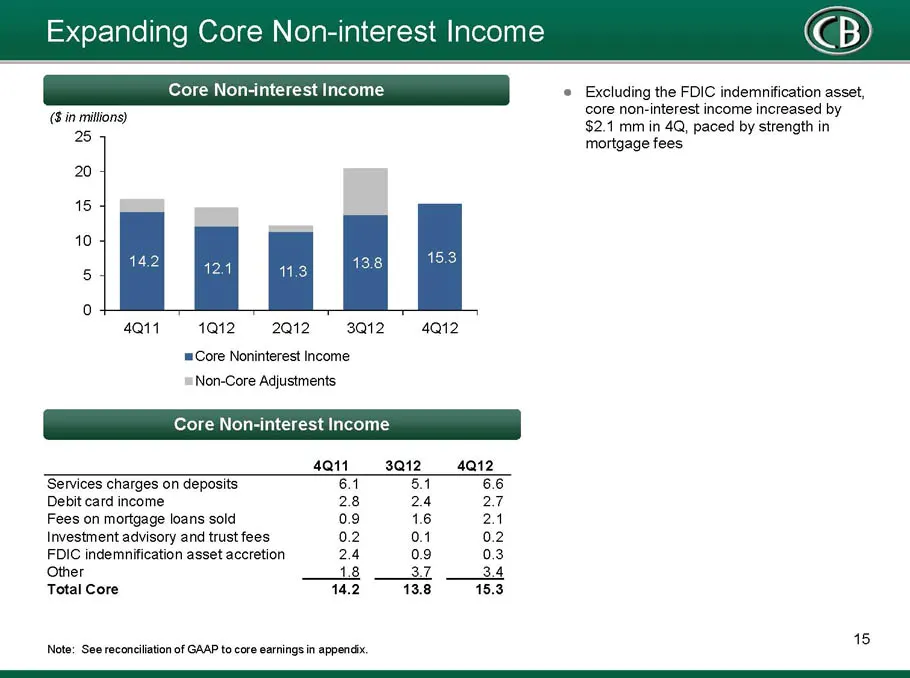
Expanding Core Non-interest Income Core Not terest Income Excluding the FDIC indemnification asset, core non-interest income increased by Grmiony) $2.1 mm in 4Q, paced by strength in 25 mortgage fees 4011 1012, 212, 3Q12_— 412 ™Core Noninterest Income Non-Core Adjustments Core Non-interest Income 4a
Slide 16: Progress in Rationalizing Cost Base
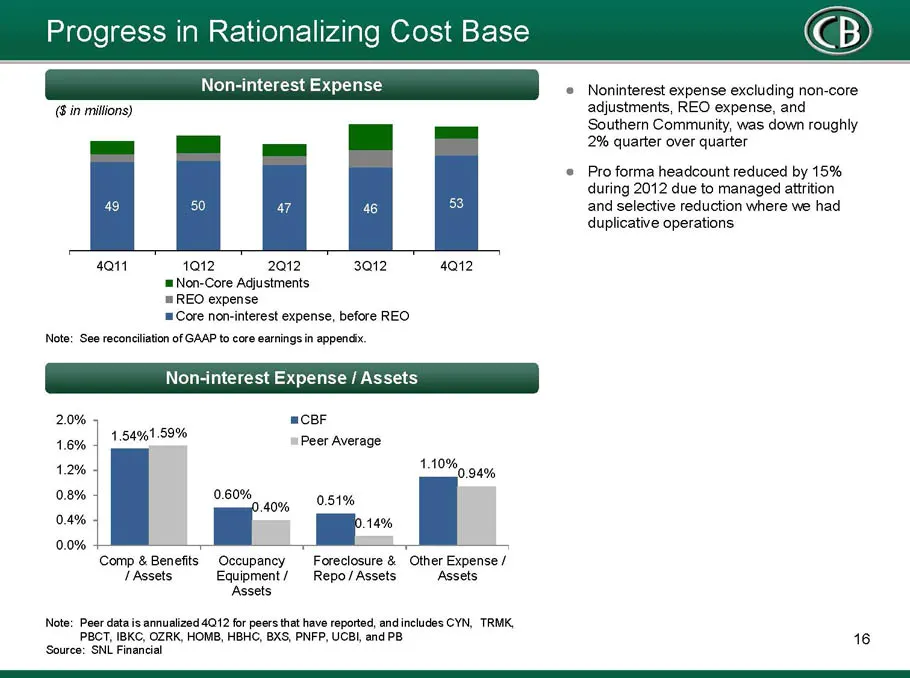
Progress in Rationalizing Cost Base Non-interest Expense © Noninterest expense excluding non-core adjustments, REO expense, and Southern Community, was down roughly 2% quarter over quarter (Gin milions) © Pro forma headcount reduced by 15% during 2012 due to managed attrition and selective reduction
Slide 17: Steady Progress Resolving Problem Assets
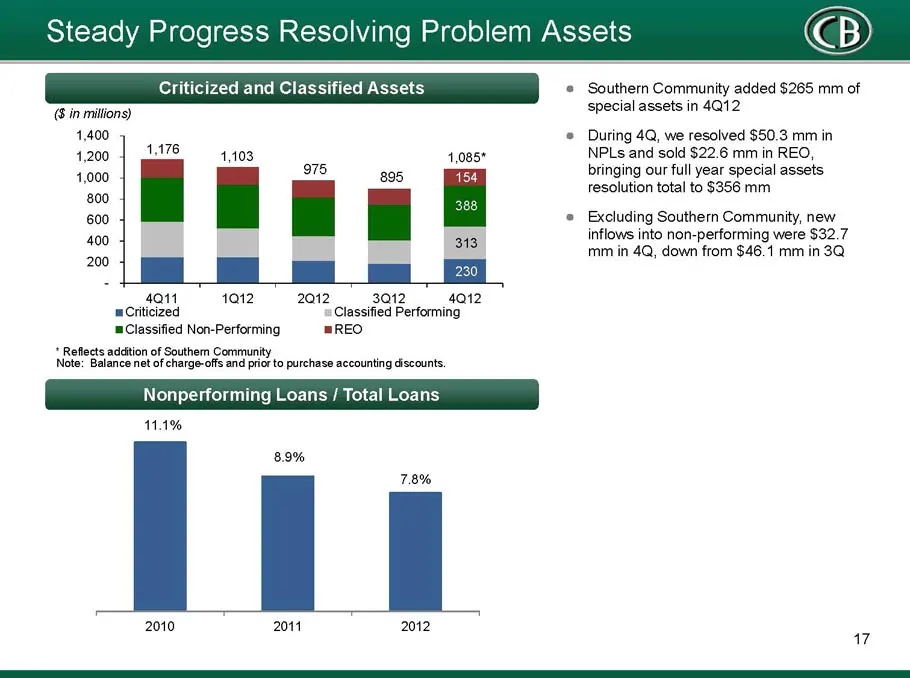
Steady Progress Resolving Problem Assets Criticized and Classified Assets Southern Community added $265 mm of 8 in millions) special assets in 4Q12 1,400 * During 4Q, we resolved $50.3 mm in 4,176 1,200 4,103, NPLs and sold $22.6 mm in REO, 975 bringing our full year special assets pues i ae tesolut
Slide 18: REO Expenses Remain Elevated
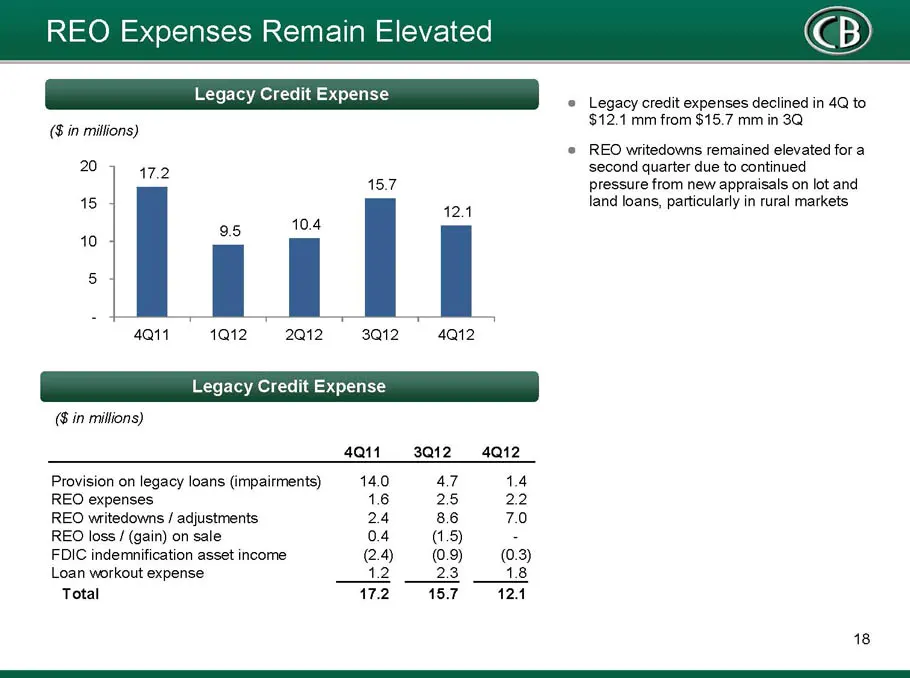
REO Expenses Remain Elevated Legacy Credit Expense © Legacy credit expenses declined in 4Q to (inimilions) $12.1 mm from $15.7 mm in 3Q ‘© REO writedowns remained elevated for a 247 472 second quarter due to continued é 15.7 pressure from new appraisals on lot and 15 ea land loans, particularly in r
Slide 19: Expecting to achieve loan portfolio growth on origination momentum
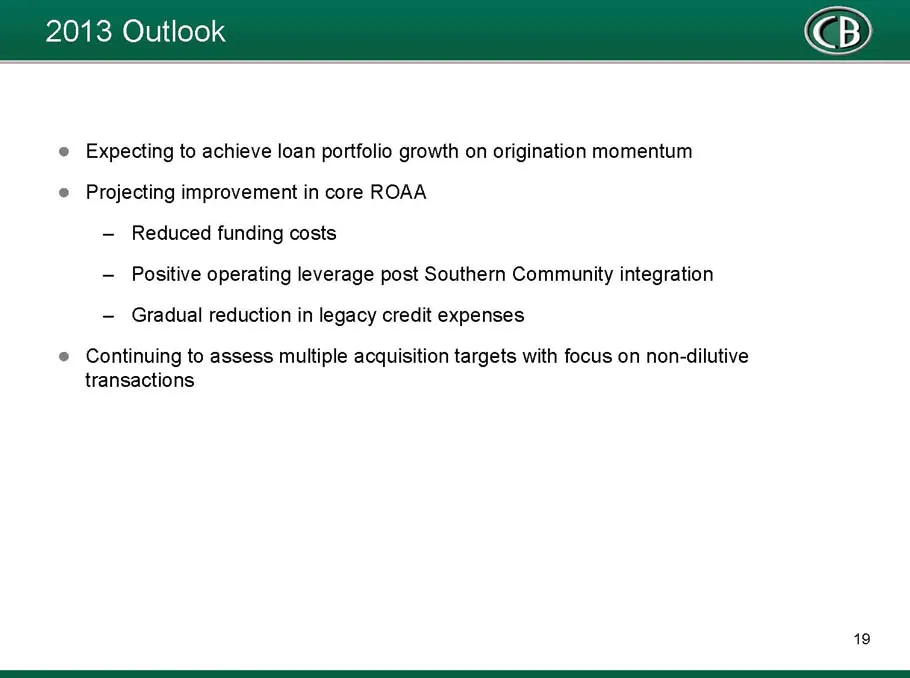
e Expecting to achieve loan portfolio growth on origination momentum e Projecting improvement in core ROAA — Reduced funding costs - Positive operating leverage post Southern Community integration - Gradual reduction in legacy credit expenses e Continuing to assess multiple acquisition targets with
Slide 20: Appendix
Appendix 20
Slide 21: Reconciliation of Core Net Income
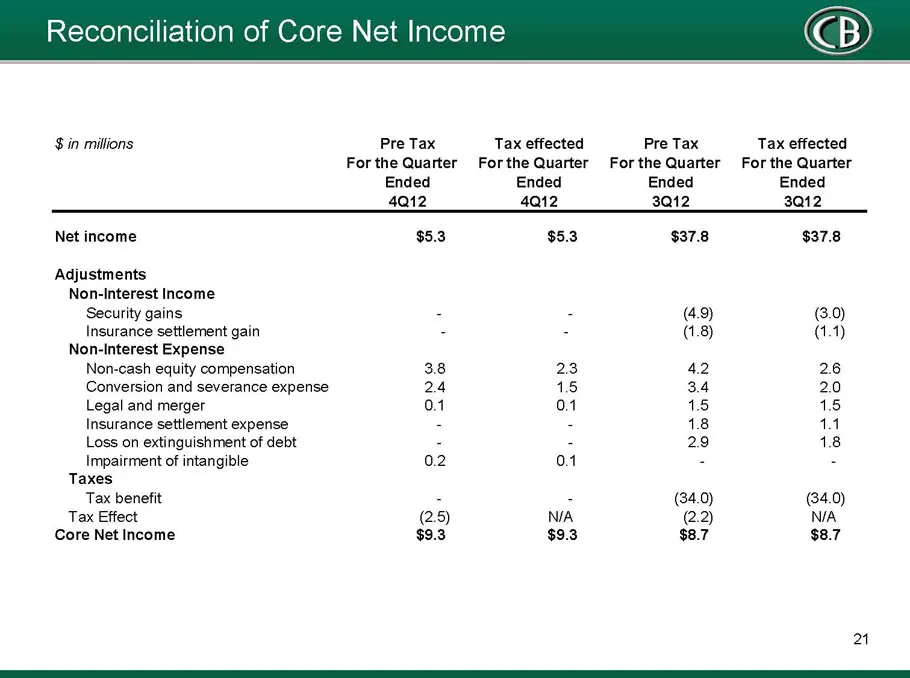
Reconciliation of Core Net Income $ in millions Pre Tax Tax effected Pre Tax Tax effected For the Quarter Forthe Quarter For the Quarter For the Quarter Ended Ended Ended Ended 412 412 3012 3012 Net income $5.3 $5.3 $37.8 $37.8 Adjustments Non-Interest Income Security gains « (4.9) 0) Insurance sett
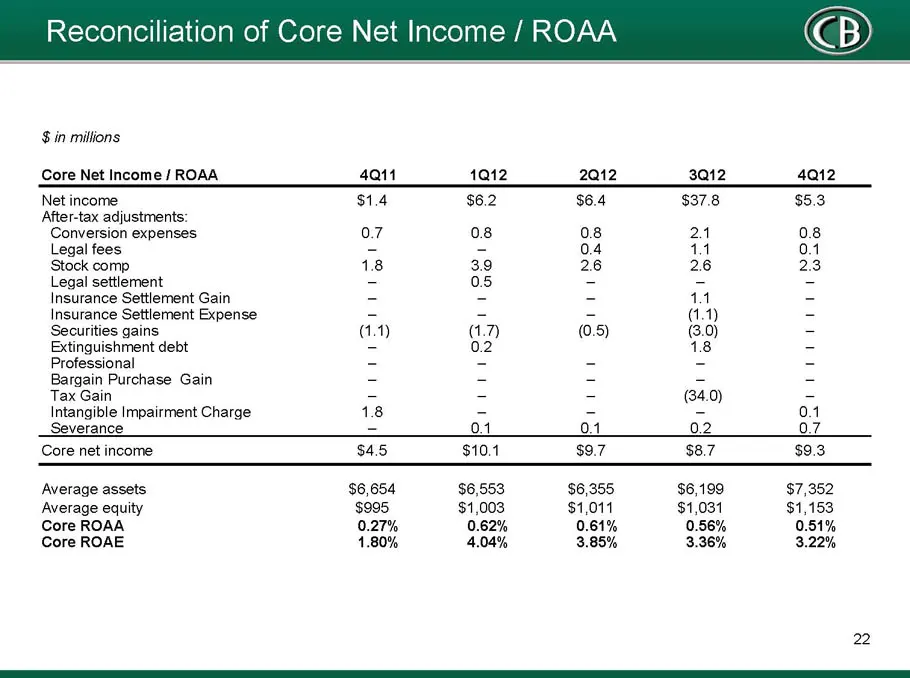
Slide 22: Reconciliation of Core Net Income / ROAA
conciliation of Core Net Income / ROAA $ in millions Core Net Income / ROAA 4ait 1012 2012 3Q12 4012 Net income $1.4 $6.2 $6.4 $37.8 $5.3 After-tax adjustments: Conversion expenses 07 08 08 24 08 Legal fees - - 04 44 04 Stock comp 18 39 26 26 23 Legal settlement - 05 = - = Insurance Settlement Gain
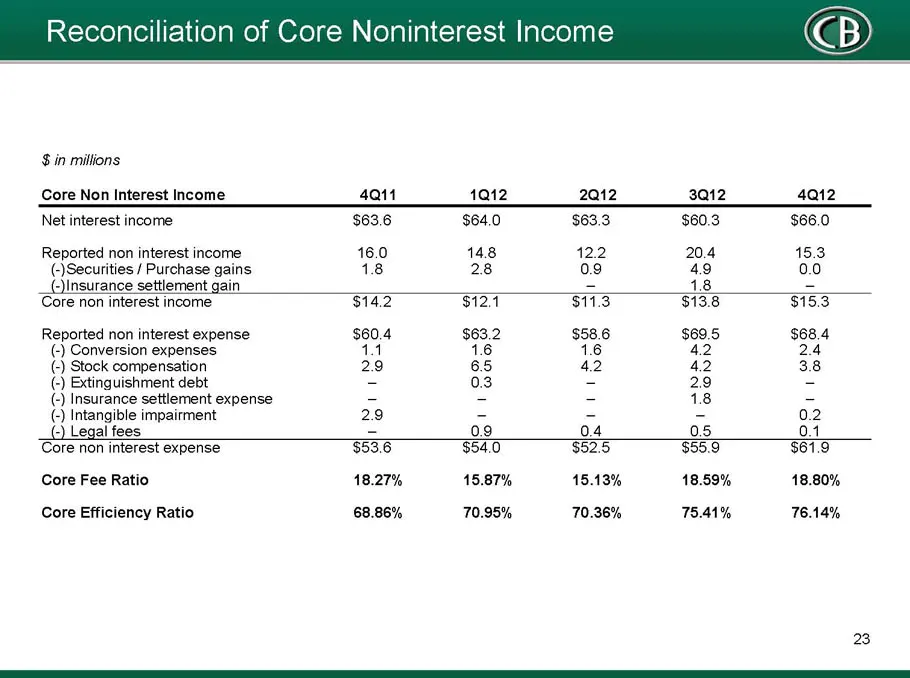
Slide 23: Reconciliation of Core Noninterest Income
conciliation of Core Noninterest Inco! $ in millions Core Non Interest Income 4ait 1012 2012 3Q12 4ai2 Net interest income $63.6 $64.0 $63.3 $60.3 $66.0 Reported non interest income 16.0 14.8 122 20.4 15.3 ()Securities / Purchase gains 18 28 09 49 0.0 (Insurance settlement gain - 18 = Core non inter
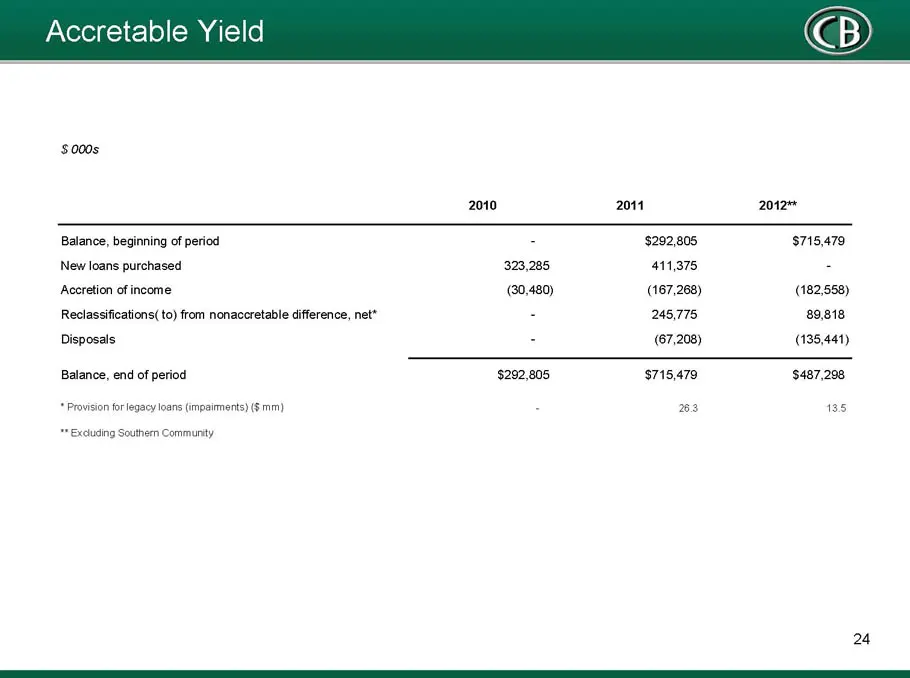
Slide 24: Accretable Yield
Accretable Yield $.000s 2010 2011 2012" Balance, beginning of period - $292,805 $715,479 New loans purchased 323,285 411,375 : Accretion of income (20,480) (167,268) (182,558) Reclassifcations( to) from nonaccretable difference, net* - 245,775 2918 Disposals : (67,208) (135,441) Balance, end of peri
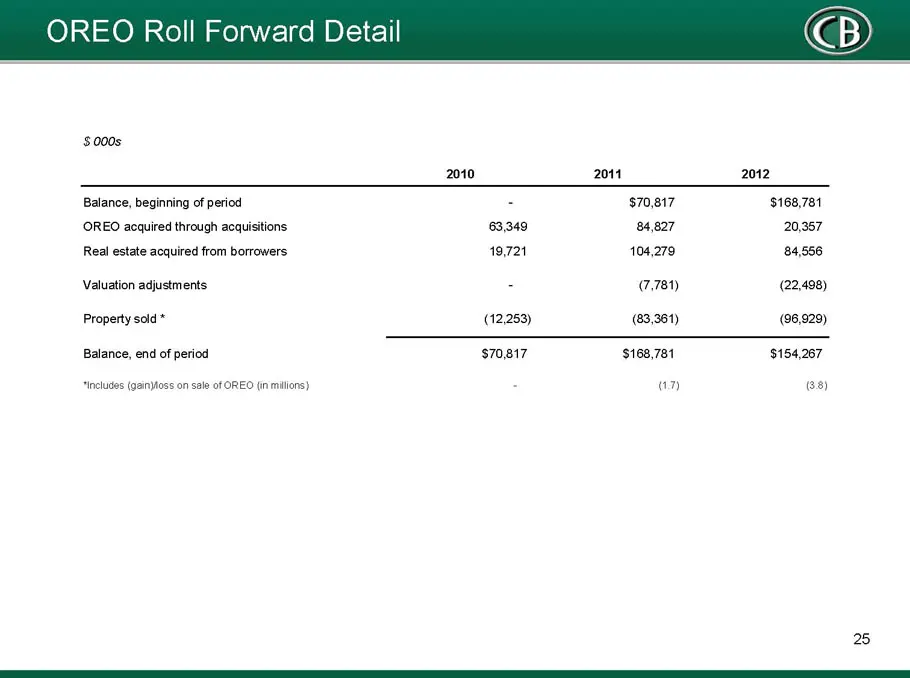
Slide 25: OREO Roll Forward Detail
OREO Roll Forward Detail $0008 2010 2011 2012 Balance, beginning of period - $70,817 $168,781 ‘OREO acquired through acquisitions 63,349 24,827 20,357 Real estate acquired from borrowers 19,721 104,279 84,556 Valuation adjustments - (7.781) (22,498) Property sold * (12,253) (83,361) (96,928) Balance
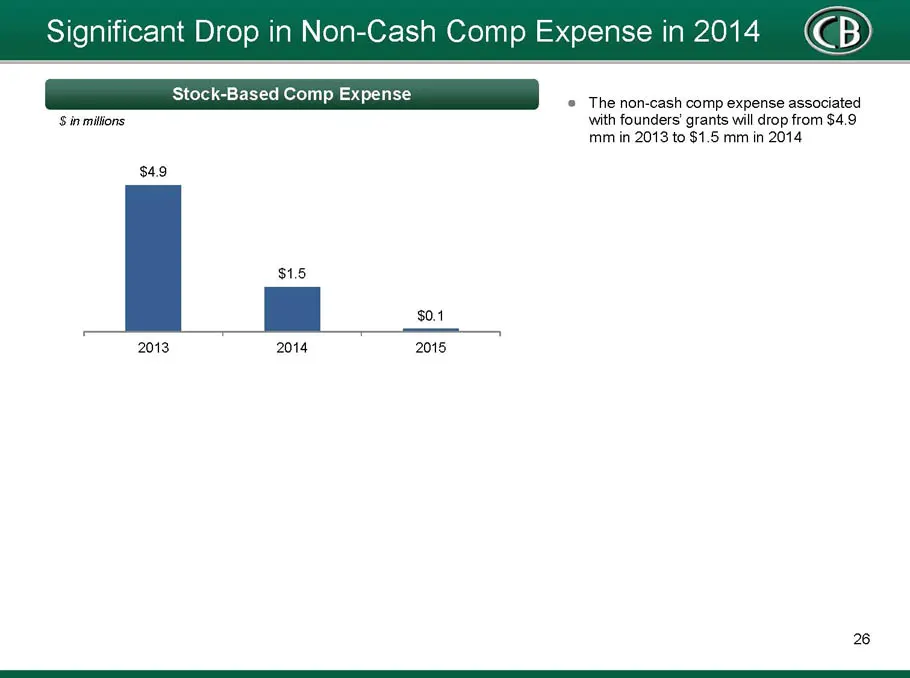
Slide 26: Significant Drop in Non-Cash Comp Expense in 2014
Significan p in Non-Cash Comp Expense in 2014 Sis Na Sa © The non-cash comp expense associated $ in milions with founders’ grants will drop from $4.9 mm in 2013 to $1.5 mm in 2014 $4.9 $1.5 [| — 2013 2014 2015 26
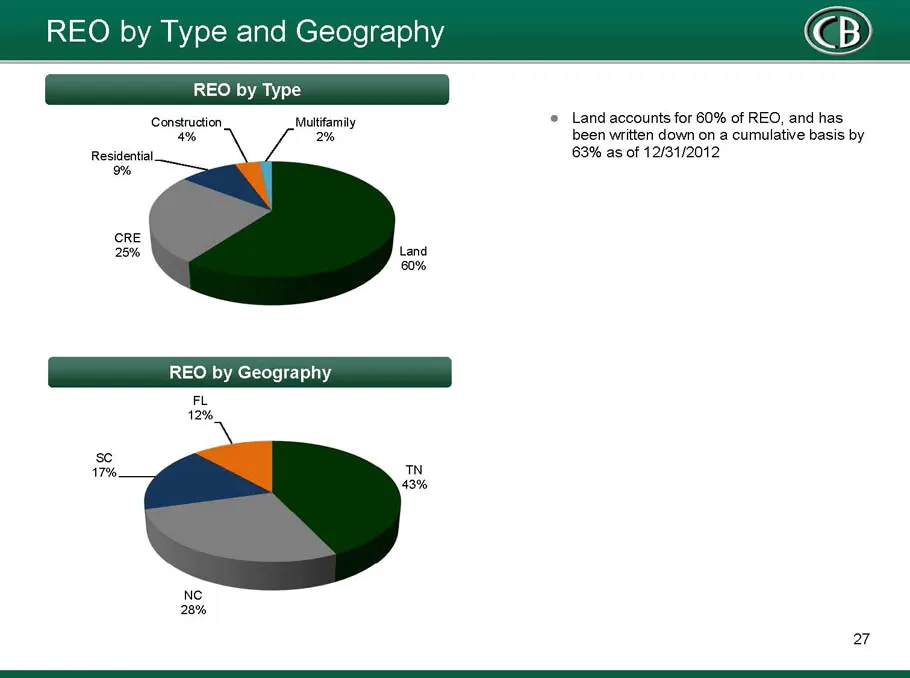
Slide 27: REO by Type and Geography
REO by Type and Geography REO by Type Construction, Matar © Land accounts for 60% of REO, and has 4% been written down on a cumulative basis by Re: enti 63% as of 12/31/2012 CRE 25% os Ne 28% 27
Source: SEC EDGAR · 8-K filed Feb 6, 2013
More decks from Capital Bank Financial Corp
 Q2 2017 Earnings Presentation22 slides · Jul 14, 2017
 Morgan Stanley Financial Services Conference 201715 slides · Jun 13, 2017
 Merger or Acquisition (June 2017)27 slides · Jun 6, 2017
 Merger or Acquisition (May 2017)17 slides · May 4, 2017
 Q1 2017 Earnings Presentation21 slides · Apr 21, 2017
 Q4 2016 Earnings Presentation25 slides · Jan 26, 2017