Capital Bank Financial — Merger or Acquisition (June 2017)
27 slides from Capital Bank Financial's merger presentation, Jun 6, 2017
Slide 1: First Horizon National Corporation Second Quarter 2017 Analyst Packet
First Horizon National Corporation Second Quarter 2017 Analyst Packet June 6, 2017
Slide 2: Disclaimer: Forward-Looking Statements
Disclaimer 2 Forward - Looking Statements This communication contains certain “forward - looking statements” within the meaning of the Private Securities Litigation Reform Act of 1995 with respect to our beliefs, plans, goals, expectations, and estimates. Forward - looking statements are not a repre
Slide 3: Building a Foundation for Attractive Long-Term Earnings Power
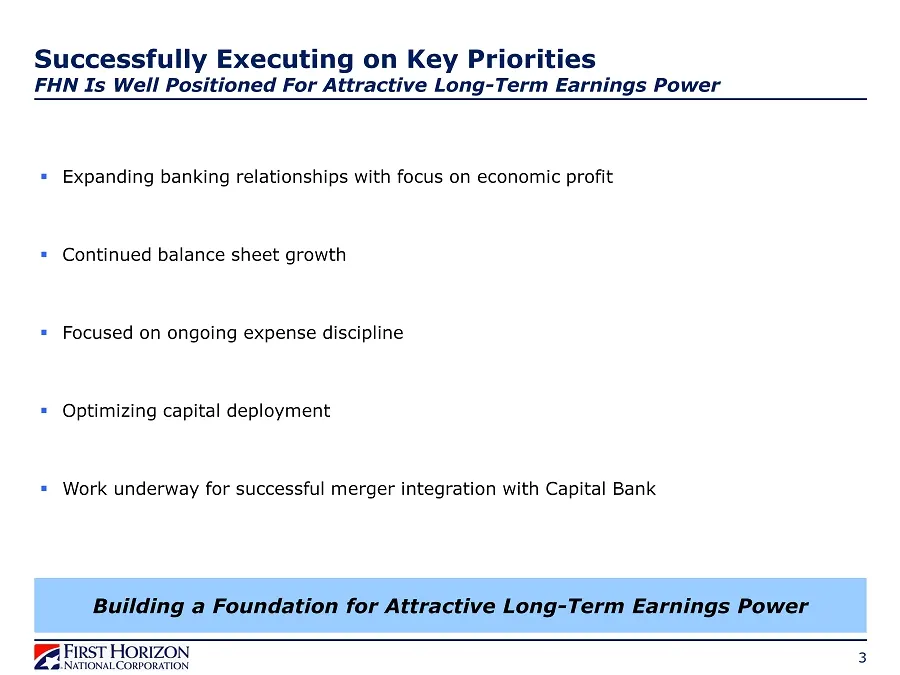
3 Building a Foundation for Attractive Long - Term Earnings Power ▪ E xpanding banking relationships with focus on economic profit ▪ Continued balance sheet growth ▪ Focused on ongoing expense discipline ▪ Optimizing capital deployment ▪ Work underway for successful merger integration with Capital B
Slide 4: Building Long-Term Earnings Power: Bonefish Targets
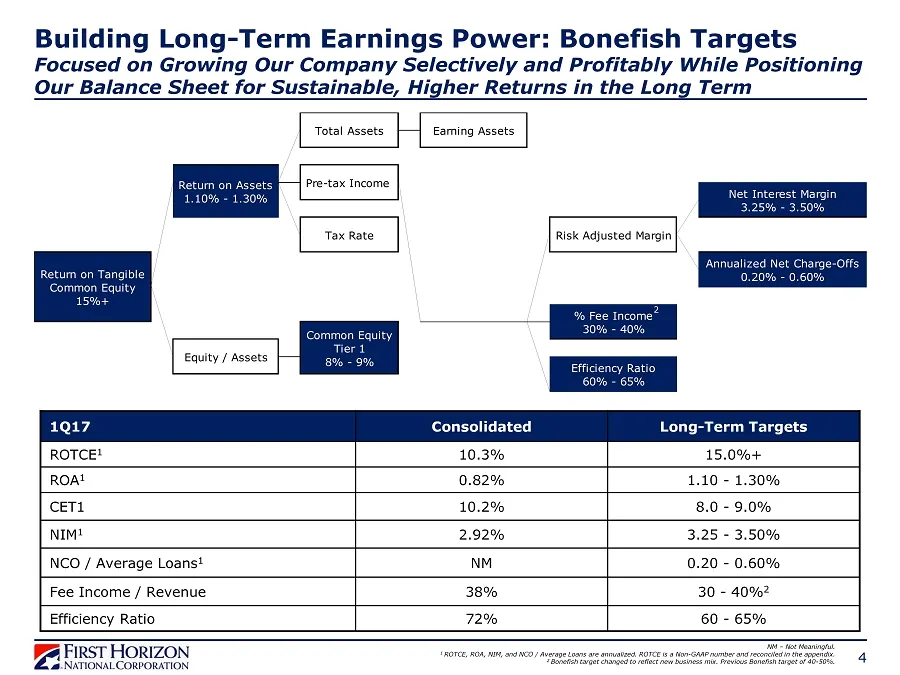
4 1Q17 Consolidated Long - Term Targets ROTCE 1 10.3% 15.0%+ ROA 1 0.82% 1.10 - 1.30% CET1 10.2% 8.0 - 9.0% NIM 1 2.92% 3.25 - 3.50% NCO / Average Loans 1 NM 0.20 - 0.60% Fee Income / Revenue 38% 30 - 40% 2 Efficiency Ratio 72% 60 - 65% NM – Not Meaningful. 1 ROTCE, ROA, NIM, and NCO / Average Loans
Slide 5: Regional Bank Performance Continues to Be Strong
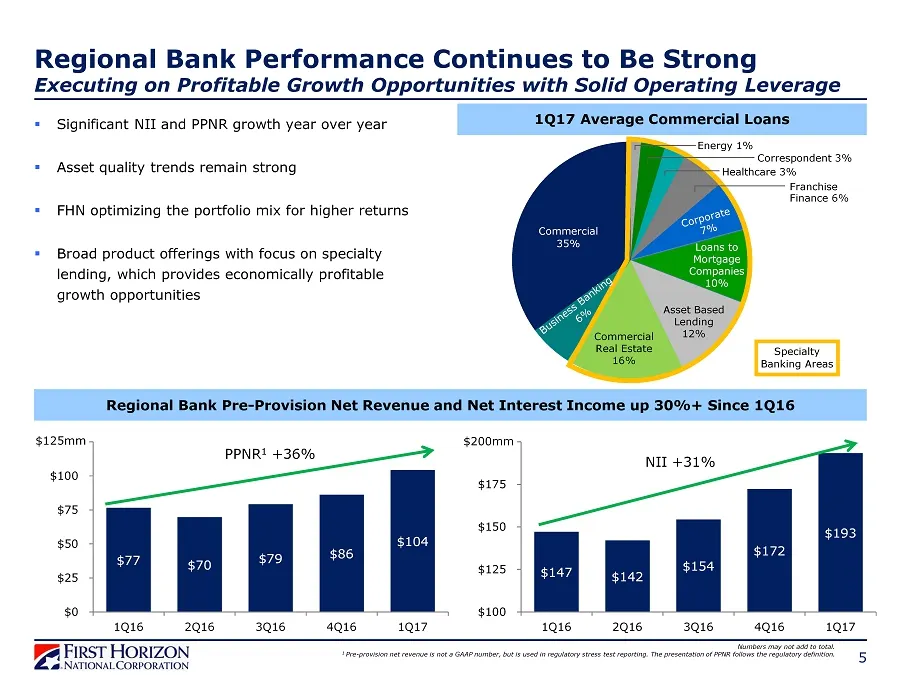
5 ▪ Significant NII and PPNR growth year over year ▪ Asset quality trends remain strong ▪ FHN optimizing the portfolio mix for higher returns ▪ Broad product offerings with focus on specialty lending, which provides economically profitable growth opportunities 1Q17 Average Commercial Loans Regional
Slide 6: Regional Banking Profitable Growth Opportunities
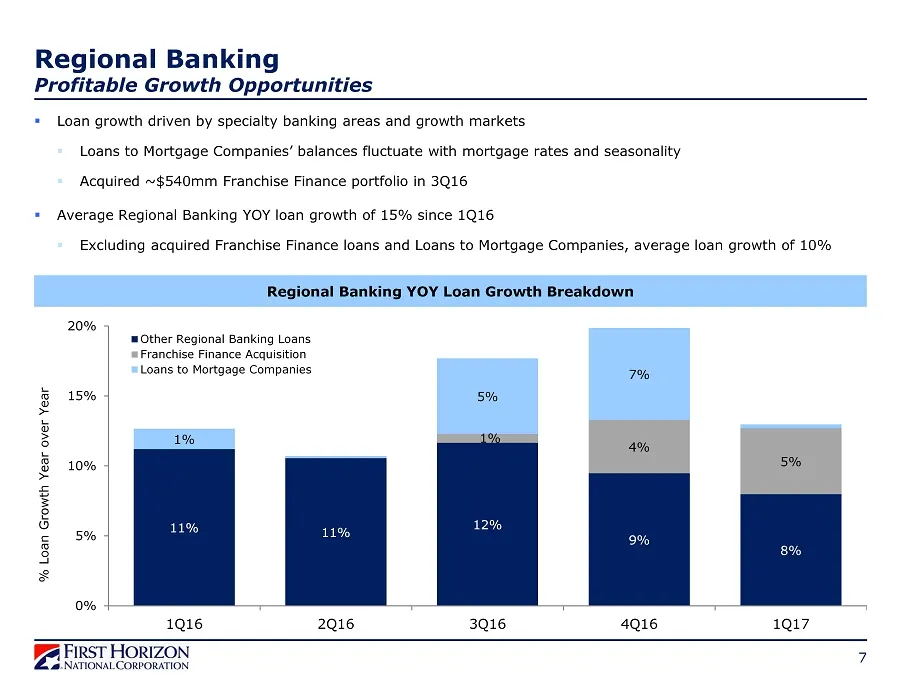
Regional Banking YOY Loan Growth Breakdown 11% 11% 12% 9% 8% 1% 4% 5% 1% 5% 7% 0% 5% 10% 15% 20% 1Q16 2Q16 3Q16 4Q16 1Q17 Other Regional Banking Loans Franchise Finance Acquisition Loans to Mortgage Companies % Loan Growth Year over Year Regional Banking Profitable Growth Opportunities ▪ Loan growth
Slide 7: Regional Bank Growth Opportunities
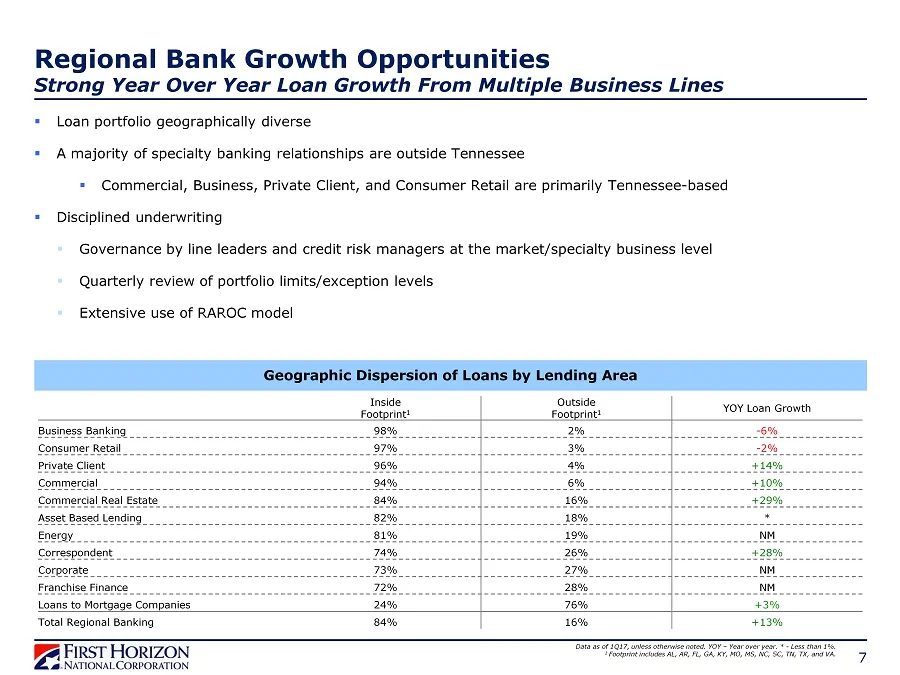
7 Regional Bank Growth Opportunities Strong Year Over Year Loan Growth From Multiple Business Lines Data as of 1Q17, unless otherwise noted. YOY – Year over year. * - Less than 1%. 1 Footprint includes AL, AR, FL, GA, KY, MO, MS, NC, SC, TN, TX, and VA. Geographic Dispersion of Loans by Lending Area
Slide 8: Deposit Growth
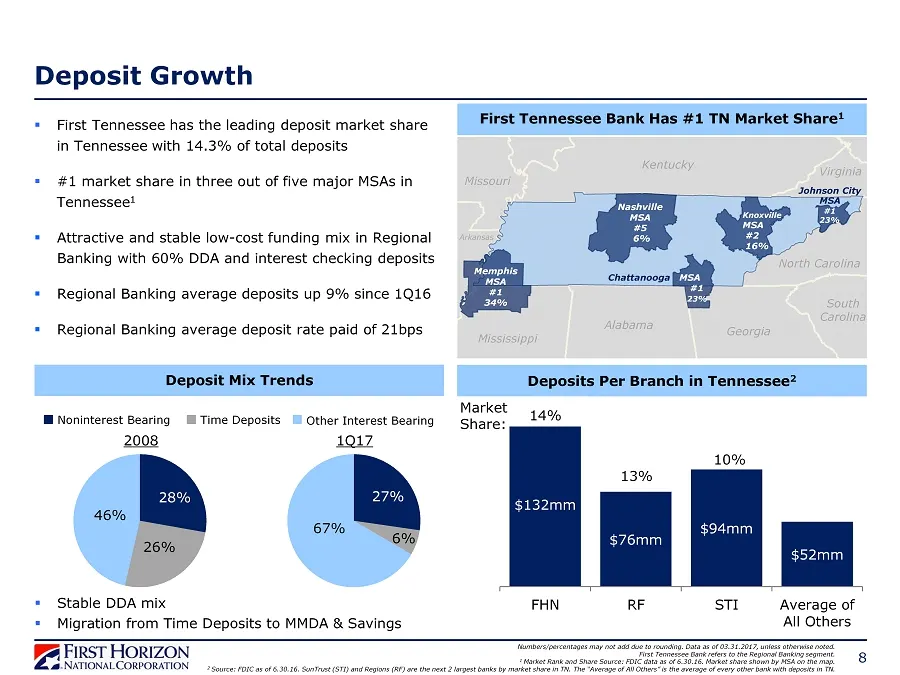
Deposit Growth ▪ First Tennessee has the leading deposit market share in Tennessee with 14.3% of total deposits ▪ #1 market share in three out of five major MSAs in Tennessee 1 ▪ Attractive and stable low - cost funding mix in Regional Banking with 60% DDA and interest checking deposits ▪ Regional B
Slide 9: FTN Financial: Focused on Capturing Market Opportunities
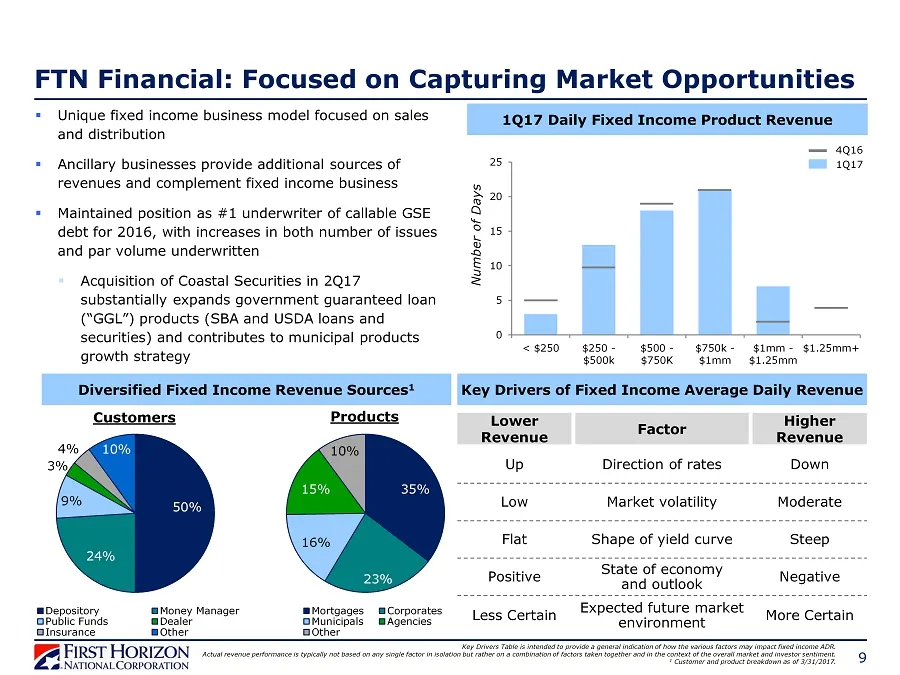
FTN Financial: Focused on Capturing Market Opportunities 9 Key Drivers Table is intended to provide a general indication of how the various factors may impact fixed income ADR. Actual revenue performance is typically not based on any single factor in isolation but rather on a combination of factors
Slide 10: Capital Deployment Alternatives
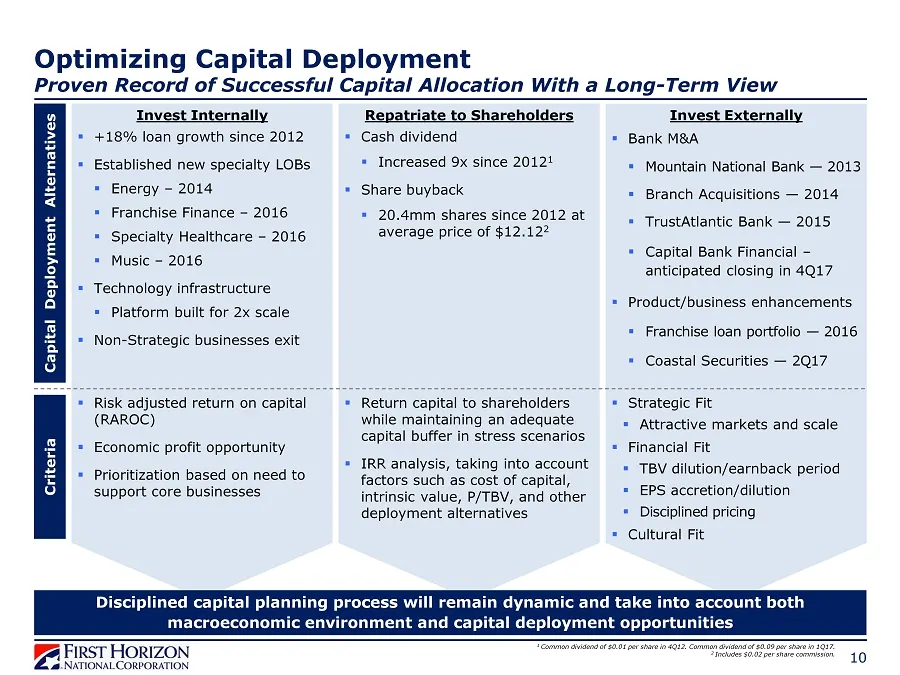
10 Invest Internally Repatriate to Shareholders Invest Externally Capital Deployment Alternatives Criteria ▪ +18% loan growth since 2012 ▪ Established new specialty LOBs ▪ Energy – 2014 ▪ Franchise Finance – 2016 ▪ Specialty Healthcare – 2016 ▪ Music – 2016 ▪ Technology infrastructure ▪ Platform bui
Slide 11: Asset Sensitivity Overview
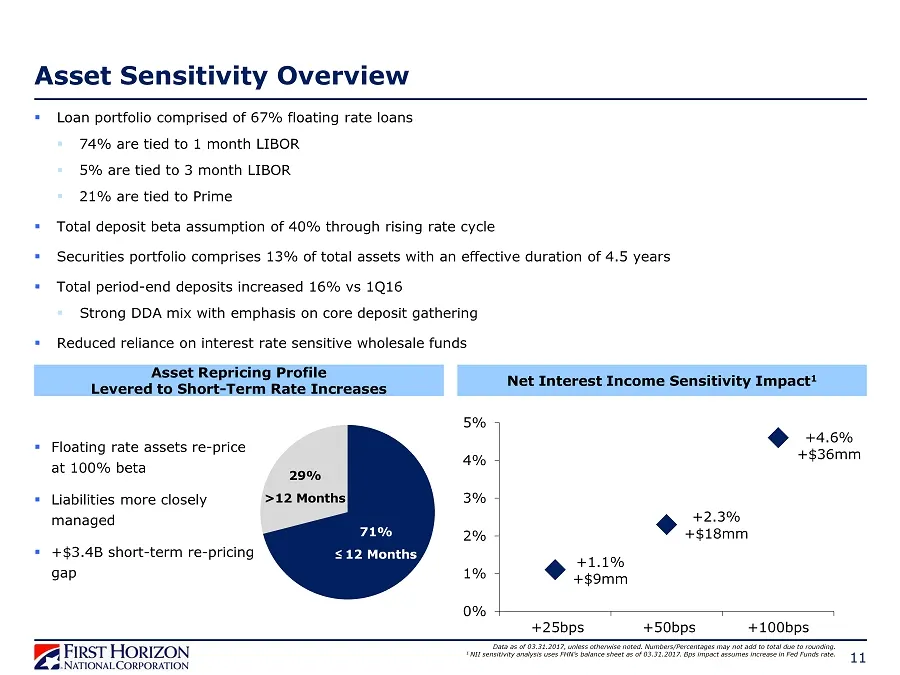
11 Asset Sensitivity Overview ▪ Loan portfolio comprised of 67% floating rate loans ▪ 74% are tied to 1 month LIBOR ▪ 5% are tied to 3 month LIBOR ▪ 21% are tied to Prime ▪ Total deposit beta assumption of 40% through rising rate cycle ▪ Securities portfolio comprises 13% of total assets with an eff
Slide 12: Economic Profit Focus Delivering Tangible Results
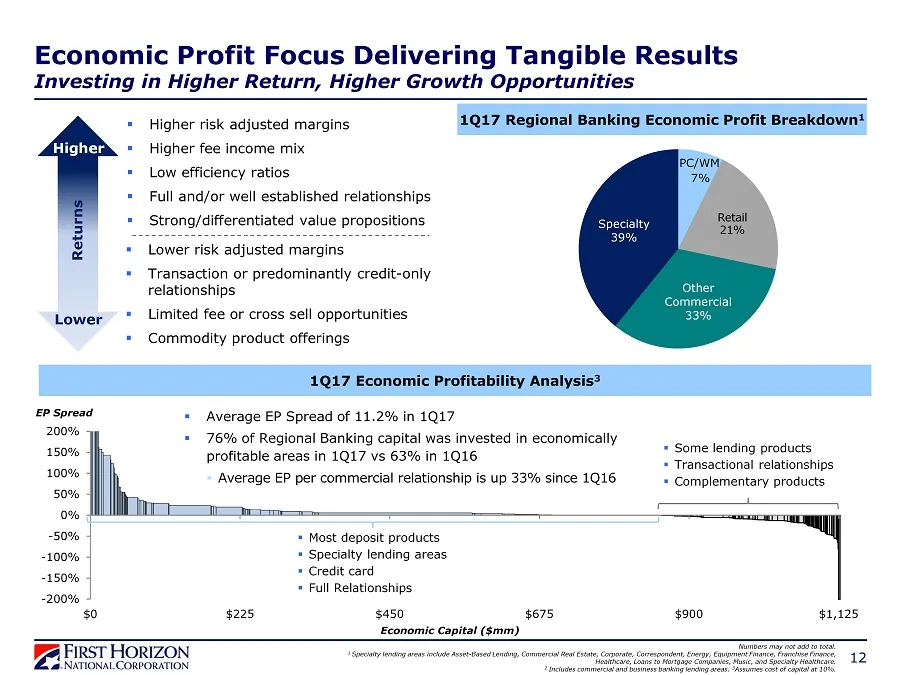
12 ▪ Higher risk adjusted margins ▪ Higher fee income mix ▪ Low efficiency ratios ▪ Full and/or well established relationships ▪ Strong/differentiated value propositions ▪ Lower risk adjusted margins ▪ Transaction or predominantly credit - only relationships ▪ Limited fee or cross sell opportunities
Slide 13: FHN Acquisition of CBF
FHN ACQUISITION OF CBF VA FIRST HORIZON sh NATIONAL CORPORATION 13
Slide 14: Financially Attractive Capital Bank Acquisition
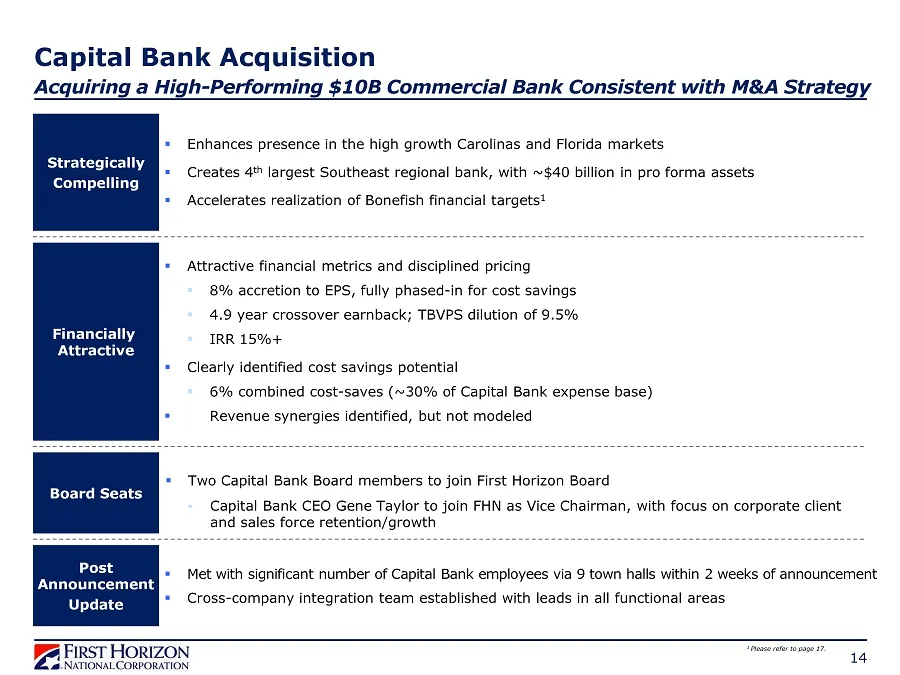
▪ Enhances presence in the high growth Carolinas and Florida markets ▪ Creates 4 th largest Southeast regional bank, with ~$40 billion in pro forma assets ▪ Accelerates realization of Bonefish financial targets 1 Strategically Compelling Post Announcement Update ▪ Attractive financial metrics and di
Slide 15: Capital Bank: Integrated and Built Cohesive Franchise & Culture
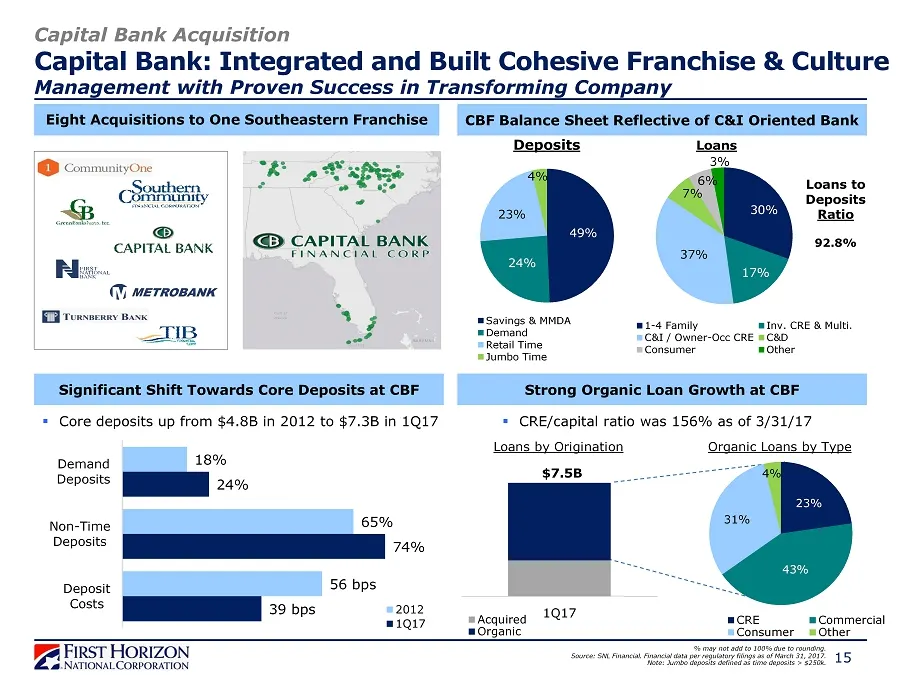
49% 24% 23% 4% Savings & MMDA Demand Retail Time Jumbo Time Eight Acquisitions to One Southeastern Franchise % may not add to 100% due to rounding. Source : SNL Financial. Financial data per regulatory filings as of March 31, 2017. Note: Jumbo deposits defined as time deposits > $250k . 15 CBF Balan
Slide 16: Pro Forma Loan & Deposit Composition
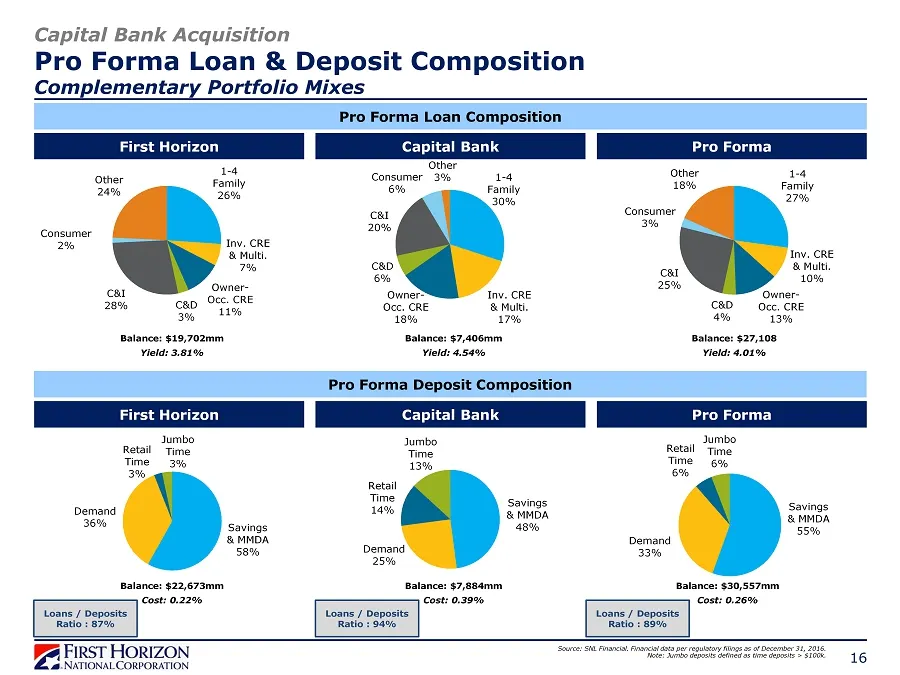
Capital Bank Acquisition Pro Forma Loan & Deposit Composition Complementary Portfolio Mixes Source: SNL Financial. Financial data per regulatory filings as of December 31, 2016. Note: Jumbo deposits defined as time deposits > $100k. First Horizon Capital Bank Pro Forma First Horizon Capital Bank Pro
Slide 17: Strategically and Financially Compelling Combination
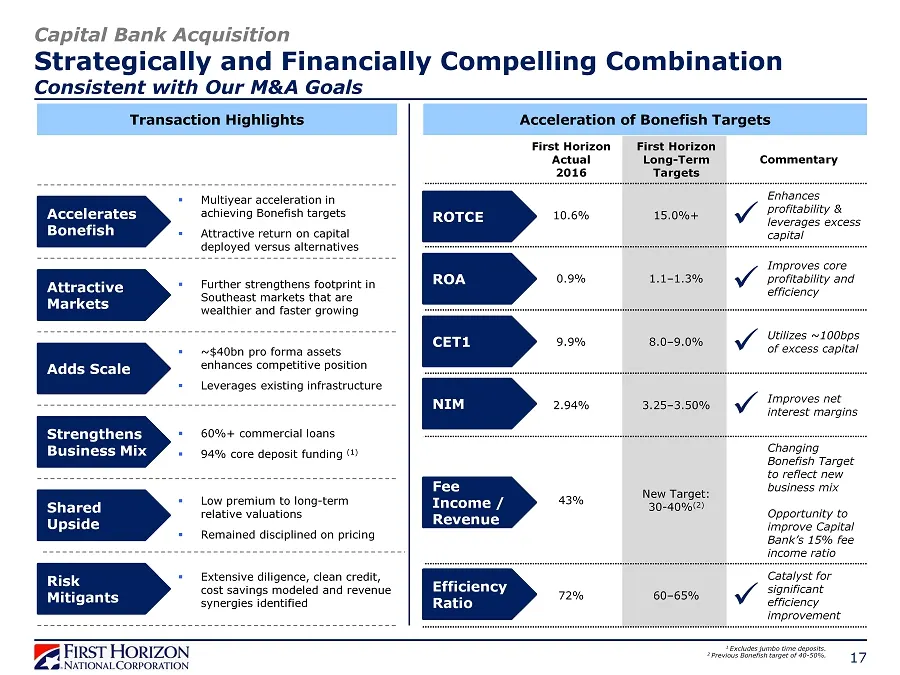
First Horizon Actual 2016 First Horizon Long - Term Targets Commentary 10.6% 15.0%+ Enhances profitability & leverages excess capital 0.9% 1.1 – 1.3% Improves core profitability and efficiency 9.9% 8.0 – 9.0% Utilizes ~100bps of excess capital 2.94% 3.25 – 3.50% Improves net interest margins 43% New
Slide 18: Key Transaction Assumptions
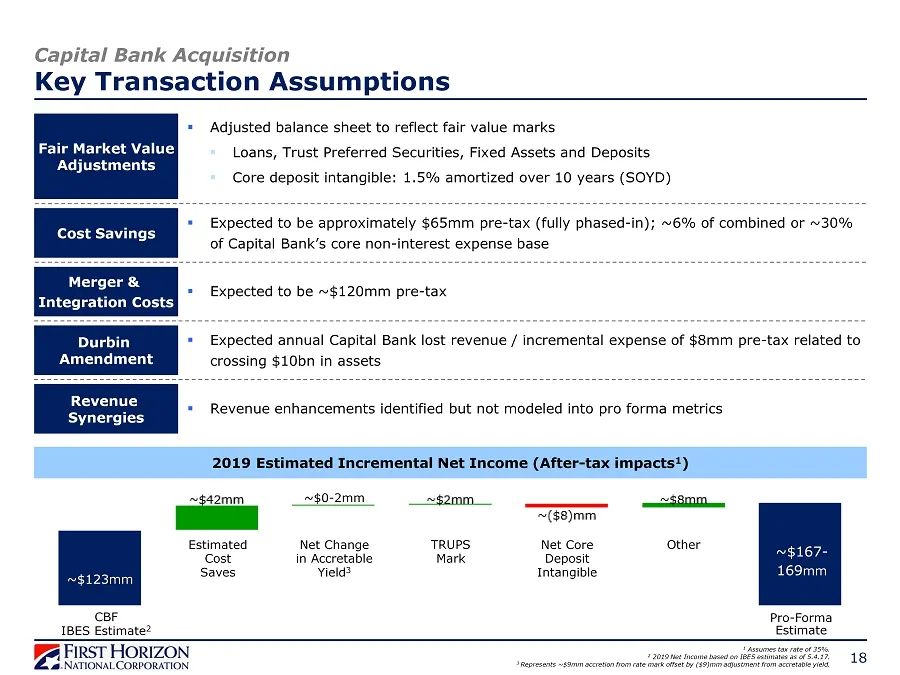
Capital Bank Acquisition Key Transaction Assumptions 18 Cost Savings Revenue Synergies Merger & Integration Costs ▪ Adjusted balance sheet to reflect fair value marks ▪ Loans, Trust Preferred Securities, Fixed Assets and Deposits ▪ Core deposit intangible: 1.5% amortized over 10 years (SOYD) Durbin
Slide 19: Asset Quality
ASSET QUALITY VA FIRST HORIZON sh NATIONAL CORPORATION, 19
Slide 20: Stable Credit Trends Reflect Strong Underwriting Discipline
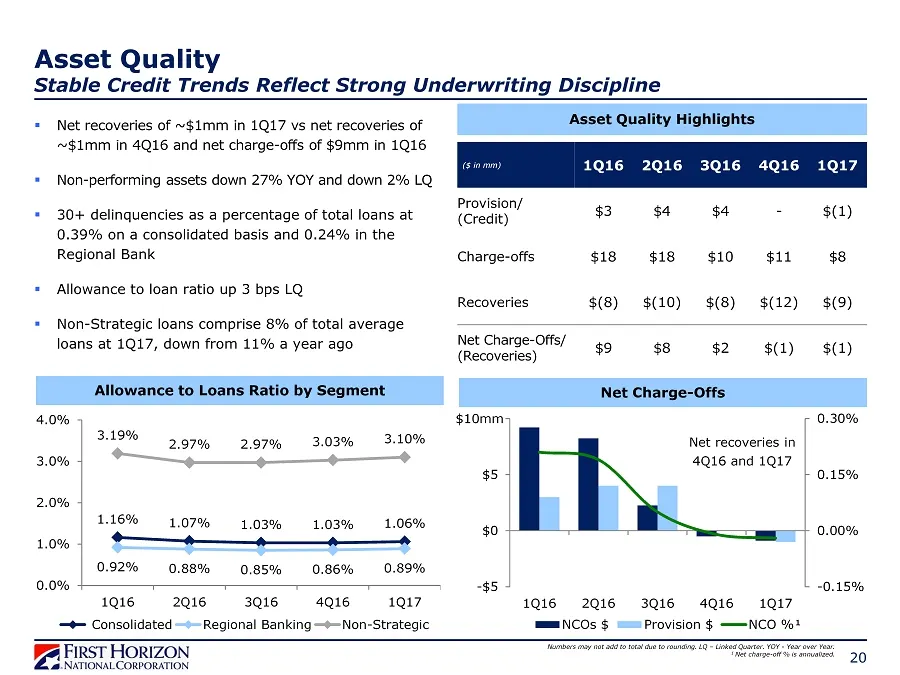
20 Allowance to Loans Ratio by Segment 1.16% 1.07% 1.03% 1.03% 1.06% 0.92% 0.88% 0.85% 0.86% 0.89% 3.19% 2.97% 2.97% 3.03% 3.10% 0.0% 1.0% 2.0% 3.0% 4.0% 1Q16 2Q16 3Q16 4Q16 1Q17 Consolidated Regional Banking Non-Strategic Net Charge - Offs Asset Quality Stable Credit Trends Reflect Strong Underwrit
Slide 21: 1Q17 Credit Quality Summary by Portfolio
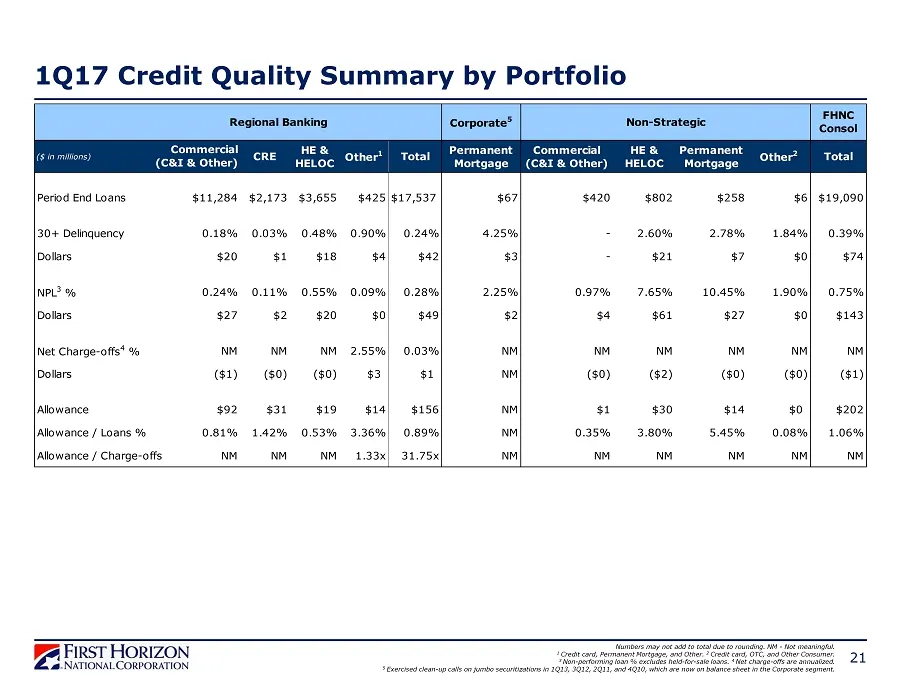
21 1Q17 Credit Quality Summary by Portfolio Numbers may not add to total due to rounding. NM - Not meaningful. 1 Credit card, Permanent Mortgage, and Other. 2 Credit card, OTC, and Other Consumer . 3 Non - performing loan % excludes held - for - sale loans. 4 Net charge - offs are annualized. 5 Exer
Slide 22: Select C&I and CRE Portfolio Metrics
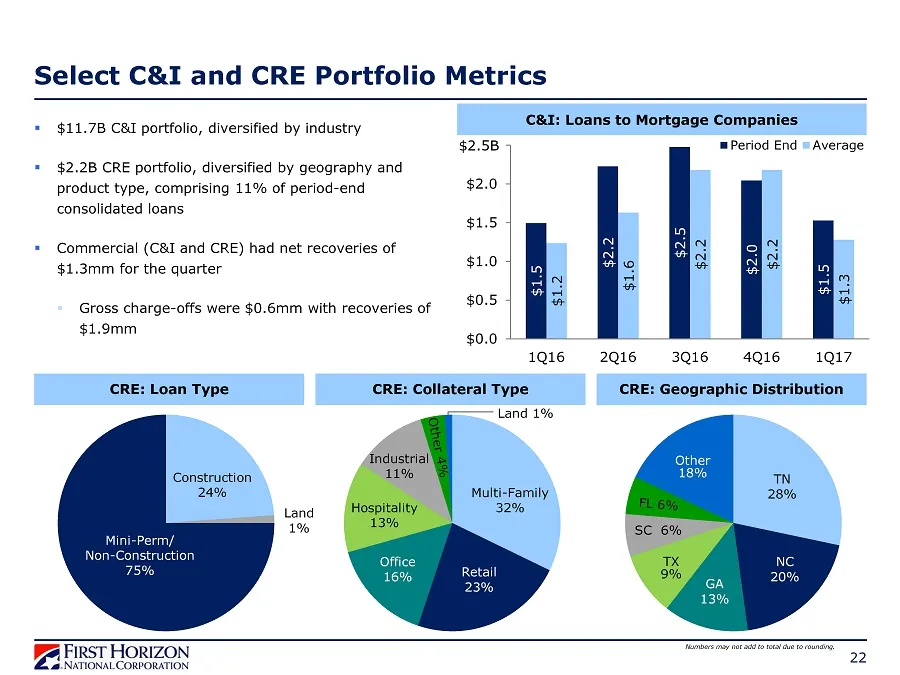
22 Select C&I and CRE Portfolio Metrics Numbers may not add to total due to rounding. ▪ $11.7B C&I portfolio , diversified by industry ▪ $2.2B CRE portfolio, diversified by geography and product type, comprising 11% of period - end consolidated loans ▪ Commercial (C&I and CRE) had net recoveries of
Slide 23: Consumer Portfolio Overview
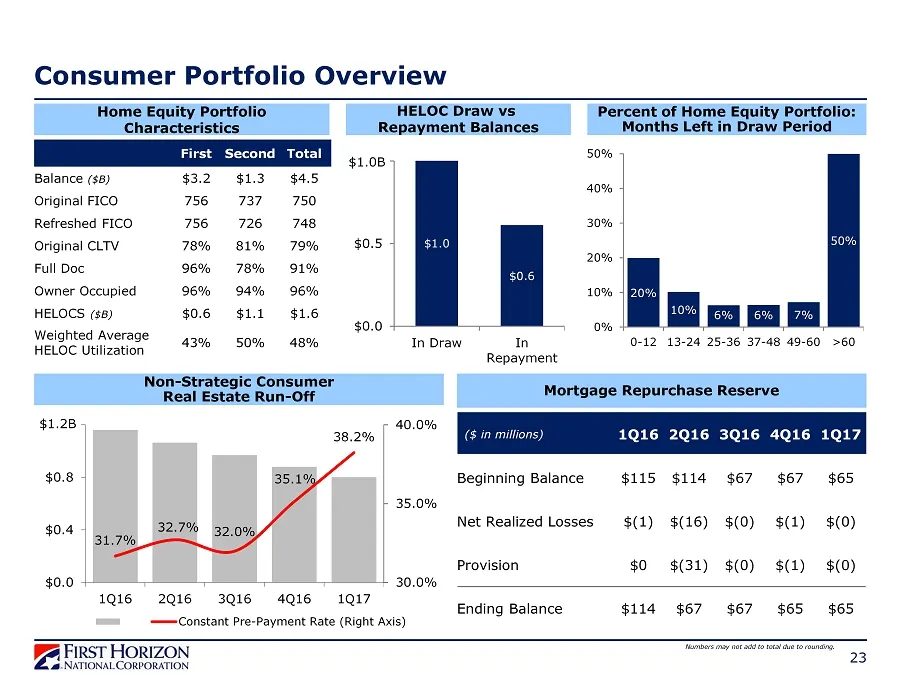
23 Consumer Portfolio Overview $1.0 $0.6 $0.0 $0.5 $1.0 In Draw In Repayment HELOC Draw vs Repayment Balances Percent of Home Equity Portfolio: Months Left in Draw Period 20% 10% 6% 6% 7% 50% 0% 10% 20% 30% 40% 50% 0-12 13-24 25-36 37-48 49-60 >60 Home Equity Portfolio Characteristics 31.7% 32.7% 32
Slide 24: Appendix
APPENDIX VA FIRST HORIZON sh NATIONAL CORPORATION, 24
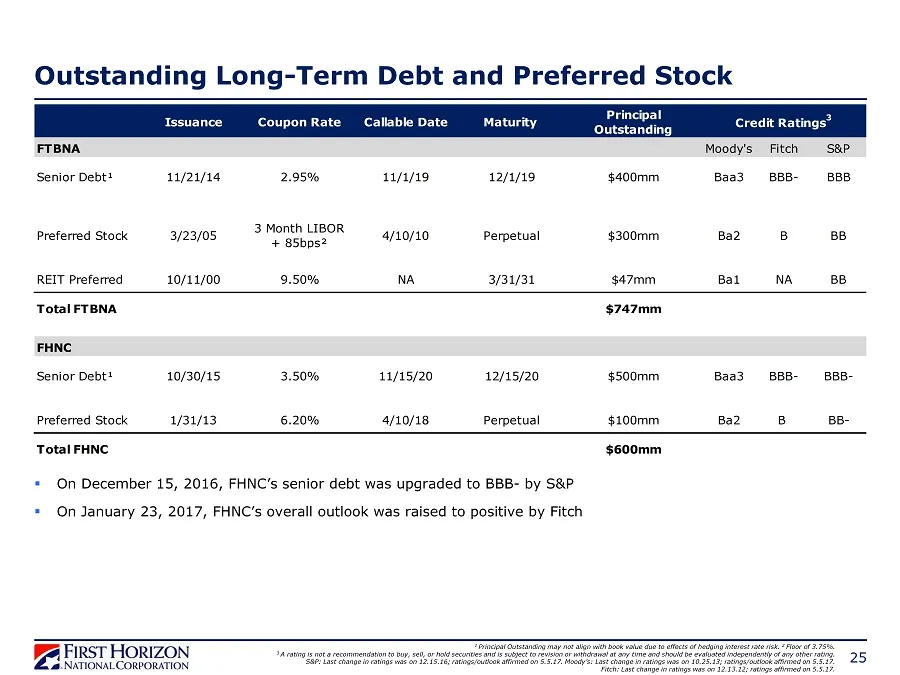
Slide 25: Outstanding Long-Term Debt and Preferred Stock
Outstanding Long - Term Debt and Preferred Stock 25 1 Principal Outstanding may not align with book value due to effects of hedging interest rate risk. 2 Floor of 3.75%. 3 A rating is not a recommendation to buy, sell, or hold securities and is subject to revision or withdrawal at any time and sh ou
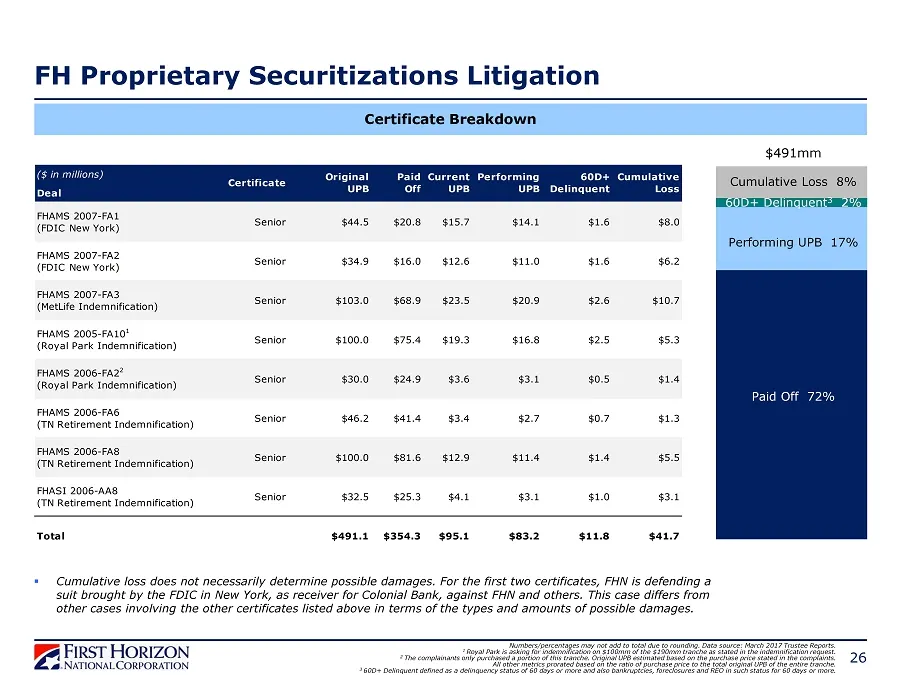
Slide 26: FH Proprietary Securitizations Litigation Certificate Breakdown
FH Proprietary Securitizations Litigation Certificate Breakdown 26 $491mm Numbers/percentages may not add to total due to rounding. Data source: March 2017 Trustee Reports. 1 Royal Park is asking for indemnification on $100mm of the $190mm tranche as stated in the indemnification request. 2 The comp
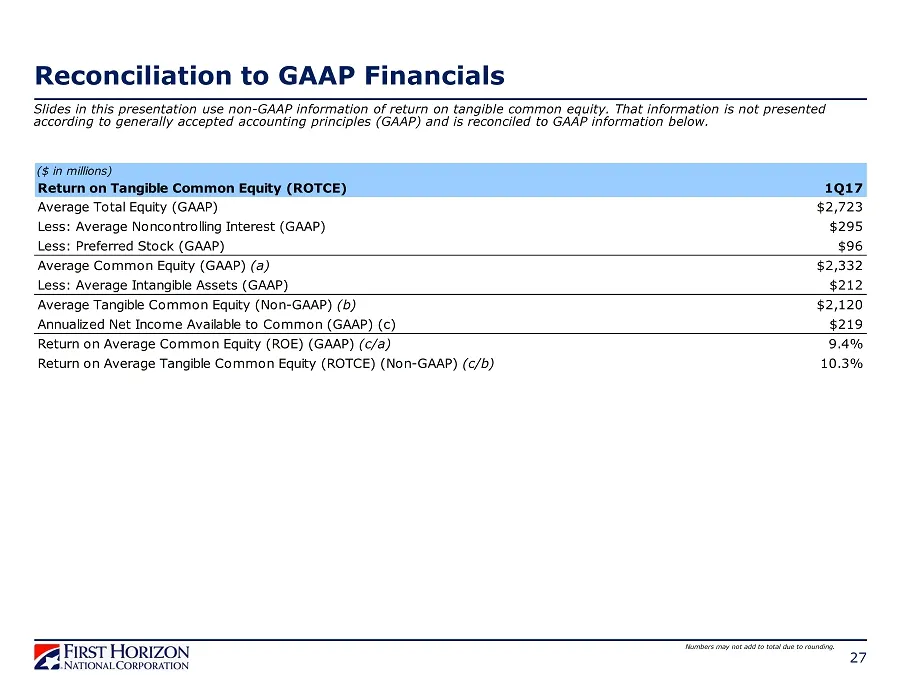
Slide 27: Reconciliation to GAAP Financials
Reconciliation to GAAP Financials 27 Slides in this presentation use non - GAAP information of return on tangible common equity. That information is not presented according to generally accepted accounting principles (GAAP ) and is reconciled to GAAP information below. Numbers may not add to total d
Source: SEC EDGAR · 425 filed Jun 6, 2017
More decks from Capital Bank Financial Corp
 Q2 2017 Earnings Presentation22 slides · Jul 14, 2017
 Morgan Stanley Financial Services Conference 201715 slides · Jun 13, 2017
 Merger or Acquisition (May 2017)17 slides · May 4, 2017
 Q1 2017 Earnings Presentation21 slides · Apr 21, 2017
 Q4 2016 Earnings Presentation25 slides · Jan 26, 2017
 Q3 2016 Earnings Presentation23 slides · Oct 20, 2016