Kennedy-Wilson Holdings Inc. · NYSE:KW
Kennedy-Wilson — Investor Presentation (October 2024)
27 slides from Kennedy-Wilson's investor presentation, October 2024
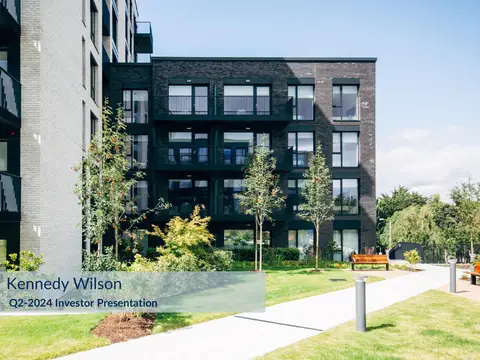
Slide 1: Kennedy Wilson Investor Presentation
Kennedy Wilson Investor Presentation
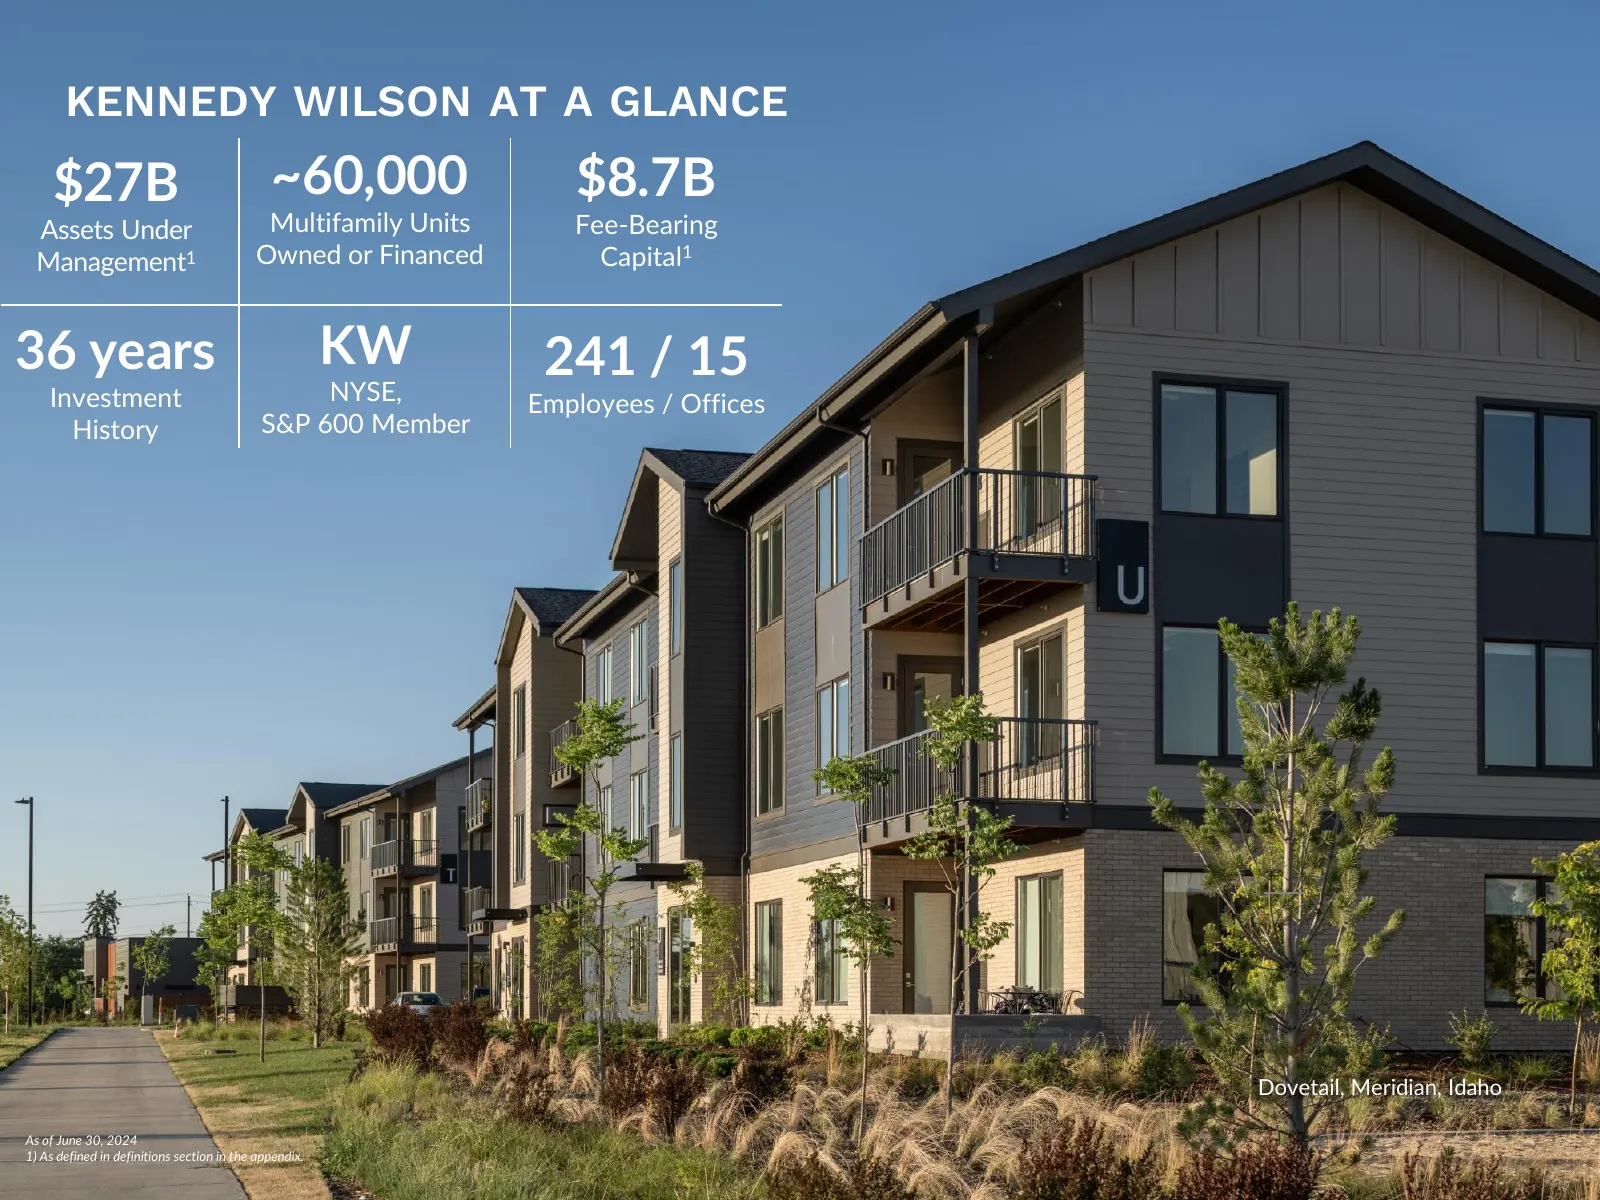
Slide 2: Kennedy Wilson at a Glance
KENNEDY WILSON AT A GLANCE $27B ~60,000 $8.7B Assets Under Multifamily Units Fee-Bearing Management1 Owned or Financed Capital1 36 years KW 241 / 15 Investment NYSE, Employees / Offices History S&P 600 Member © KENNEDY WILSON Dovetail, Meridian, Idaho As of June 30, 2024 Investor 1) As defined Prese
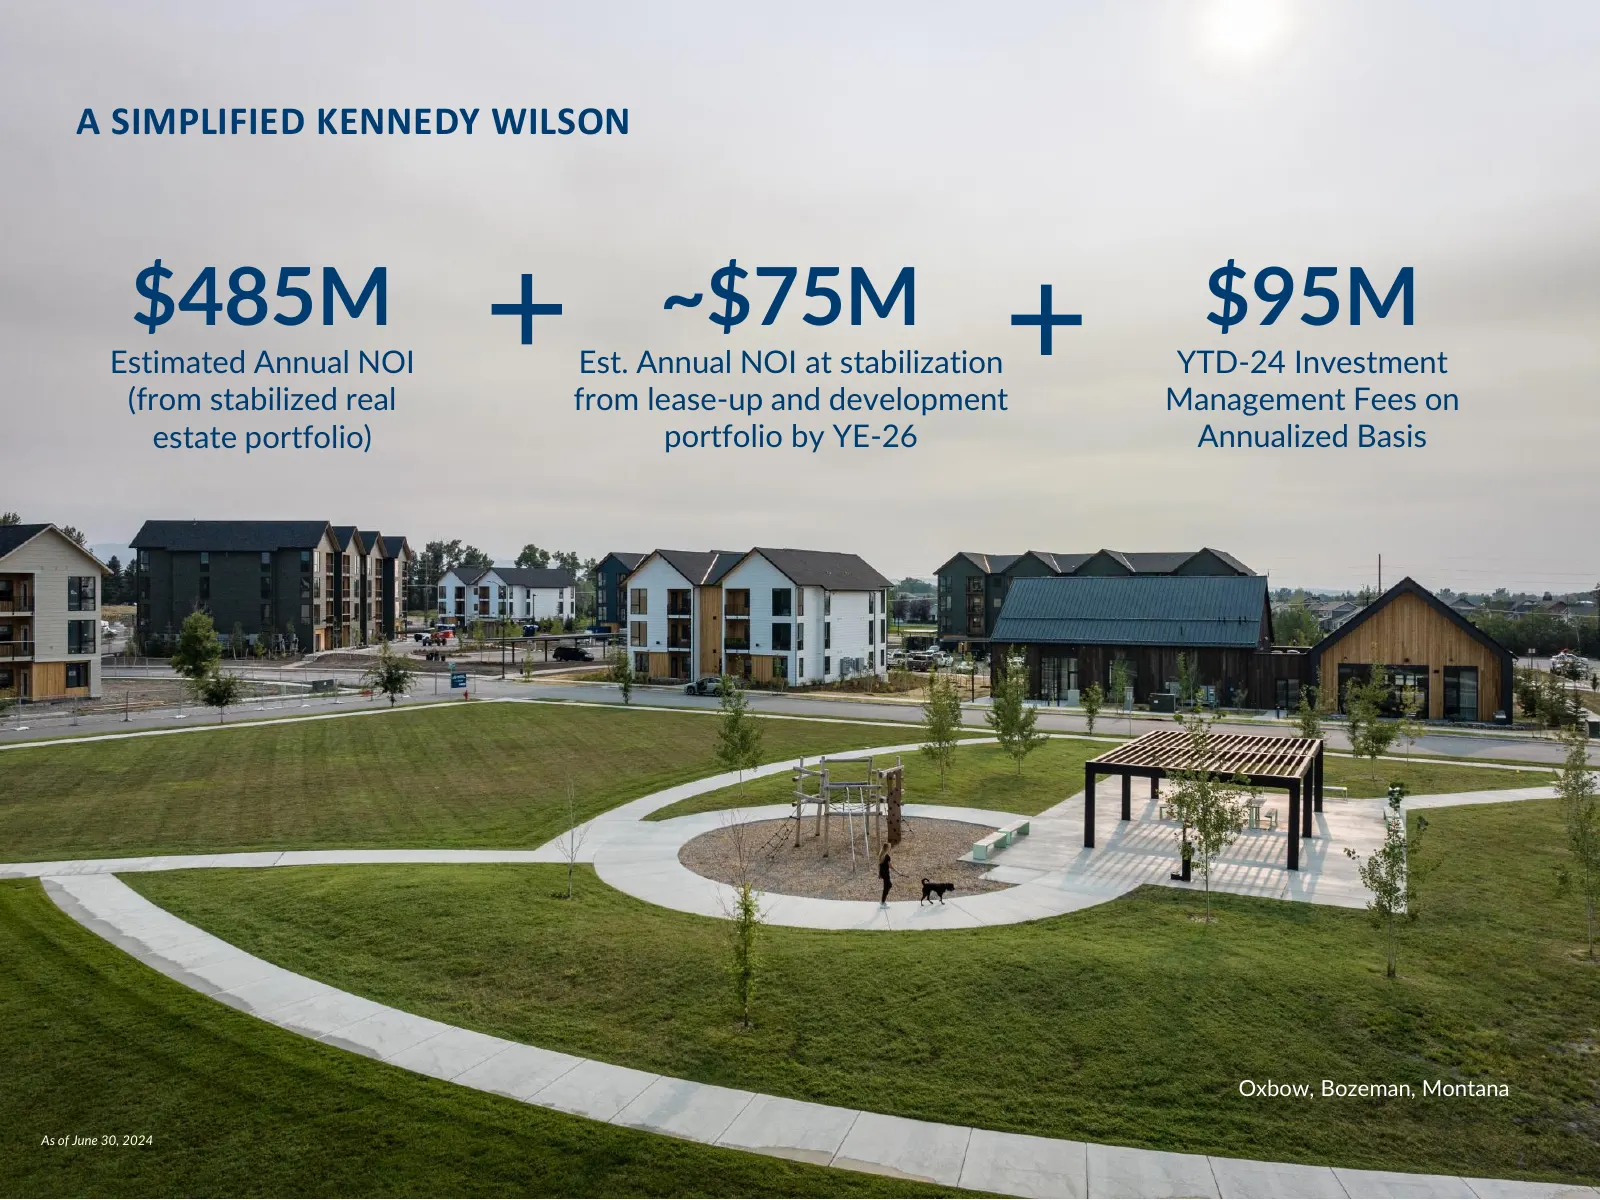
Slide 3: A Simplified Kennedy Wilson
A SIMPLIFIED KENNEDY WILSON $485M ~$75M $95M Estimated Annual NOI Est. Annual NOI at stabilization YTD-24 Investment (from stabilized real from lease-up and development Management Fees on estate portfolio) portfolio by YE-26 Annualized Basis © KENNEDY WILSON Oxbow, Bozeman, Montana As of June 30, 20
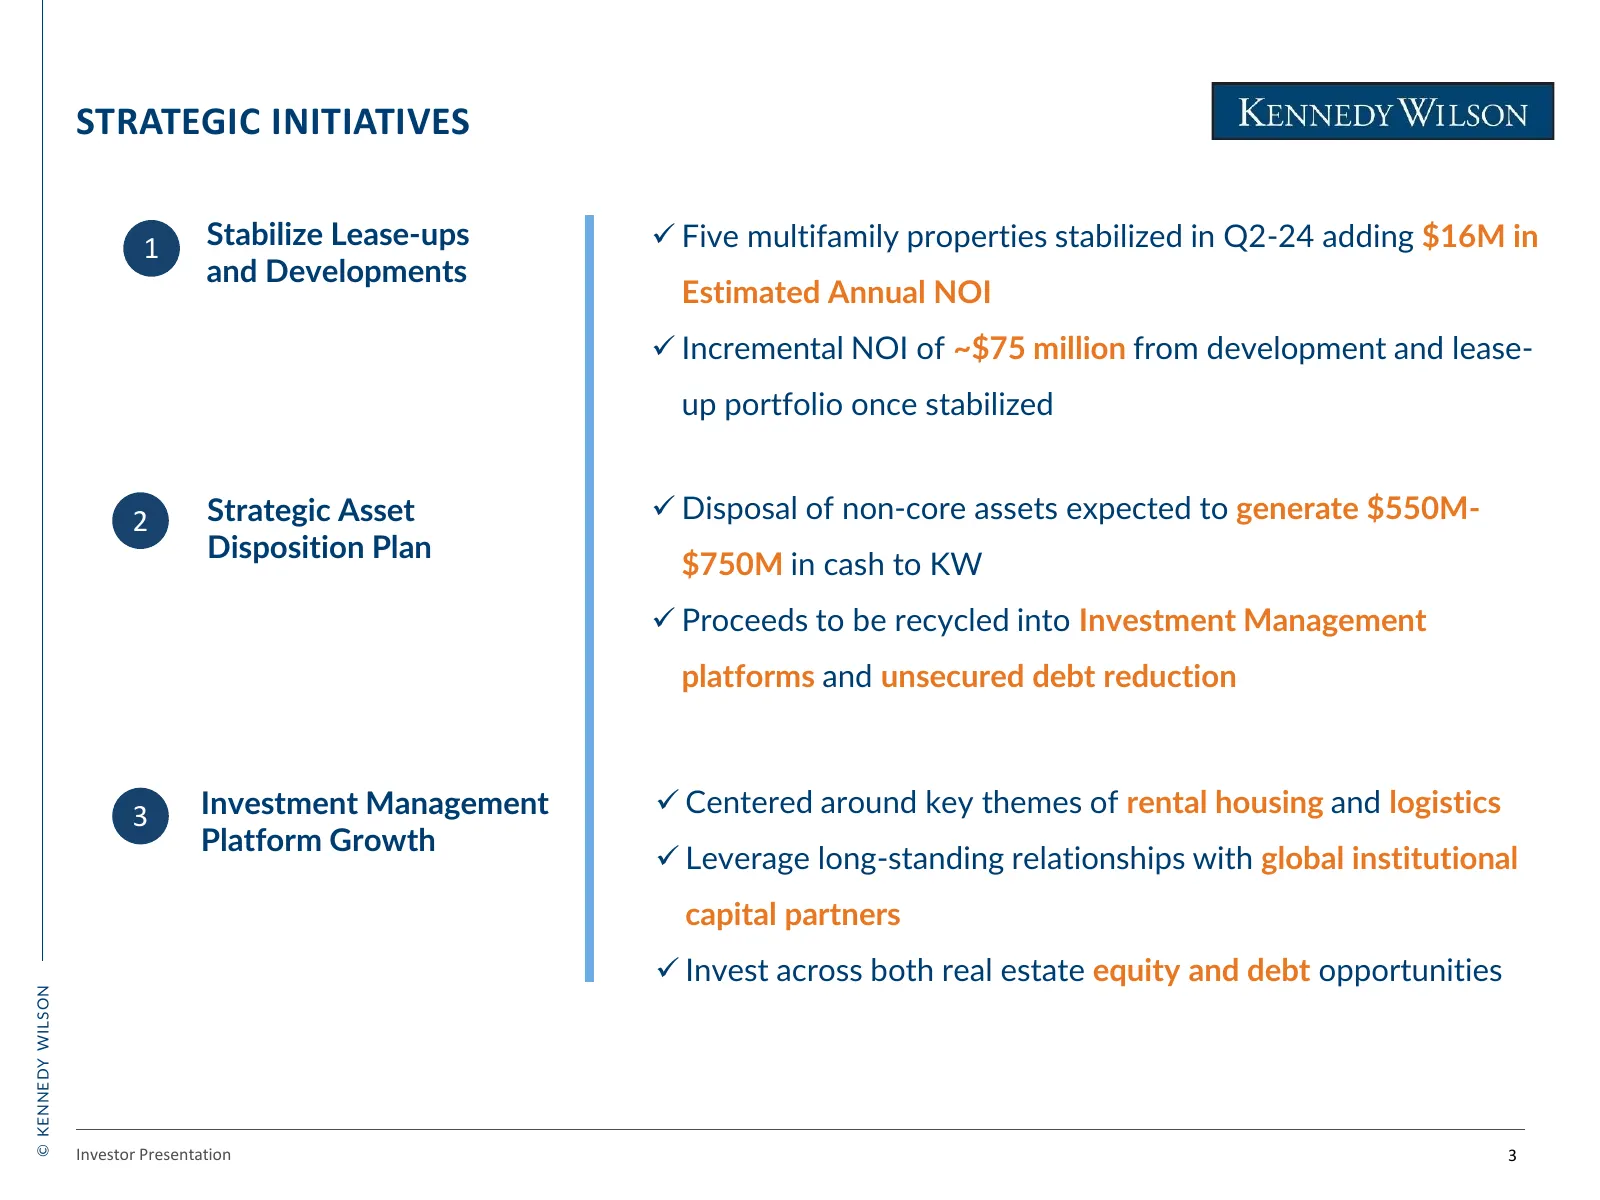
Slide 4: Strategic Initiatives
STRATEGIC INITIATIVES 1 Stabilize Lease-ups ✓ Five multifamily properties stabilized in Q2-24 adding $16M in and Developments Estimated Annual NOI ✓ Incremental NOI of ~$75 million from development and lease- up portfolio once stabilized 2 Strategic Asset ✓ Disposal of non-core assets expected to ge
Slide 5: Recent Developments
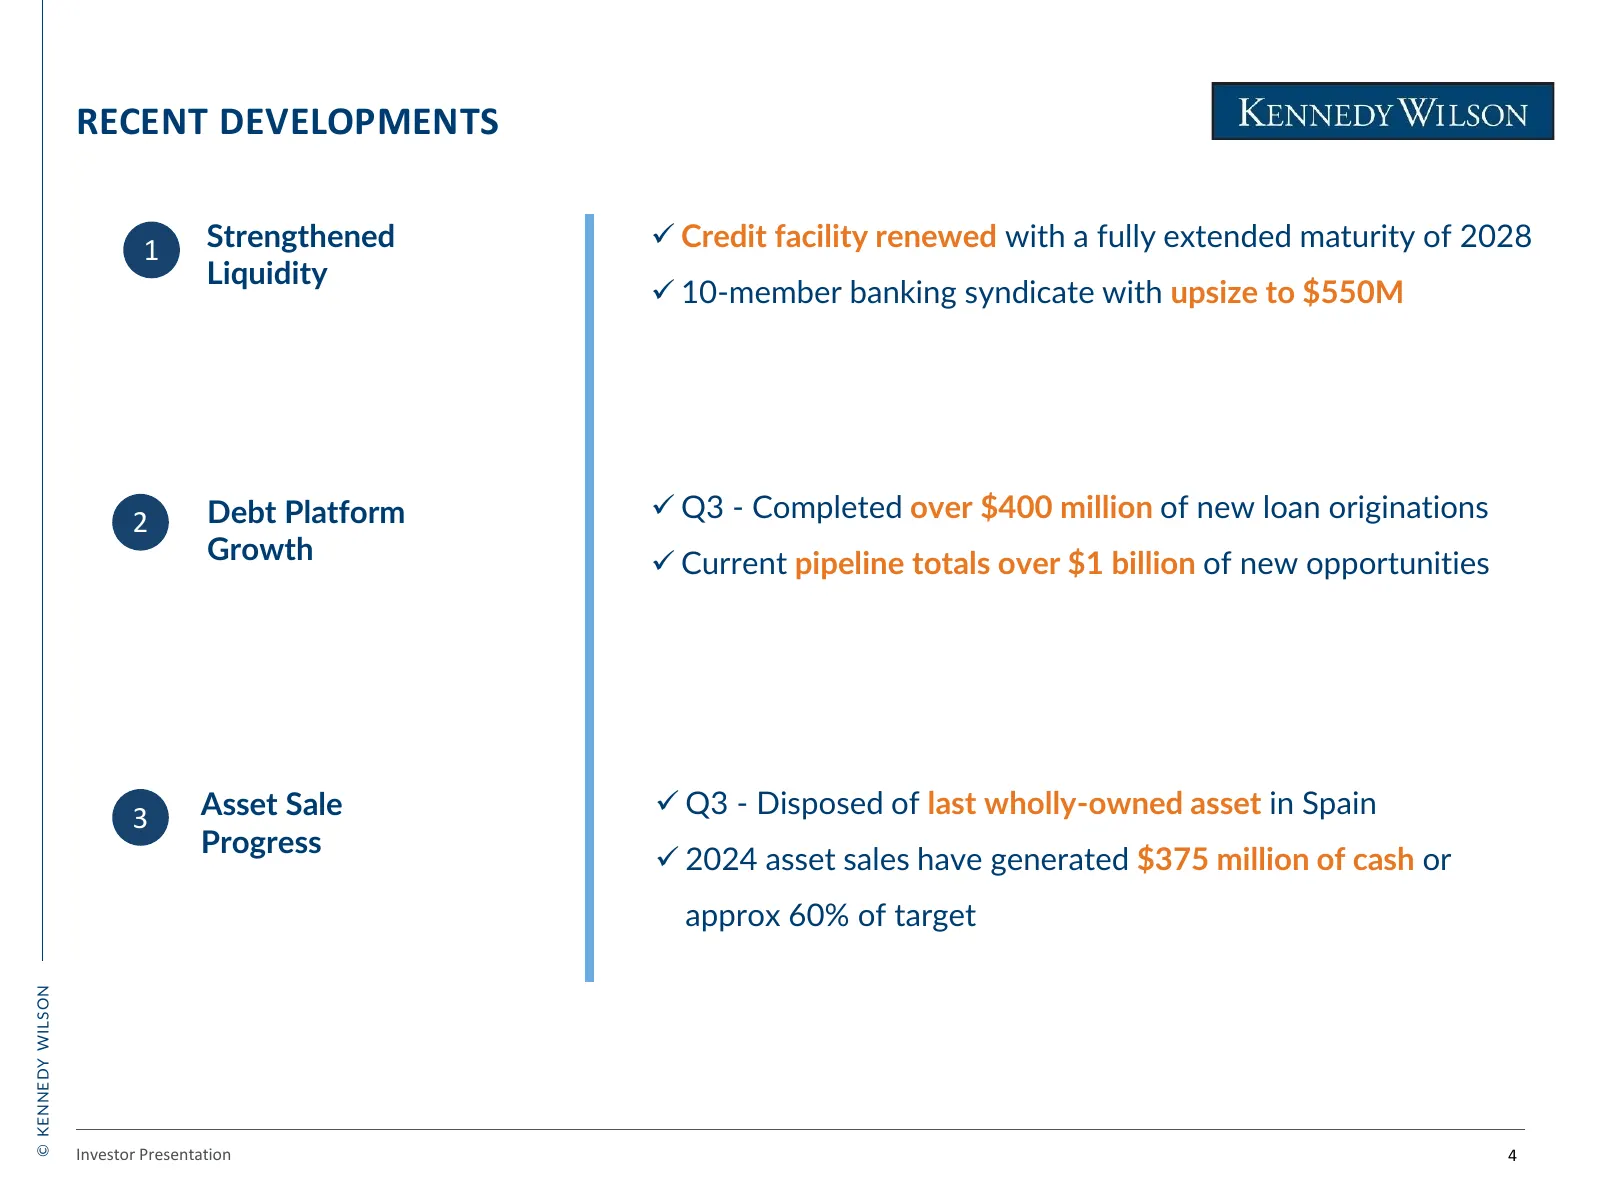
RECENT DEVELOPMENTS 1 Strengthened ✓ Credit facility renewed with a fully extended maturity of 2028 Liquidity ✓ 10-member banking syndicate with upsize to $550M 2 Debt Platform ✓ Q3 - Completed over $400 million of new loan originations Growth ✓ Current pipeline totals over $1 billion of new opportu
Slide 6: Real Estate Portfolio
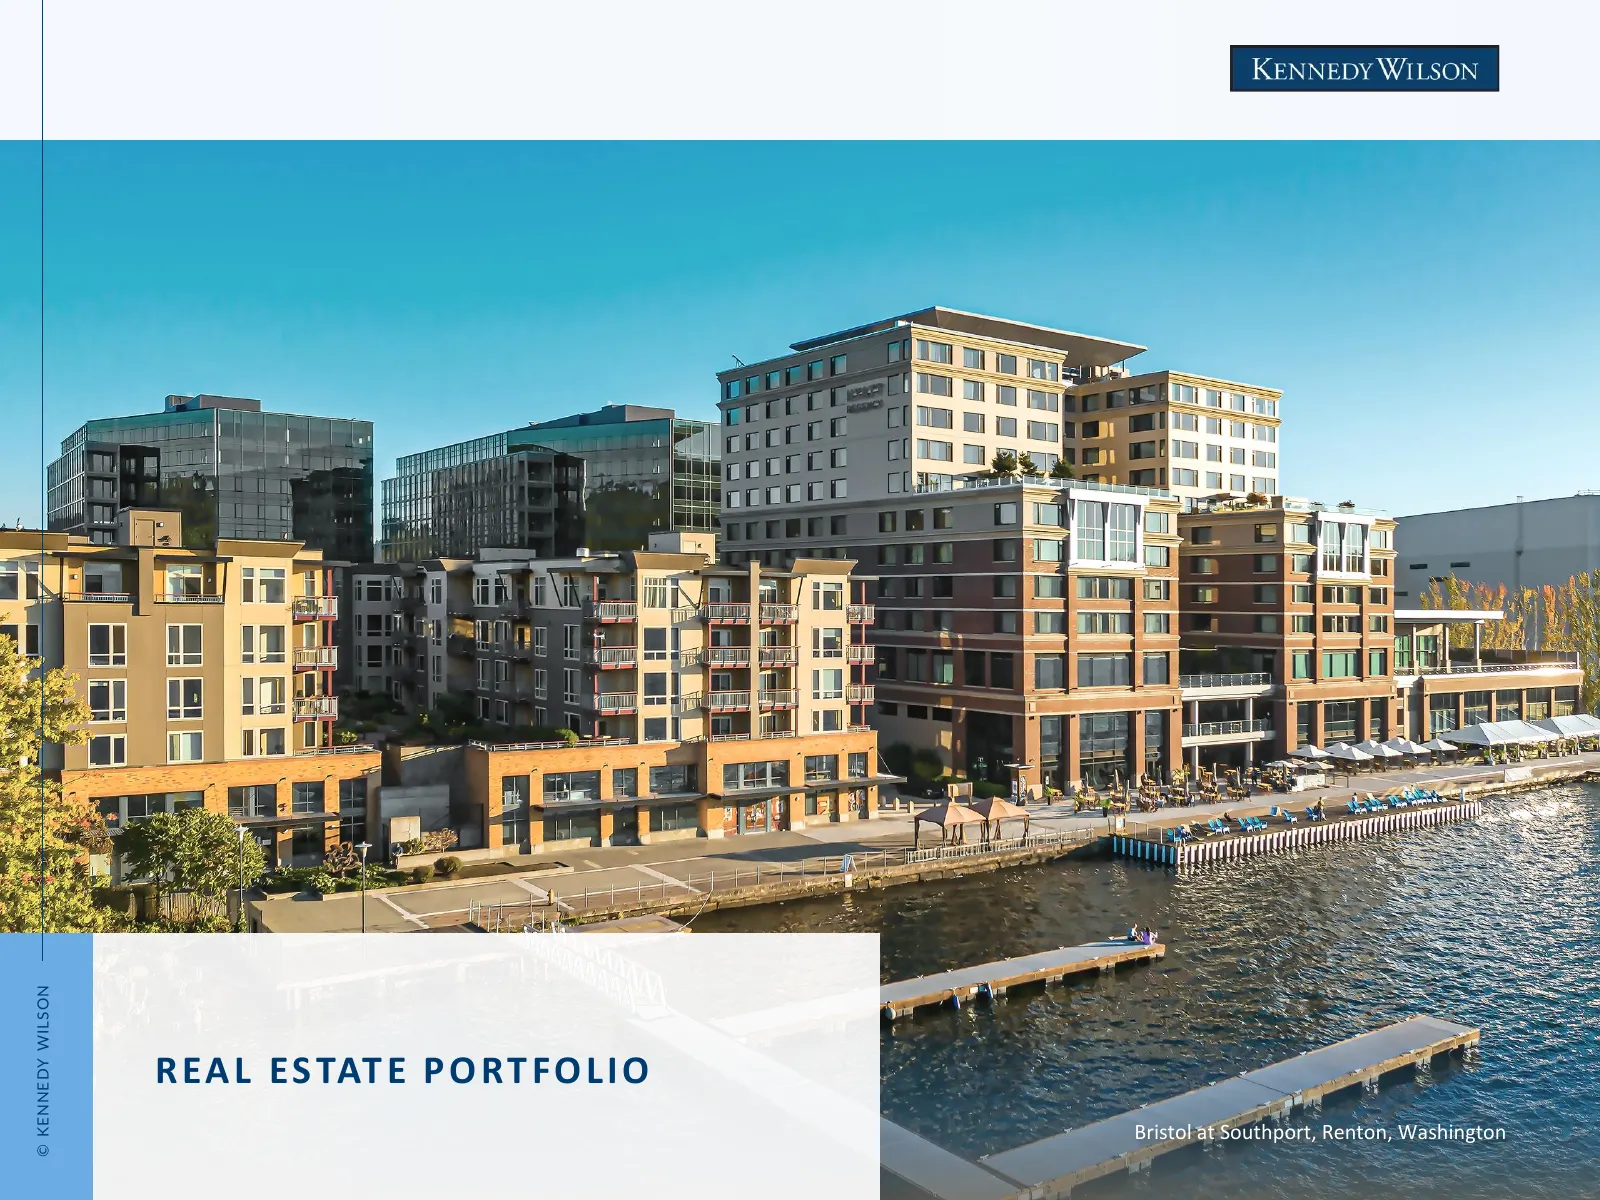
© KENNEDY WILSON R EA L E S TAT E P O R T F O L I O Bristol at Southport, Renton, Washington
Slide 7: Stabilized Portfolio Breakdown
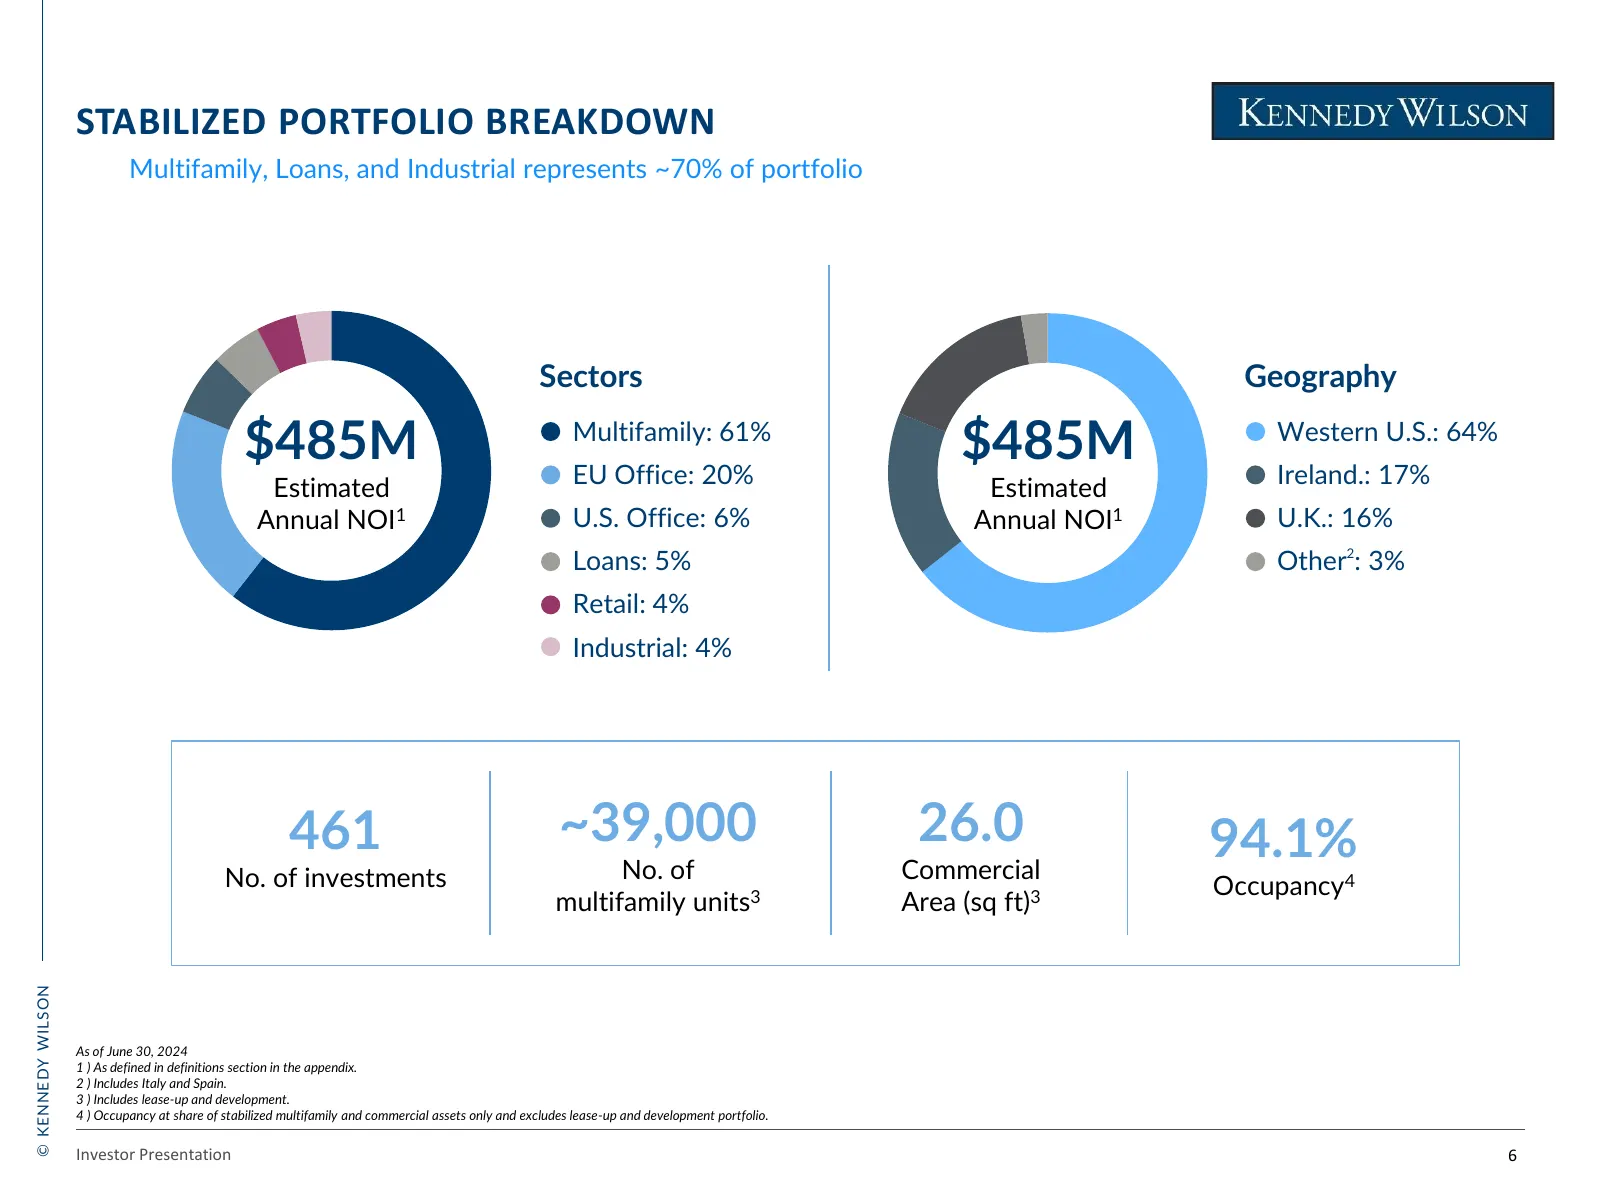
STABILIZED PORTFOLIO BREAKDOWN Multifamily, Loans, and Industrial represents ~70% of portfolio Sectors Geography $485M Multifamily: 61% EU Office: 20% $485M Western U.S.: 64% Ireland.: 17% Estimated Estimated Annual NOI1 U.S. Office: 6% Annual NOI1 U.K.: 16% Loans: 5% Other2: 3% Retail: 4% Industria
Slide 8: Two Key Investment Segments
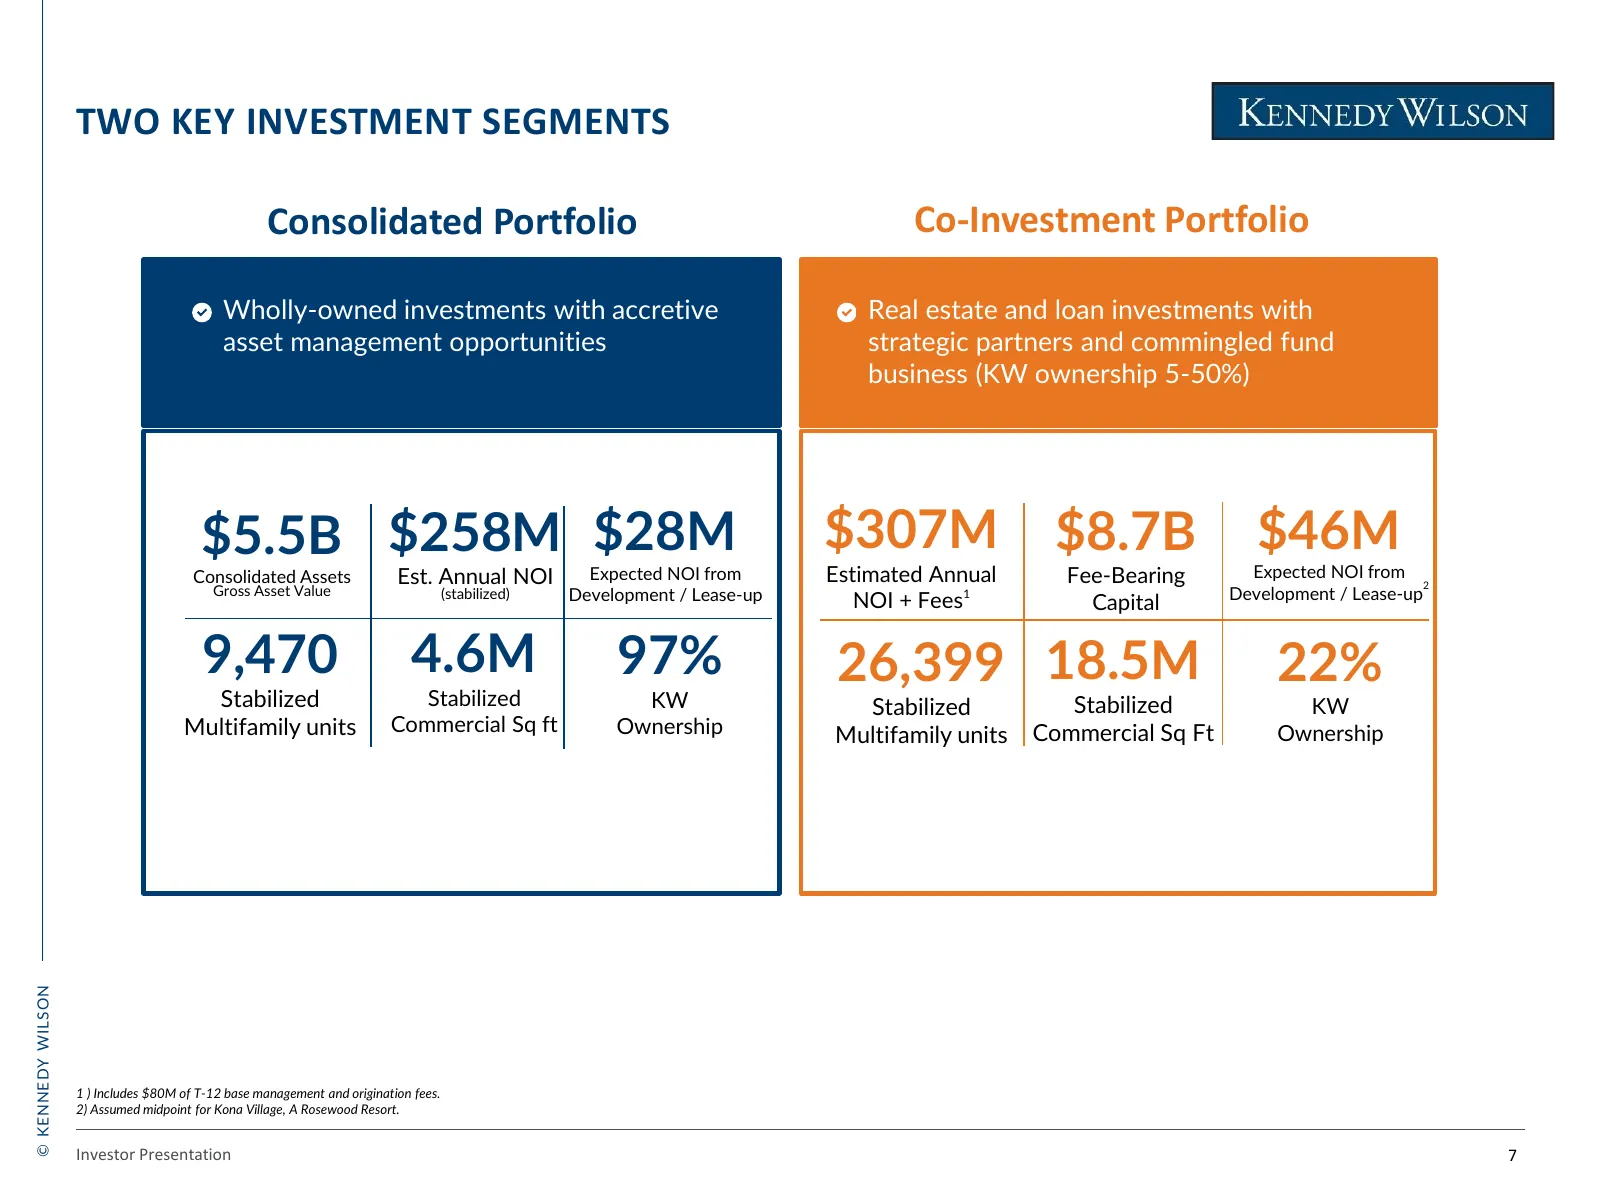
TWO KEY INVESTMENT SEGMENTS Consolidated Portfolio Co-Investment Portfolio Wholly-owned investments with accretive Real estate and loan investments with asset management opportunities strategic partners and commingled fund business (KW ownership 5-50%) $5.5B $258M $28M $307M $8.7B $46M Consolidated
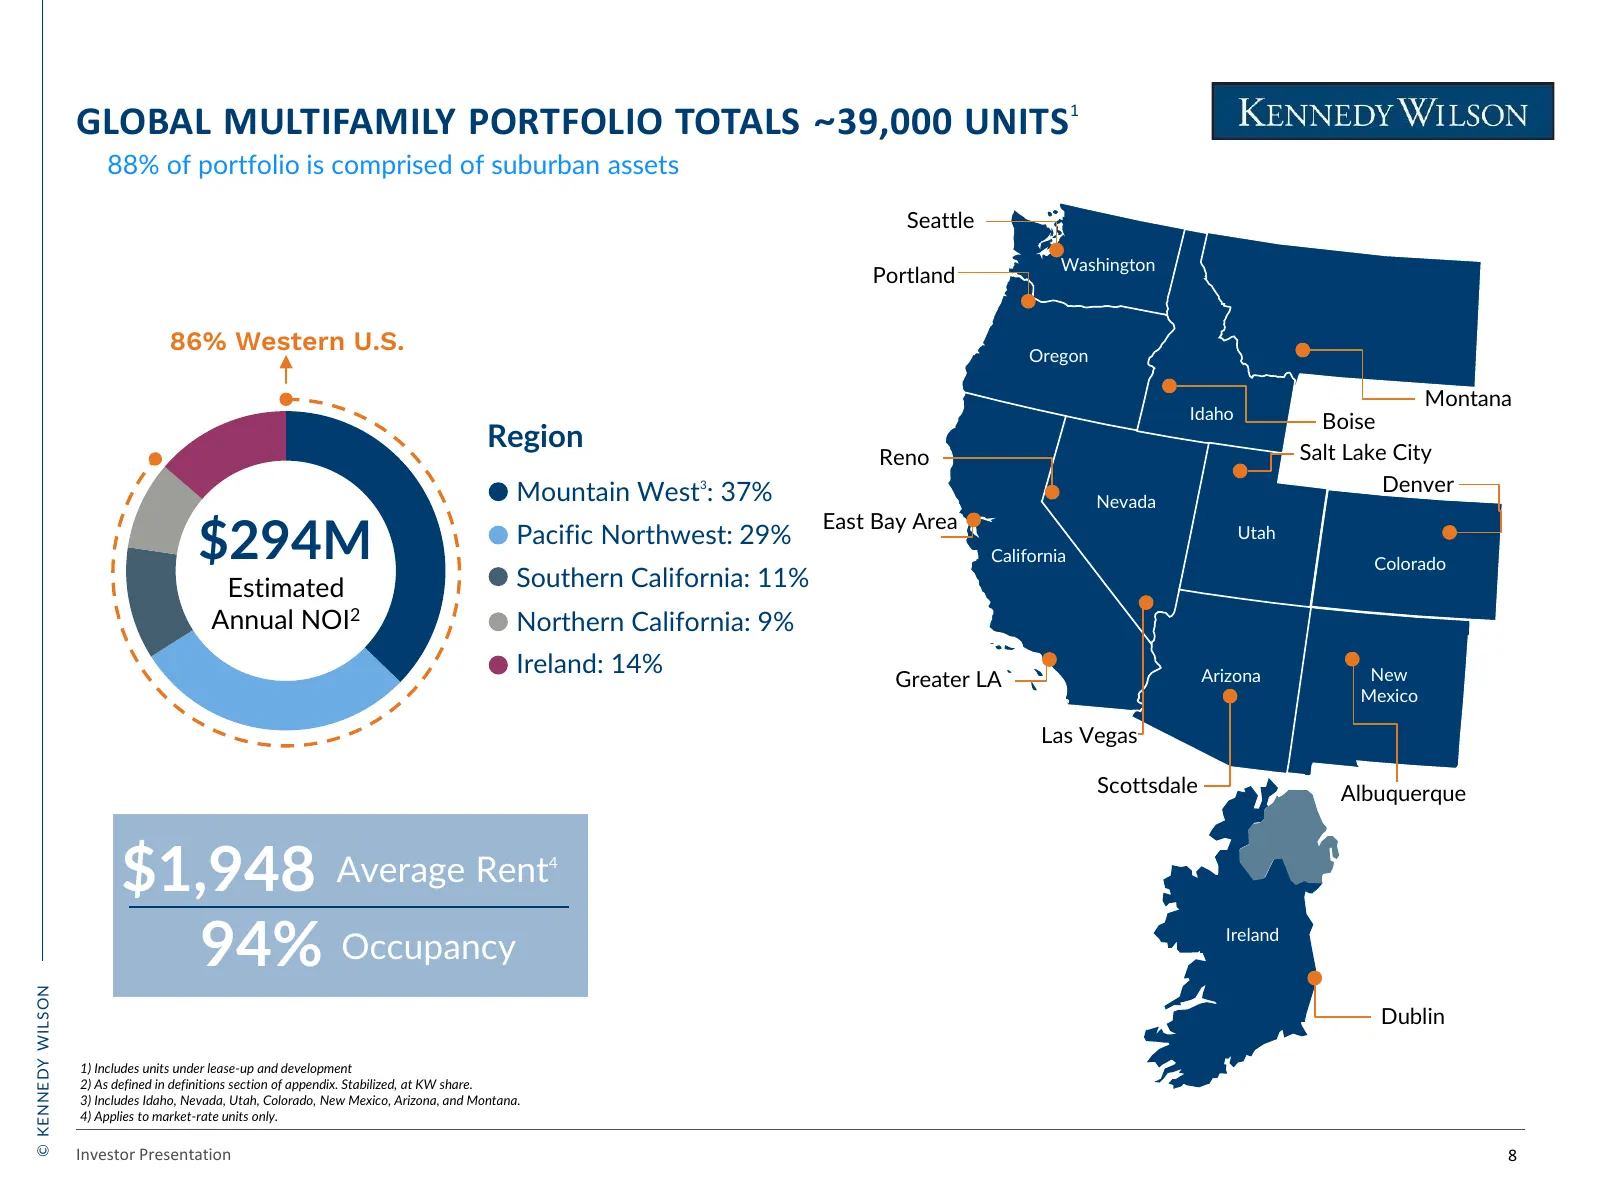
Slide 9: Global Multifamily Portfolio Totals ~39,000 Units
GLOBAL MULTIFAMILY PORTFOLIO TOTALS ~39,000 UNITS1 88% of portfolio is comprised of suburban assets Seattle Washington Portland 86% Western U.S. Oregon Montana Idaho Boise Region Salt Lake City Reno Mountain West : 37% 3 Denver Nevada $294M East Bay Area Pacific Northwest: 29% Utah California Colora
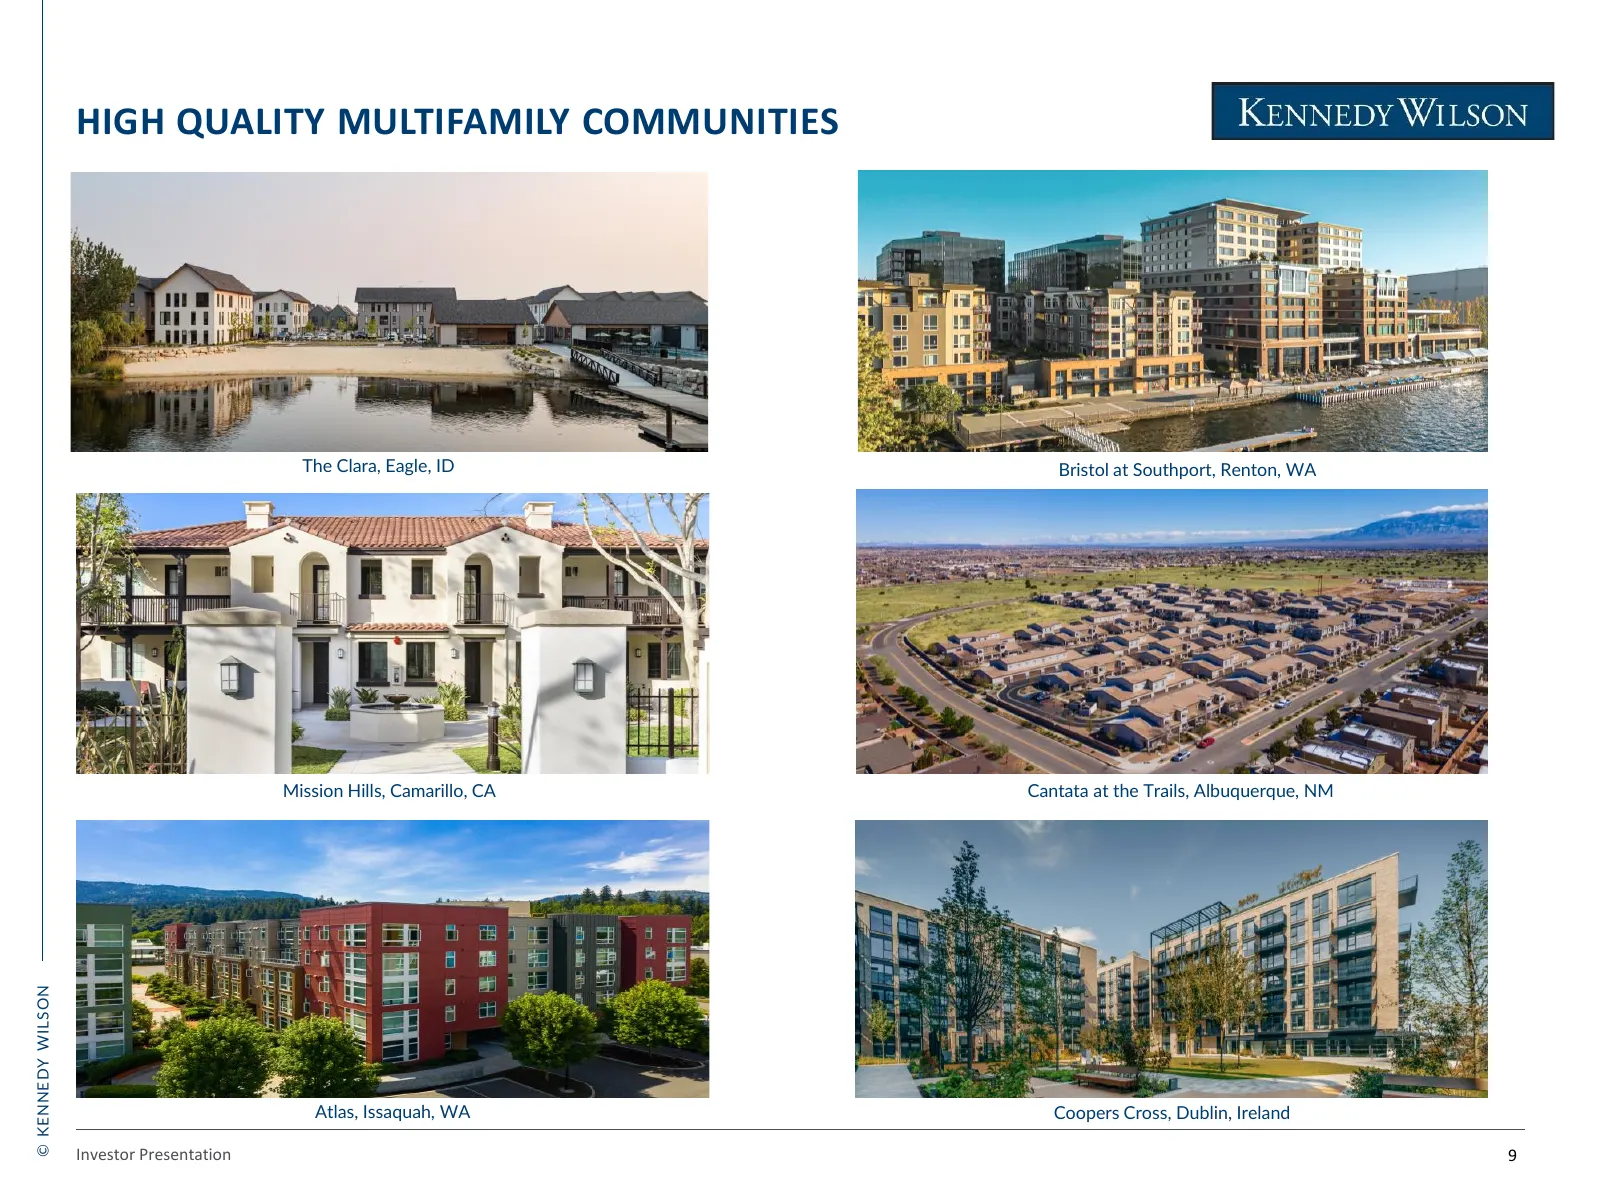
Slide 10: High Quality Multifamily Communities
HIGH QUALITY MULTIFAMILY COMMUNITIES The Clara, Eagle, ID Bristol at Southport, Renton, WA Mission Hills, Camarillo, CA Cantata at the Trails, Albuquerque, NM © KENNEDY WILSON Atlas, Issaquah, WA Coopers Cross, Dublin, Ireland Investor Presentation 9
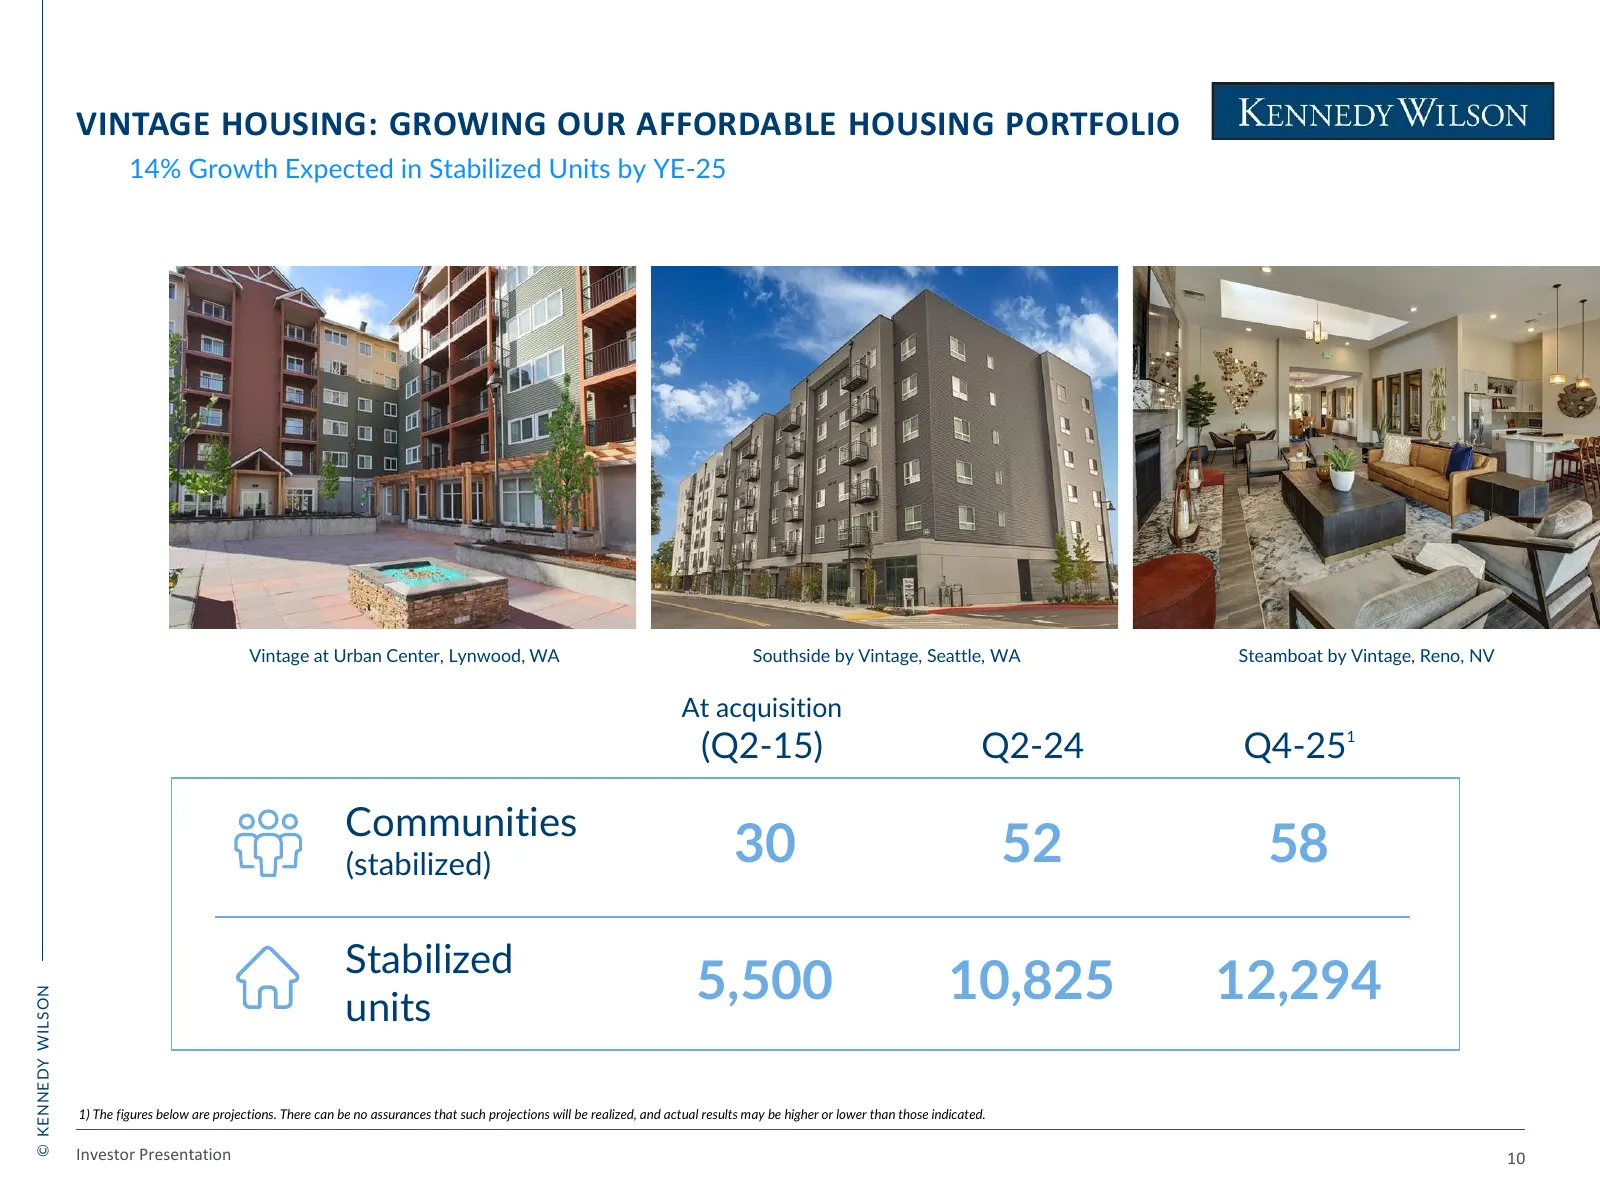
Slide 11: Vintage Housing: Growing Our Affordable Housing Portfolio
VINTAGE HOUSING: GROWING OUR AFFORDABLE HOUSING PORTFOLIO 14% Growth Expected in Stabilized Units by YE-25 Vintage at Urban Center, Lynwood, WA Southside by Vintage, Seattle, WA Steamboat by Vintage, Reno, NV At acquisition (Q2-15) Q2-24 Q4-251 Communities (stabilized) 30 52 58 Stabilized units 5,50
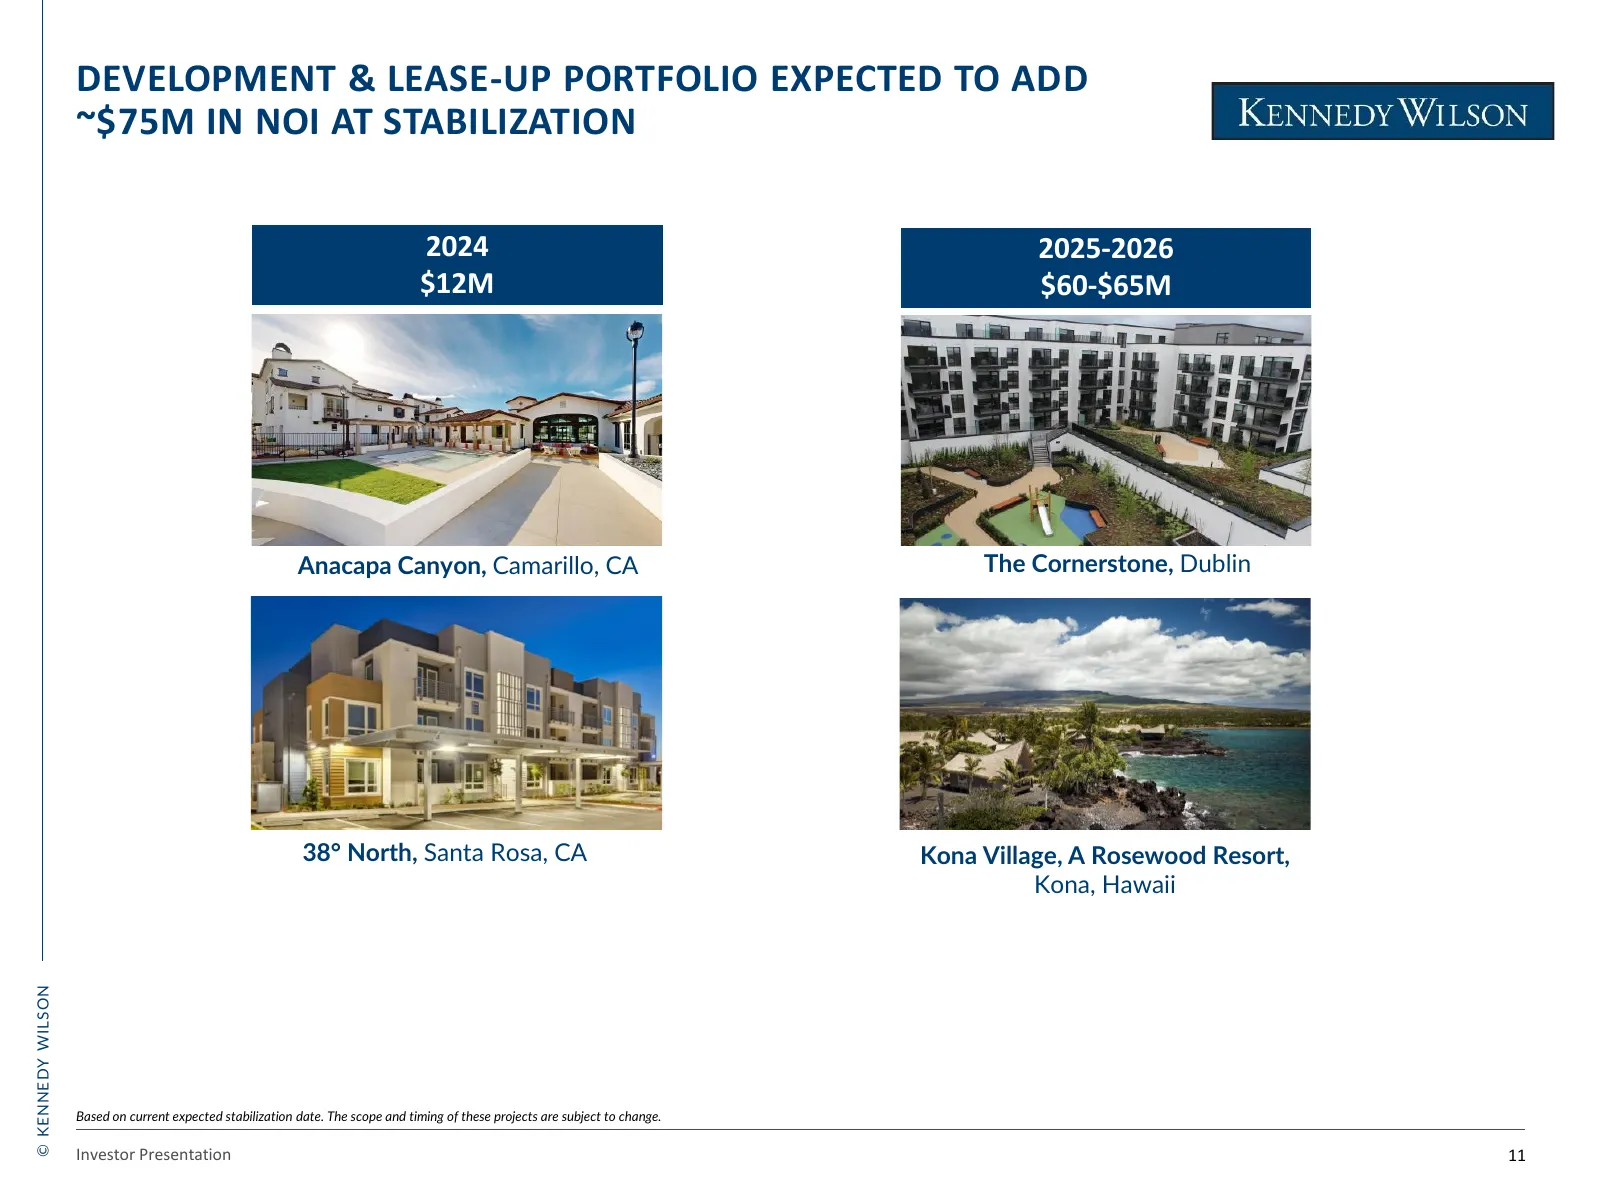
Slide 12: Development & Lease-up Portfolio Expected to Add ~$75M in NOI
DEVELOPMENT & LEASE-UP PORTFOLIO EXPECTED TO ADD ~$75M IN NOI AT STABILIZATION 2024 2025-2026 $12M $60-$65M Anacapa Canyon, Camarillo, CA The Cornerstone, Dublin 38° North, Santa Rosa, CA Kona Village, A Rosewood Resort, Kona, Hawaii © KENNEDY WILSON Based on current expected stabilization date. The
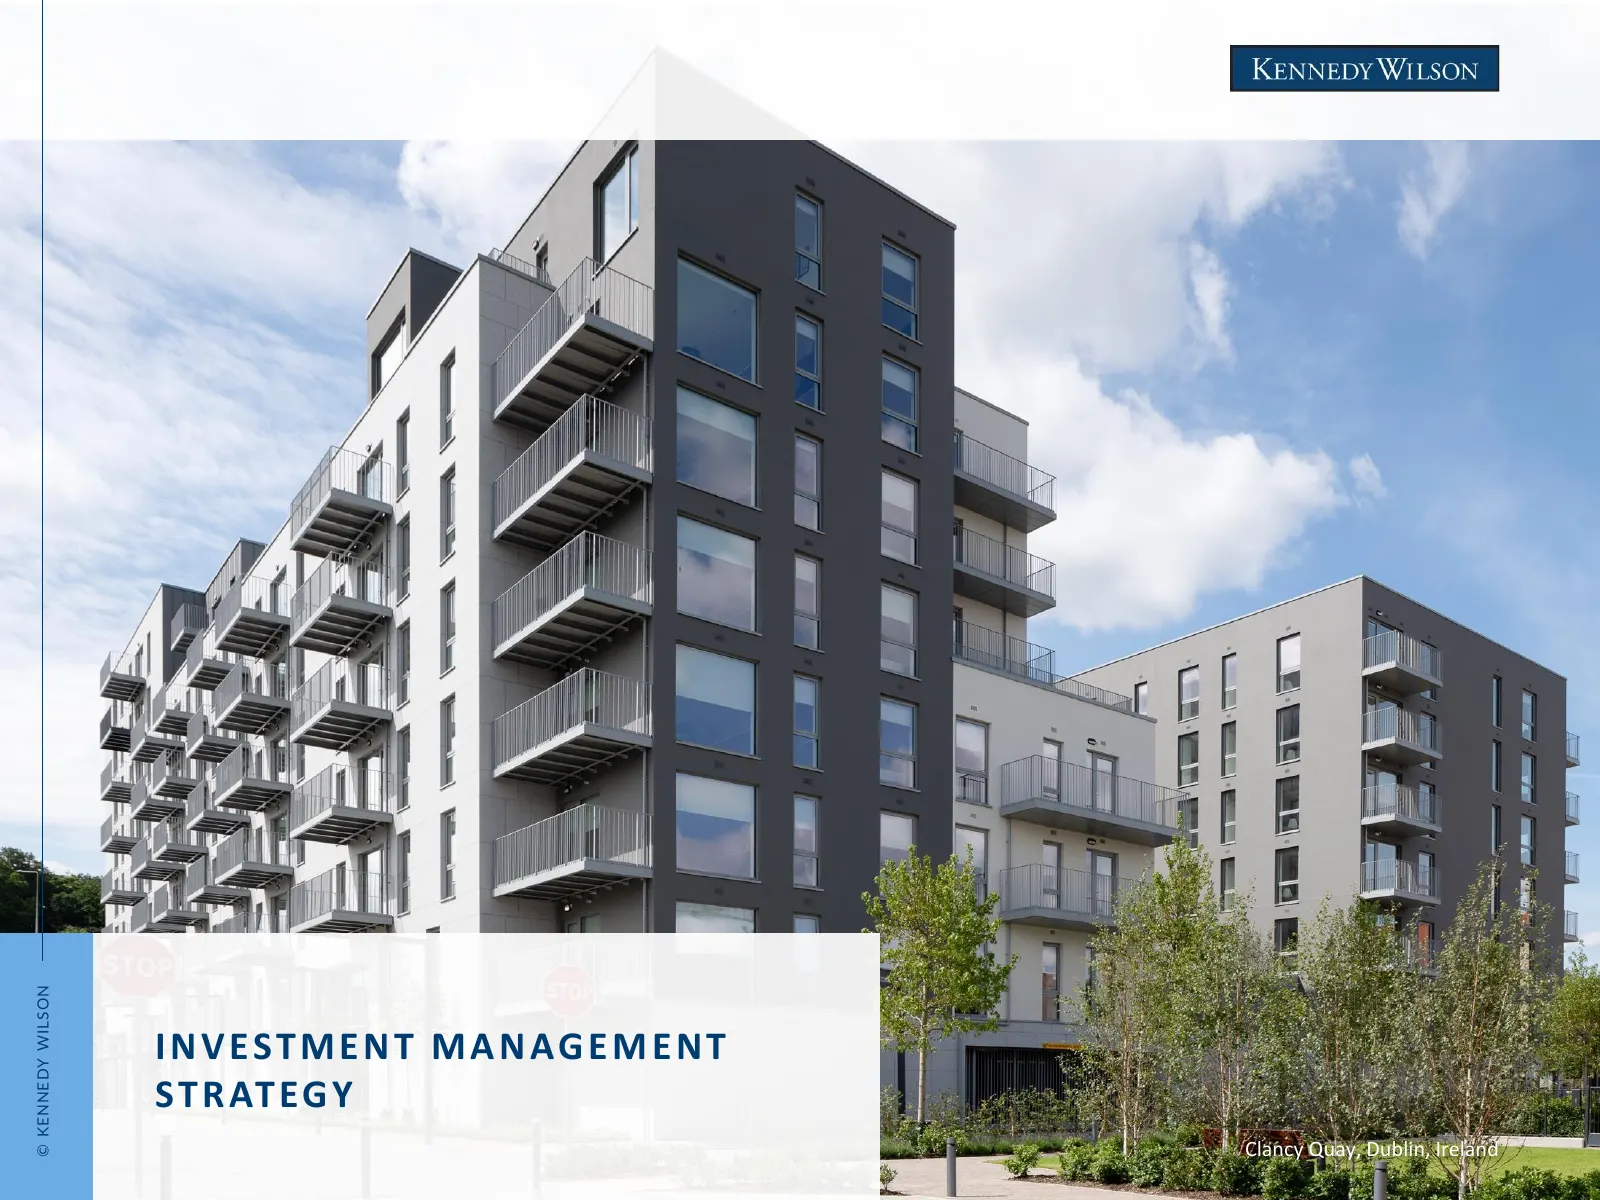
Slide 13: Investment Management Strategy
© KENNEDY WILSON I N V E ST M E N T M A N A G E M E N T S T R AT EG Y Clancy Quay, Dublin, Ireland
Slide 14: Growing Platforms Focused on Multifamily, Credit, and Industrial
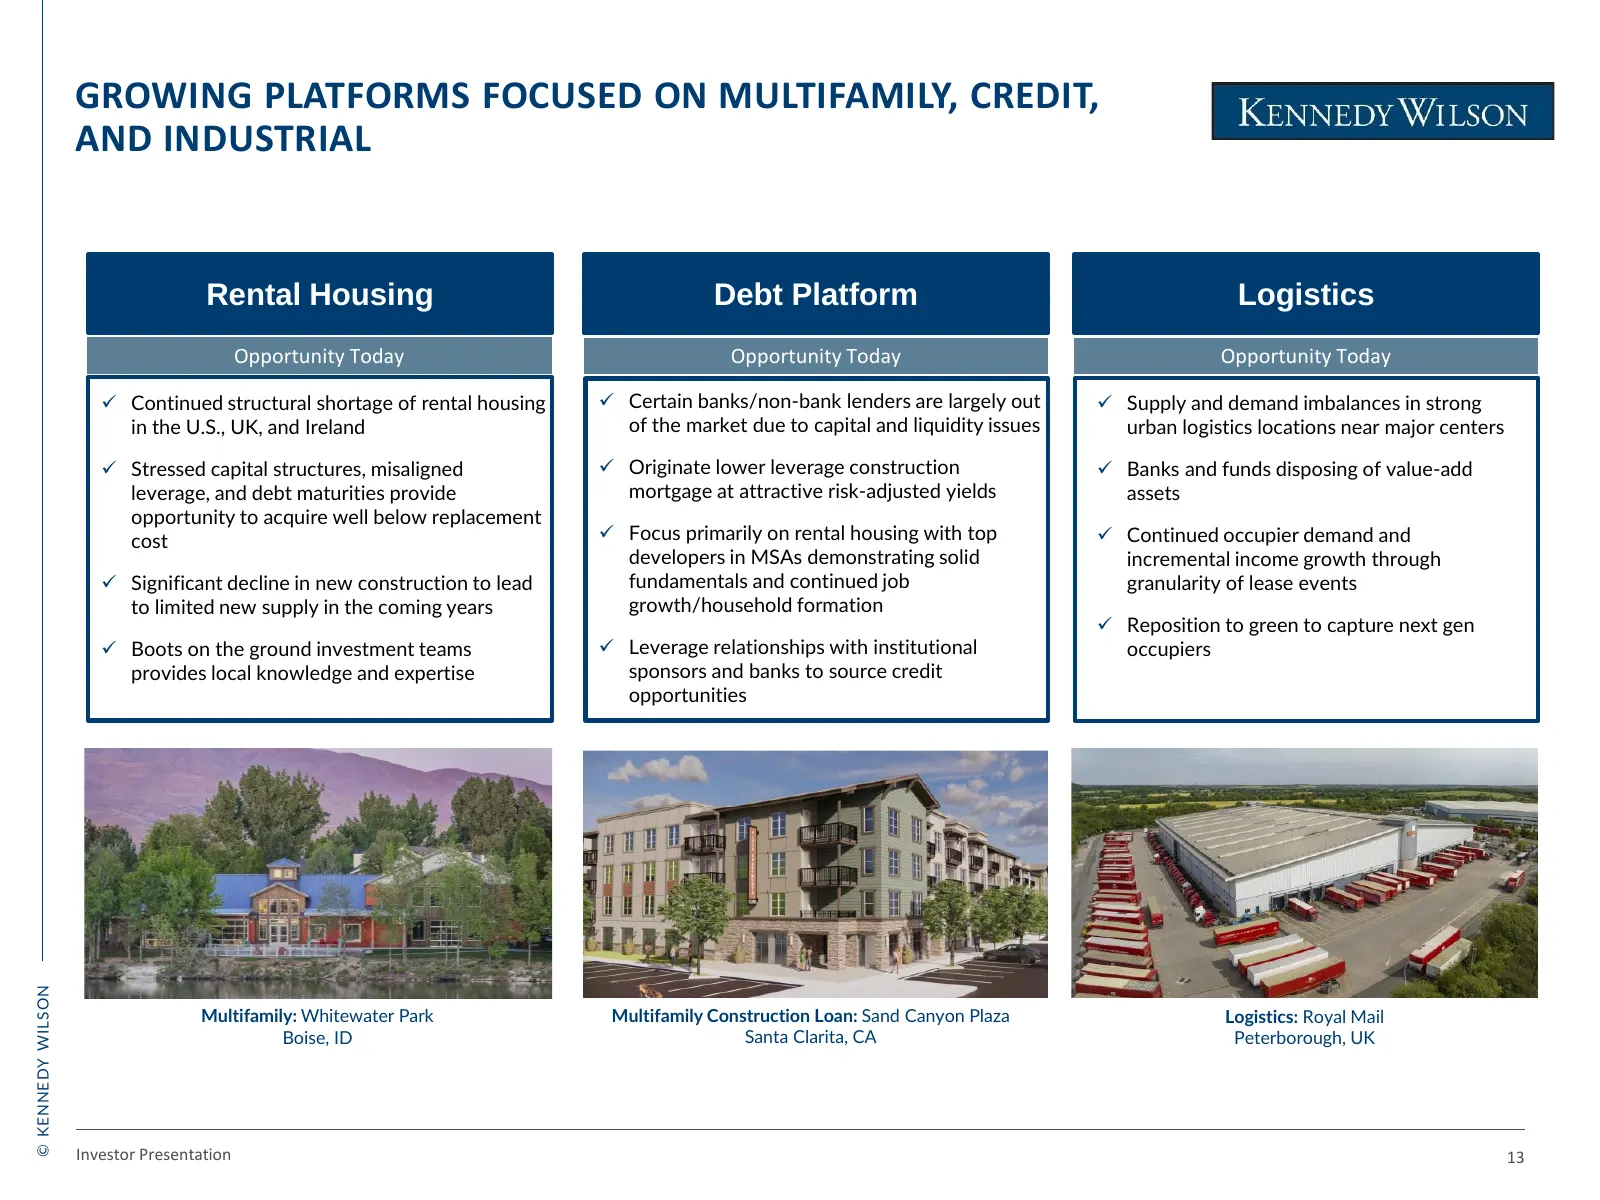
GROWING PLATFORMS FOCUSED ON MULTIFAMILY, CREDIT, AND INDUSTRIAL Rental Housing Debt Platform Logistics Opportunity Today Opportunity Today Opportunity Today ✓ Continued structural shortage of rental housing ✓ Certain banks/non-bank lenders are largely out ✓ Supply and demand imbalances in strong in
Slide 15: Strong Track Record of Growth
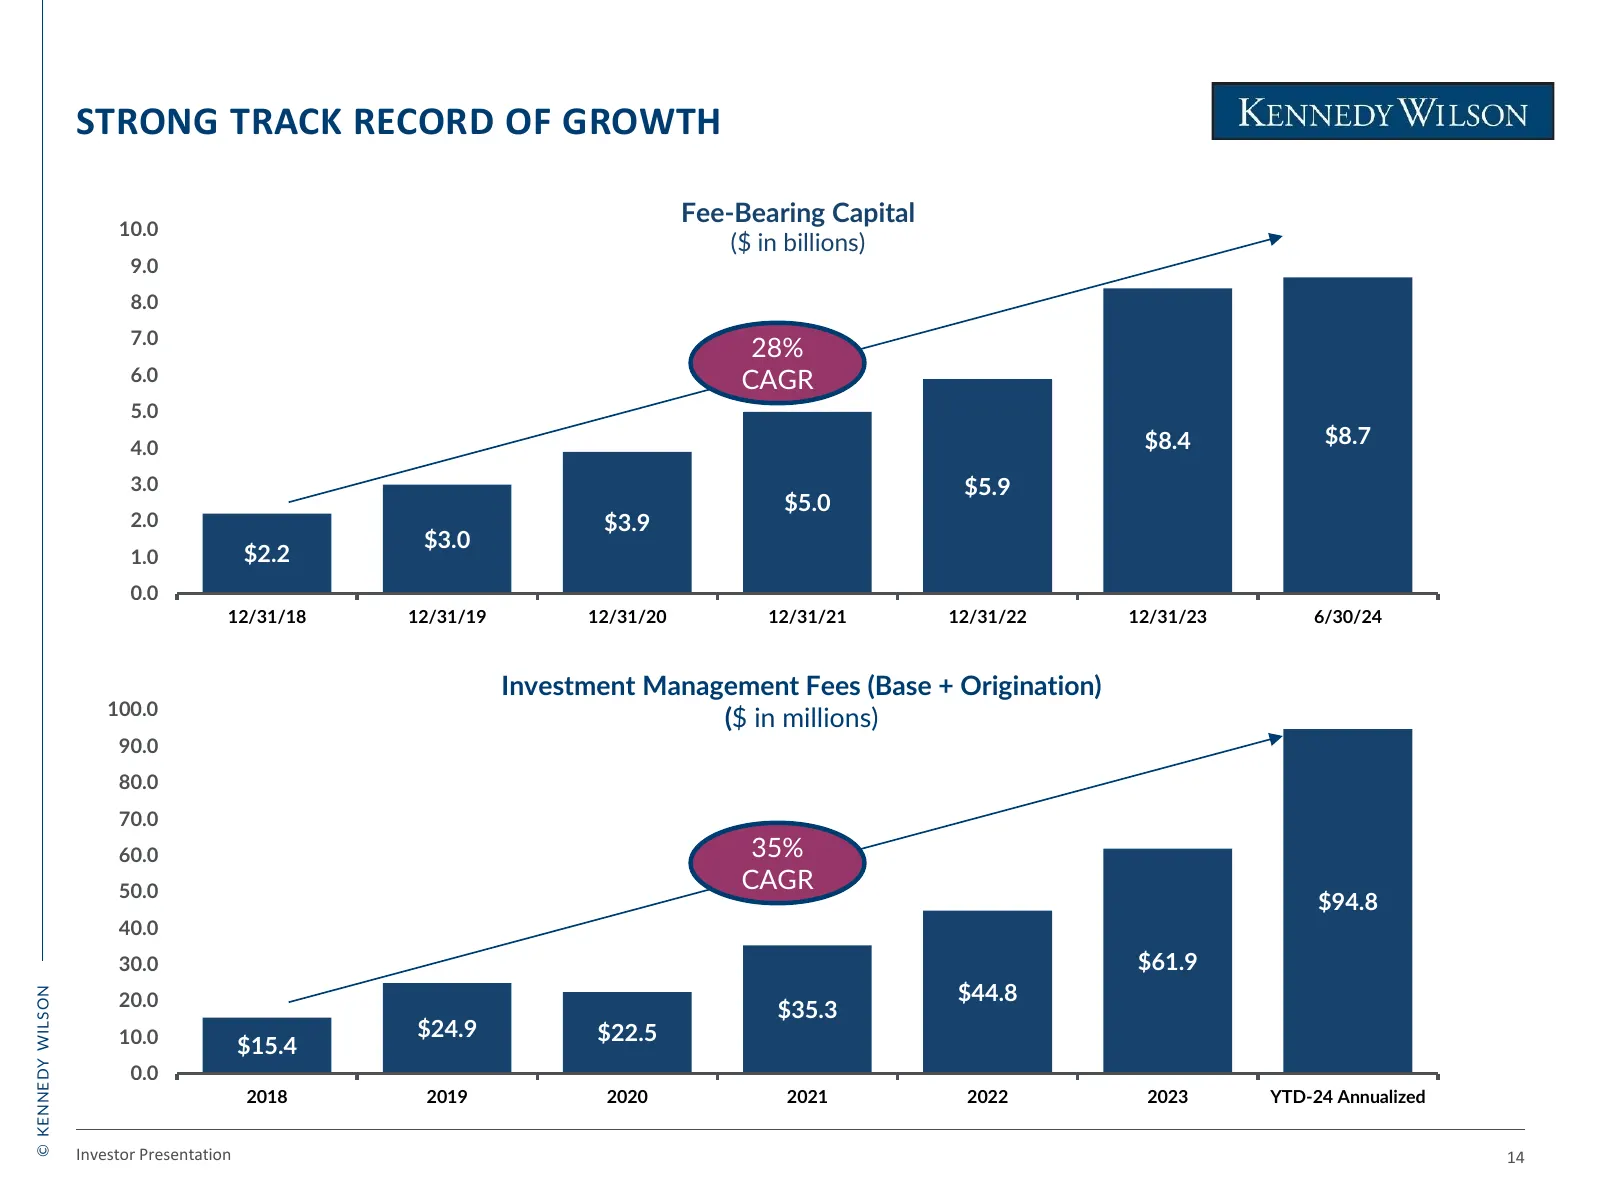
STRONG TRACK RECORD OF GROWTH Fee-Bearing Capital 10.0 ($ in billions) 9.0 8.0 7.0 28% 6.0 CAGR 5.0 4.0 $8.4 $8.7 3.0 $5.9 $5.0 2.0 $3.9 $3.0 1.0 $2.2 0.0 12/31/18 12/31/19 12/31/20 12/31/21 12/31/22 12/31/23 6/30/24 Investment Management Fees (Base + Origination) 100.0 ($ in millions) 90.0 80.0 70.
Slide 16: Best-in-Class Stable of Institutional Investors
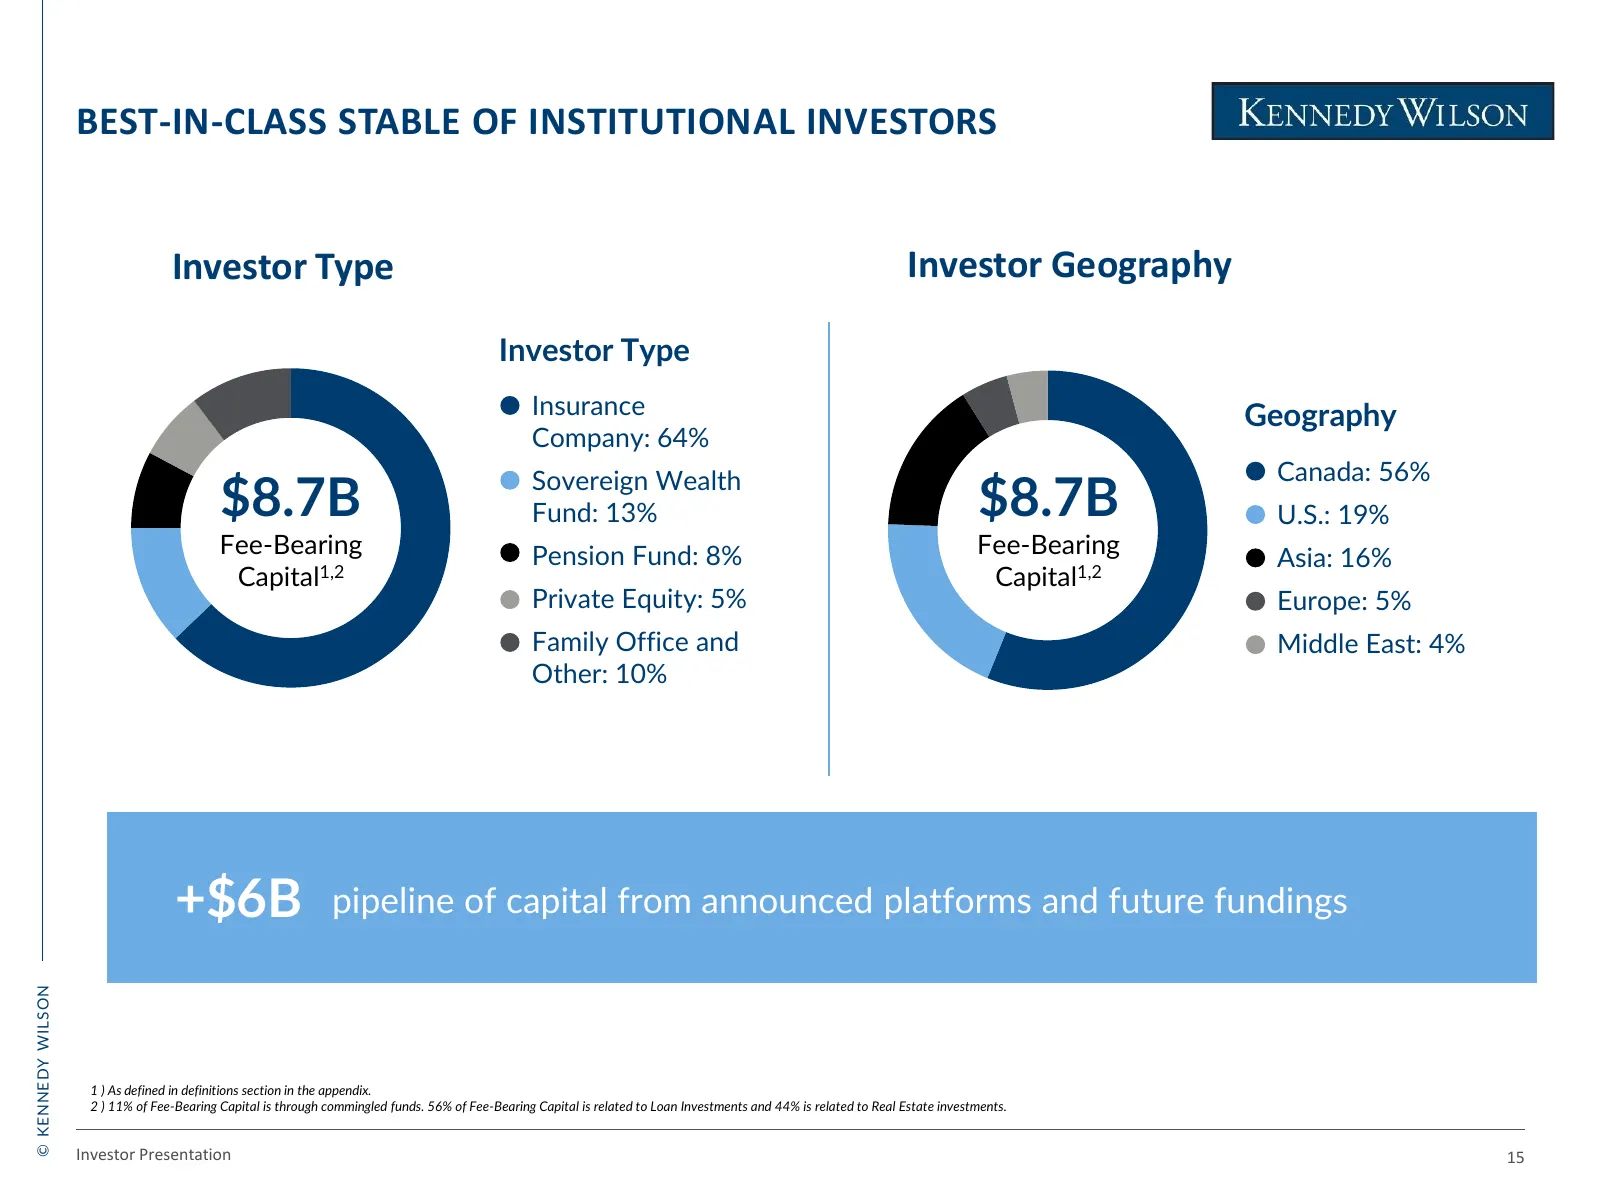
BEST-IN-CLASS STABLE OF INSTITUTIONAL INVESTORS Investor Type Investor Geography Investor Type Insurance Geography Company: 64% Canada: 56% $8.7B Sovereign Wealth Fund: 13% $8.7B U.S.: 19% Fee-Bearing Pension Fund: 8% Fee-Bearing Asia: 16% Capital1,2 Capital1,2 Private Equity: 5% Europe: 5% Family O
Slide 17: Debt Platform
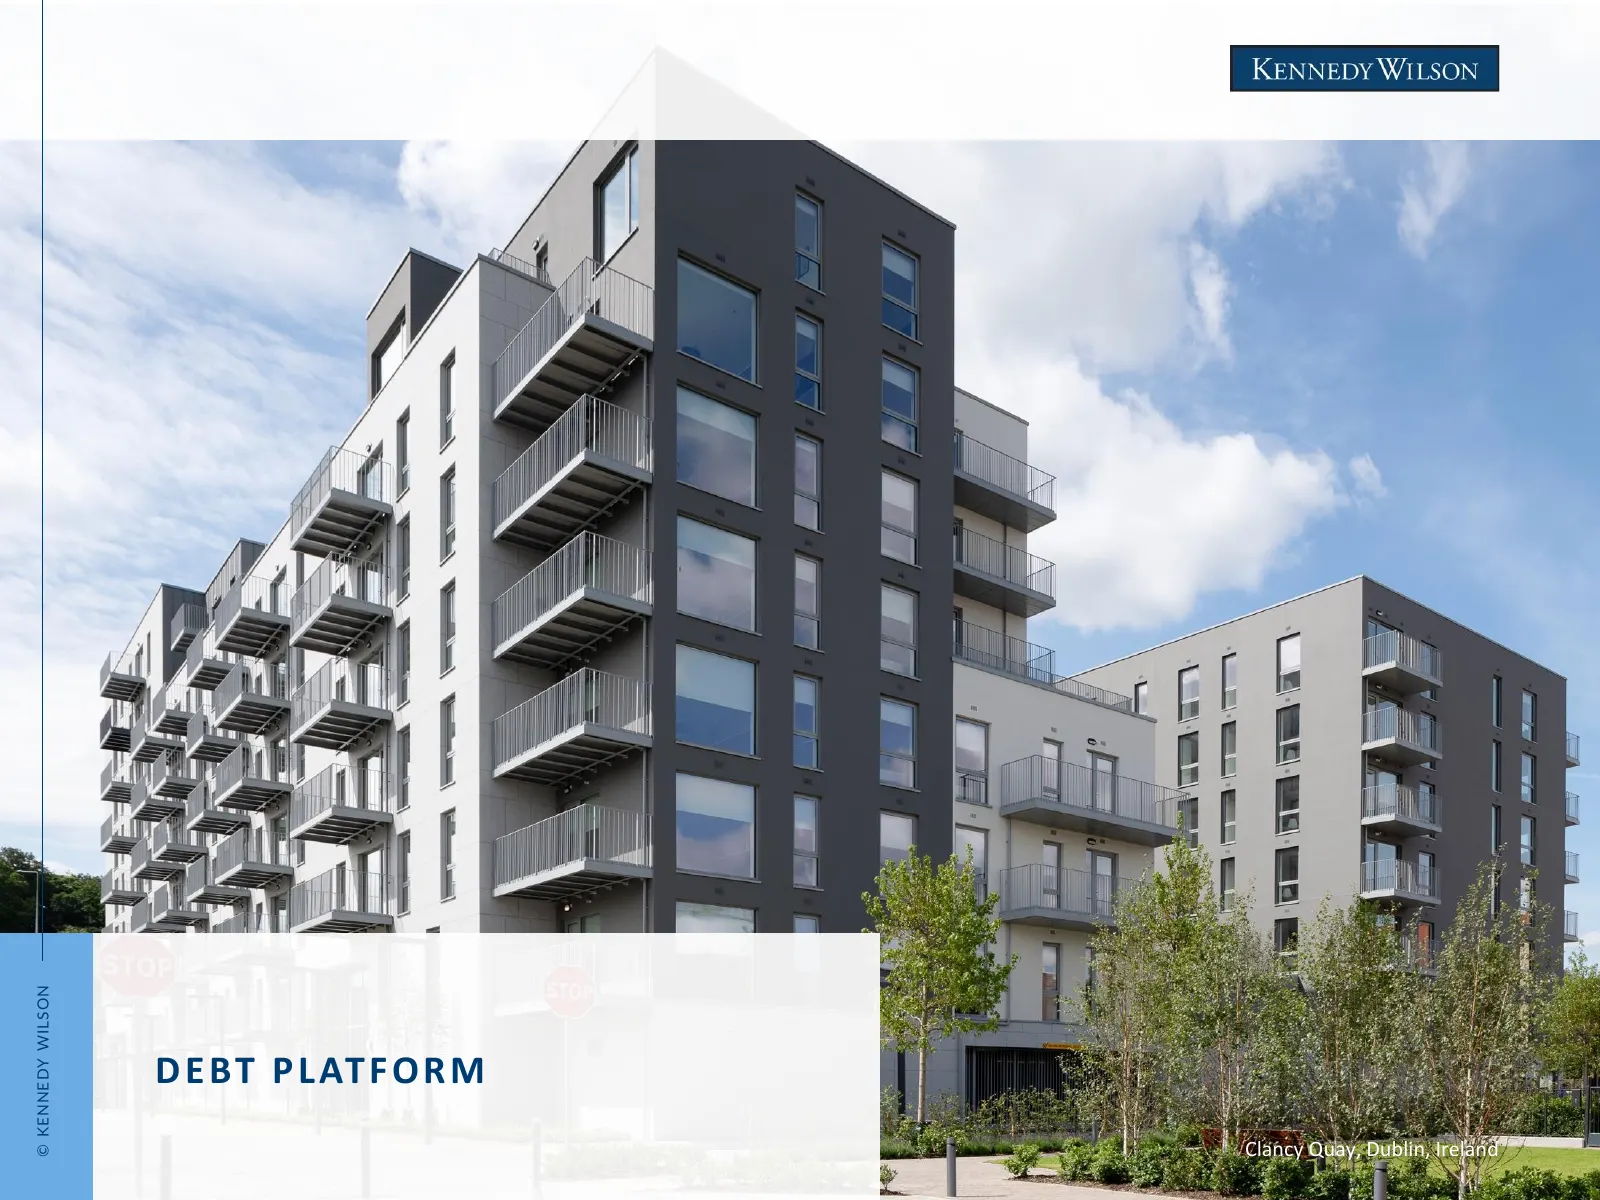
© KENNEDY WILSON D E BT P L AT F O R M Clancy Quay, Dublin, Ireland
Slide 18: Case Study: $4.1B PacWest Bank Transaction
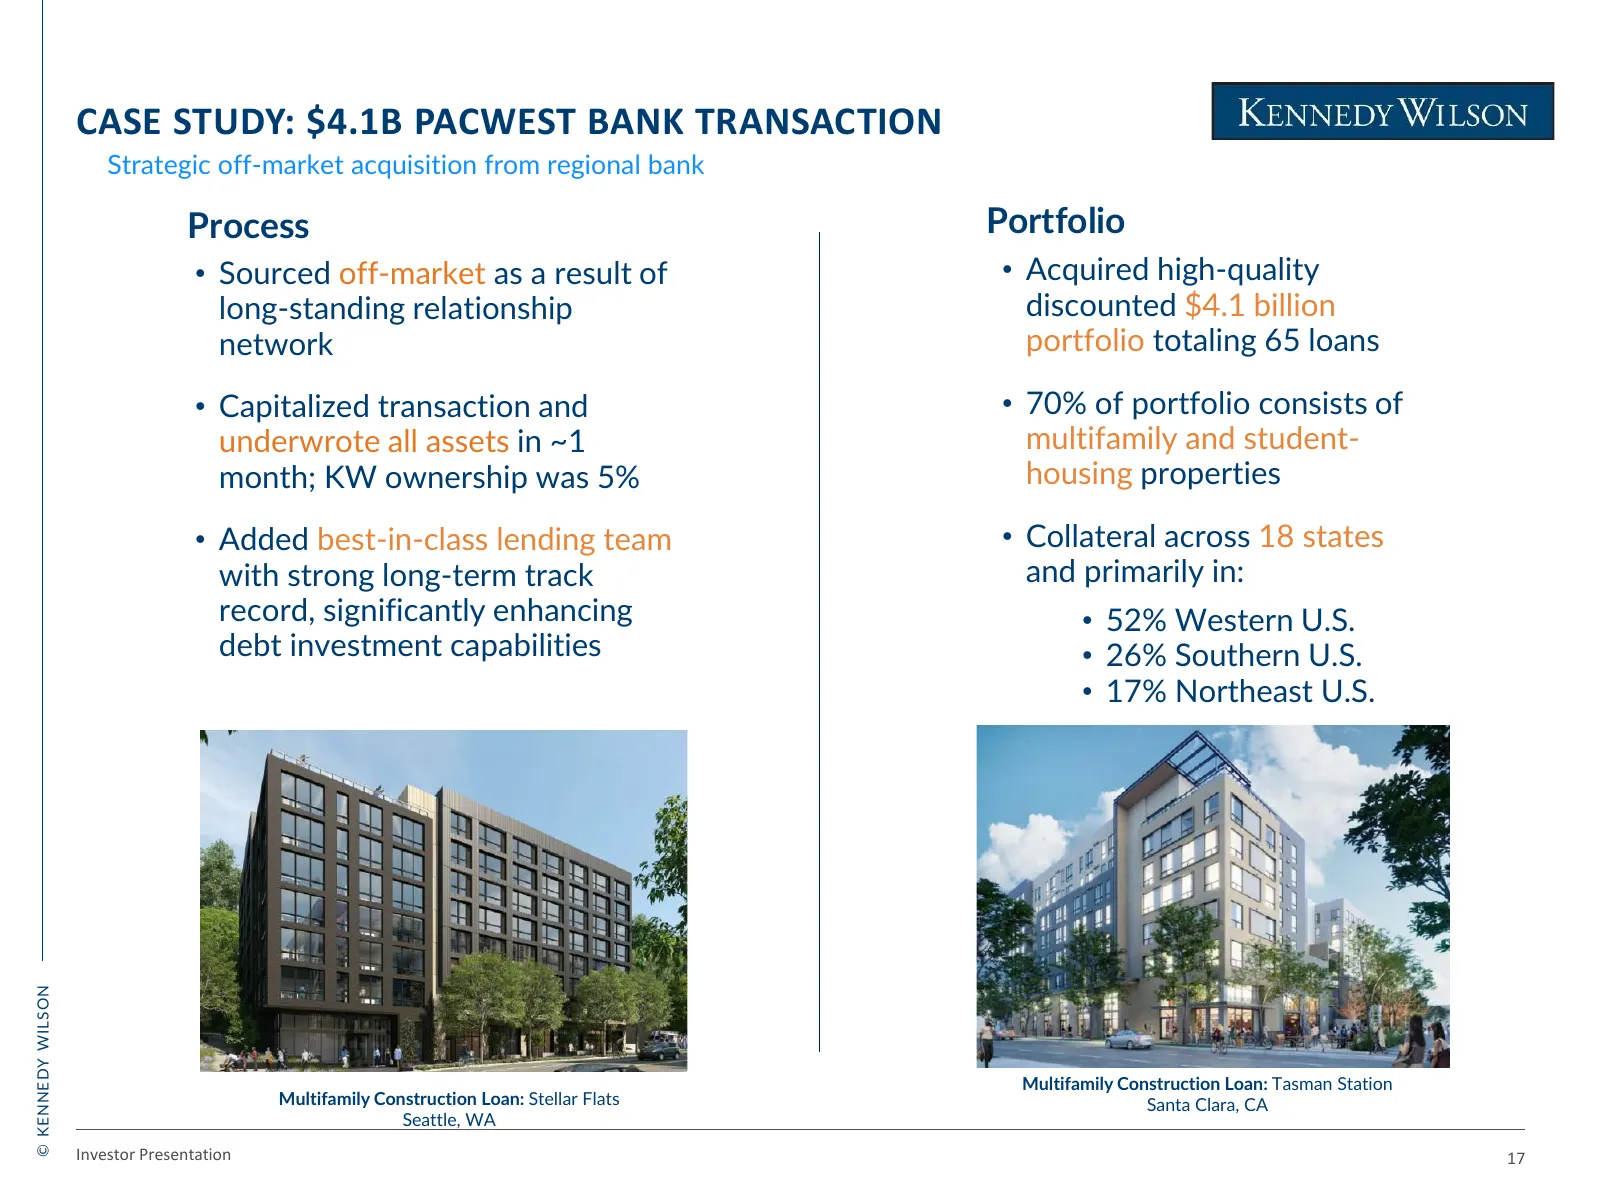
CASE STUDY: $4.1B PACWEST BANK TRANSACTION Strategic off-market acquisition from regional bank Process Portfolio • Sourced off-market as a result of • Acquired high-quality long-standing relationship discounted $4.1 billion network portfolio totaling 65 loans • Capitalized transaction and • 70% of p
Slide 19: Growth in Originations Since Joining KW in Q3-2023
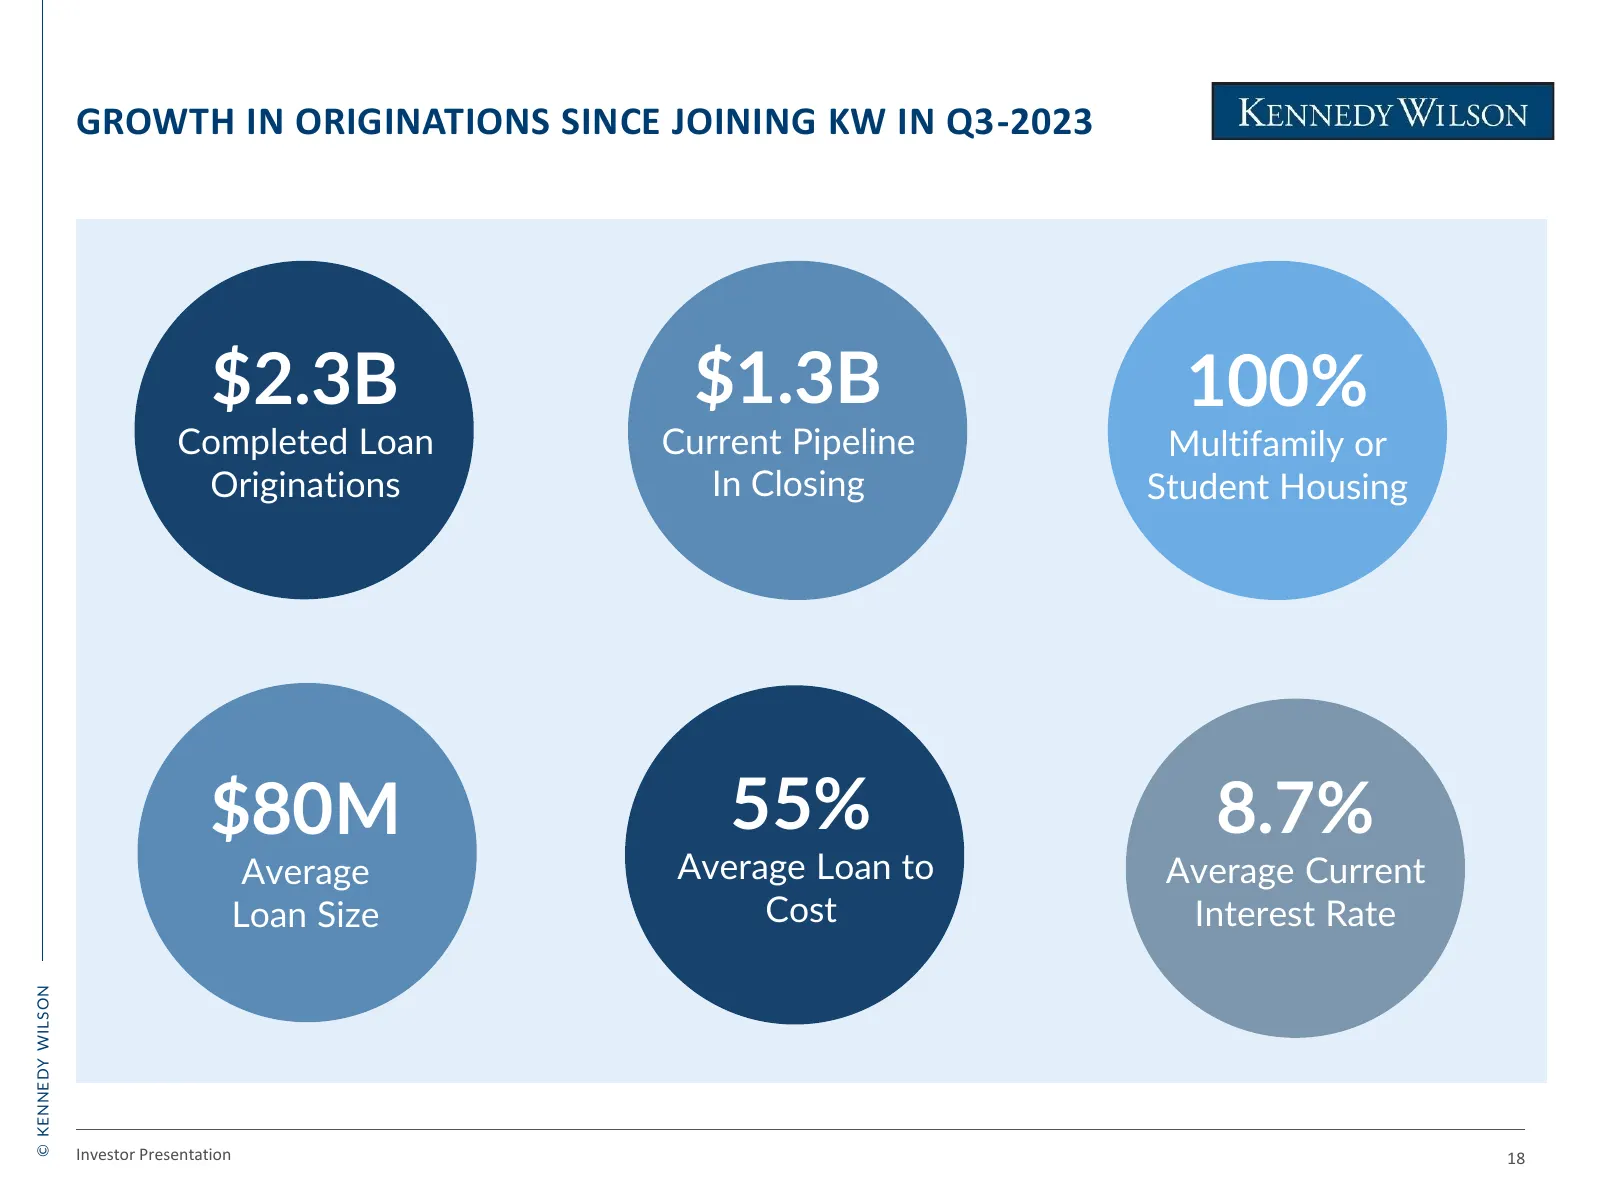
GROWTH IN ORIGINATIONS SINCE JOINING KW IN Q3-2023 $2.3B $1.3B 100% Completed Loan Current Pipeline Multifamily or Originations In Closing Student Housing $80M 55% 8.7% Average Average Loan to Average Current Loan Size Cost Interest Rate © KENNEDY WILSON Investor Presentation 18
Slide 20: Debt Group Supported by Global Investment Team
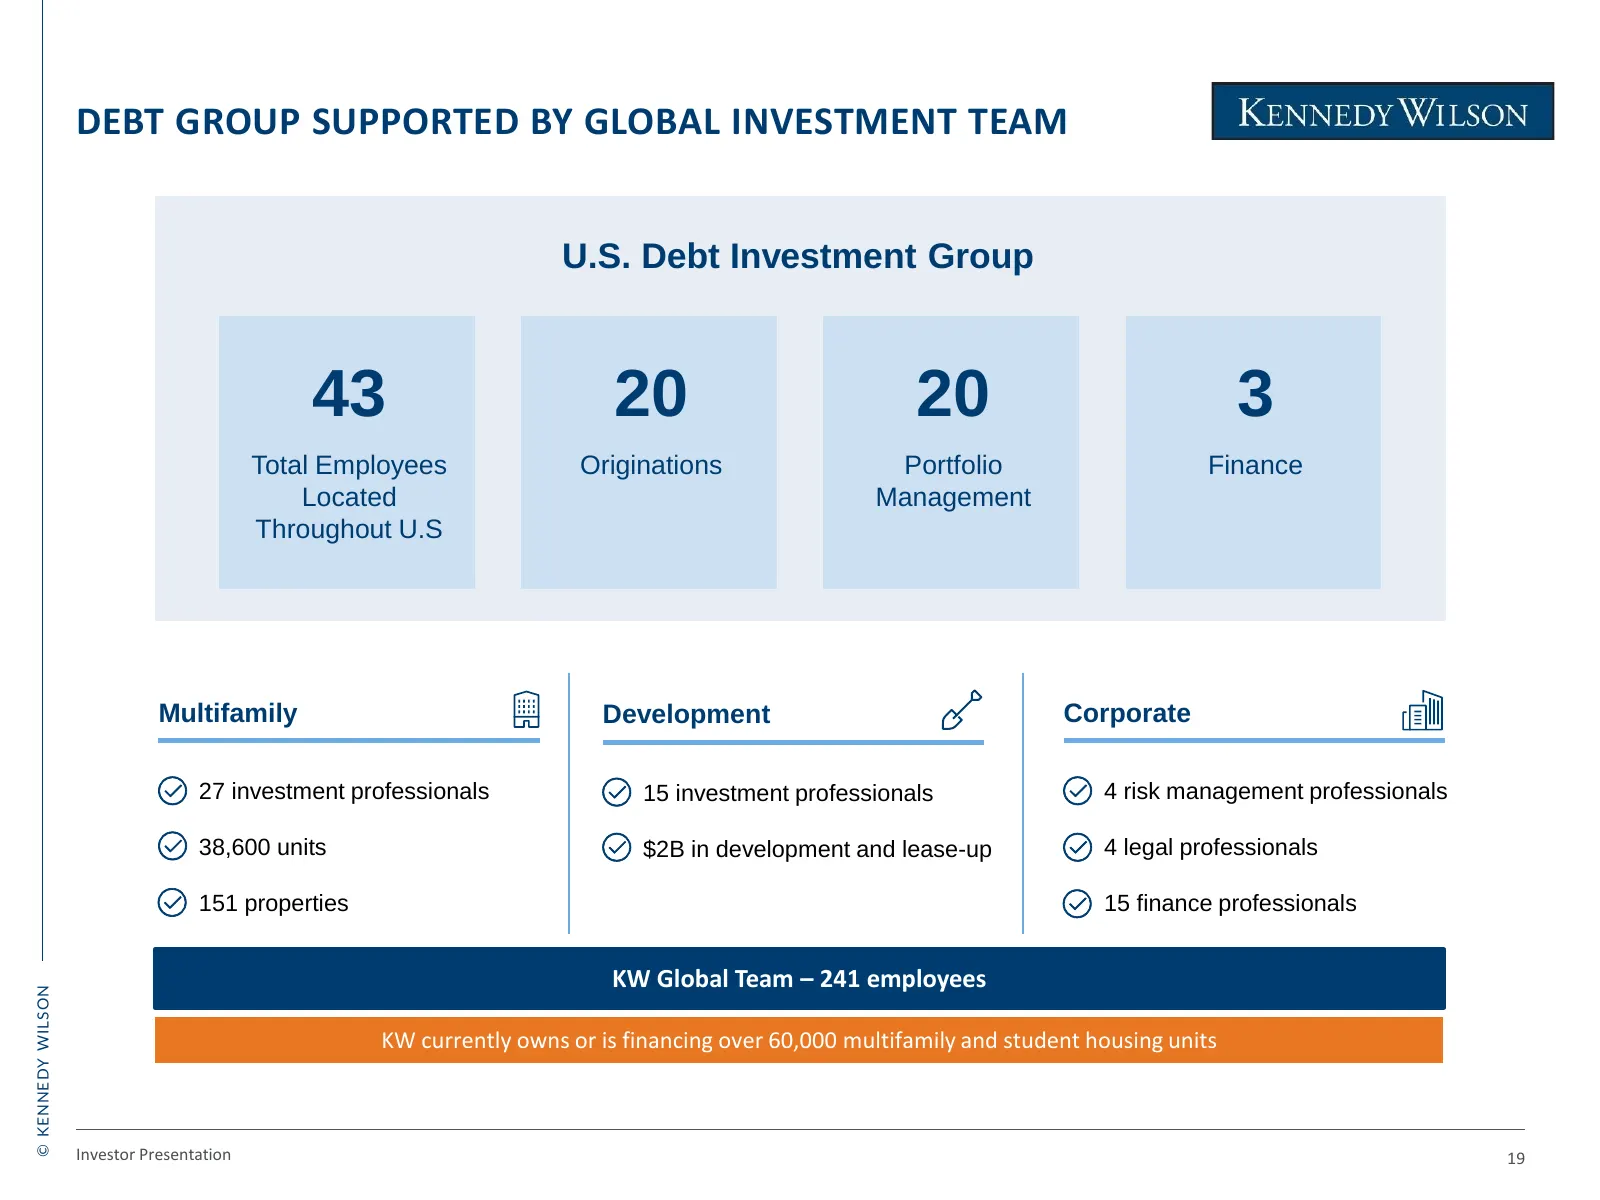
DEBT GROUP SUPPORTED BY GLOBAL INVESTMENT TEAM U.S. Debt Investment Group 43 20 20 3 Total Employees Originations Portfolio Finance Located Management Throughout U.S Multifamily Development Corporate 27 investment professionals 15 investment professionals 4 risk management professionals 38,600 units
Slide 21: Debt Platform Overview
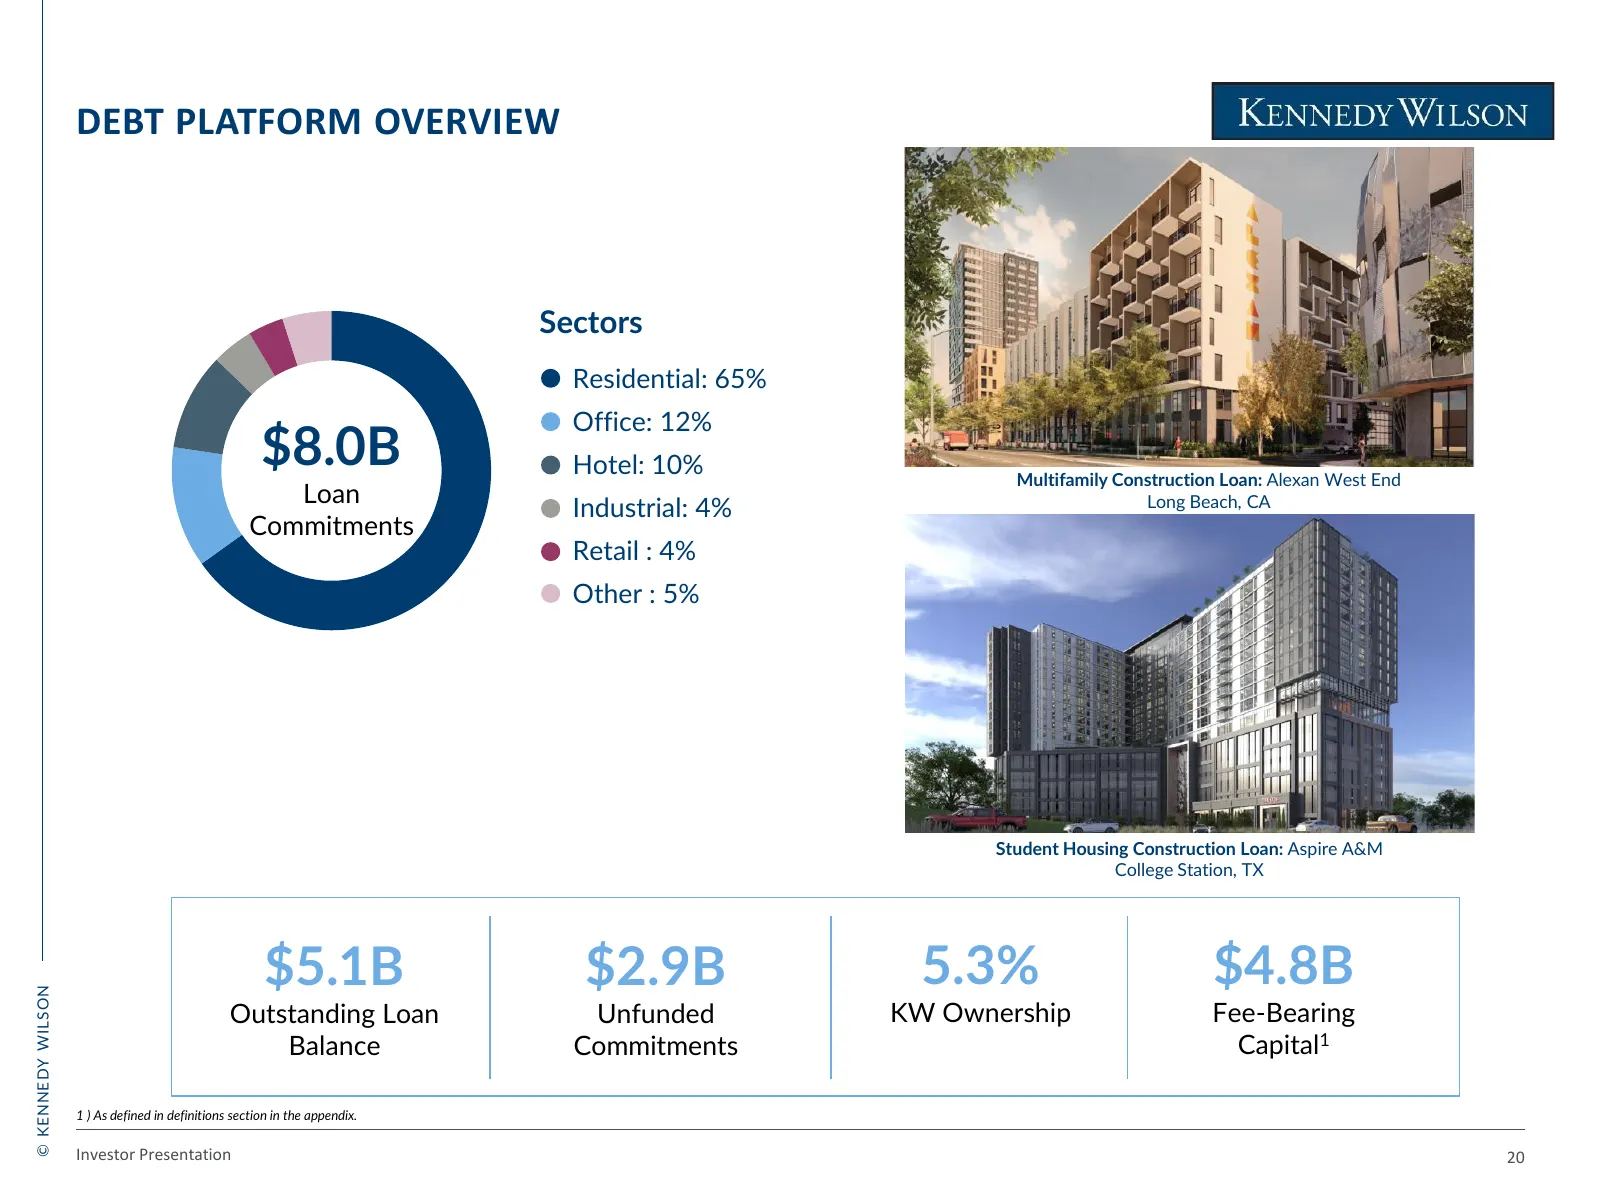
DEBT PLATFORM OVERVIEW Sectors Residential: 65% Office: 12% $8.0B Hotel: 10% Multifamily Construction Loan: Alexan West End Loan Long Beach, CA Industrial: 4% Commitments Retail : 4% Other : 5% Student Housing Construction Loan: Aspire A&M College Station, TX $5.1B $2.9B 5.3% $4.8B © KENNEDY WILSON
Slide 22: Construction Loans Provides a National Footprint
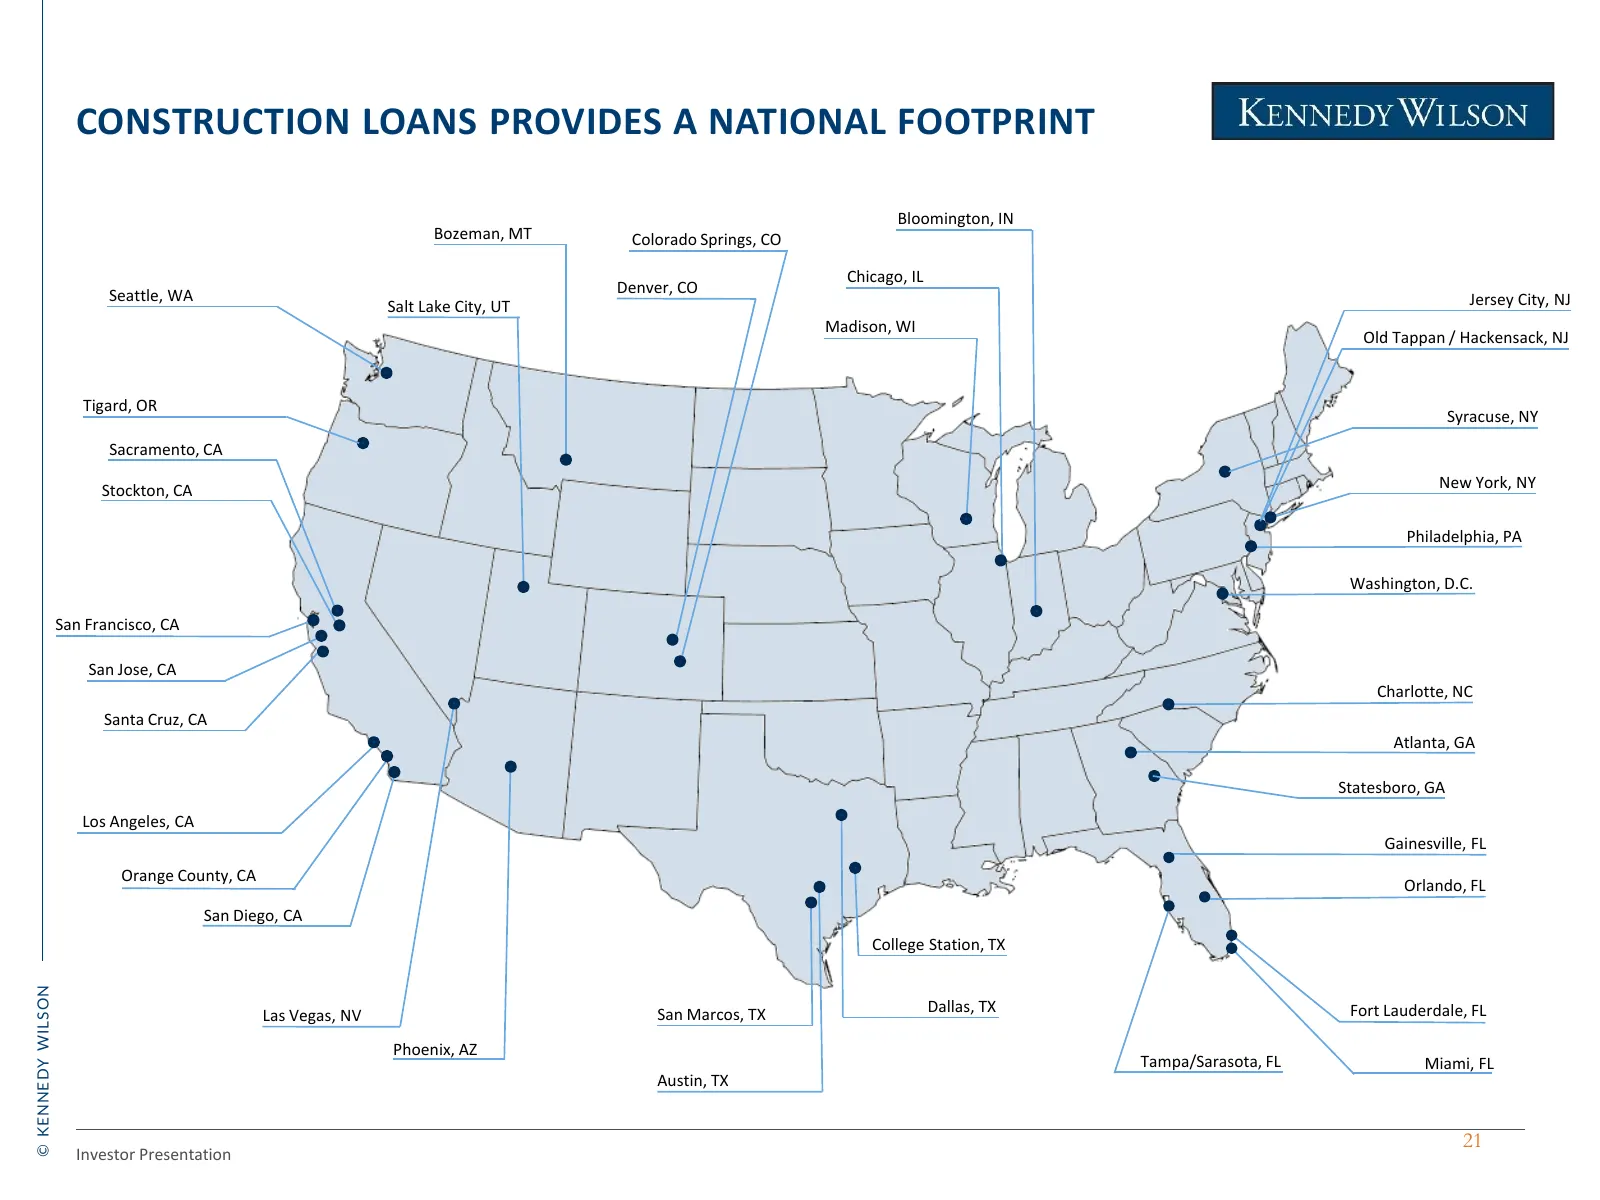
CONSTRUCTION LOANS PROVIDES A NATIONAL FOOTPRINT Bloomington, IN Bozeman, MT Colorado Springs, CO Chicago, IL Seattle, WA Denver, CO Salt Lake City, UT Jersey City, NJ Madison, WI Old Tappan / Hackensack, NJ Tigard, OR Syracuse, NY Sacramento, CA Stockton, CA New York, NY Philadelphia, PA Washington
Slide 23: An Active Lender in Student Housing Development
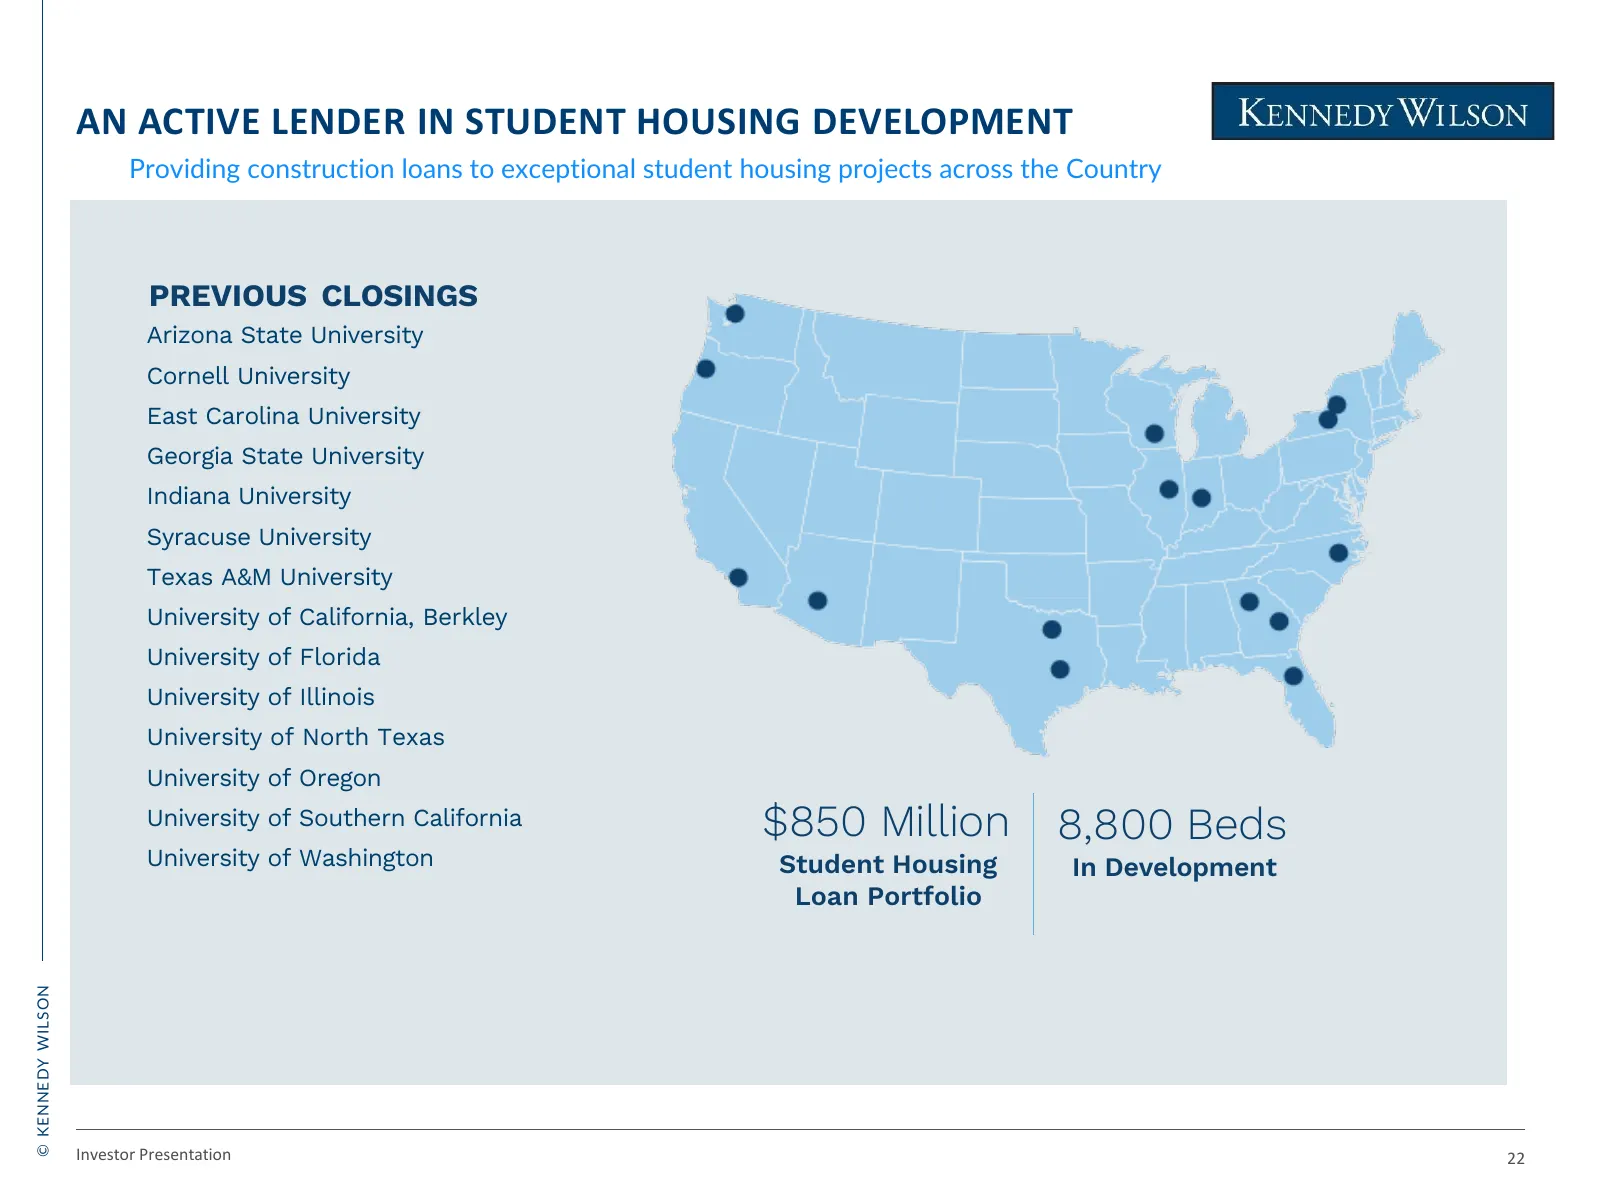
AN ACTIVE LENDER IN STUDENT HOUSING DEVELOPMENT Providing construction loans to exceptional student housing projects across the Country PREVIOUS CLOSINGS Arizona State University Cornell University East Carolina University Georgia State University Indiana University Syracuse University Texas A&M Uni
Slide 24: Construction Lending Capital Structure
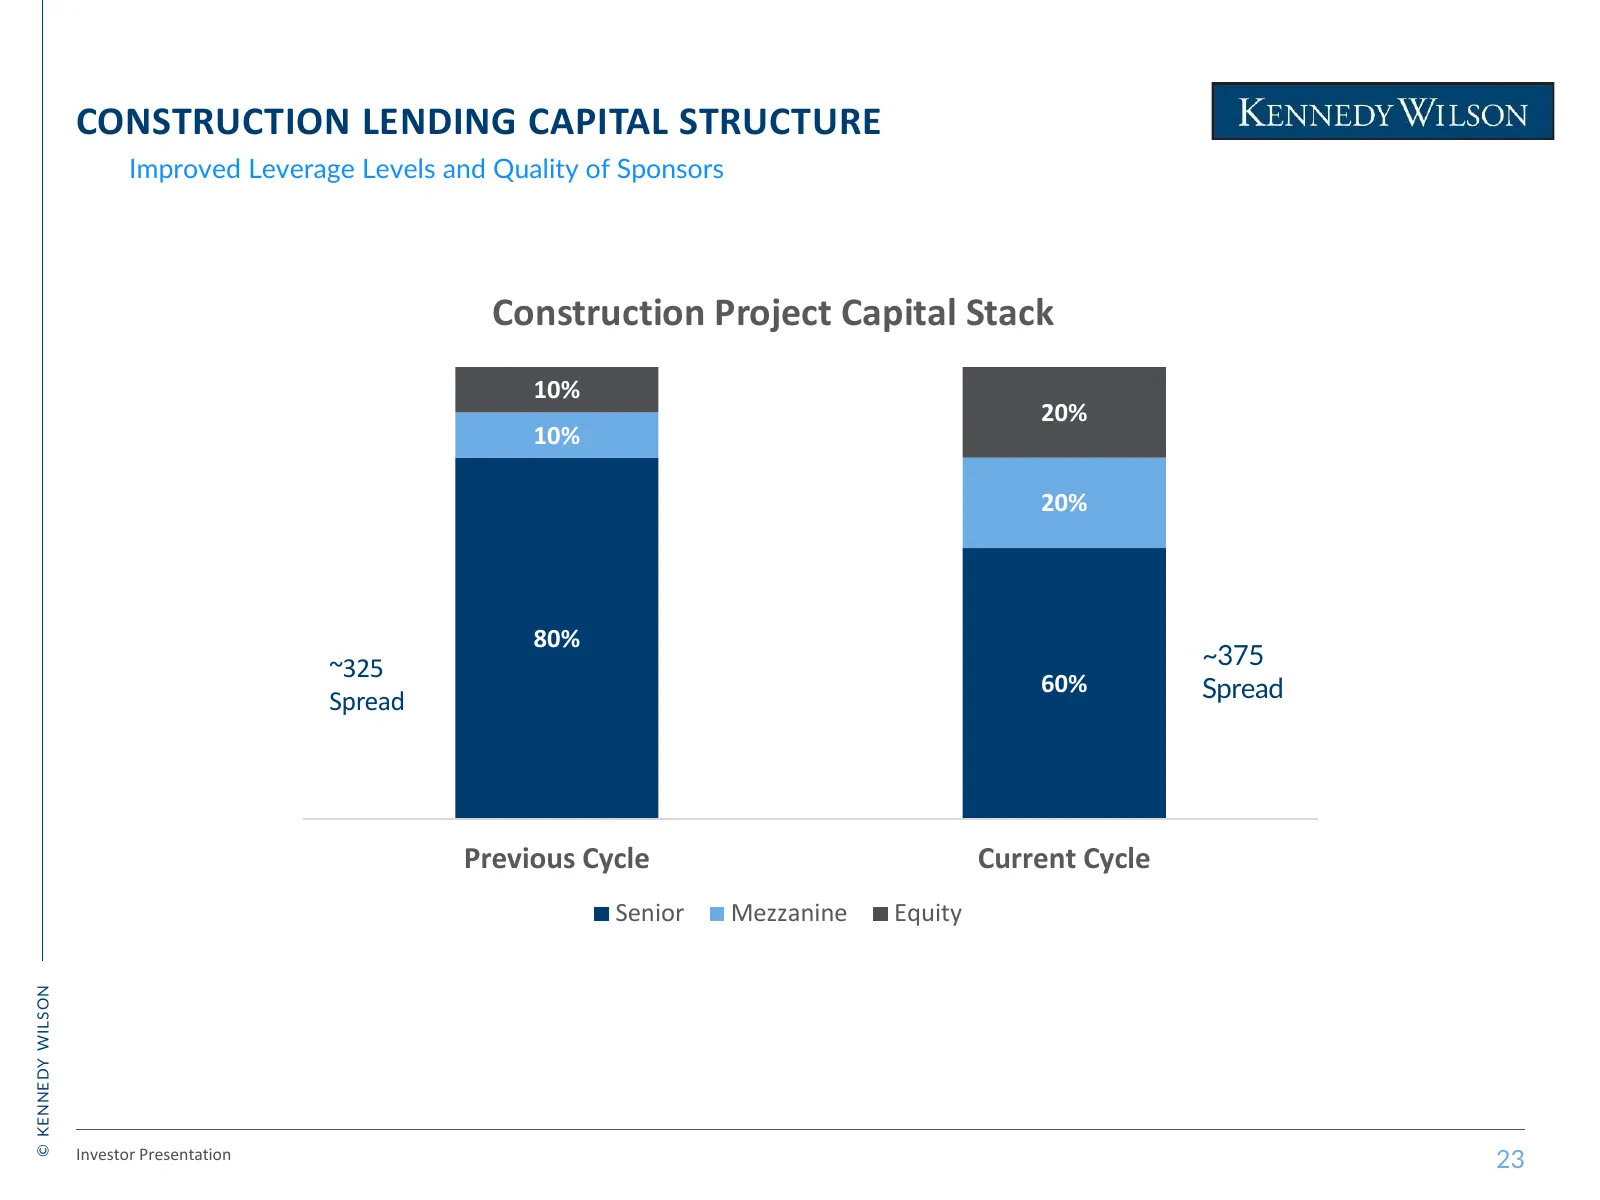
CONSTRUCTION LENDING CAPITAL STRUCTURE Improved Leverage Levels and Quality of Sponsors Construction Project Capital Stack 10% 20% 10% 20% 80% ~325 ~375 Spread 60% Spread Previous Cycle Current Cycle Senior Mezzanine Equity © KENNEDY WILSON Investor Presentation 23
Slide 25: Appendix
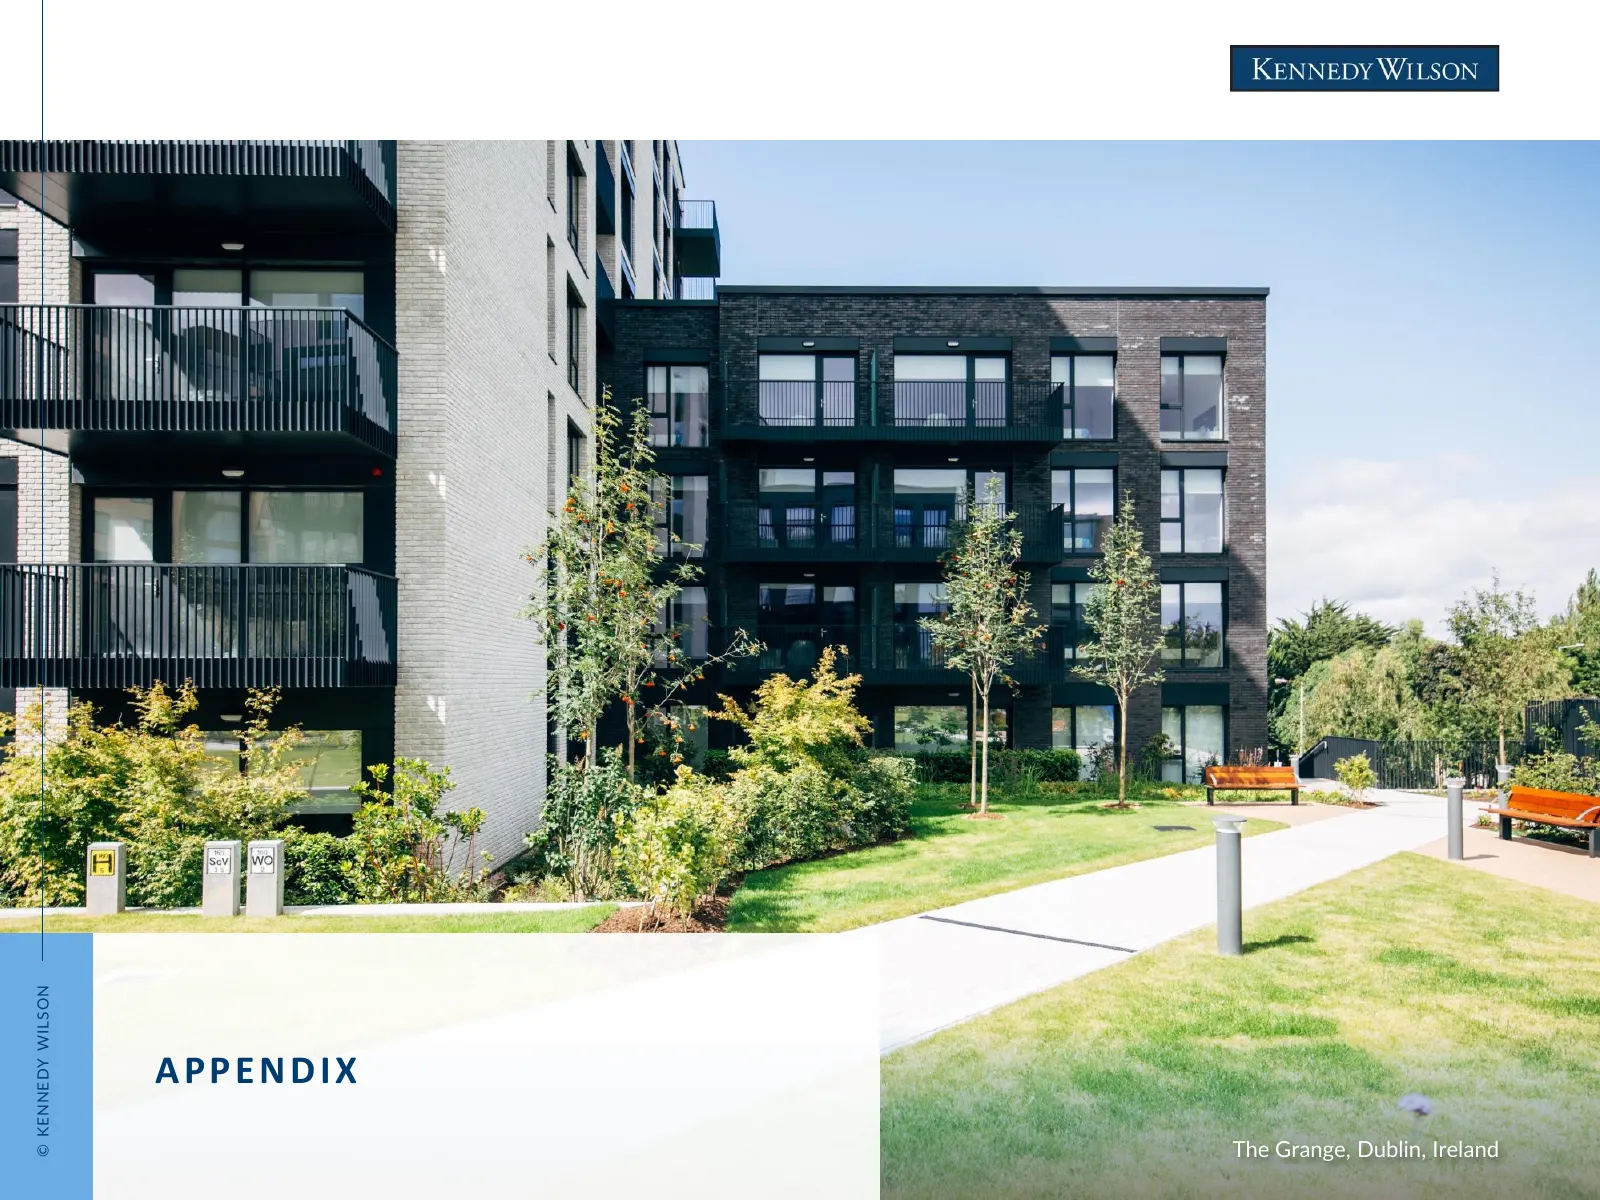
© KENNEDY WILSON APPENDIX The Grange, Dublin, Ireland
Slide 26: Estimated Annual NOI Reconciliation to GAAP NOI
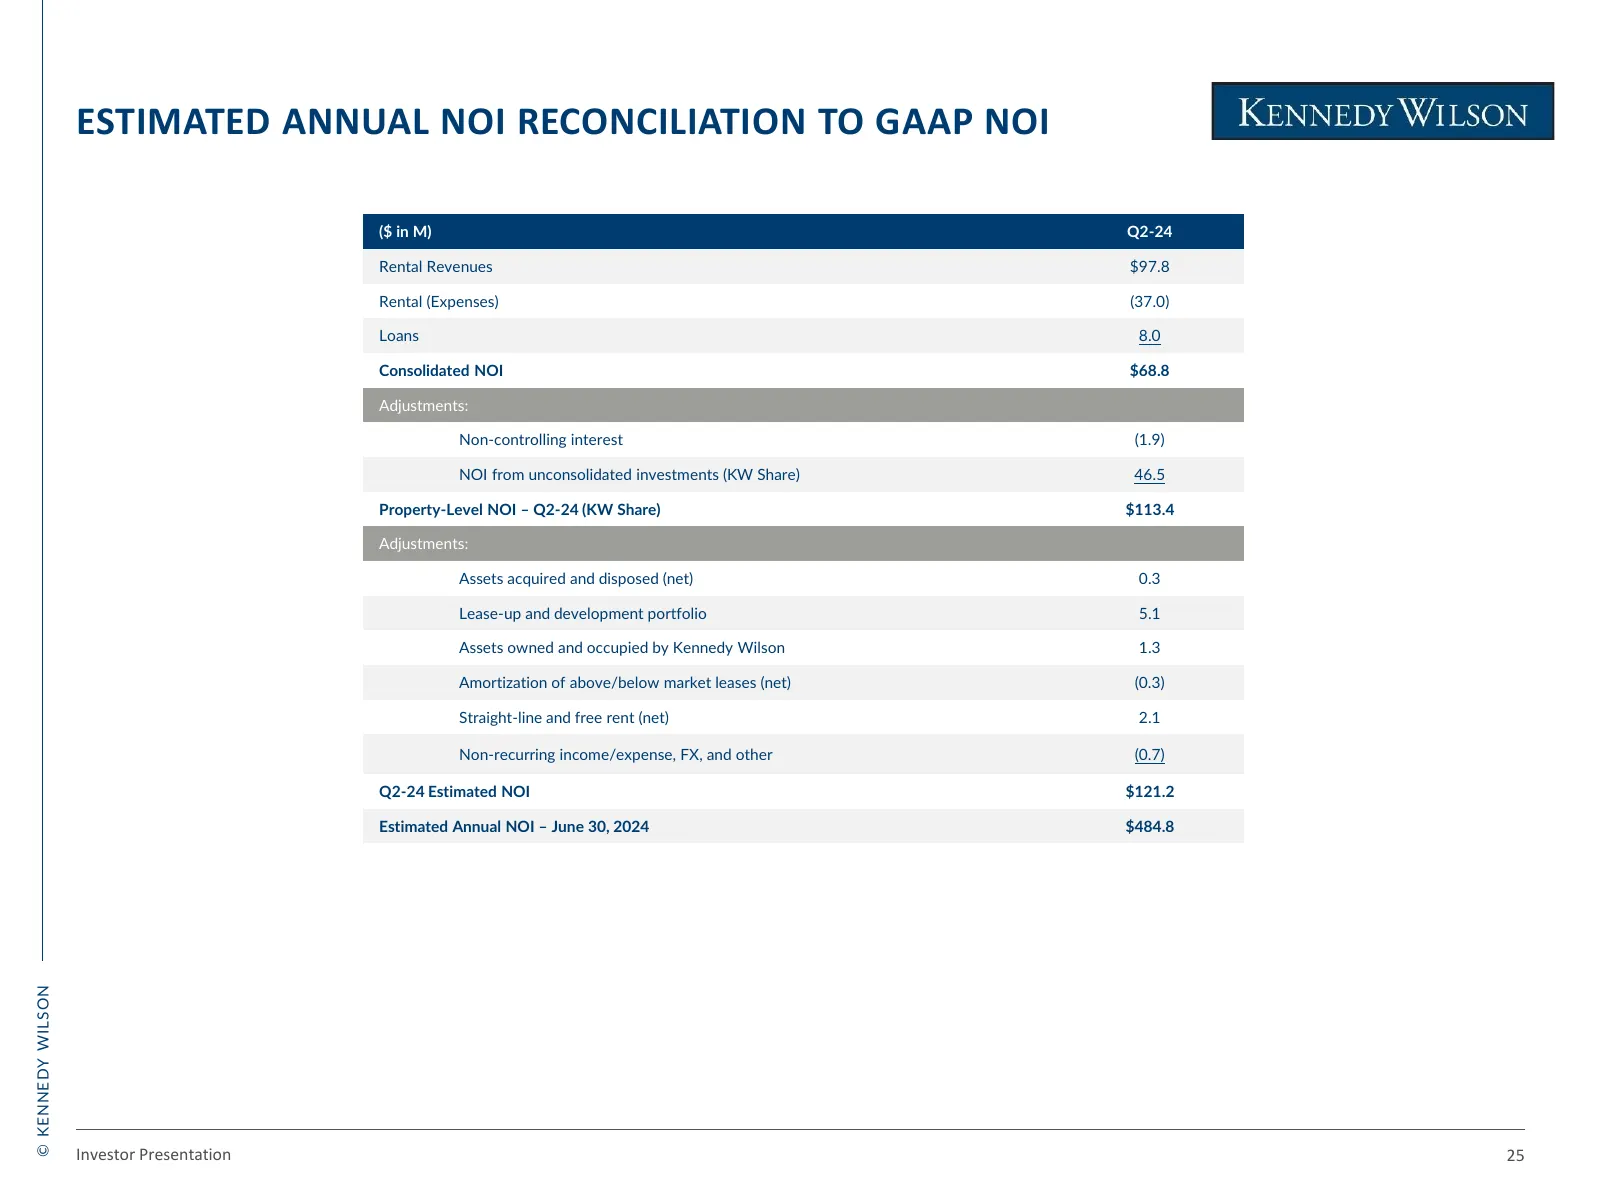
ESTIMATED ANNUAL NOI RECONCILIATION TO GAAP NOI ($ in M) Q2-24 Rental Revenues $97.8 Rental (Expenses) (37.0) Loans 8.0 Consolidated NOI $68.8 Adjustments: Non-controlling interest (1.9) NOI from unconsolidated investments (KW Share) 46.5 Property-Level NOI – Q2-24 (KW Share) $113.4 Adjustments: Ass
Slide 27: Definitions
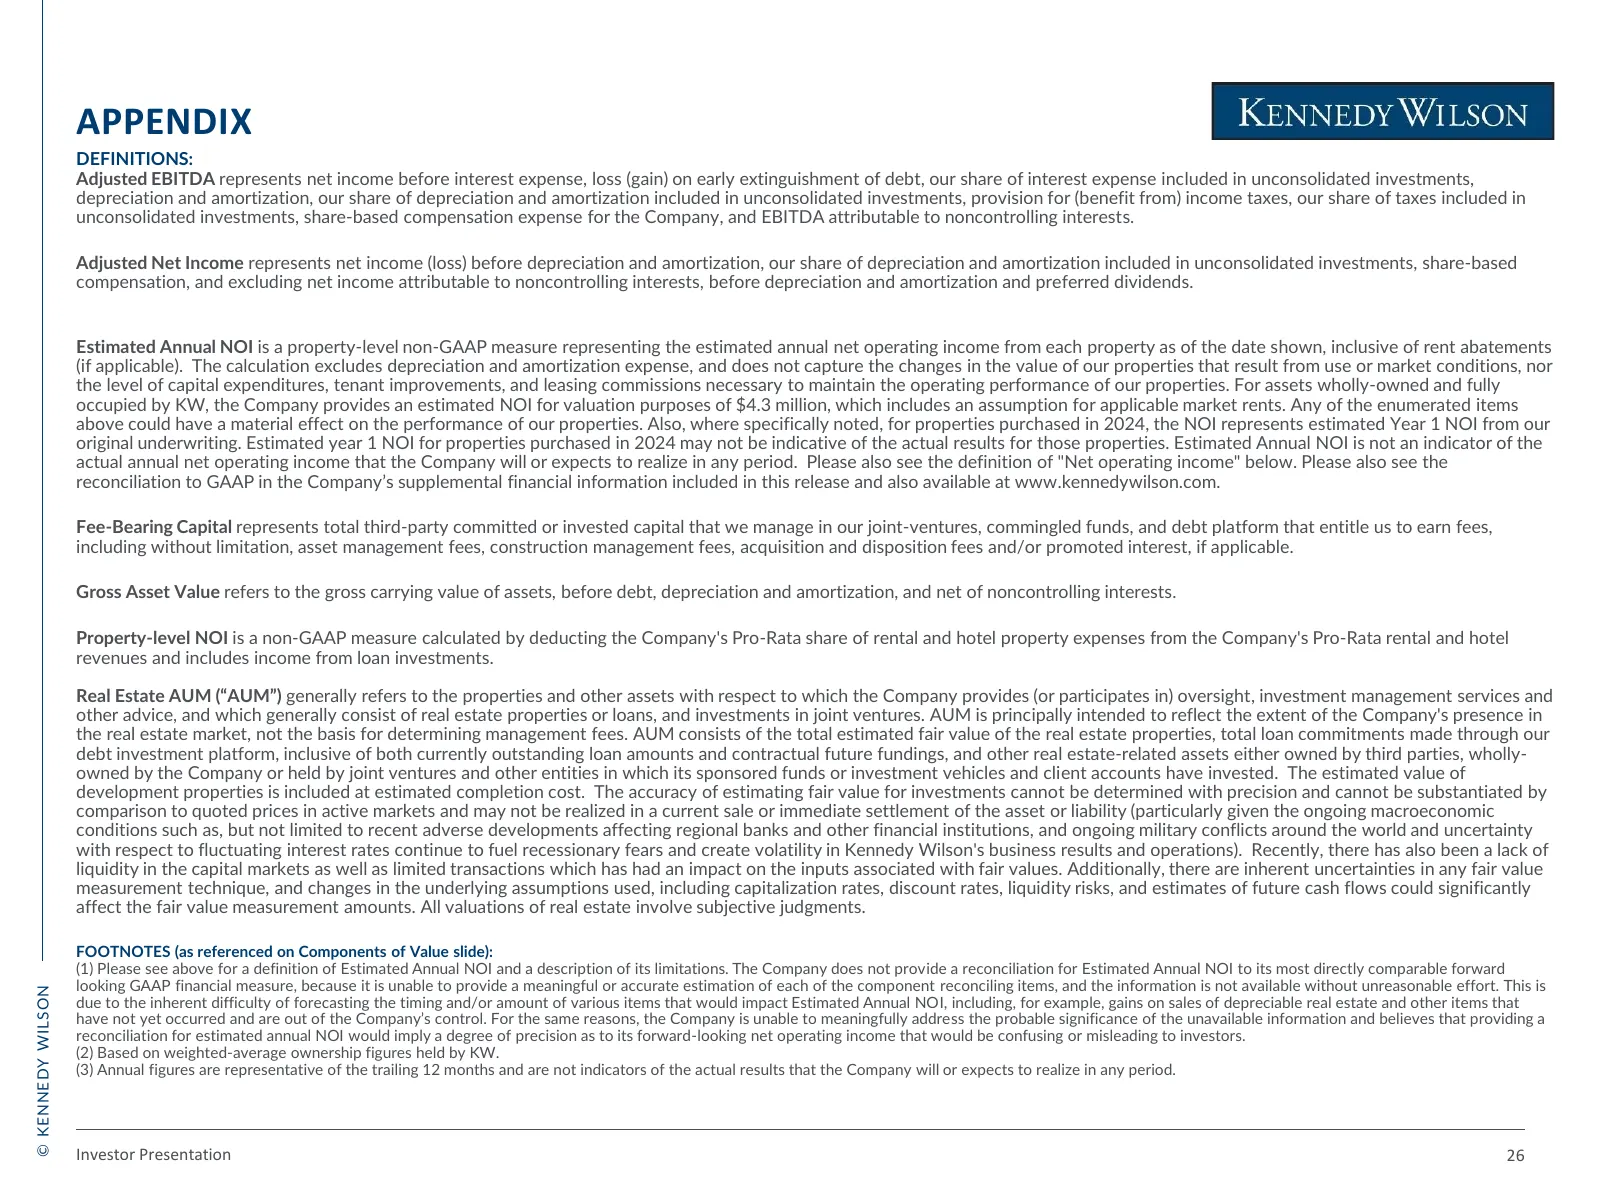
APPENDIX DEFINITIONS: Adjusted EBITDA represents net income before interest expense, loss (gain) on early extinguishment of debt, our share of interest expense included in unconsolidated investments, depreciation and amortization, our share of depreciation and amortization included in unconsolidated
Source: company website
More decks from Kennedy-Wilson Holdings Inc.
 Q3 2025 Earnings Presentation39 slides · November 2025
 Q2 2025 Earnings Presentation35 slides · August 2025
 Q1 2025 Earnings Presentation34 slides · May 8, 2025
 Q4 2024 Earnings Presentation33 slides · Feb 27, 2025
 Q3 2024 Earnings Presentation36 slides · Nov 7, 2024
 Q2 2024 Earnings Presentation37 slides · August 2024