Kennedy-Wilson Holdings Inc. · NYSE:KW
Kennedy-Wilson — Q2 2024 Earnings Presentation
37 slides from Kennedy-Wilson's earnings presentation, August 2024
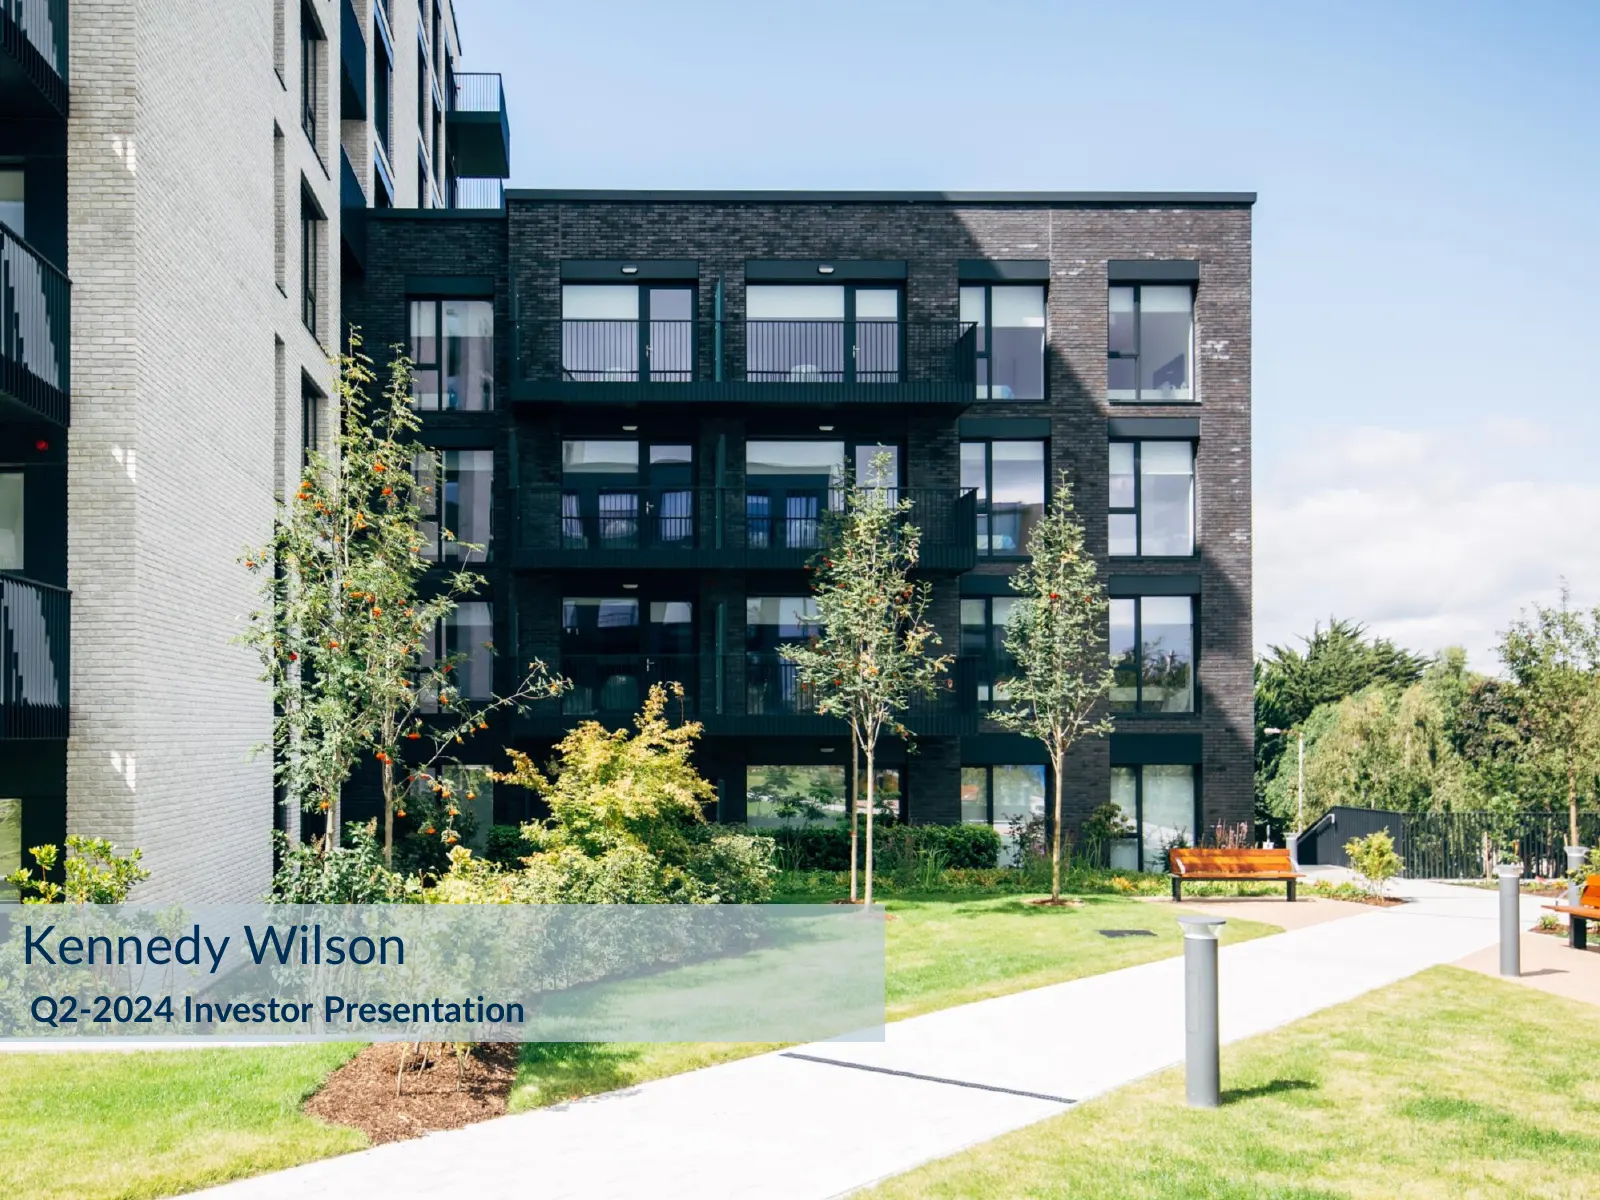
Slide 1: Q2-2024 Investor Presentation
Kennedy Wilson Q2-2024 Investor Presentation
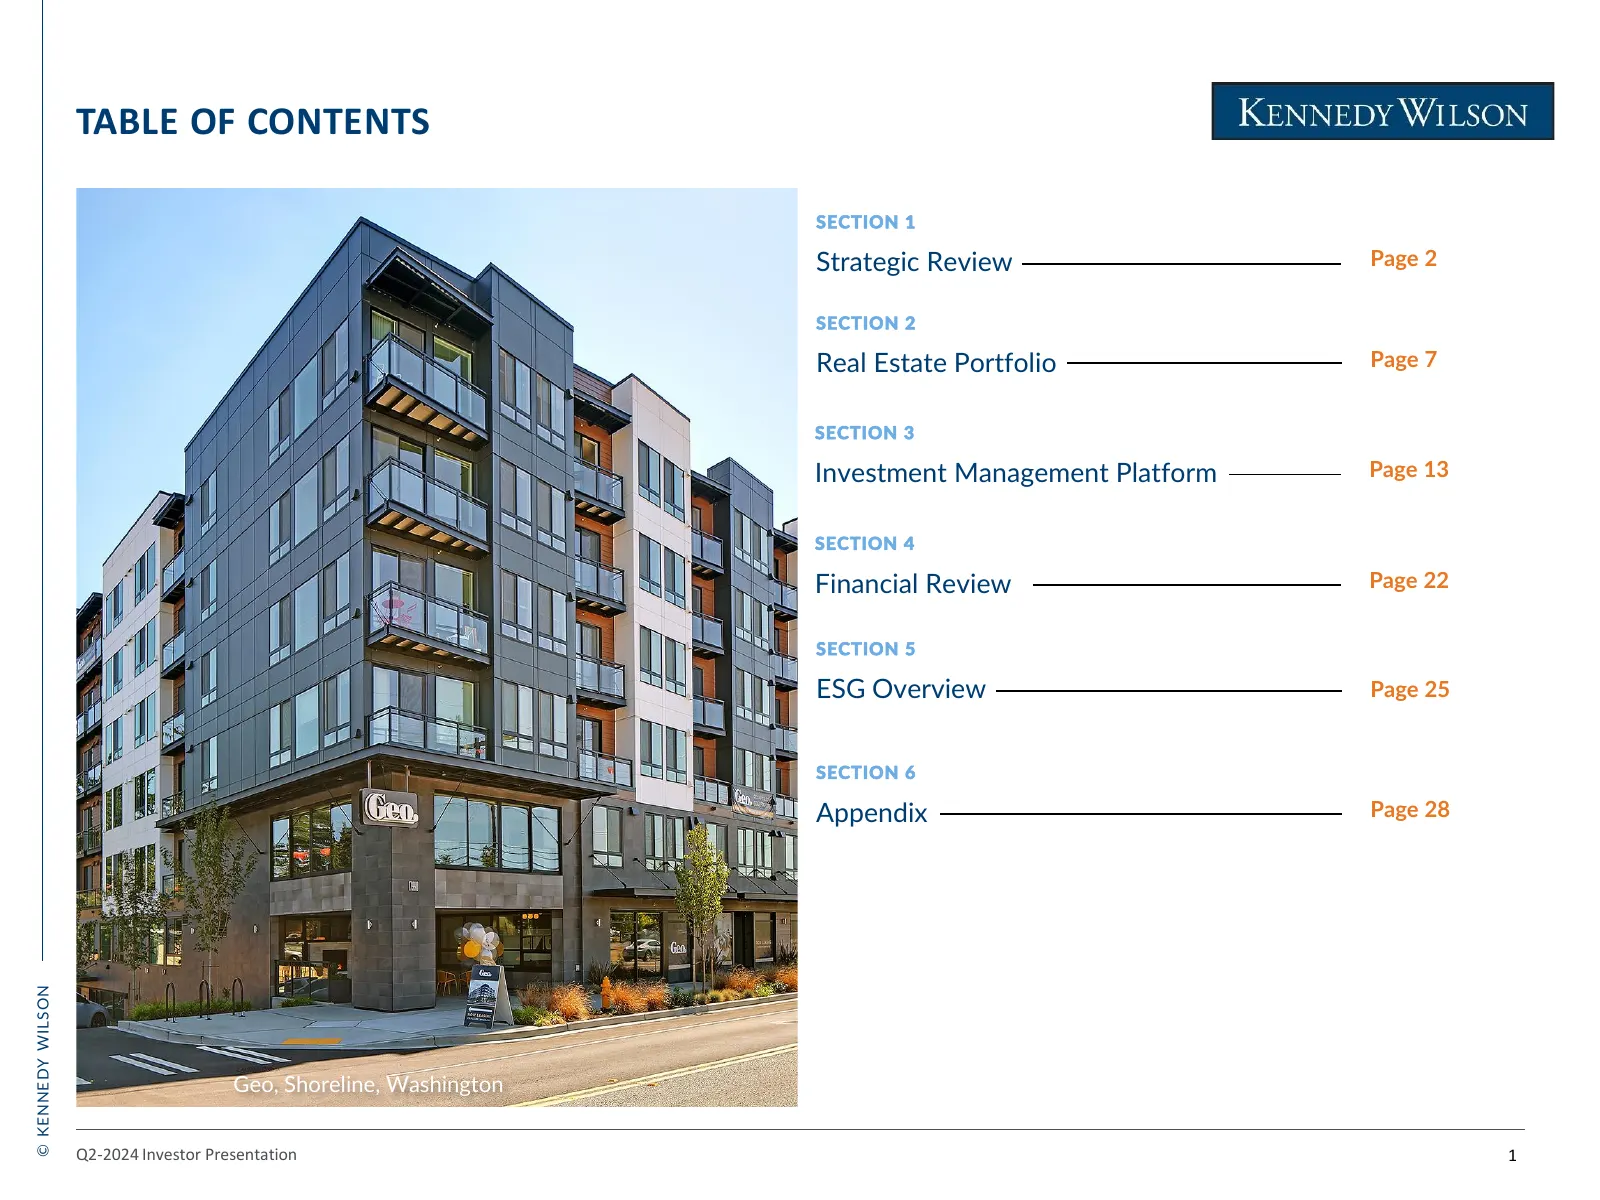
Slide 2: Table of Contents
TABLE OF CONTENTS SECTION 1 Strategic Review Page 2 SECTION 2 Real Estate Portfolio Page 7 SECTION 3 Investment Management Platform Page 13 SECTION 4 Financial Review Page 22 SECTION 5 ESG Overview Page 25 SECTION 6 Appendix Page 28 © KENNEDY WILSON Geo, Shoreline, Washington Q2-2024 Investor Presen
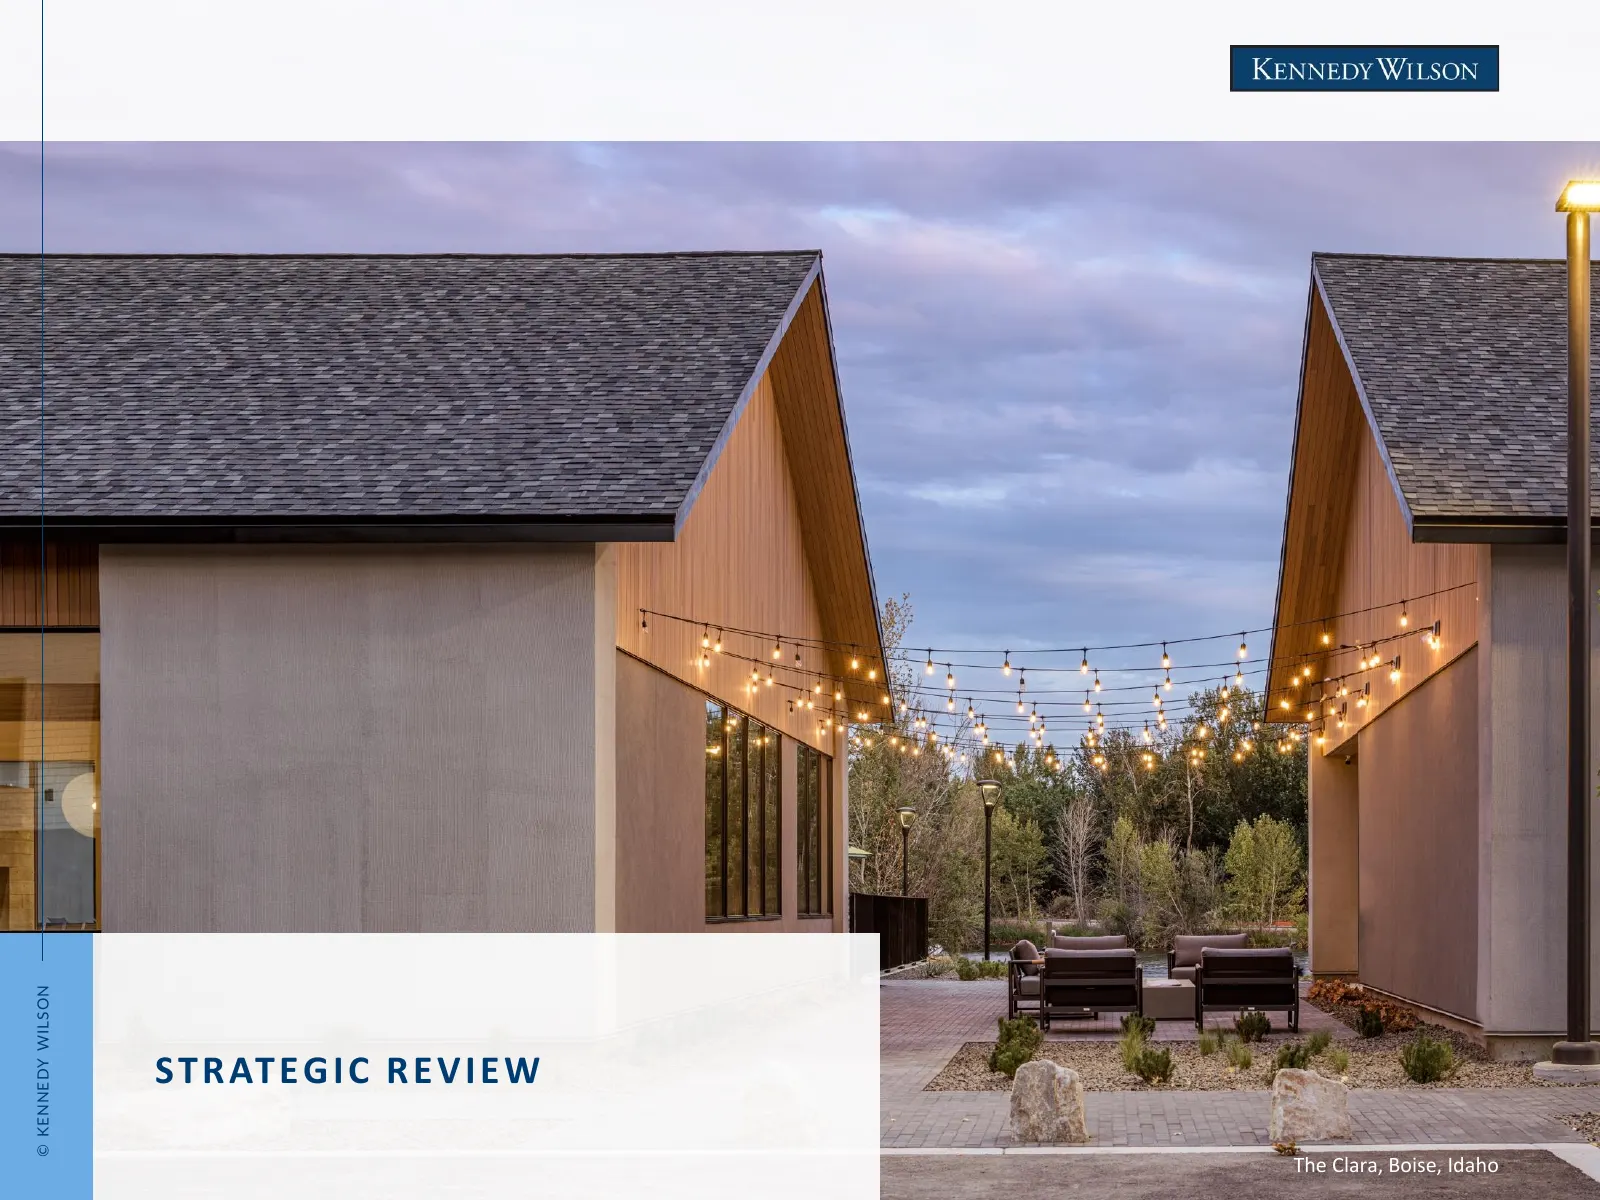
Slide 3: Strategic Review
© KENNEDY WILSON S T R AT EG I C R E V I E W The Clara, Boise, Idaho
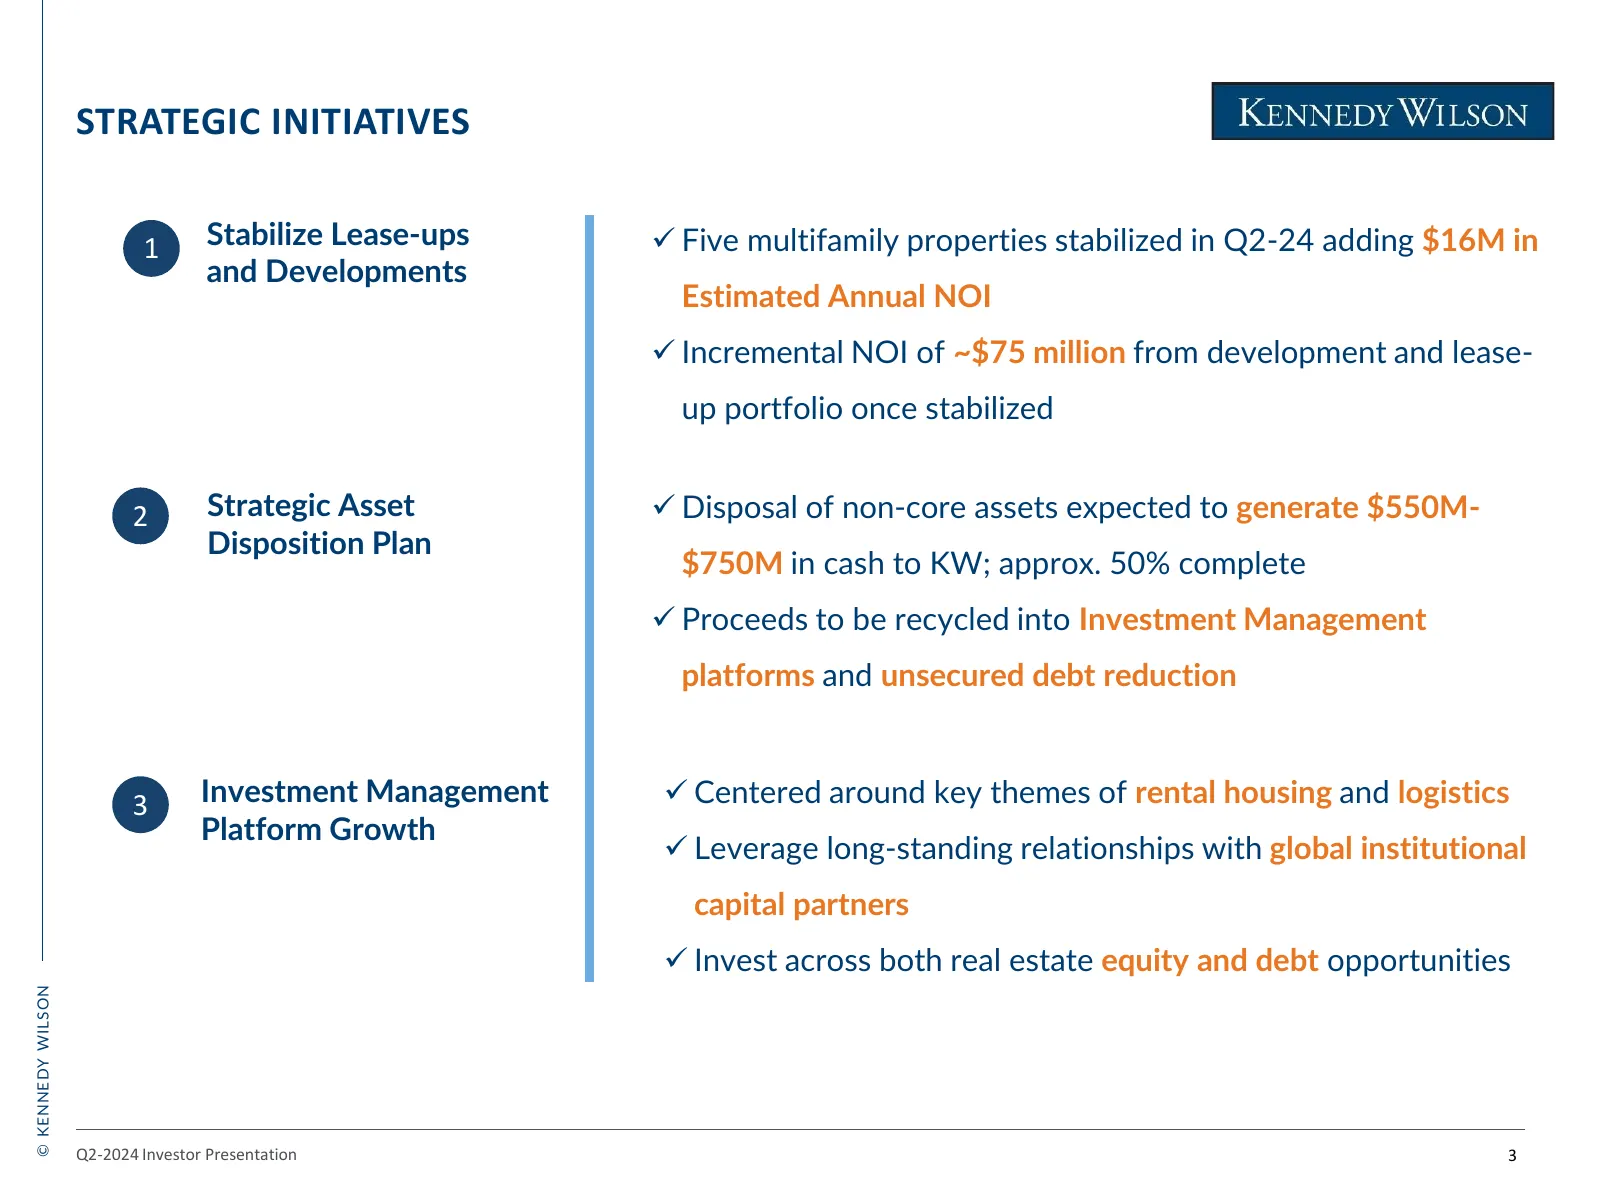
Slide 4: Strategic Initiatives
STRATEGIC INITIATIVES 1 Stabilize Lease-ups ✓ Five multifamily properties stabilized in Q2-24 adding $16M in and Developments Estimated Annual NOI ✓ Incremental NOI of ~$75 million from development and lease- up portfolio once stabilized 2 Strategic Asset ✓ Disposal of non-core assets expected to ge
Slide 5: Kennedy Wilson at a Glance
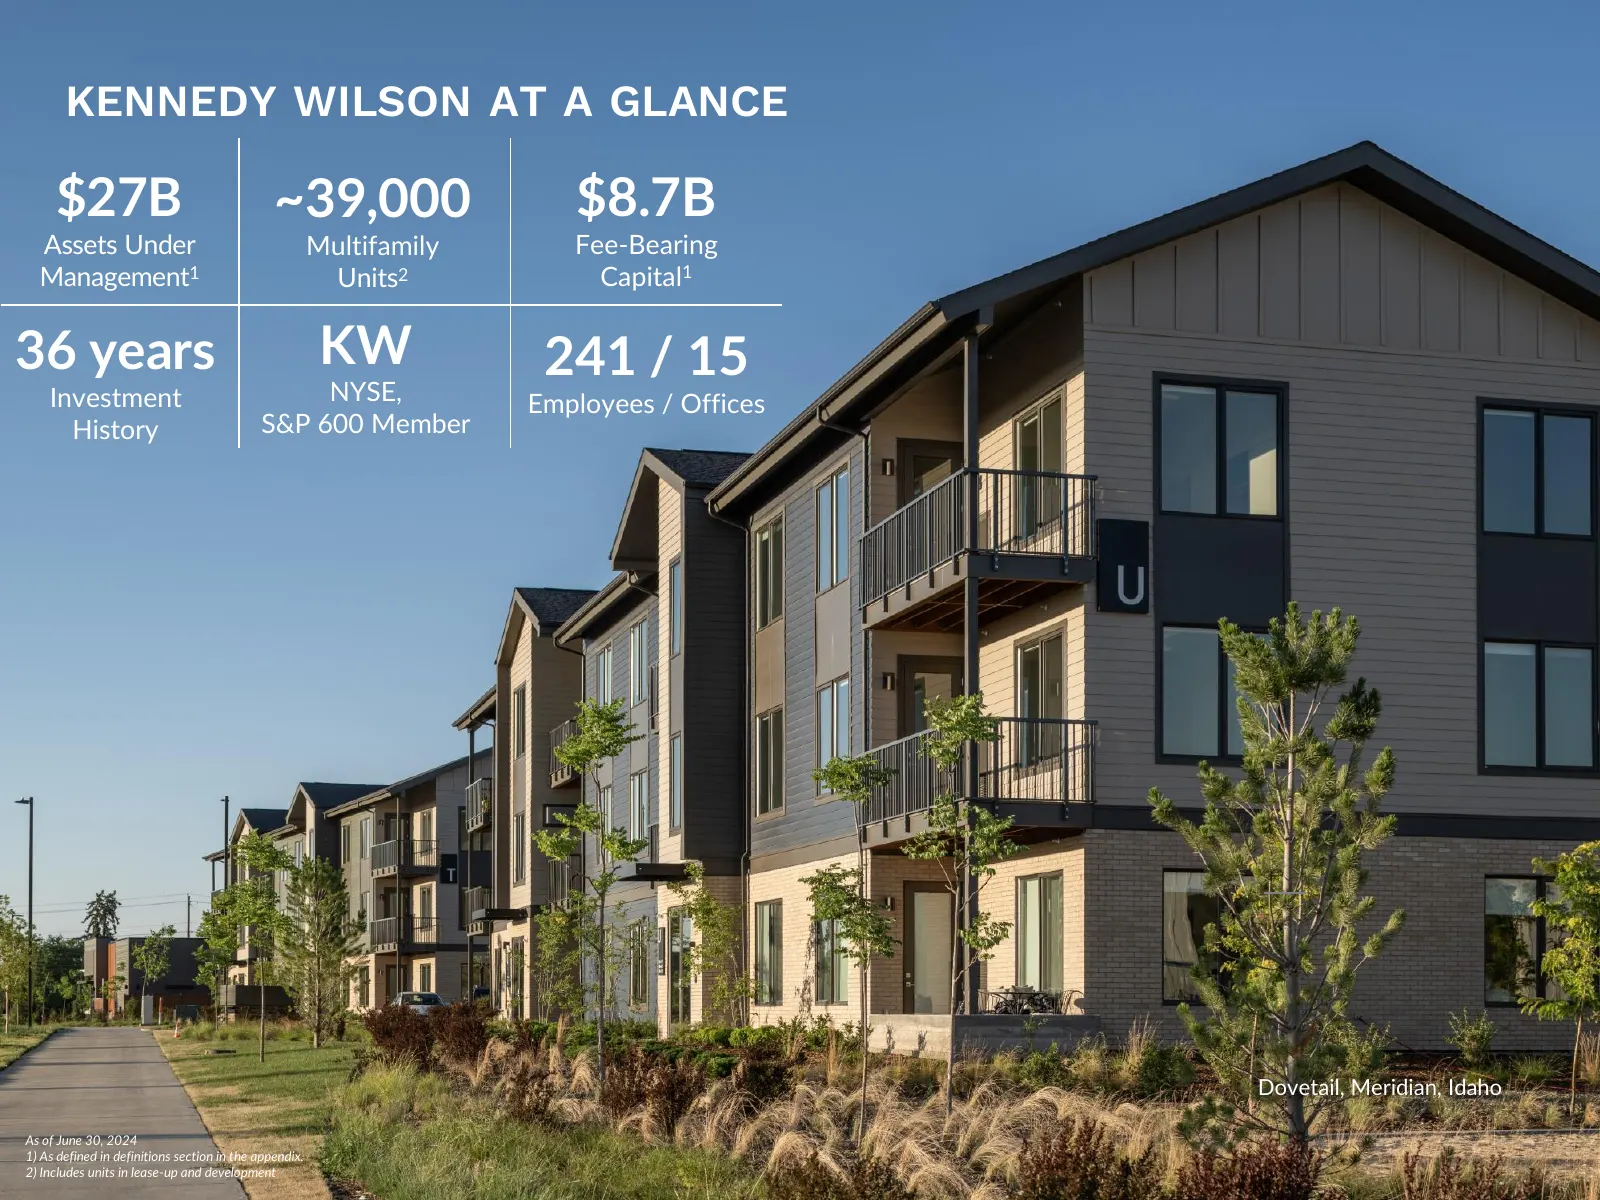
KENNEDY WILSON AT A GLANCE $27B ~39,000 $8.7B Assets Under Multifamily Fee-Bearing Management1 Units2 Capital1 36 years KW 241 / 15 Investment NYSE, Employees / Offices History S&P 600 Member © KENNEDY WILSON Dovetail, Meridian, Idaho As of June 30, 2024 Q2-2024 1) As defined Investor in definitions
Slide 6: A Simplified Kennedy Wilson
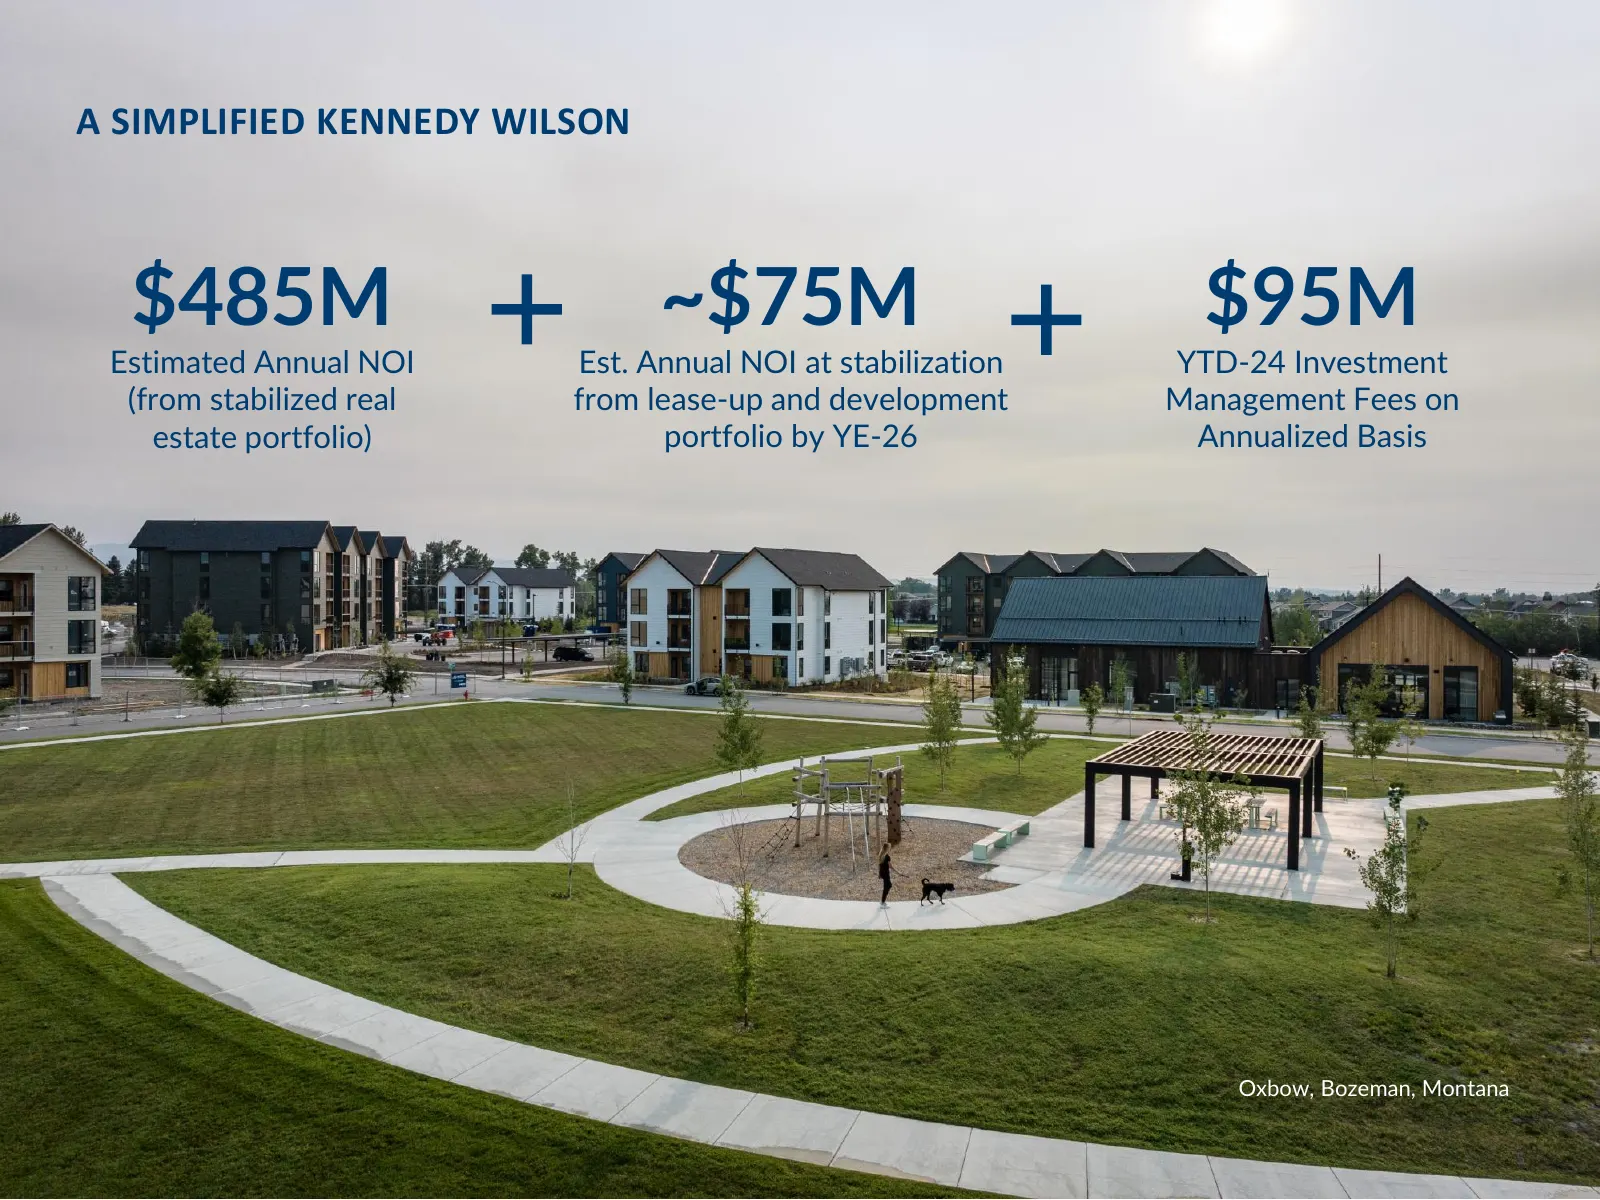
A SIMPLIFIED KENNEDY WILSON $485M ~$75M $95M Estimated Annual NOI Est. Annual NOI at stabilization YTD-24 Investment (from stabilized real from lease-up and development Management Fees on estate portfolio) portfolio by YE-26 Annualized Basis © KENNEDY WILSON Oxbow, Bozeman, Montana Q2-2024 Investor
Slide 7: The Kennedy Wilson Advantage
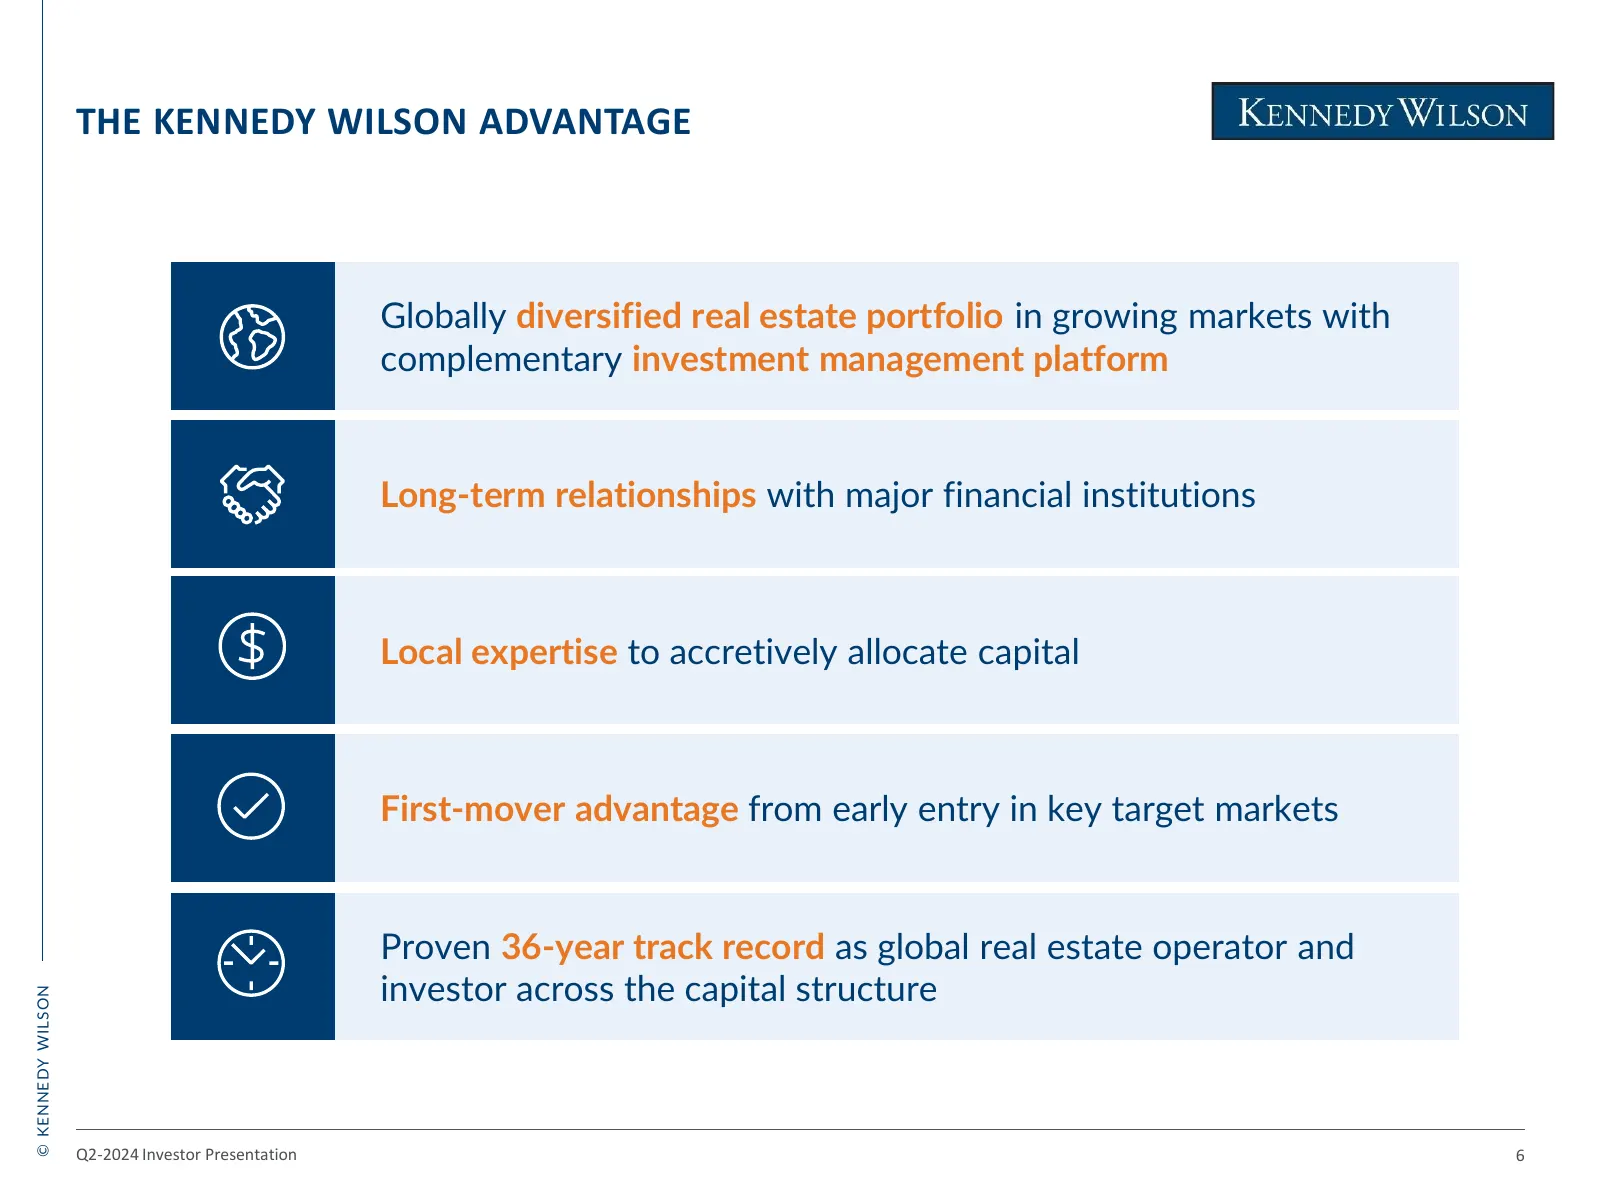
THE KENNEDY WILSON ADVANTAGE Globally diversified real estate portfolio in growing markets with complementary investment management platform Long-term relationships with major financial institutions Local expertise to accretively allocate capital First-mover advantage from early entry in key target
Slide 8: Real Estate Portfolio
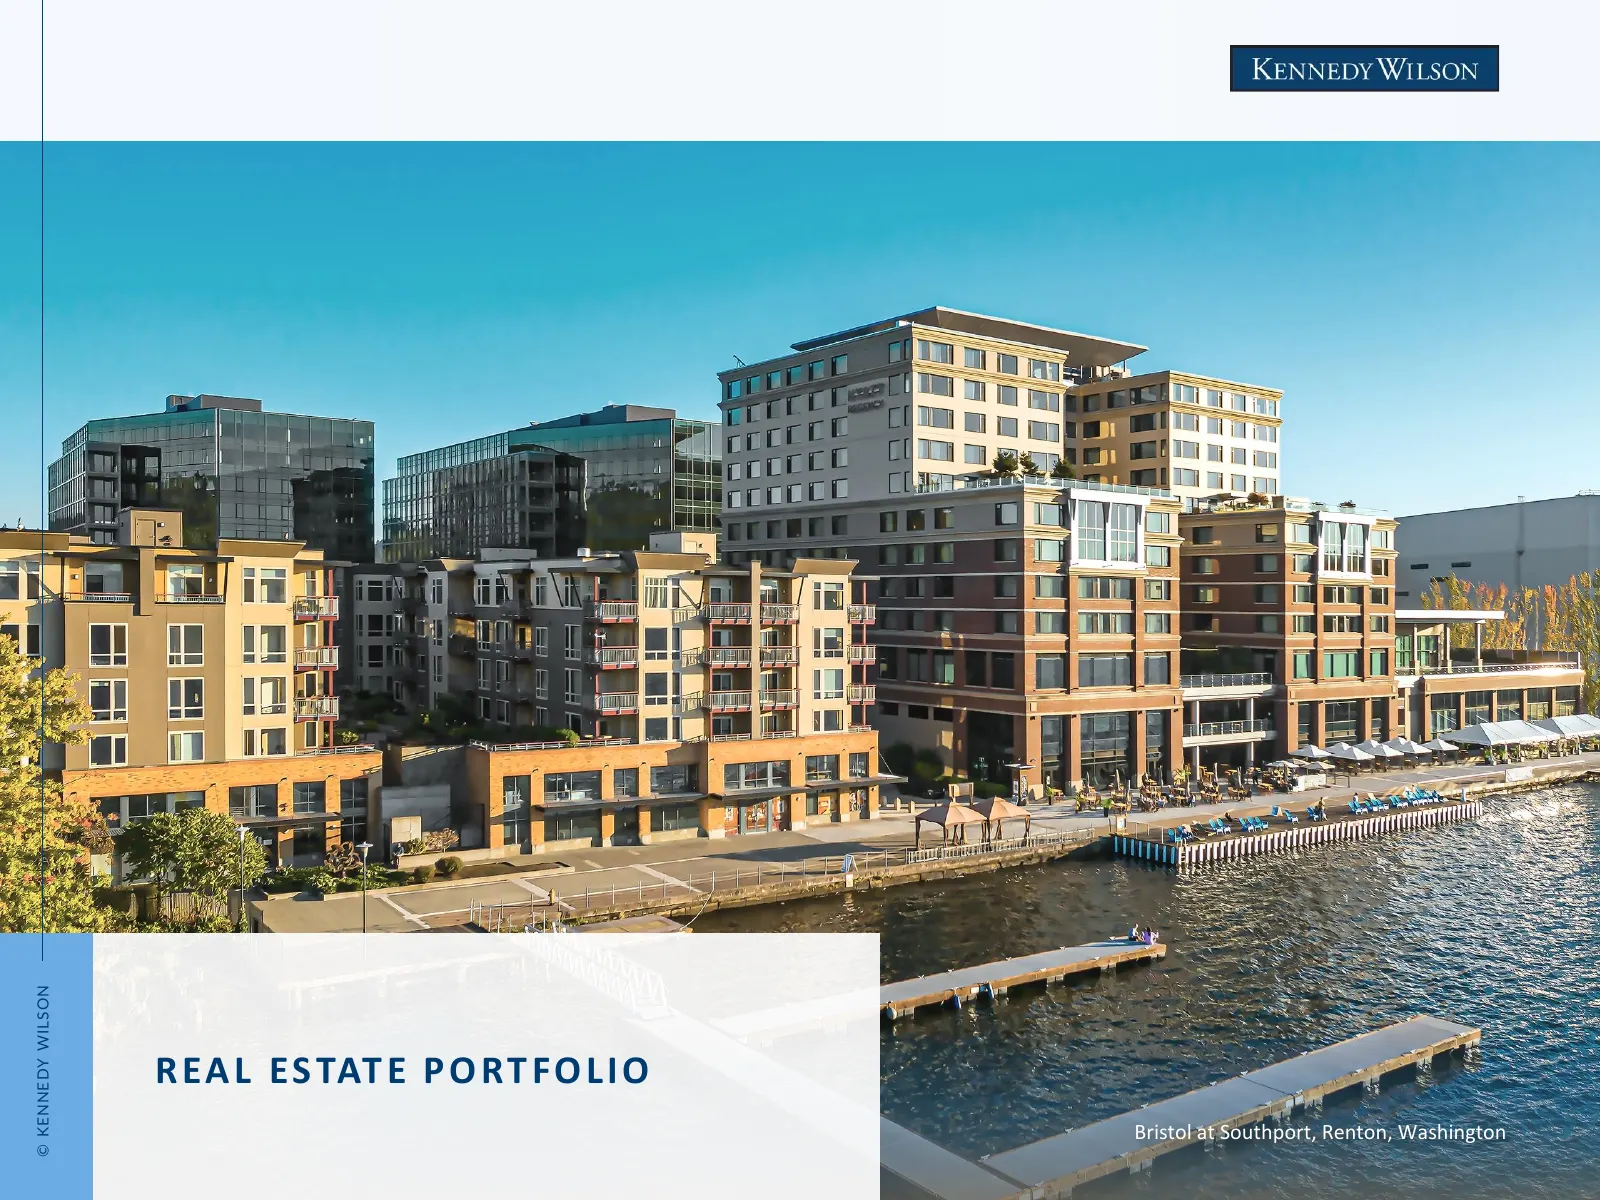
© KENNEDY WILSON R EA L E S TAT E P O R T F O L I O Bristol at Southport, Renton, Washington
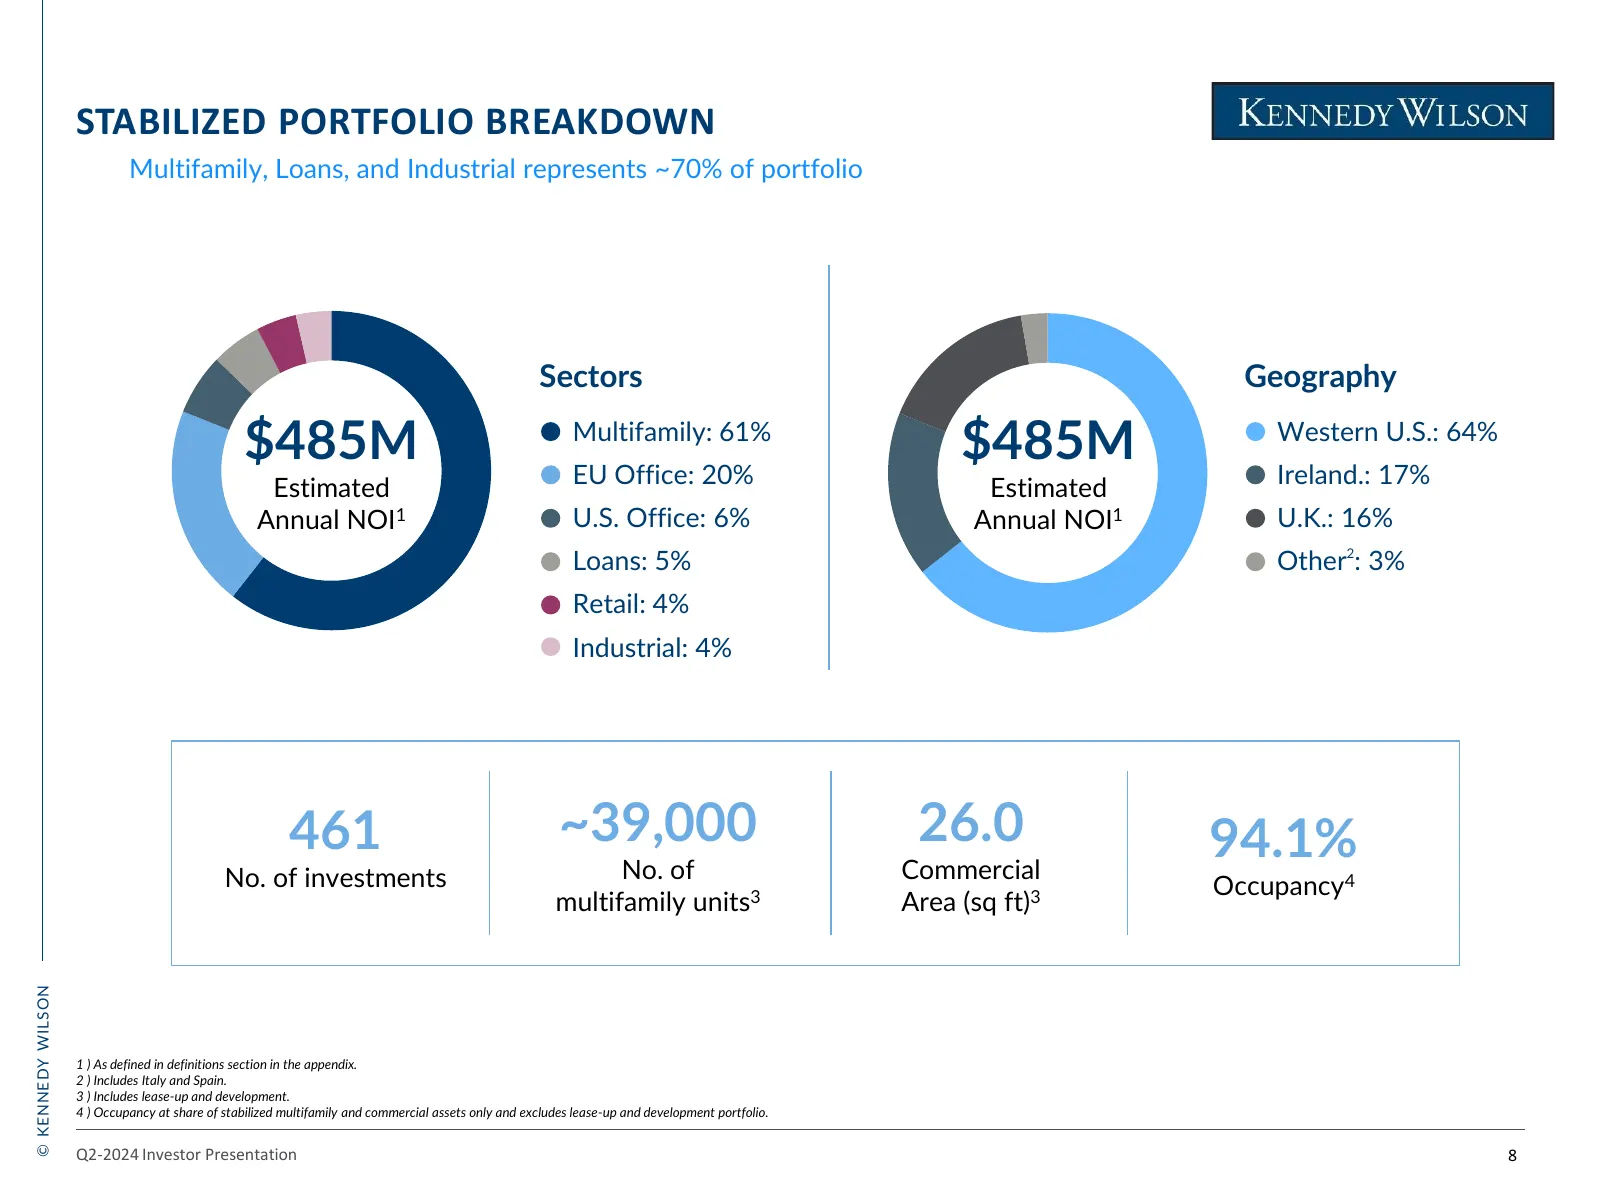
Slide 9: Stabilized Portfolio Breakdown
STABILIZED PORTFOLIO BREAKDOWN Multifamily, Loans, and Industrial represents ~70% of portfolio Sectors Geography $485M Multifamily: 61% EU Office: 20% $485M Western U.S.: 64% Ireland.: 17% Estimated Estimated Annual NOI1 U.S. Office: 6% Annual NOI1 U.K.: 16% Loans: 5% Other2: 3% Retail: 4% Industria
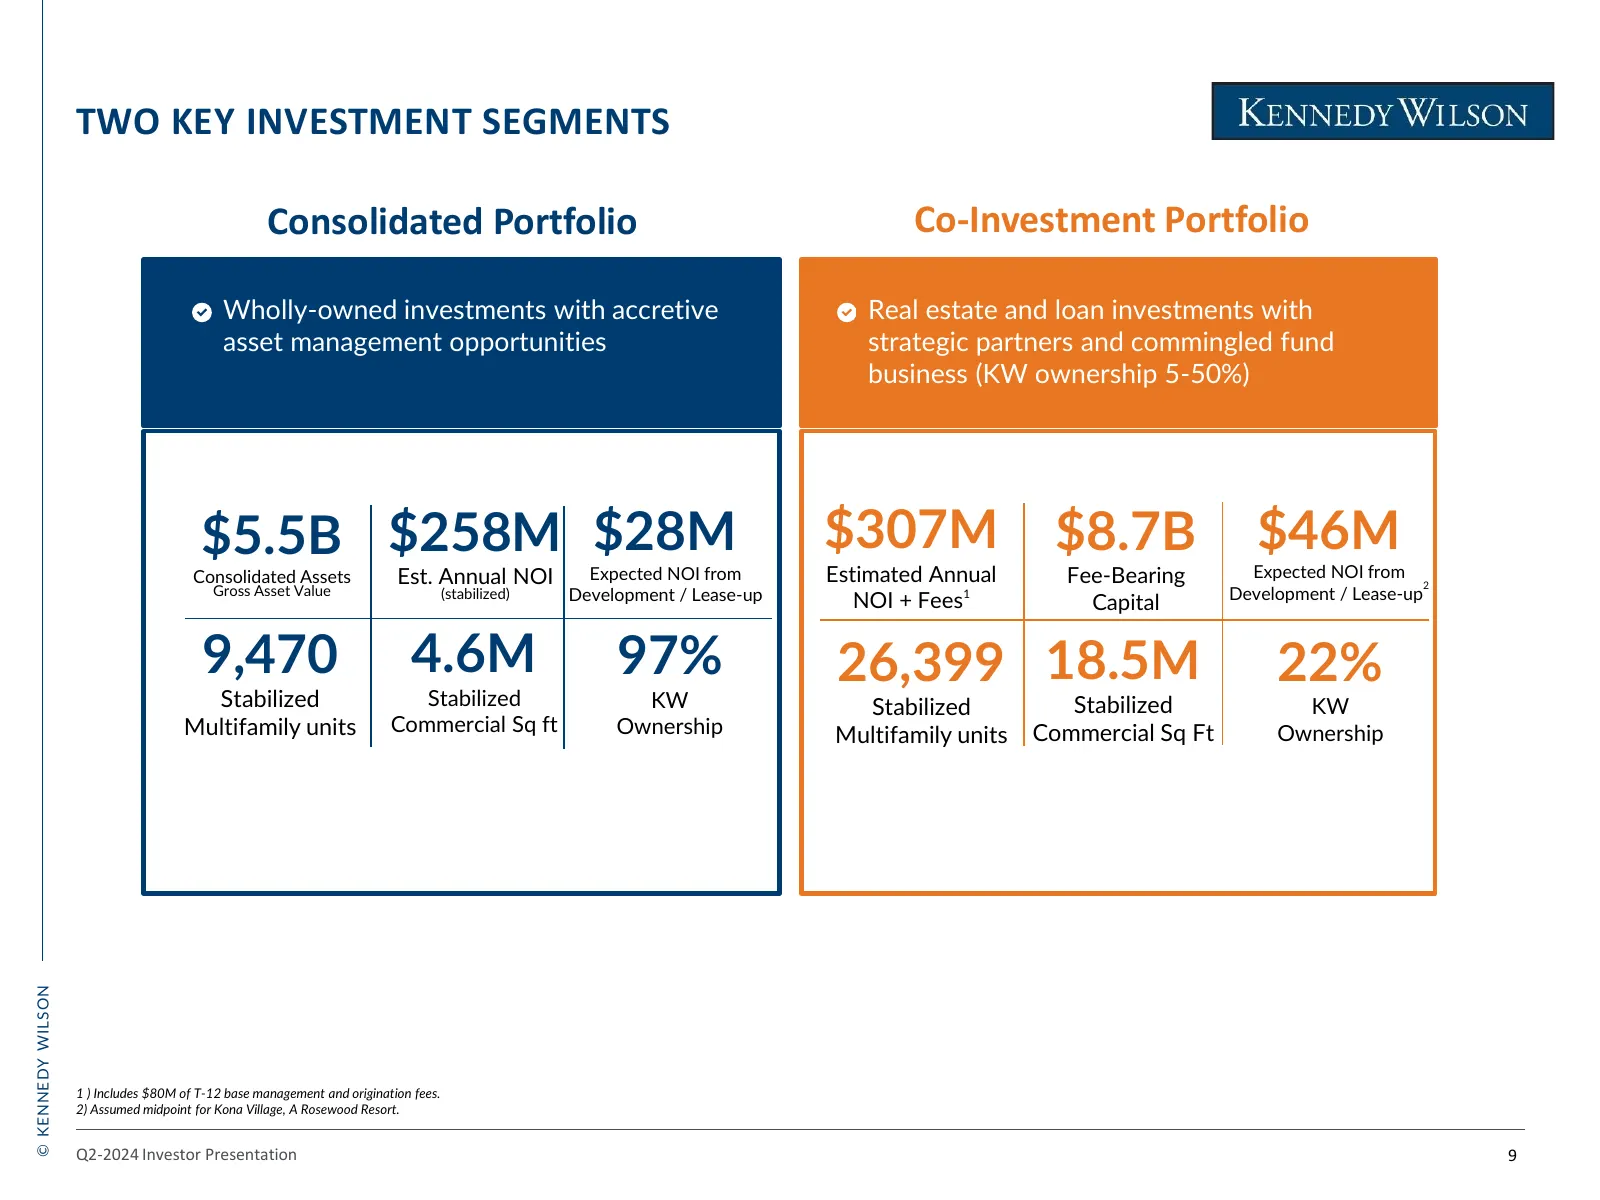
Slide 10: Two Key Investment Segments
TWO KEY INVESTMENT SEGMENTS Consolidated Portfolio Co-Investment Portfolio Wholly-owned investments with accretive Real estate and loan investments with asset management opportunities strategic partners and commingled fund business (KW ownership 5-50%) $5.5B $258M $28M $307M $8.7B $46M Consolidated
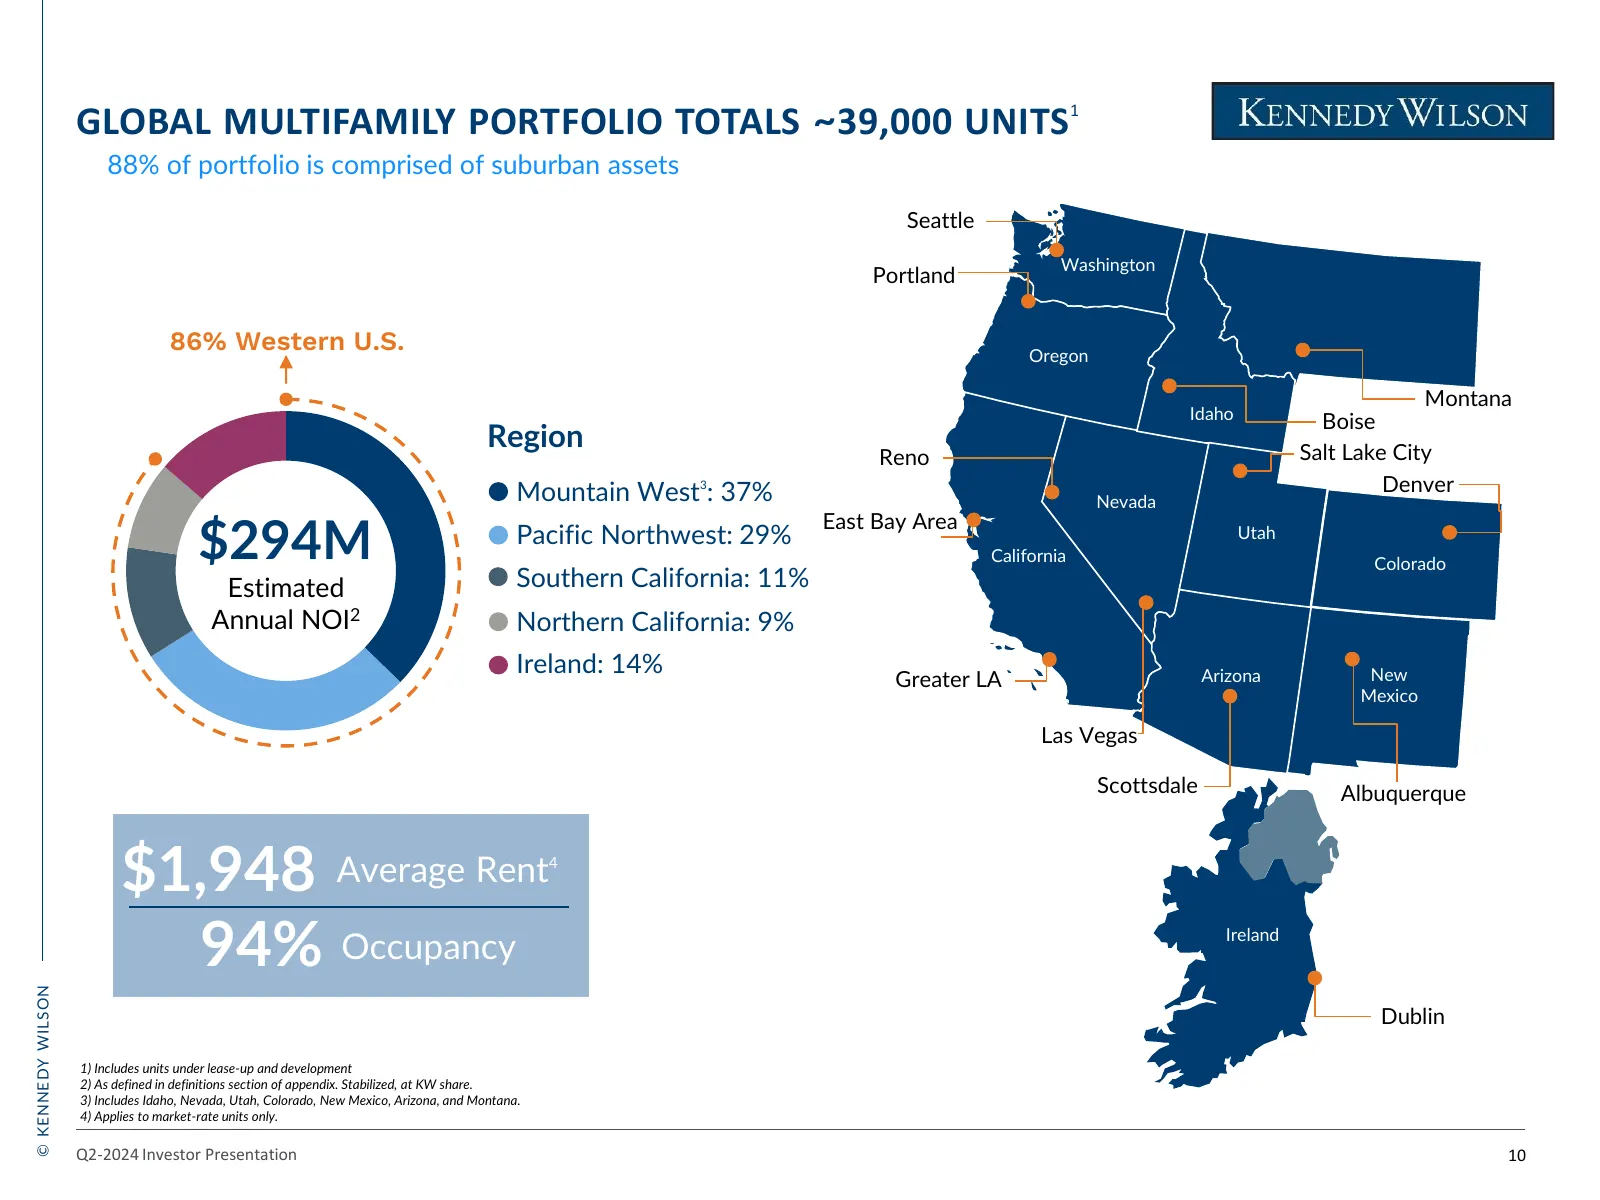
Slide 11: Global Multifamily Portfolio Totals ~39,000 Units
GLOBAL MULTIFAMILY PORTFOLIO TOTALS ~39,000 UNITS1 88% of portfolio is comprised of suburban assets Seattle Washington Portland 86% Western U.S. Oregon Montana Idaho Boise Region Salt Lake City Reno Mountain West : 37% 3 Denver Nevada $294M East Bay Area Pacific Northwest: 29% Utah California Colora
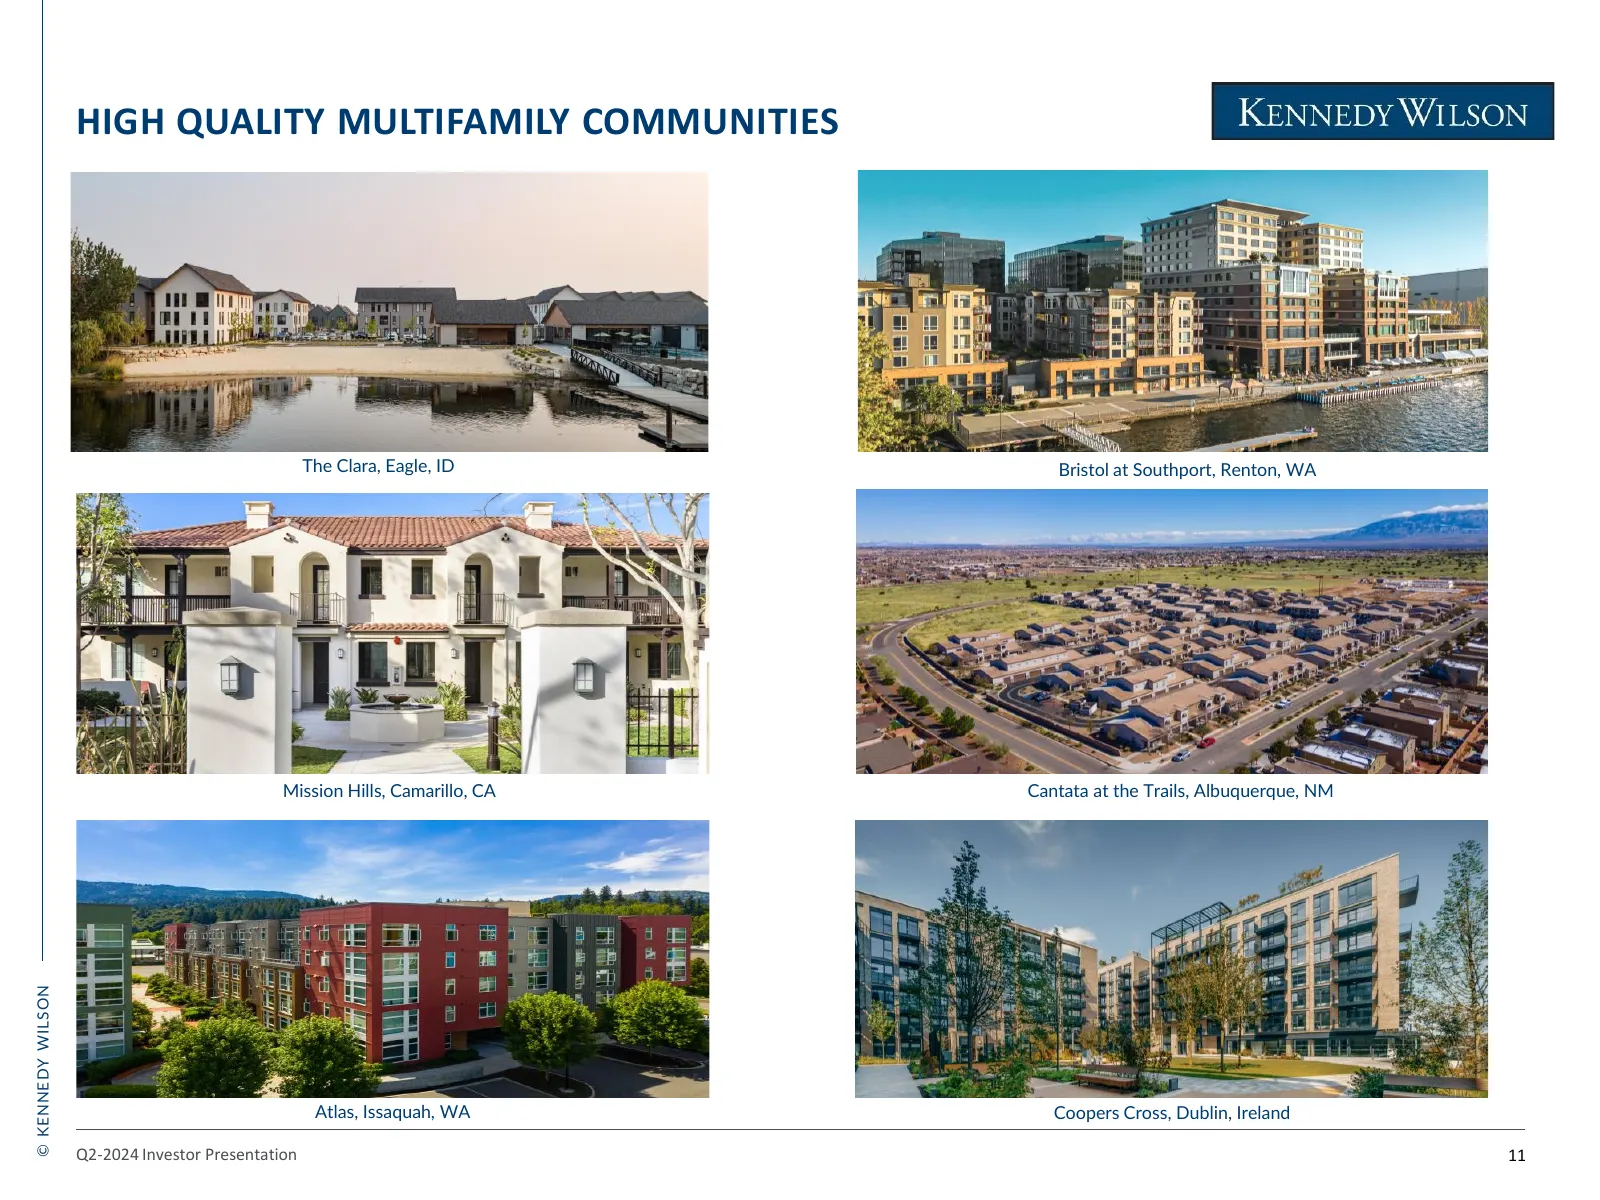
Slide 12: High Quality Multifamily Communities
HIGH QUALITY MULTIFAMILY COMMUNITIES The Clara, Eagle, ID Bristol at Southport, Renton, WA Mission Hills, Camarillo, CA Cantata at the Trails, Albuquerque, NM © KENNEDY WILSON Atlas, Issaquah, WA Coopers Cross, Dublin, Ireland Q2-2024 Investor Presentation 11
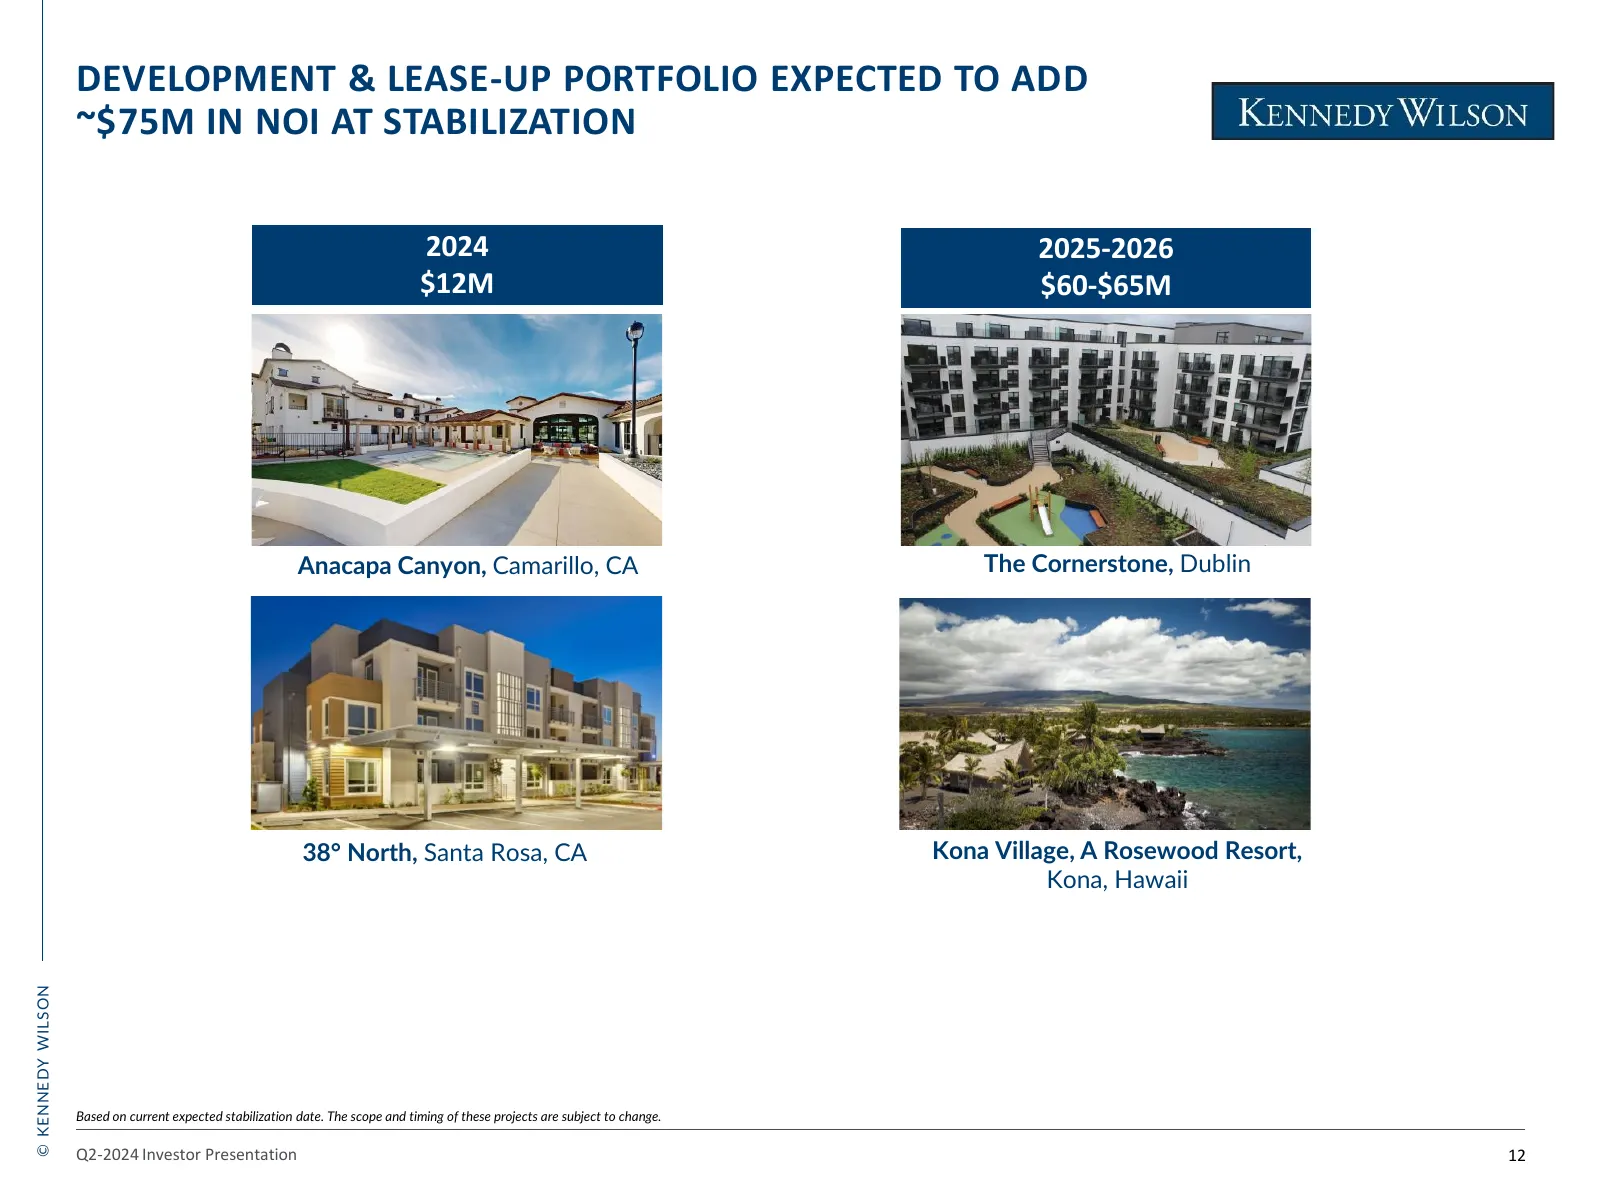
Slide 13: Development & Lease-Up Portfolio Expected to Add ~$75M in NOI
DEVELOPMENT & LEASE-UP PORTFOLIO EXPECTED TO ADD ~$75M IN NOI AT STABILIZATION 2024 2025-2026 $12M $60-$65M Anacapa Canyon, Camarillo, CA The Cornerstone, Dublin 38° North, Santa Rosa, CA Kona Village, A Rosewood Resort, Kona, Hawaii © KENNEDY WILSON Based on current expected stabilization date. The
Slide 14: Investment Management Platform
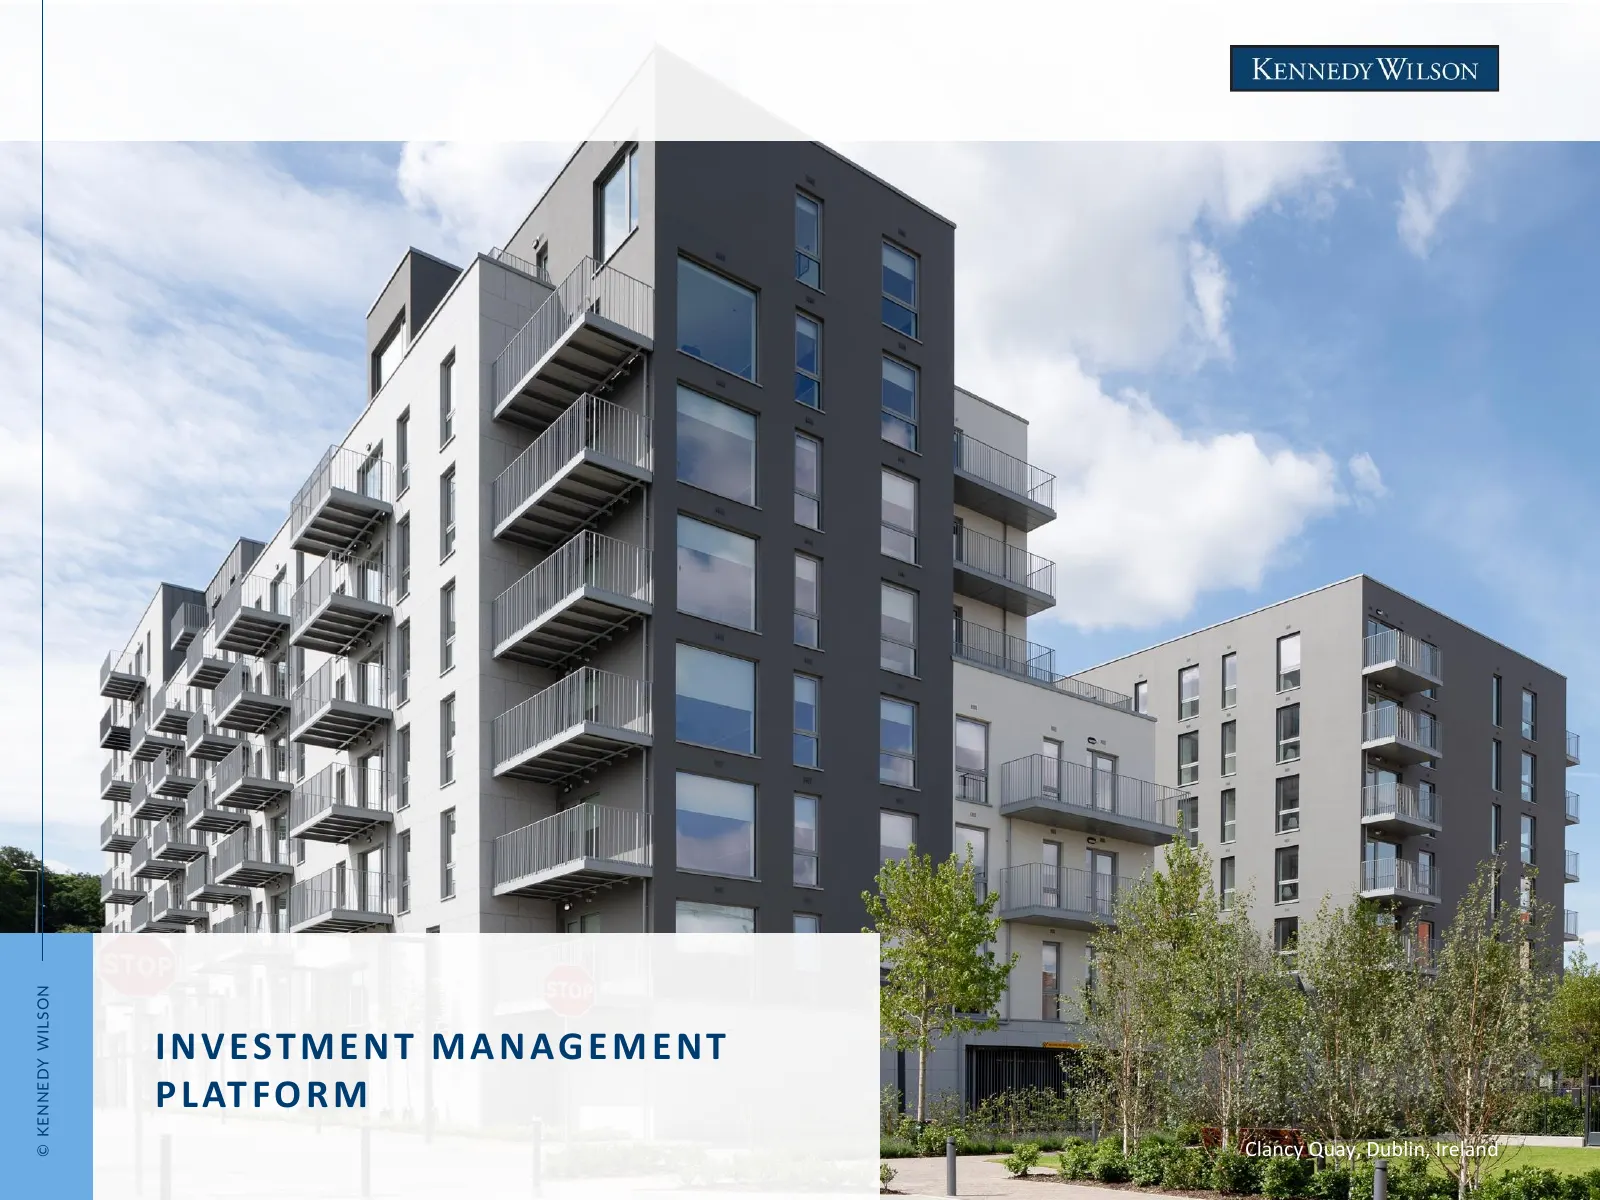
© KENNEDY WILSON I N V E ST M E N T M A N A G E M E N T P L AT F O R M Clancy Quay, Dublin, Ireland
Slide 15: Investment Management Growth Strategy Today
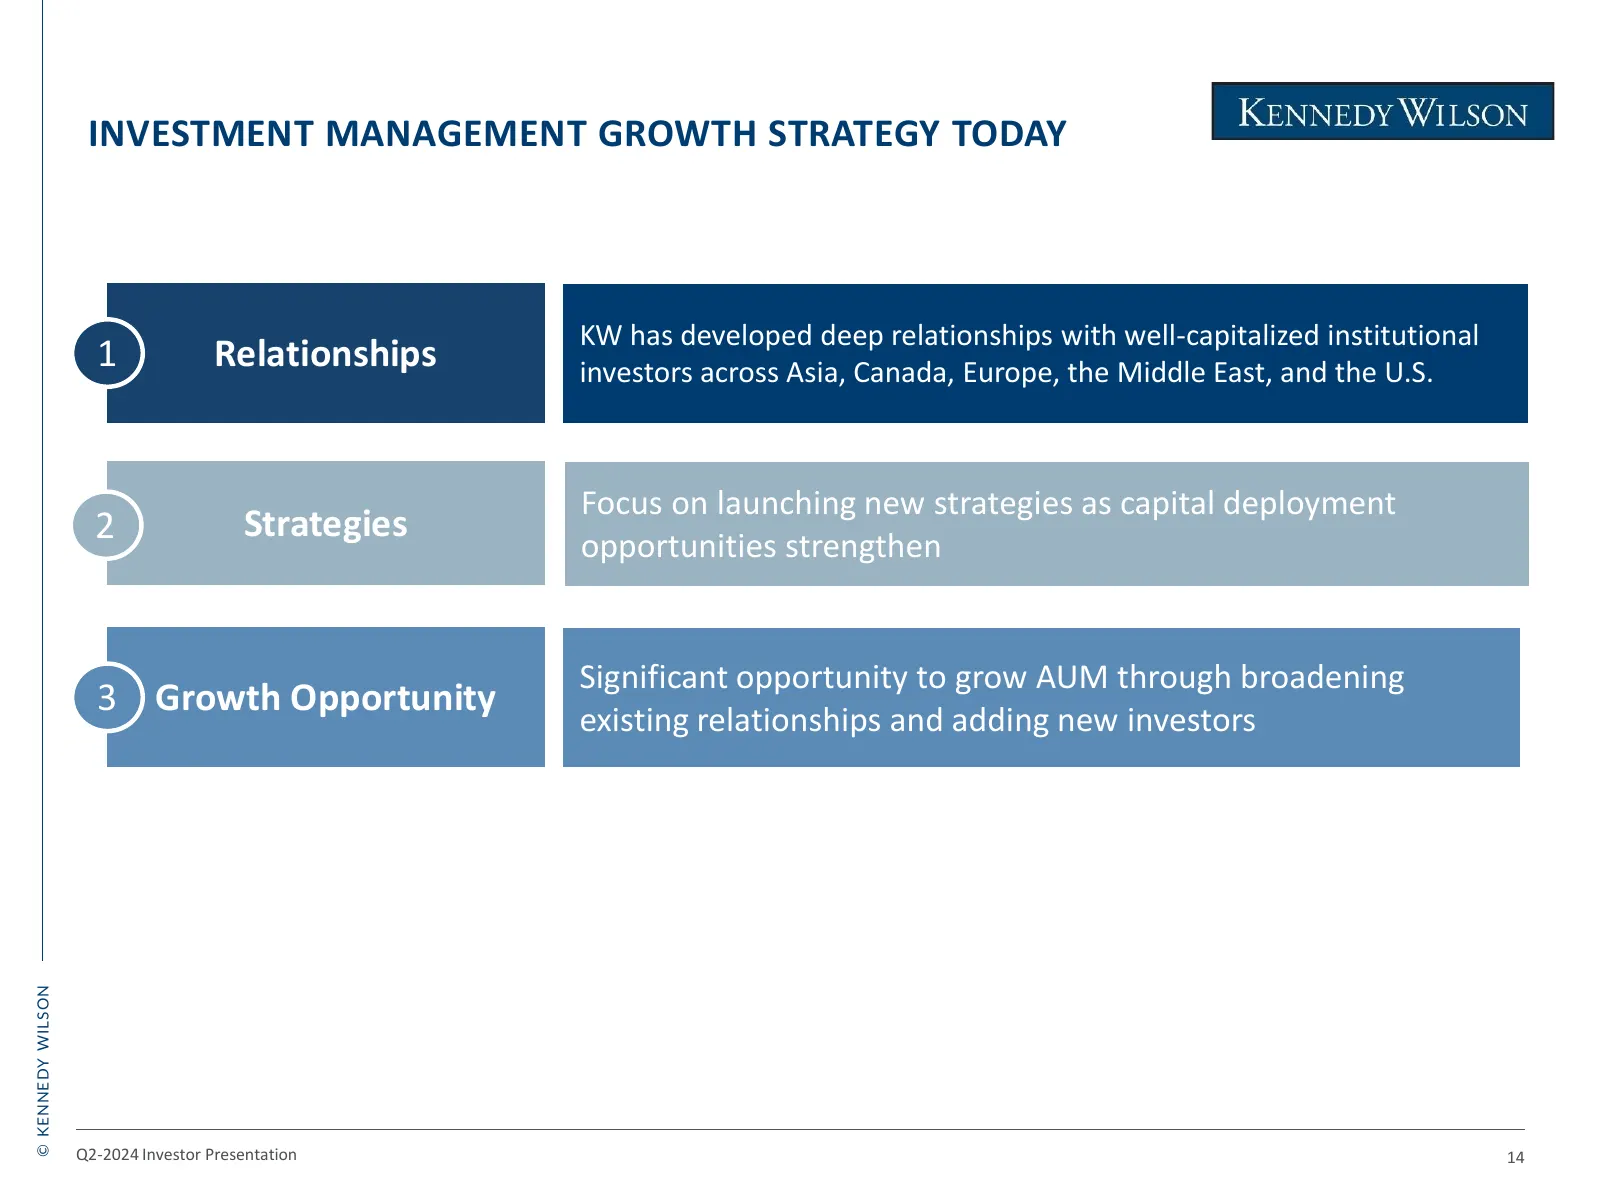
INVESTMENT MANAGEMENT GROWTH STRATEGY TODAY KW has developed deep relationships with well-capitalized institutional 1 Relationships investors across Asia, Canada, Europe, the Middle East, and the U.S. Focus on launching new strategies as capital deployment 2 Strategies opportunities strengthen Signi
Slide 16: Growing Platforms Focused on Multifamily, Credit, and Industrial
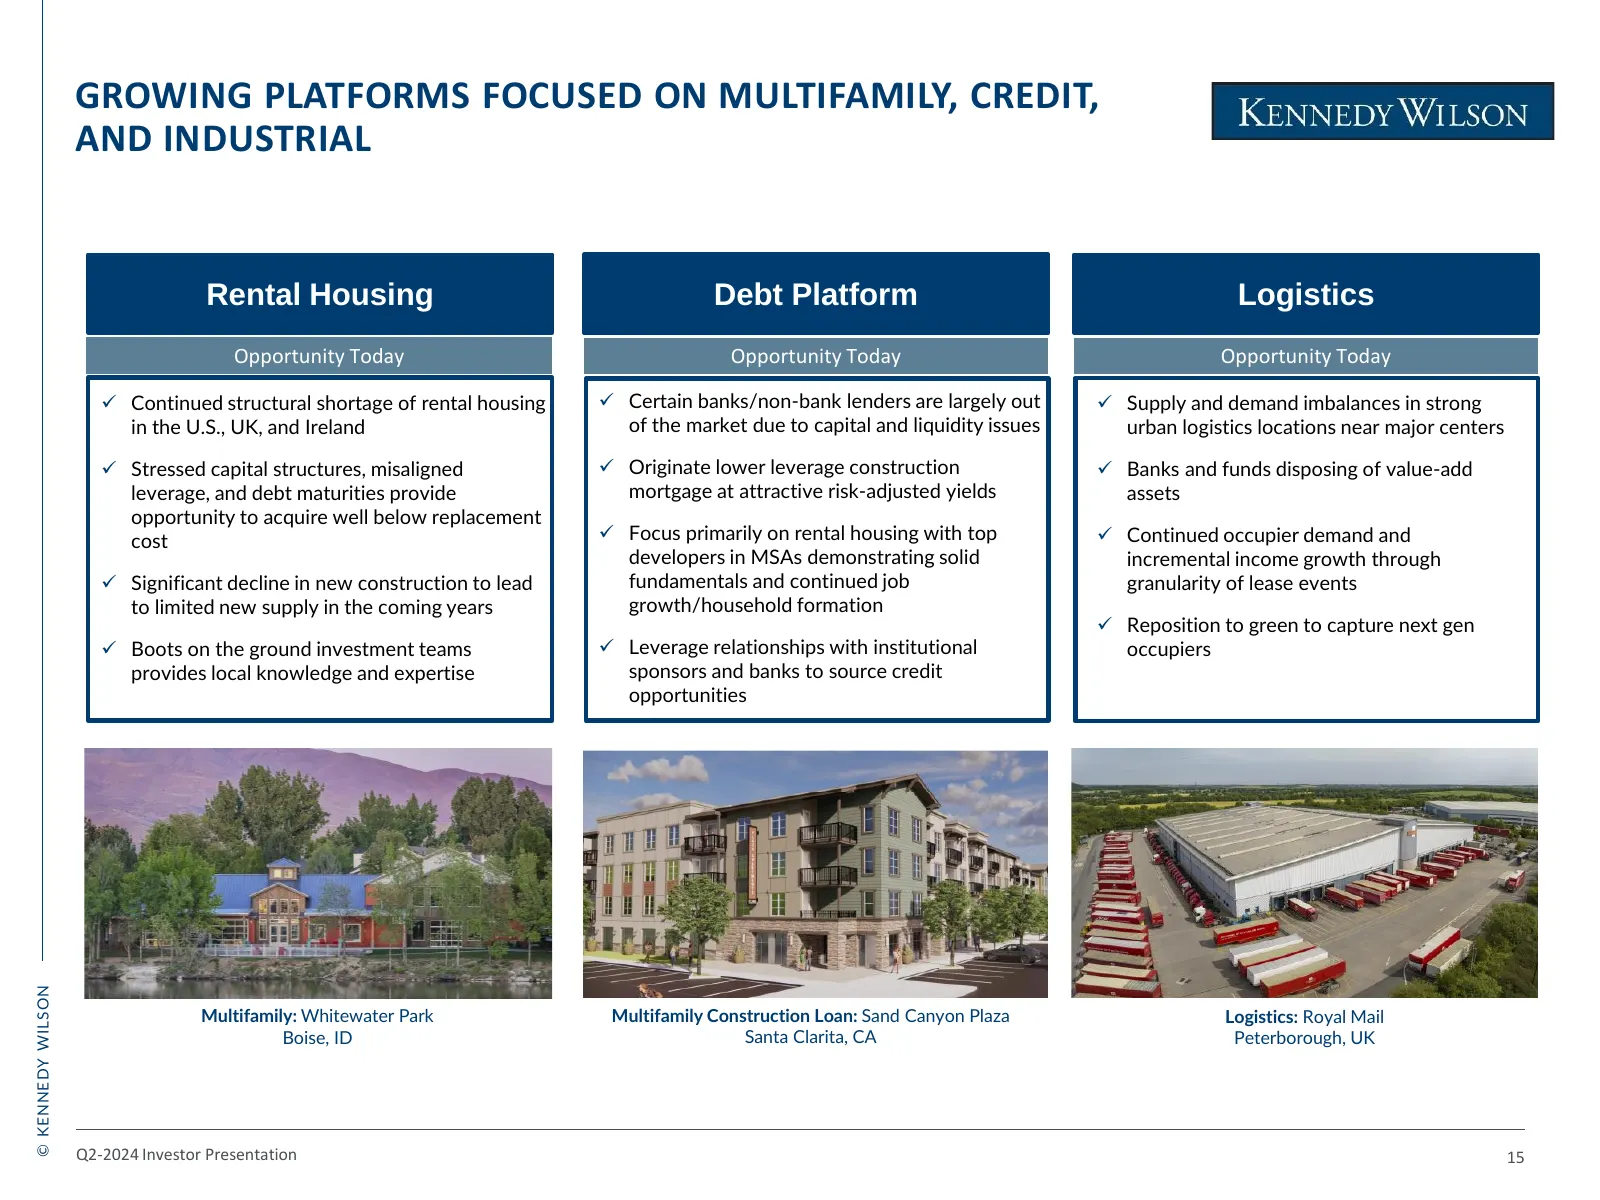
GROWING PLATFORMS FOCUSED ON MULTIFAMILY, CREDIT, AND INDUSTRIAL Rental Housing Debt Platform Logistics Opportunity Today Opportunity Today Opportunity Today ✓ Continued structural shortage of rental housing ✓ Certain banks/non-bank lenders are largely out ✓ Supply and demand imbalances in strong in
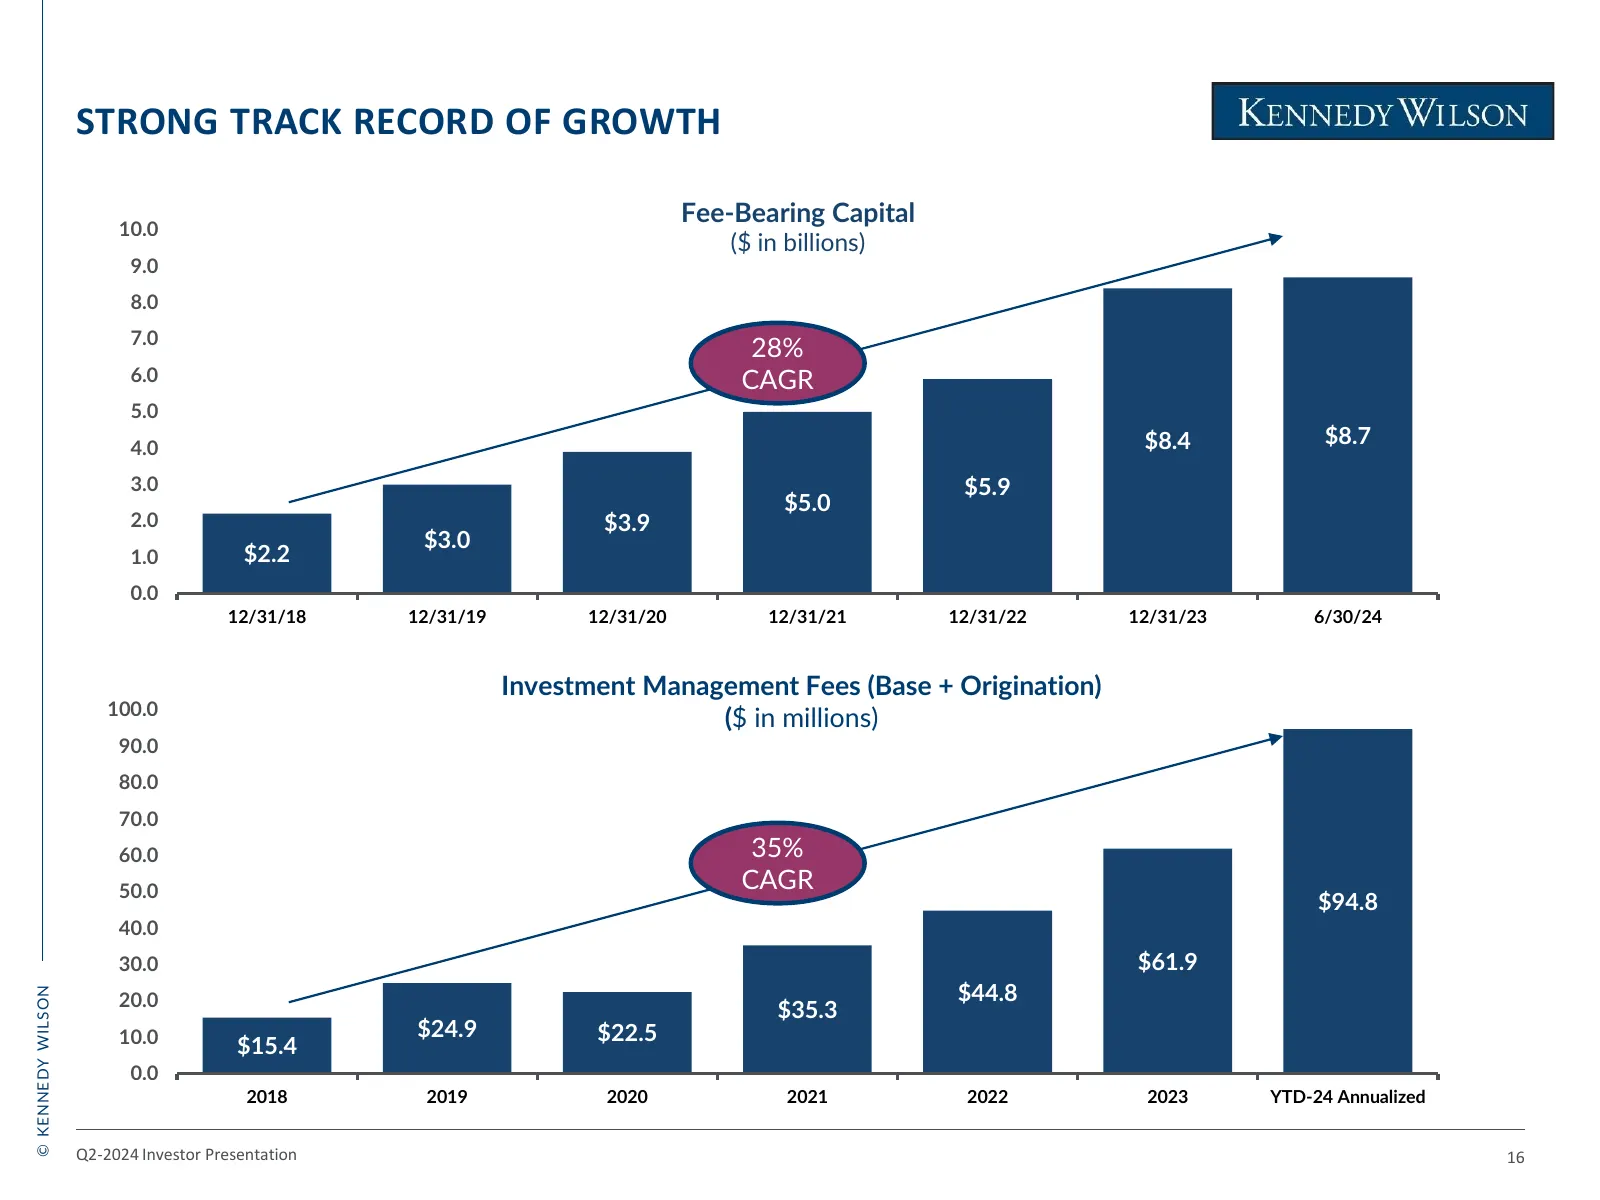
Slide 17: Strong Track Record of Growth
STRONG TRACK RECORD OF GROWTH Fee-Bearing Capital 10.0 ($ in billions) 9.0 8.0 7.0 28% 6.0 CAGR 5.0 4.0 $8.4 $8.7 3.0 $5.9 $5.0 2.0 $3.9 $3.0 1.0 $2.2 0.0 12/31/18 12/31/19 12/31/20 12/31/21 12/31/22 12/31/23 6/30/24 Investment Management Fees (Base + Origination) 100.0 ($ in millions) 90.0 80.0 70.
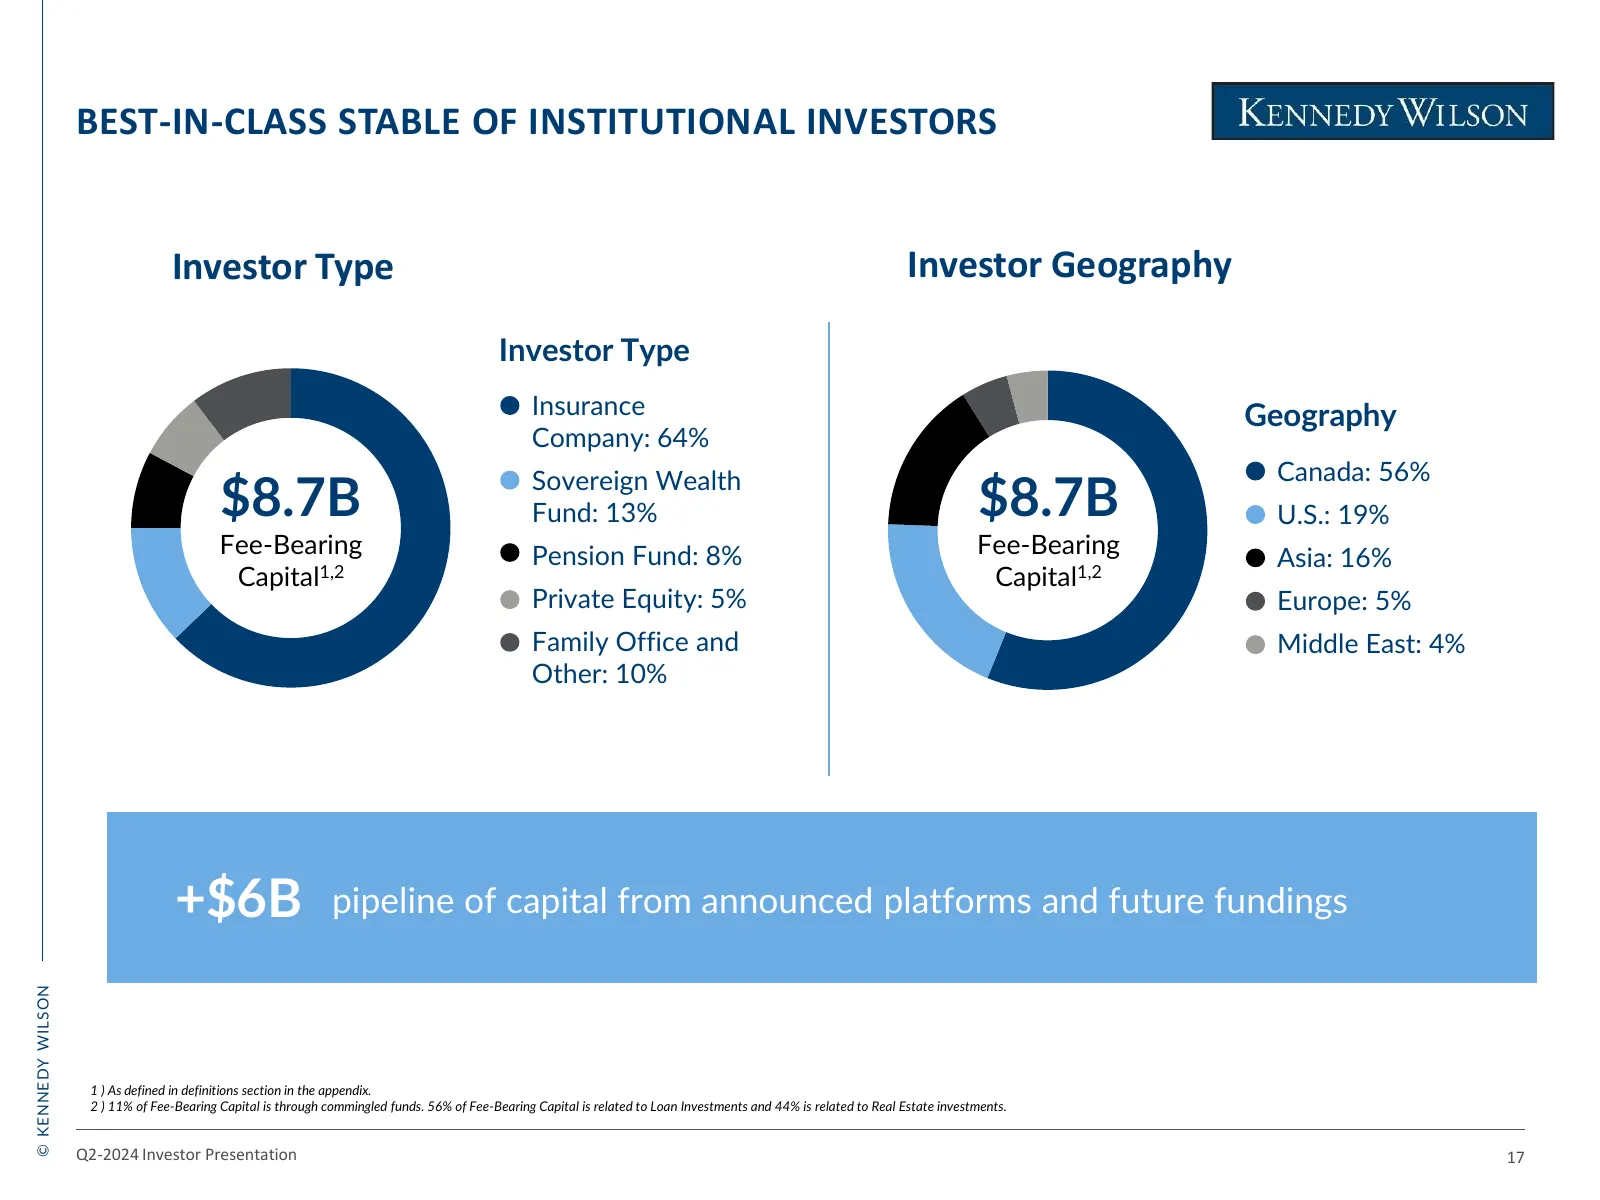
Slide 18: Best-in-Class Stable of Institutional Investors
BEST-IN-CLASS STABLE OF INSTITUTIONAL INVESTORS Investor Type Investor Geography Investor Type Insurance Geography Company: 64% Canada: 56% $8.7B Sovereign Wealth Fund: 13% $8.7B U.S.: 19% Fee-Bearing Pension Fund: 8% Fee-Bearing Asia: 16% Capital1,2 Capital1,2 Private Equity: 5% Europe: 5% Family O
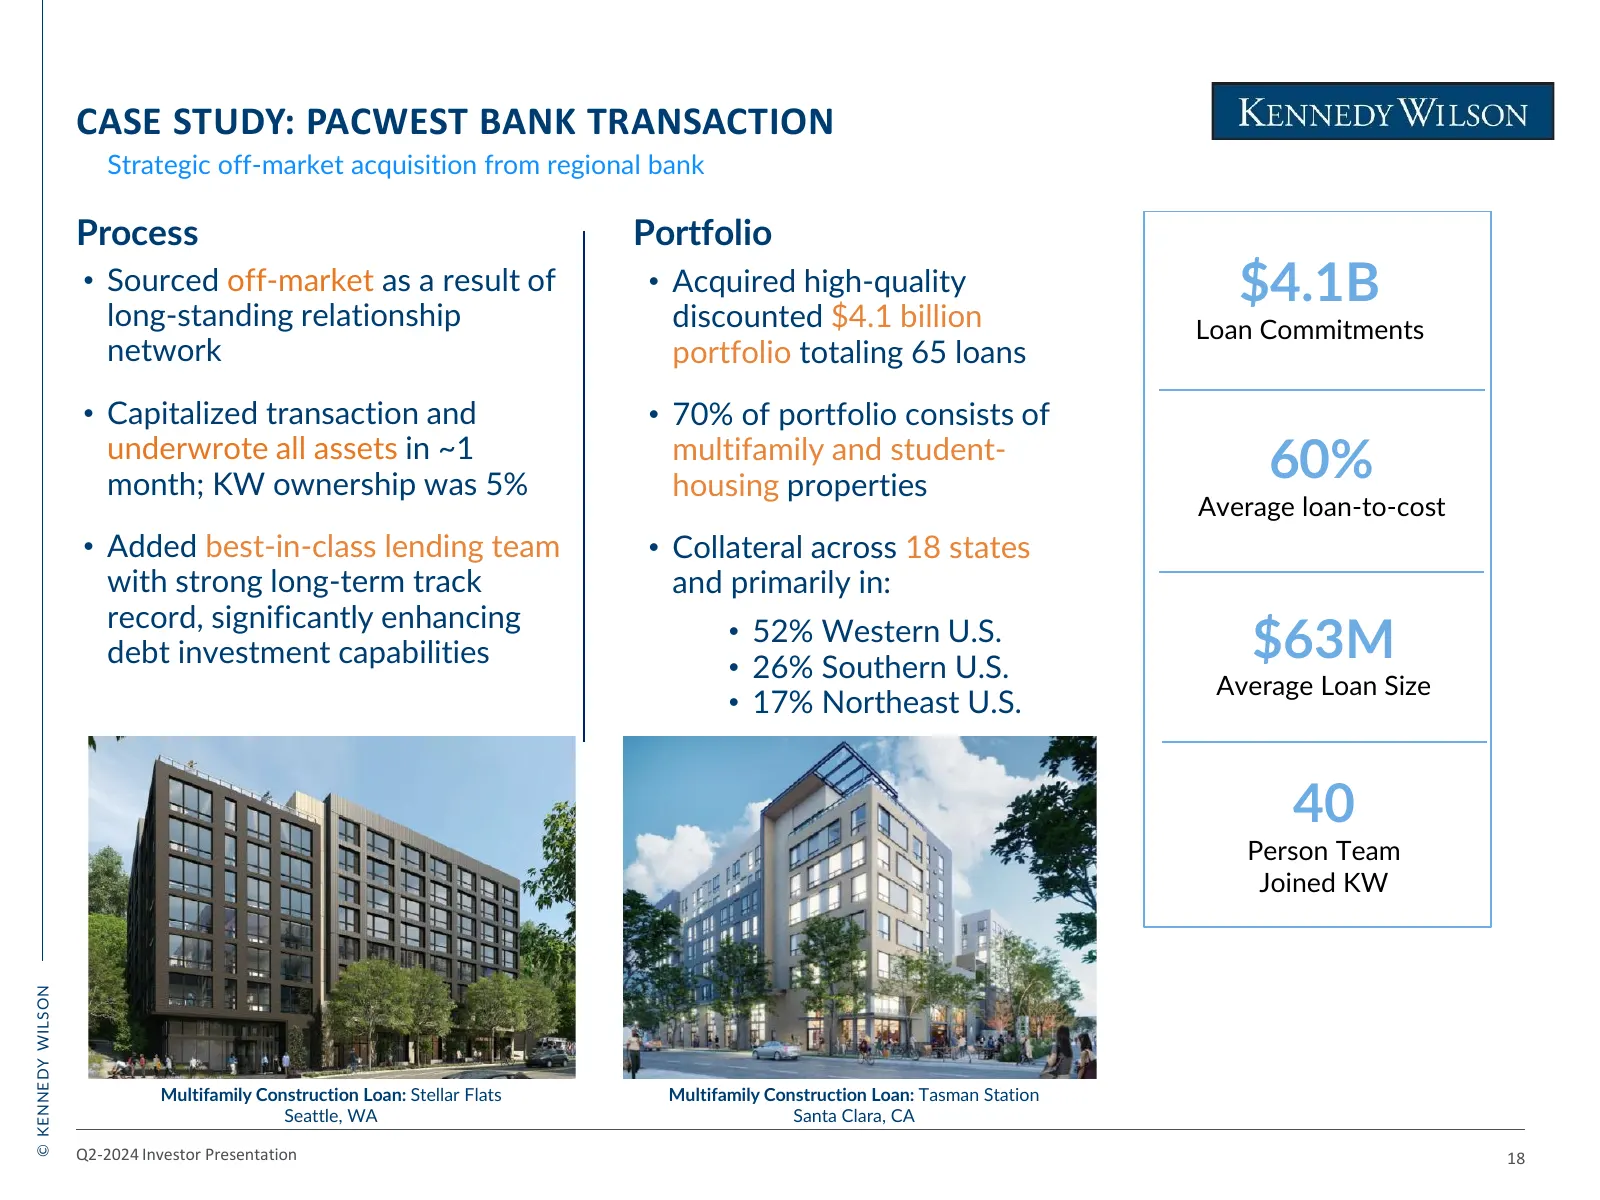
Slide 19: Case Study: PacWest Bank Transaction
CASE STUDY: PACWEST BANK TRANSACTION Strategic off-market acquisition from regional bank Process Portfolio • Sourced off-market as a result of long-standing relationship • Acquired high-quality discounted $4.1 billion $4.1B Loan Commitments network portfolio totaling 65 loans • Capitalized transacti
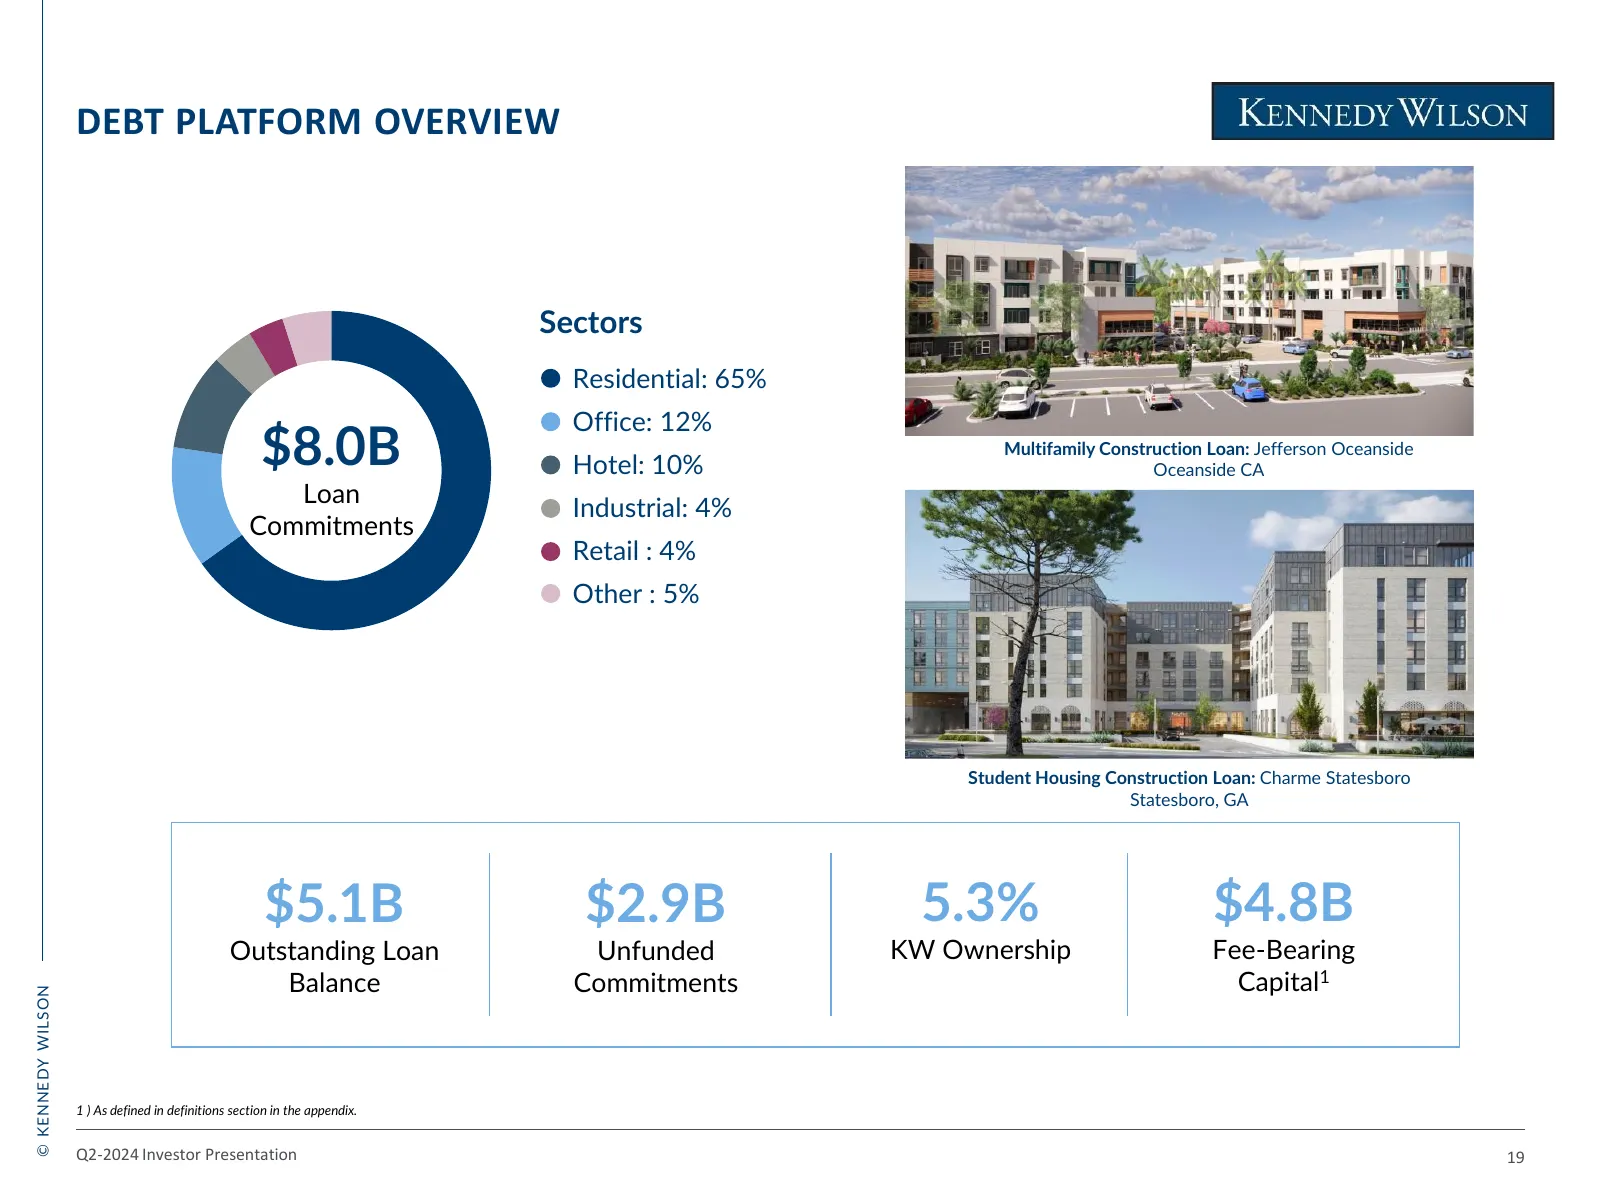
Slide 20: Debt Platform Overview
DEBT PLATFORM OVERVIEW Sectors Residential: 65% Office: 12% $8.0B Hotel: 10% Multifamily Construction Loan: Jefferson Oceanside Oceanside CA Loan Industrial: 4% Commitments Retail : 4% Other : 5% Student Housing Construction Loan: Charme Statesboro Statesboro, GA $5.1B $2.9B 5.3% $4.8B Outstanding L
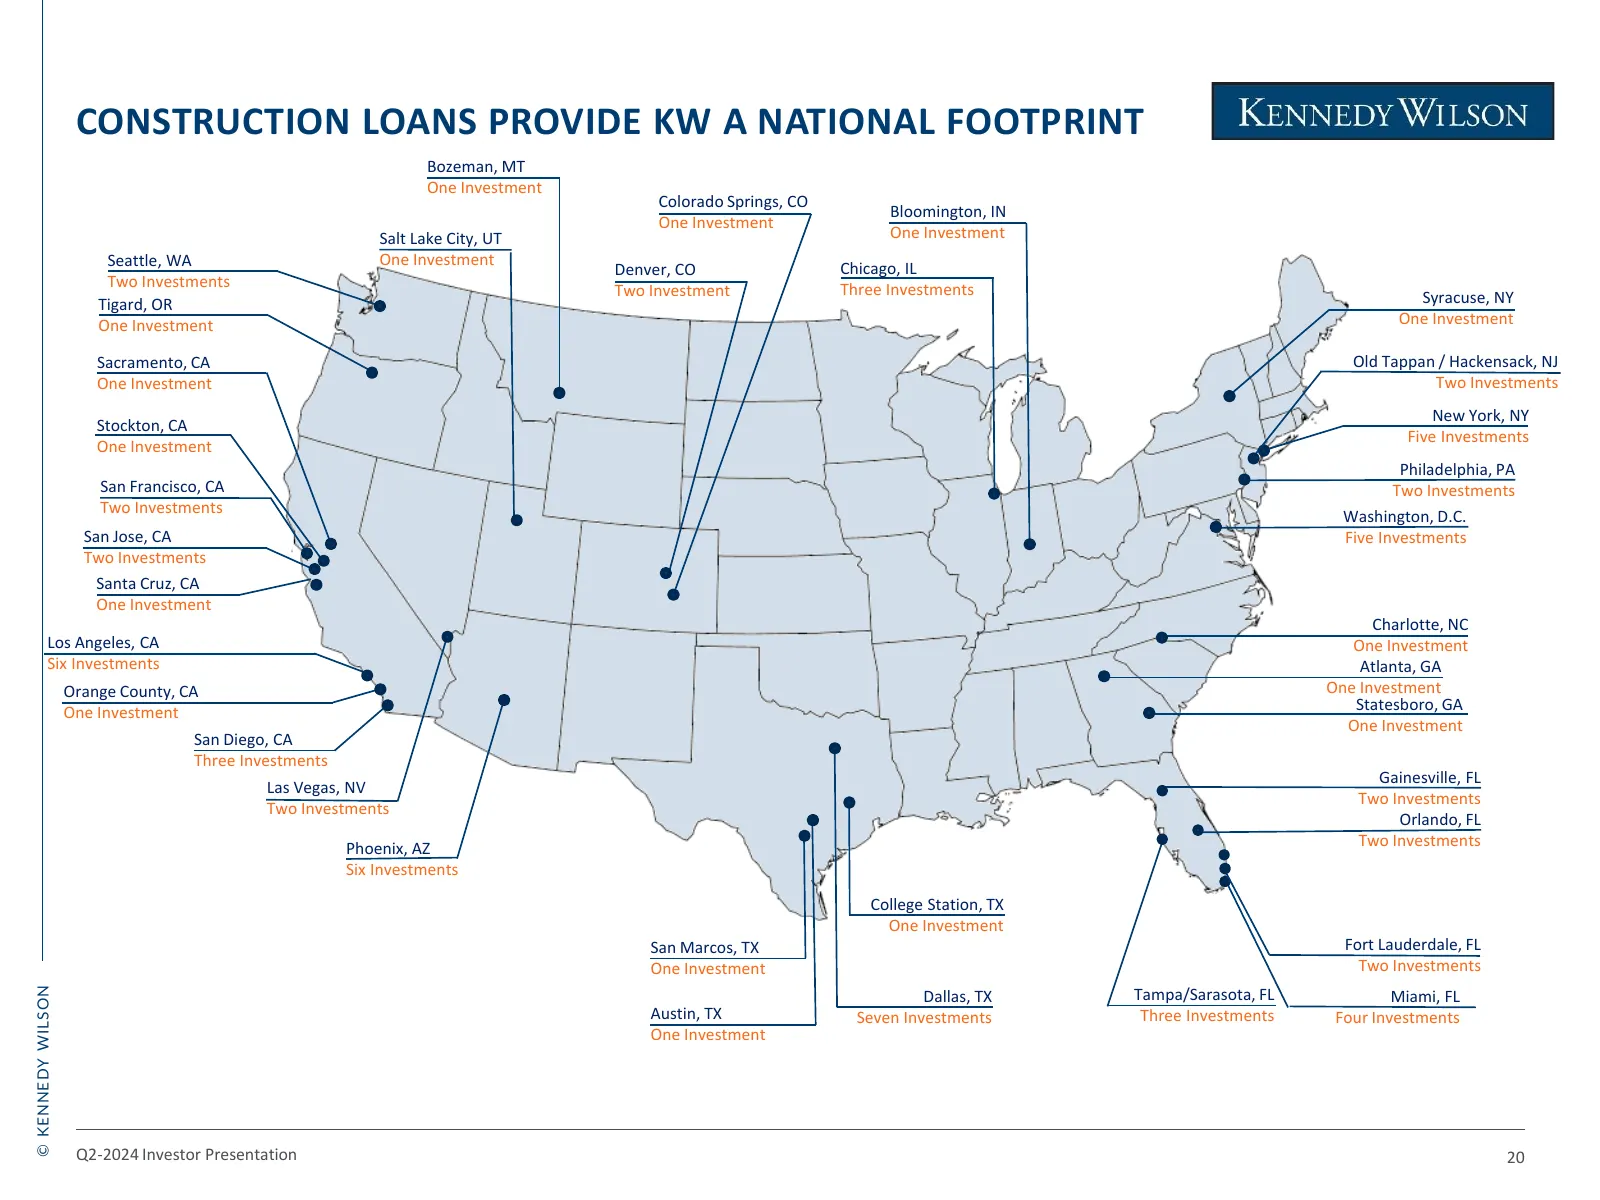
Slide 21: Construction Loans Provide KW a National Footprint
CONSTRUCTION LOANS PROVIDE KW A NATIONAL FOOTPRINT Bozeman, MT One Investment Colorado Springs, CO Bloomington, IN One Investment Salt Lake City, UT One Investment Seattle, WA One Investment Chicago, IL Denver, CO Two Investments Two Investment Three Investments Tigard, OR Syracuse, NY One Investmen
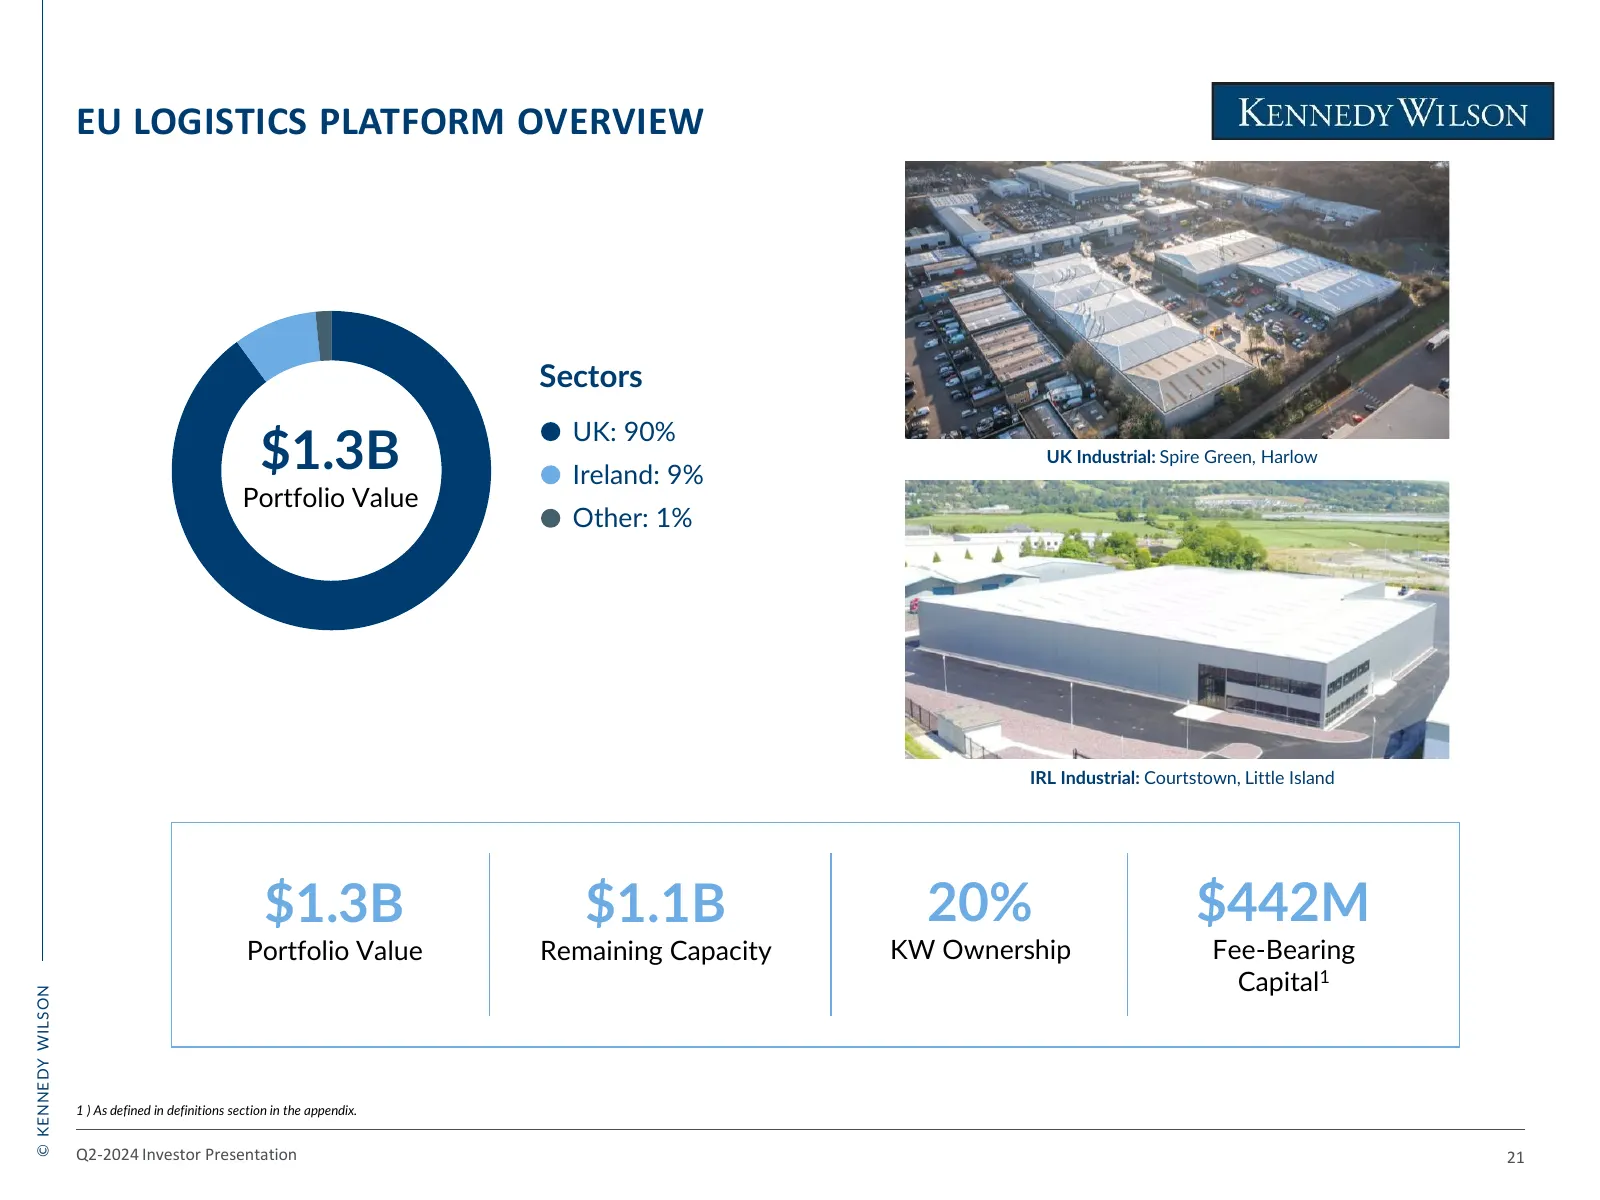
Slide 22: EU Logistics Platform Overview
EU LOGISTICS PLATFORM OVERVIEW Sectors UK: 90% $1.3B Ireland: 9% UK Industrial: Spire Green, Harlow Portfolio Value Other: 1% IRL Industrial: Courtstown, Little Island $1.3B $1.1B 20% $442M Portfolio Value Remaining Capacity KW Ownership Fee-Bearing Capital1 © KENNEDY WILSON 1 ) As defined in defini
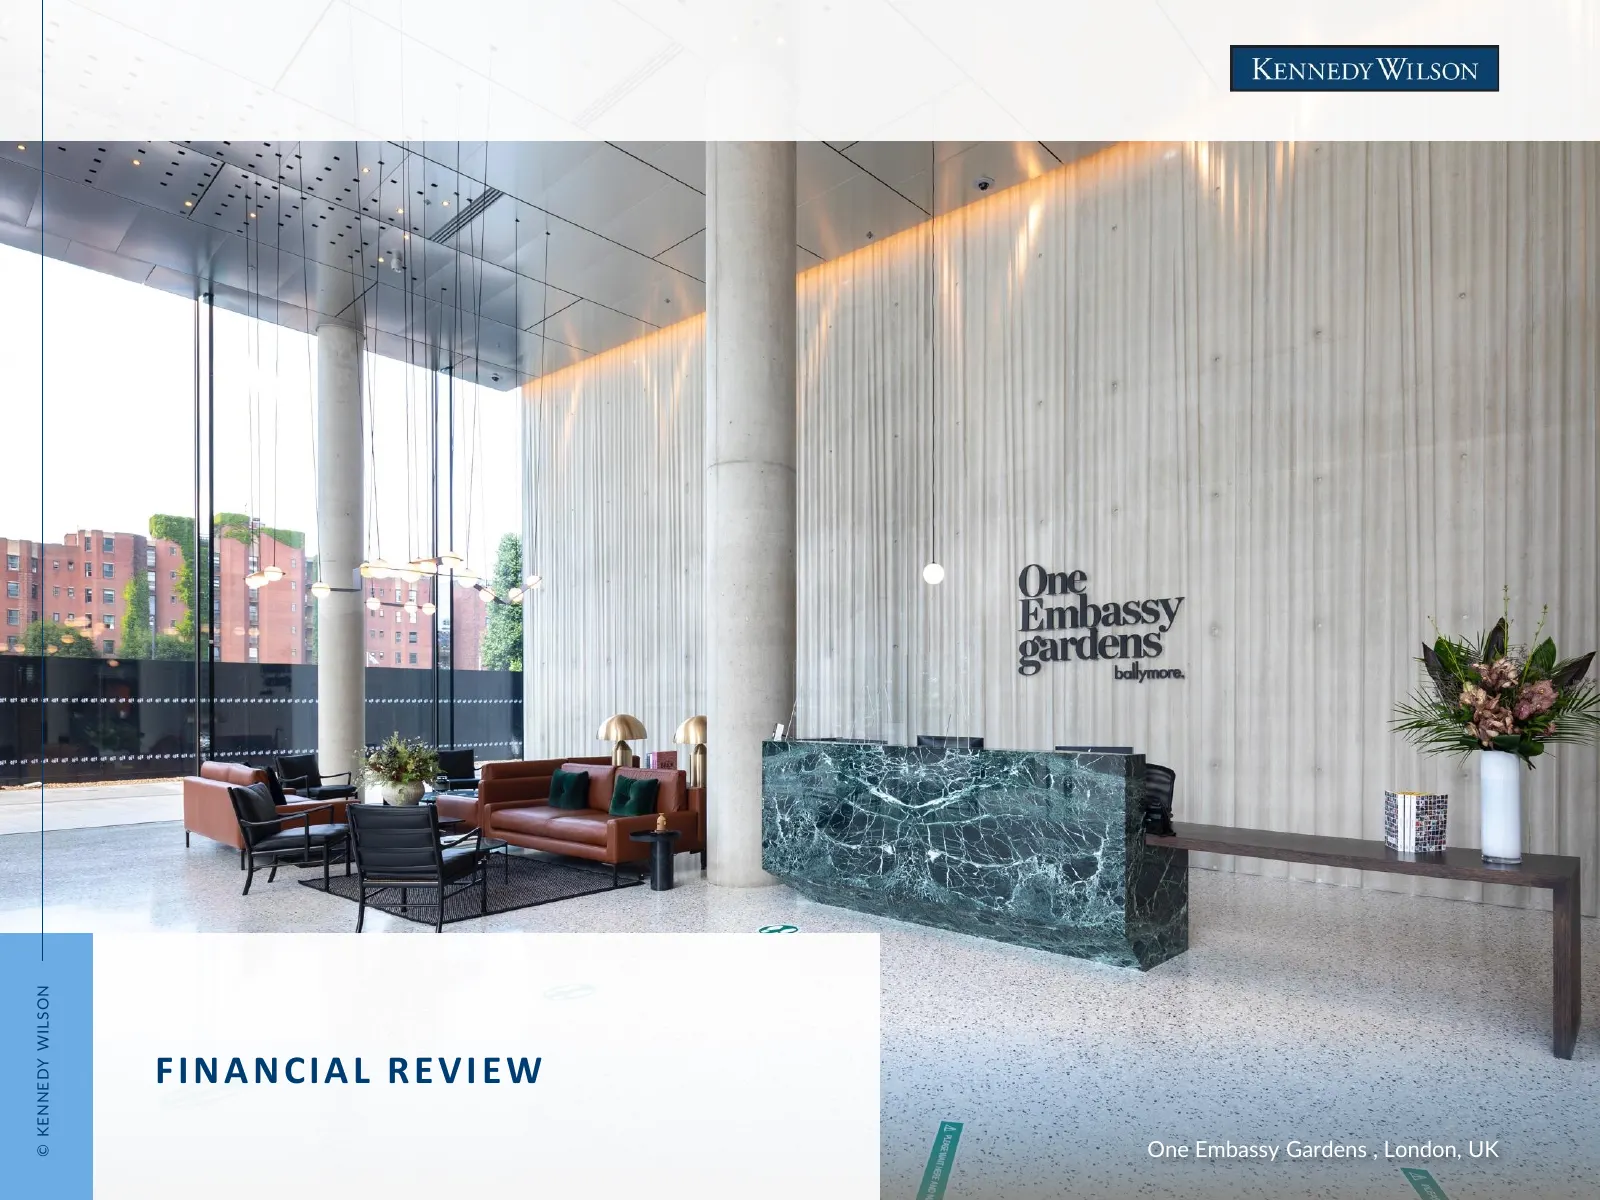
Slide 23: Financial Review
© KENNEDY WILSON FINANCIAL REVIEW One Embassy Gardens , London, UK
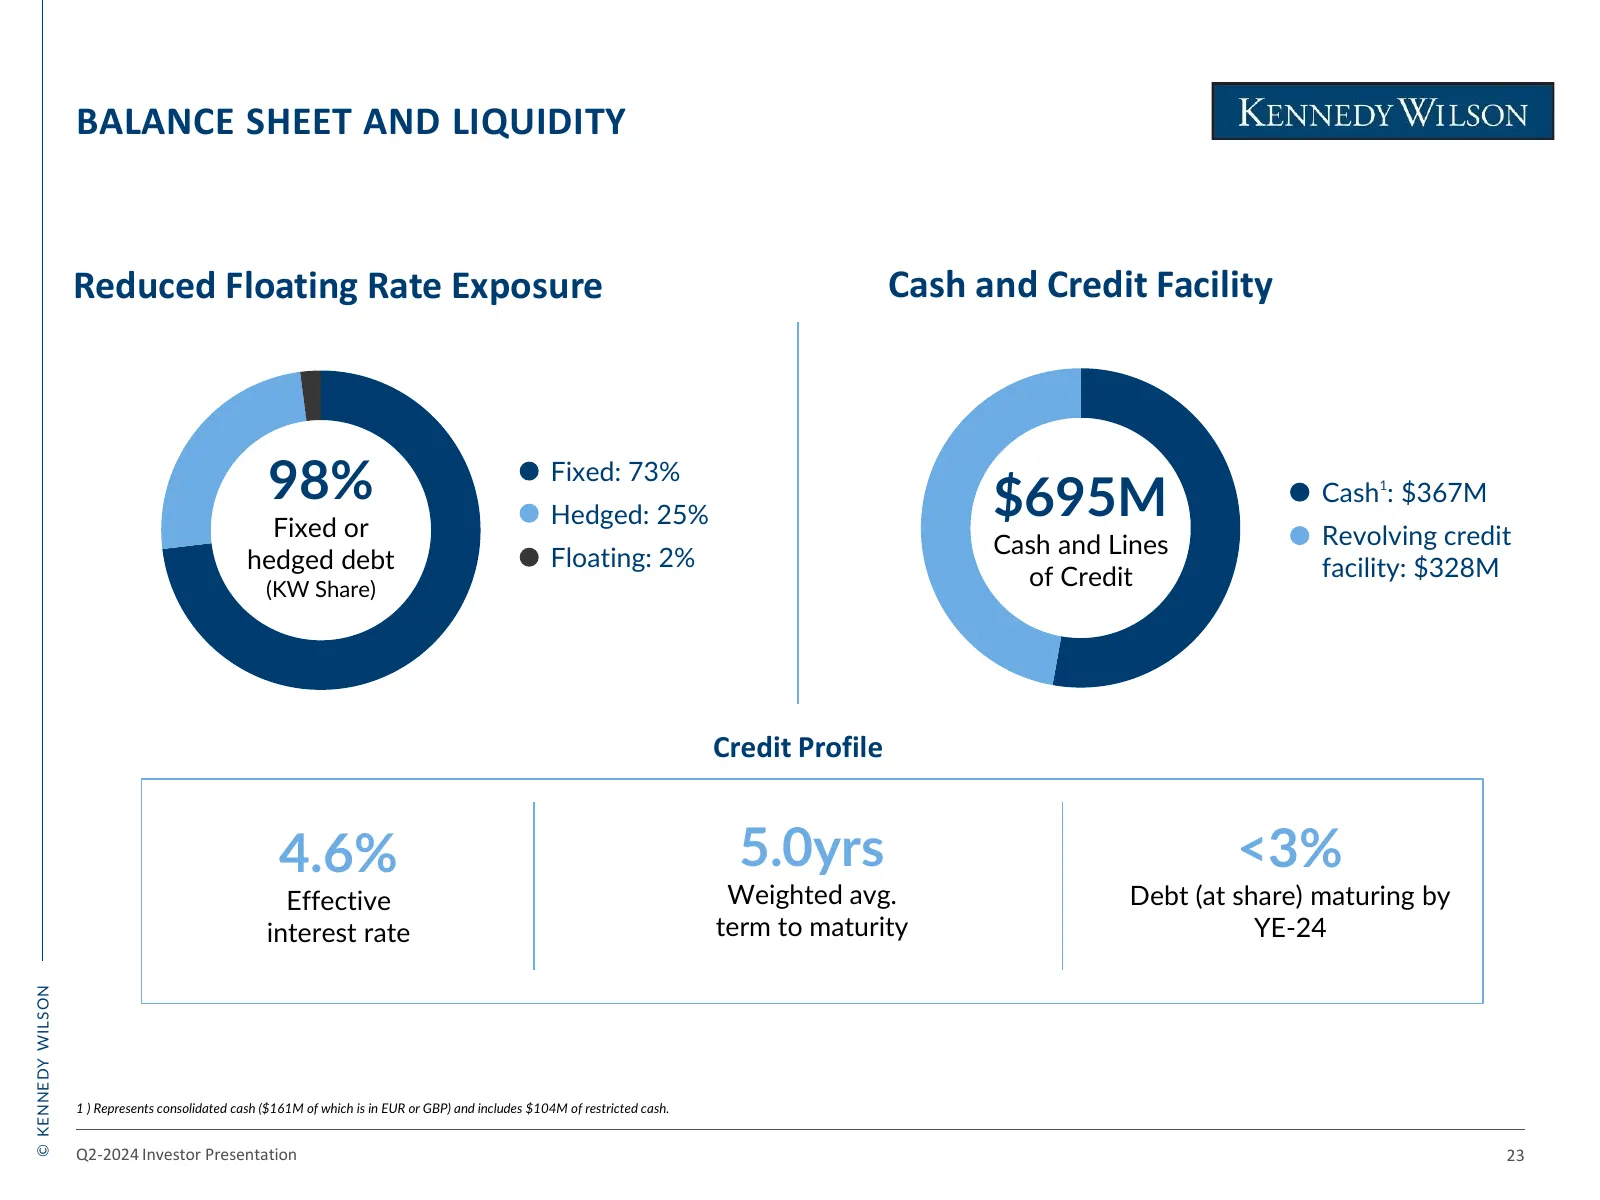
Slide 24: Balance Sheet and Liquidity
BALANCE SHEET AND LIQUIDITY Reduced Floating Rate Exposure Cash and Credit Facility 98% Fixed: 73% Hedged: 25% $695M Cash1: $367M Fixed or Revolving credit Floating: 2% Cash and Lines hedged debt facility: $328M (KW Share) of Credit Credit Profile 4.6% 5.0yrs <3% Effective Weighted avg. Debt (at sha
Slide 25: Components of Value
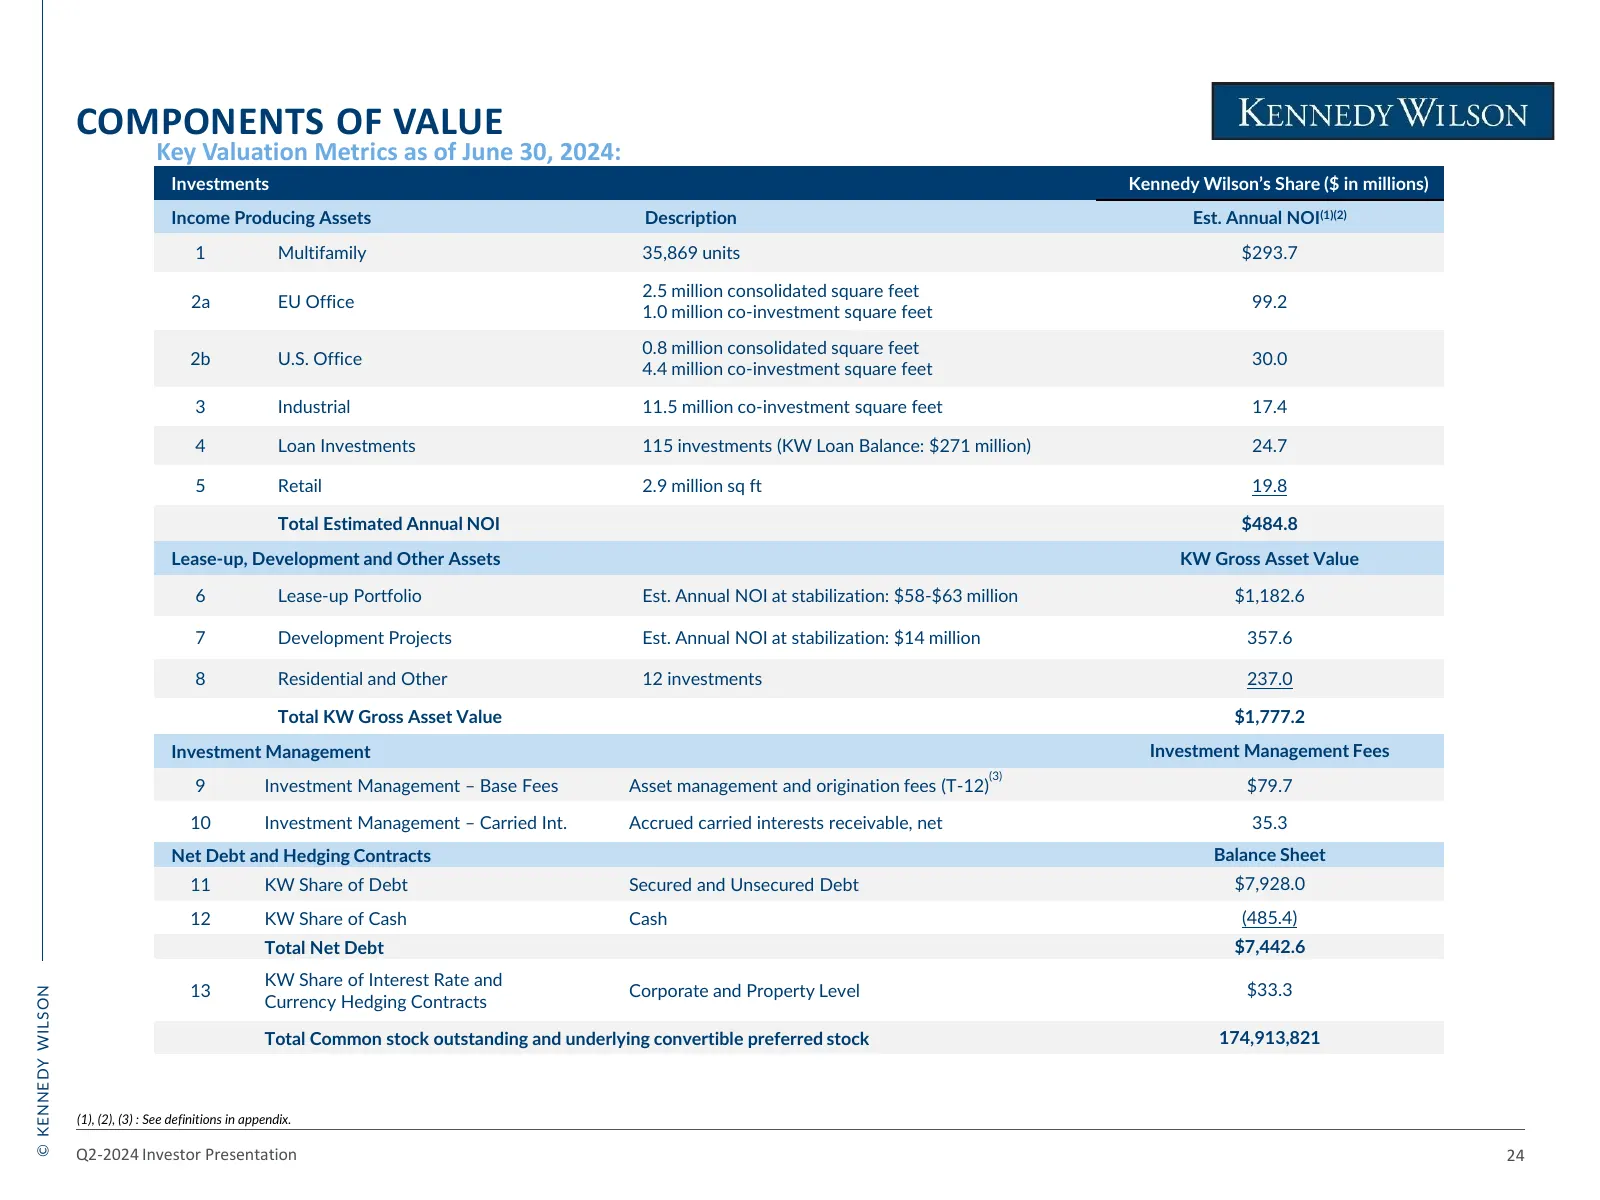
COMPONENTS OF VALUE Key Valuation Metrics as of June 30, 2024: Investments Kennedy Wilson’s Share ($ in millions) Income Producing Assets Description Est. Annual NOI(1)(2) 1 Multifamily 35,869 units $293.7 2.5 million consolidated square feet 2a EU Office 99.2 1.0 million co-investment square feet 0
Slide 26: ESG Overview
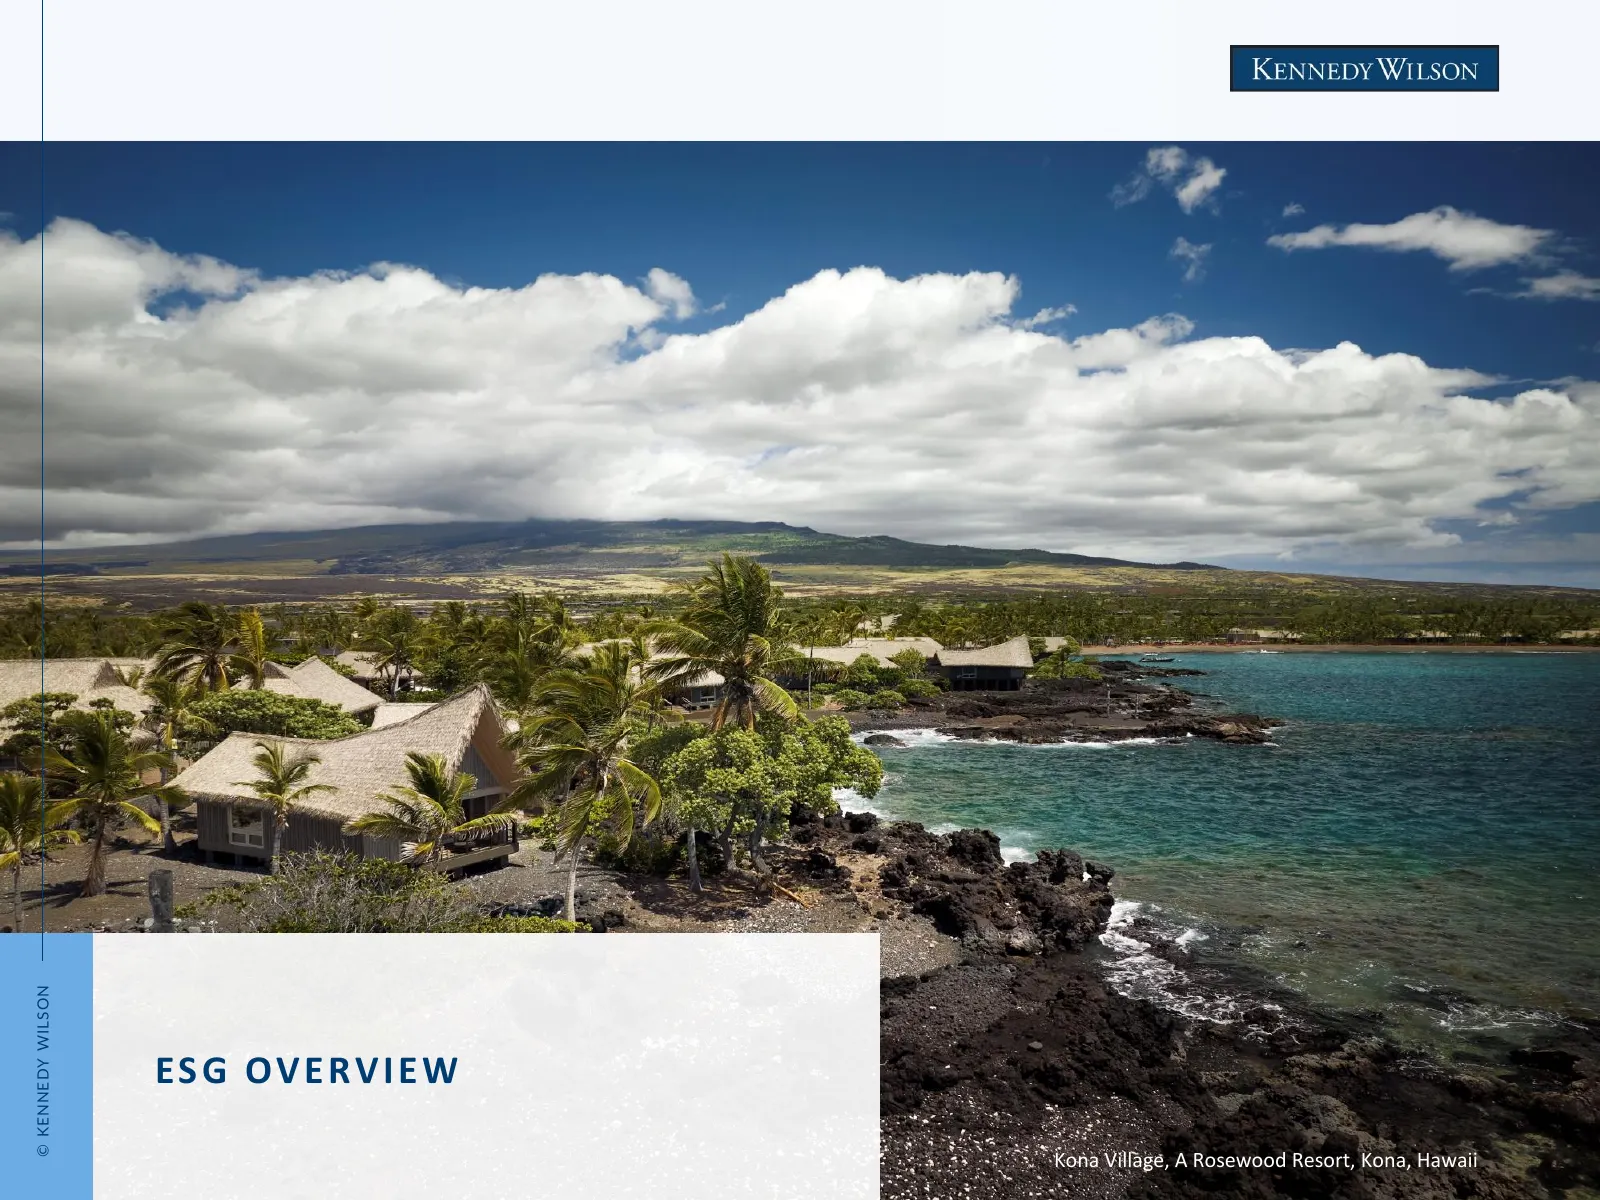
© KENNEDY WILSON E S G OV E RV I E W Kona Village, A Rosewood Resort, Kona, Hawaii
Slide 27: Our ESG Program Focuses on Four Pillars
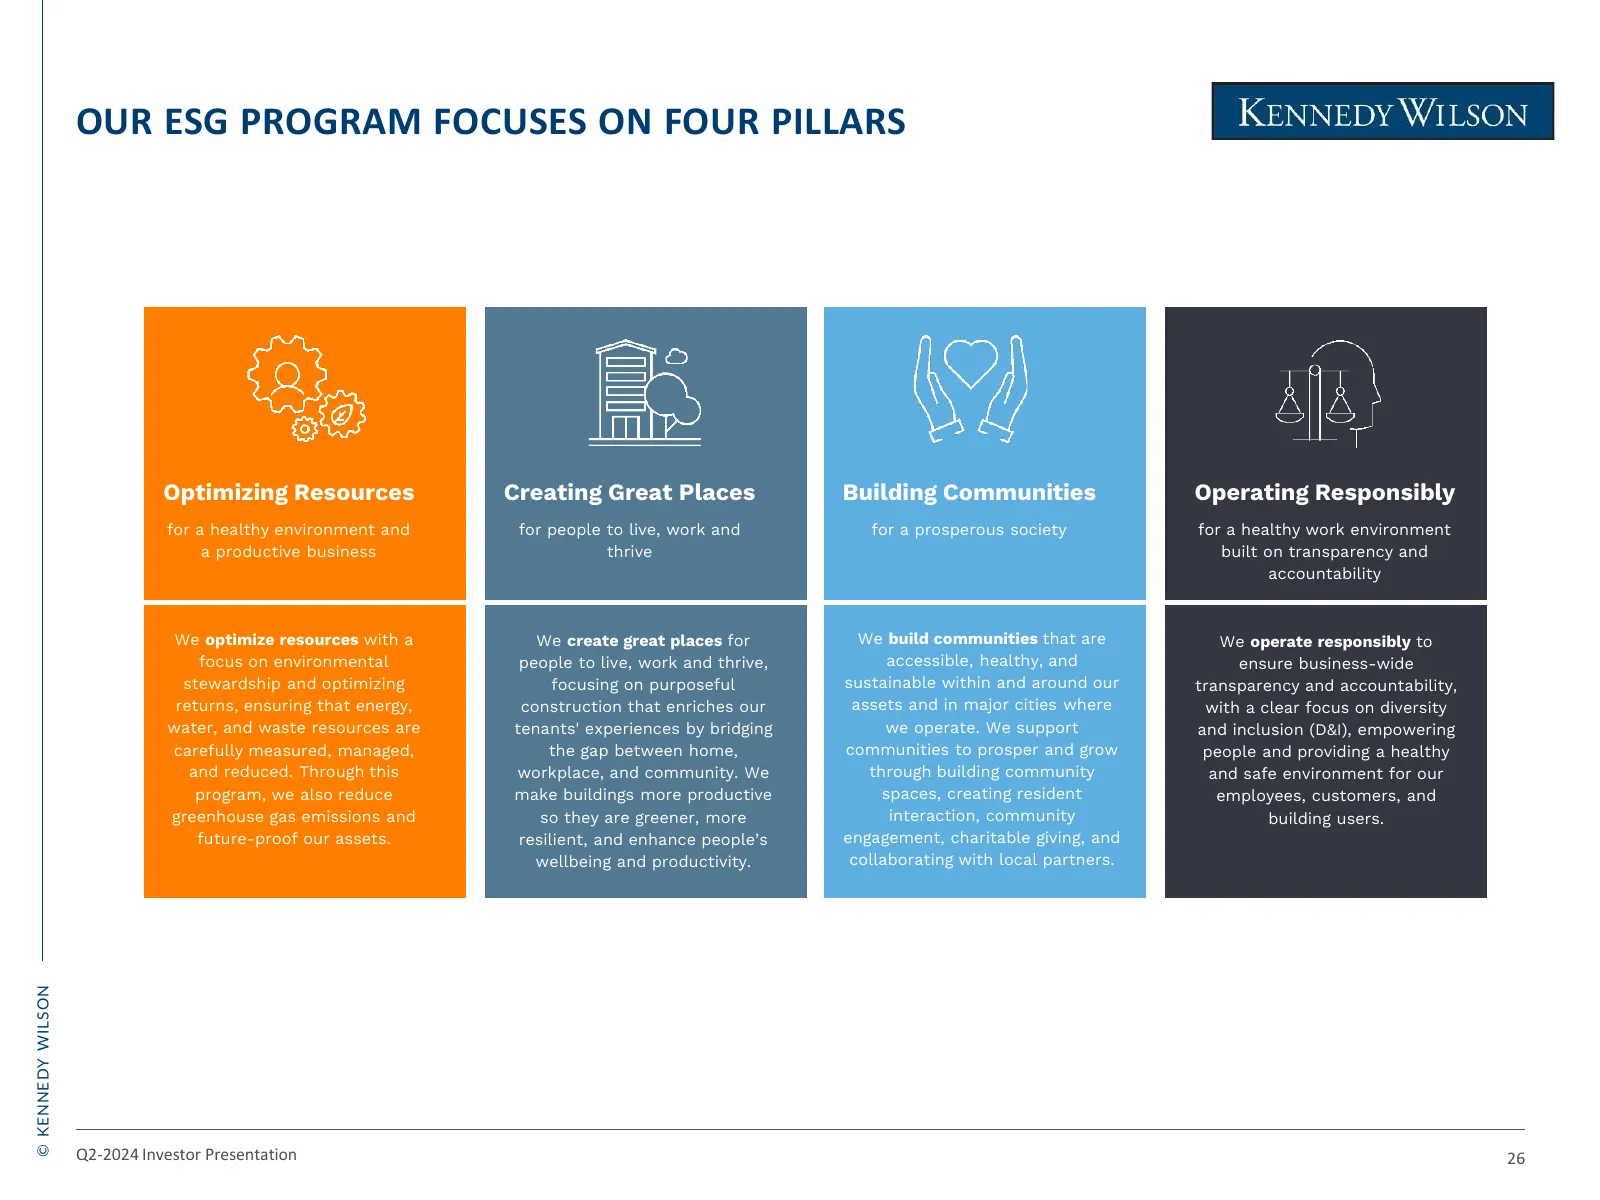
OUR ESG PROGRAM FOCUSES ON FOUR PILLARS Optimizing Resources Creating Great Places Building Communities Operating Responsibly for a healthy environment and for people to live, work and for a prosperous society for a healthy work environment a productive business thrive built on transparency and acco
Slide 28: ESG Program at a Glance
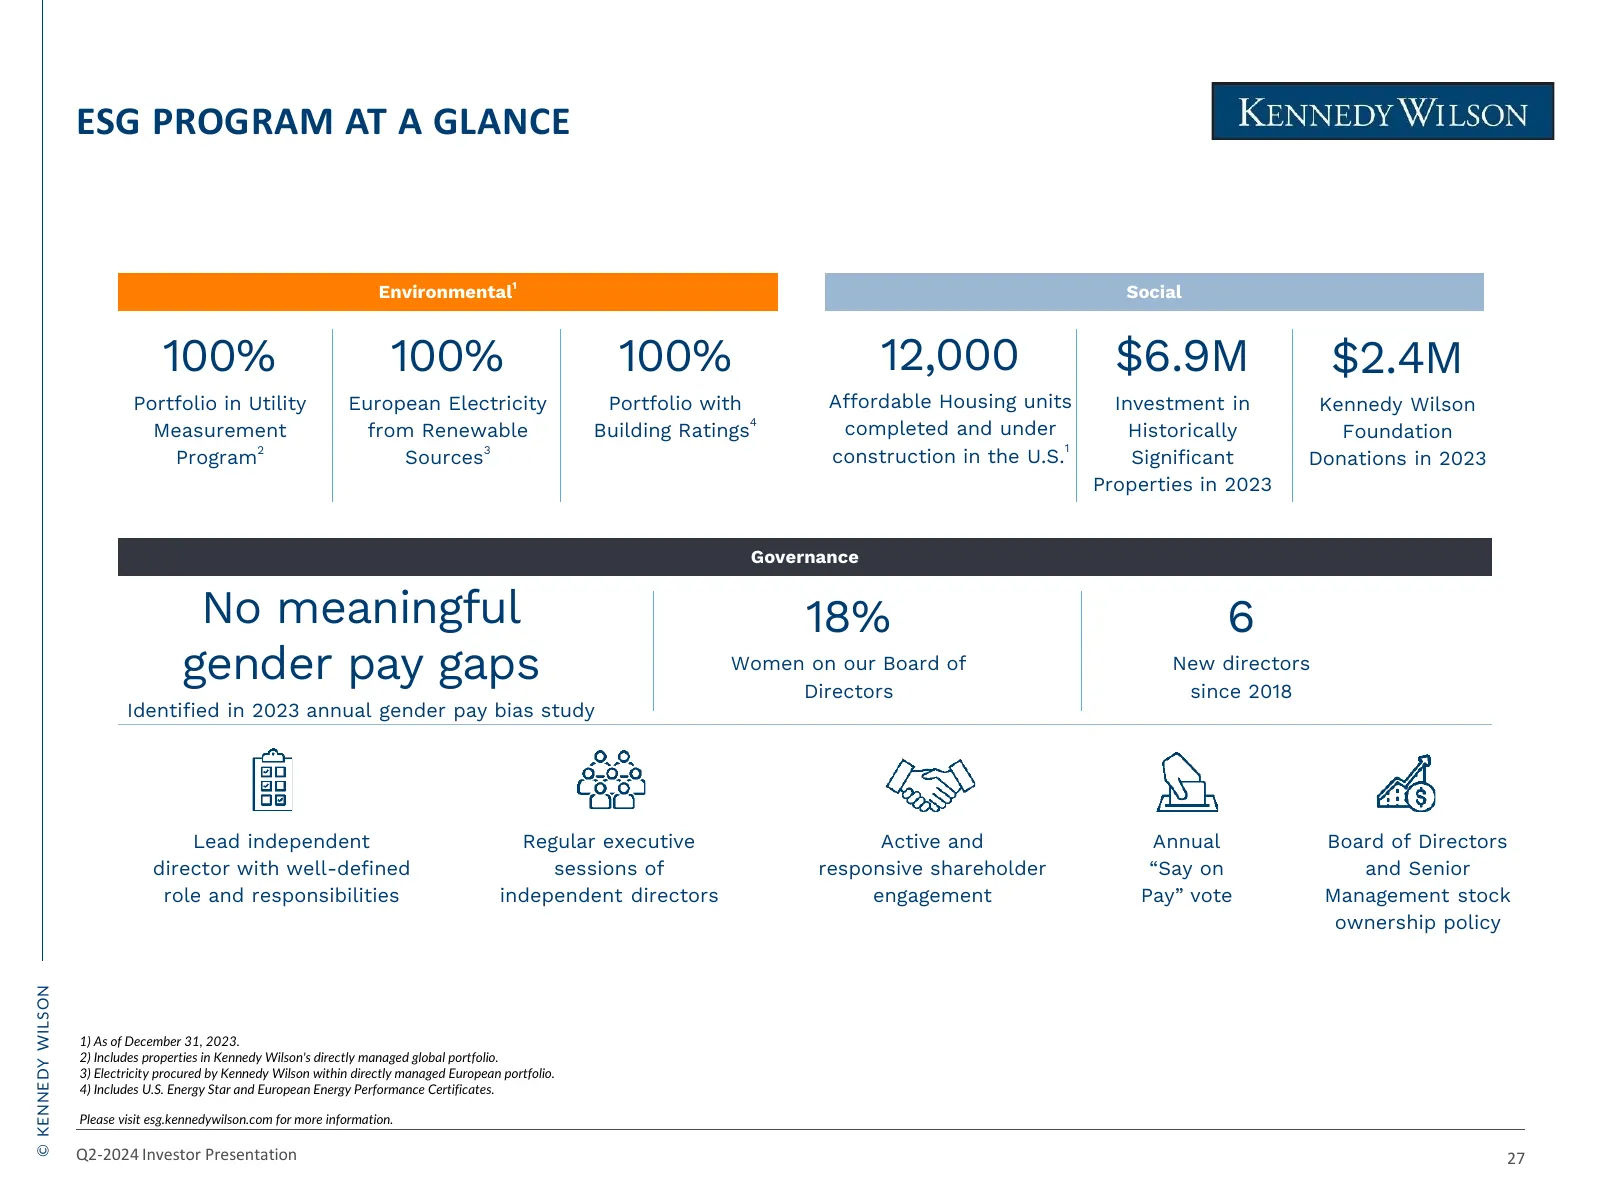
ESG PROGRAM AT A GLANCE 1 Environmental Social 100% 100% 100% 12,000 $6.9M $2.4M Portfolio in Utility European Electricity Portfolio with Affordable Housing units Investment in Kennedy Wilson 4 Measurement from Renewable Building Ratings completed and under Historically Foundation 2 3 1 Program Sour
Slide 29: Appendix
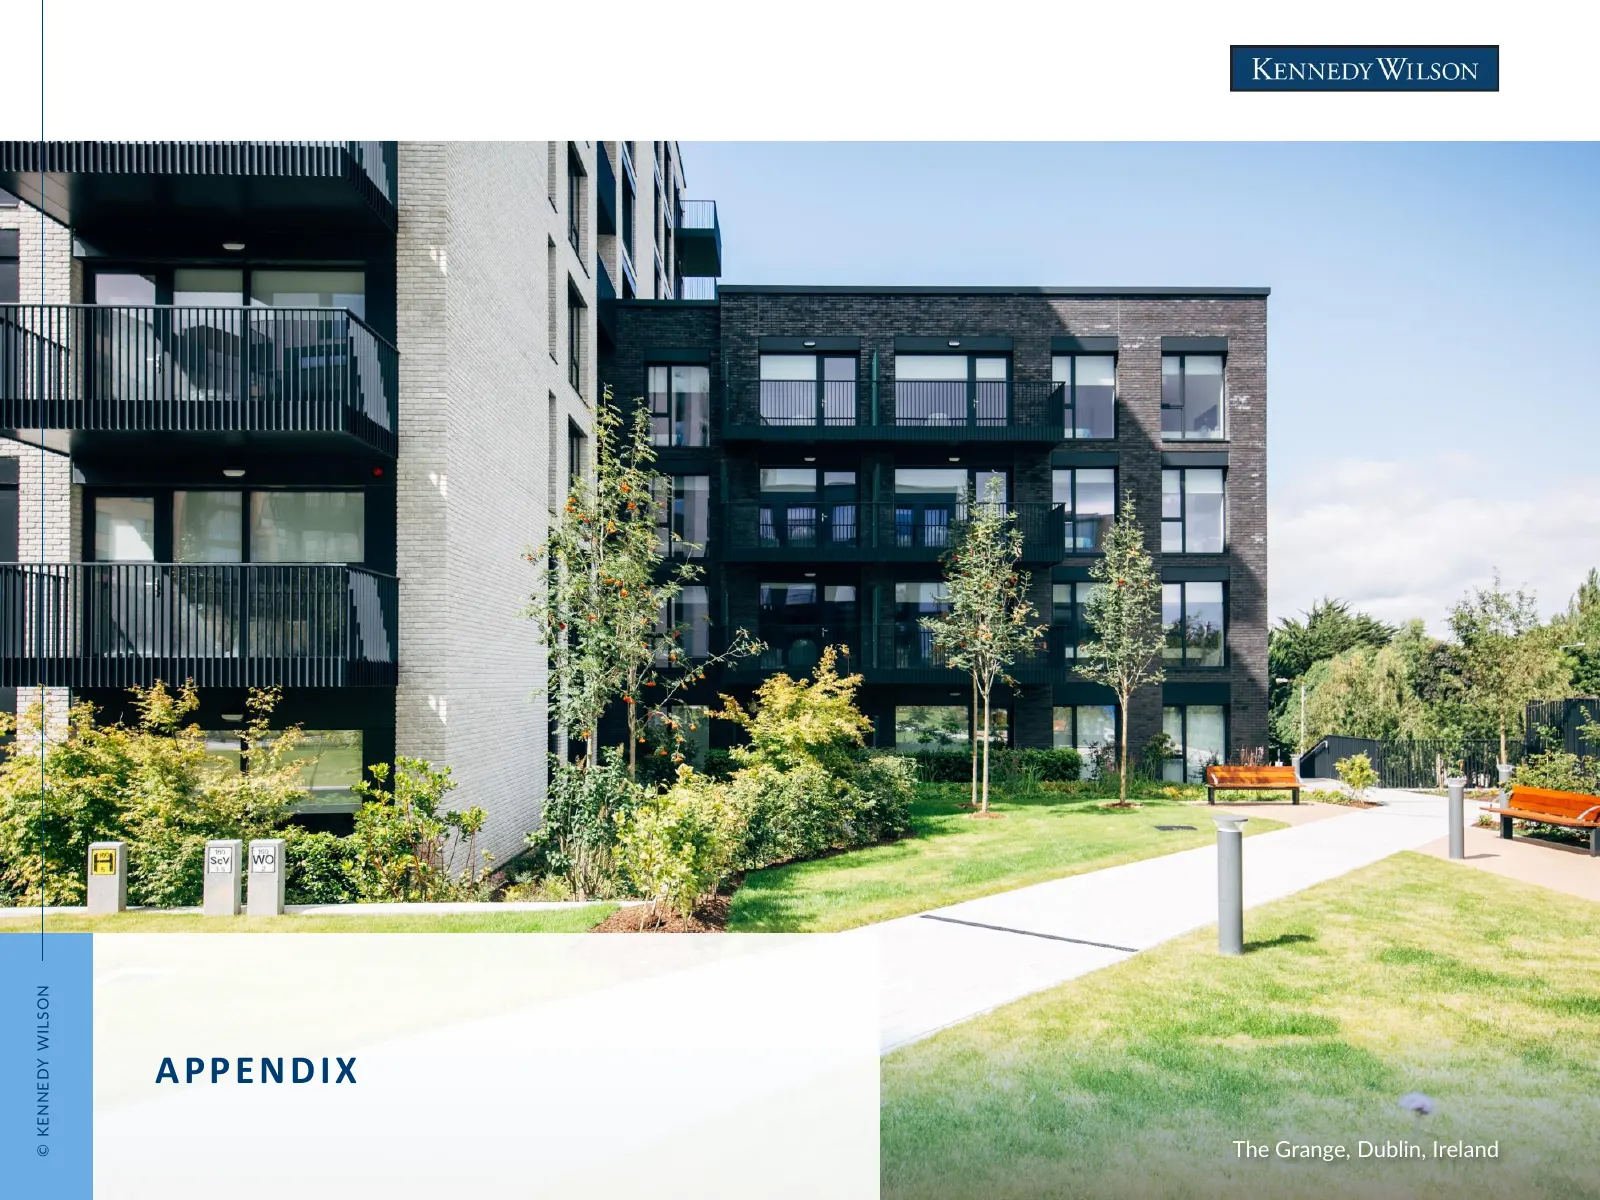
© KENNEDY WILSON APPENDIX The Grange, Dublin, Ireland
Slide 30: Vintage Housing: Growing Our Affordable Housing Portfolio
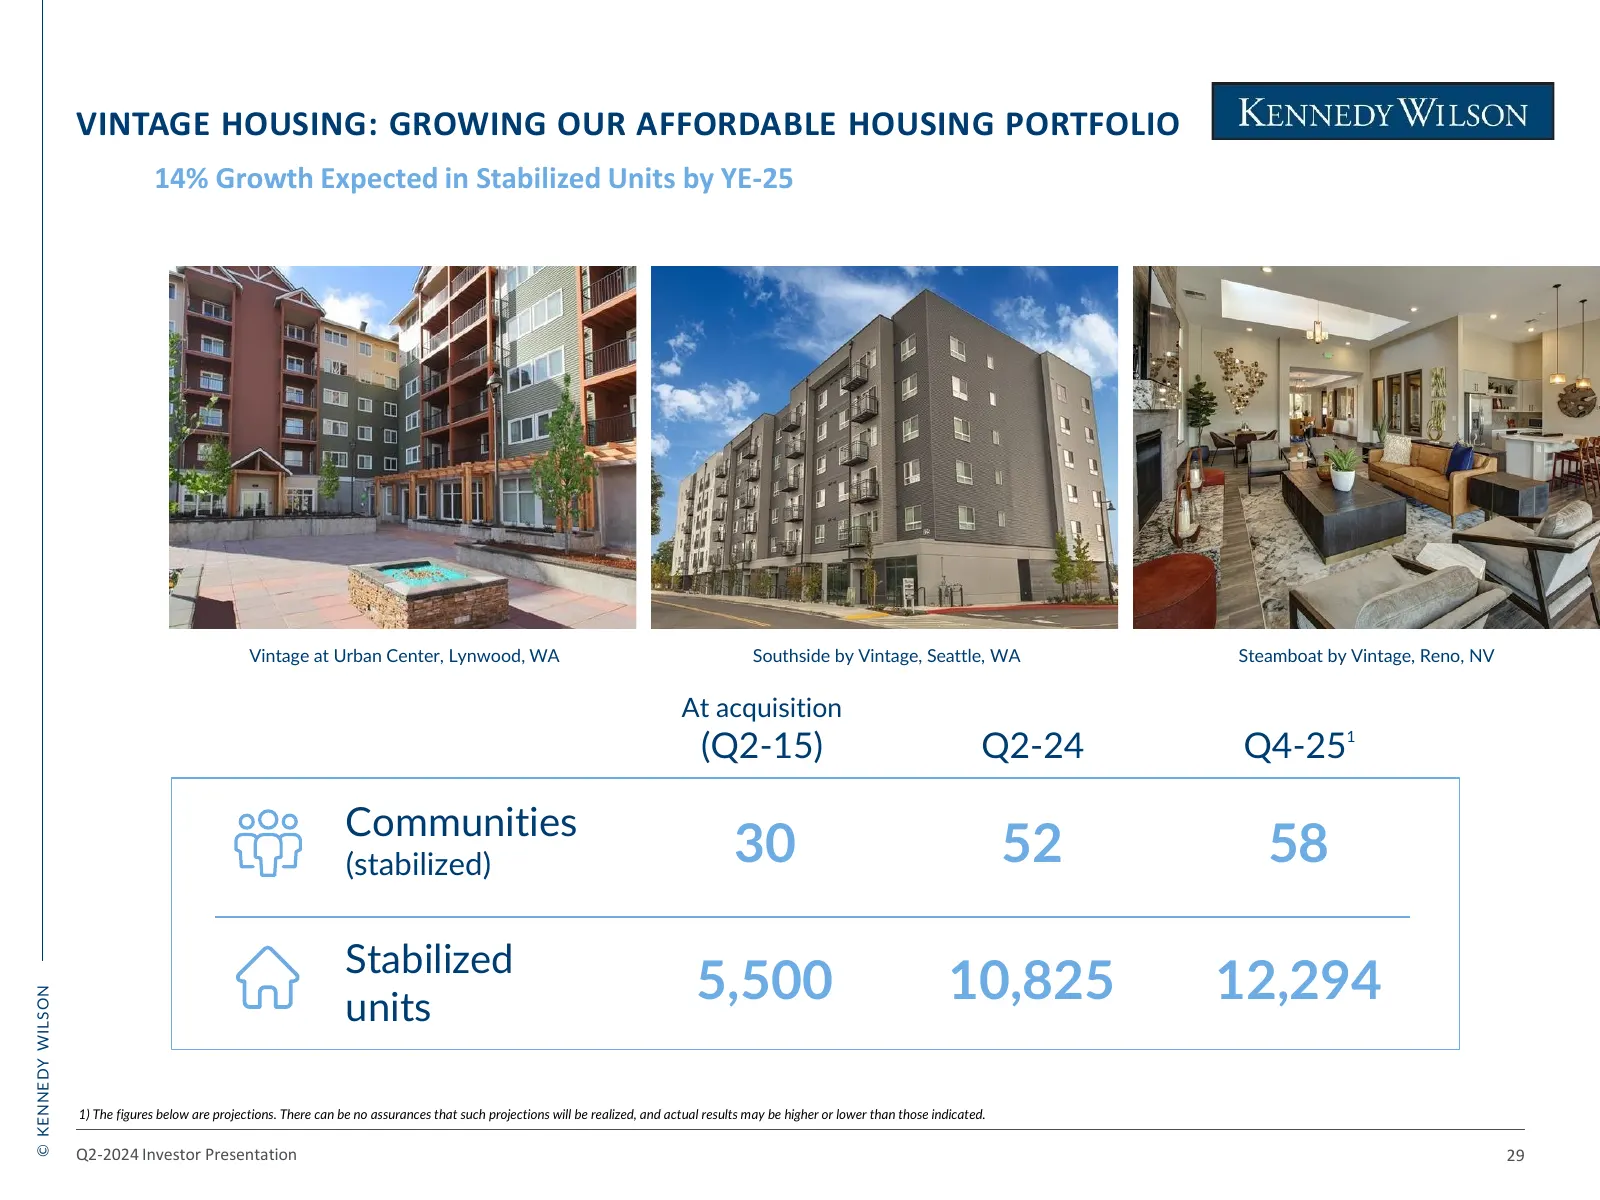
VINTAGE HOUSING: GROWING OUR AFFORDABLE HOUSING PORTFOLIO 14% Growth Expected in Stabilized Units by YE-25 Vintage at Urban Center, Lynwood, WA Southside by Vintage, Seattle, WA Steamboat by Vintage, Reno, NV At acquisition (Q2-15) Q2-24 Q4-251 Communities (stabilized) 30 52 58 Stabilized units 5,50
Slide 31: Irish Multifamily: Market Imbalance Creates Opportunity
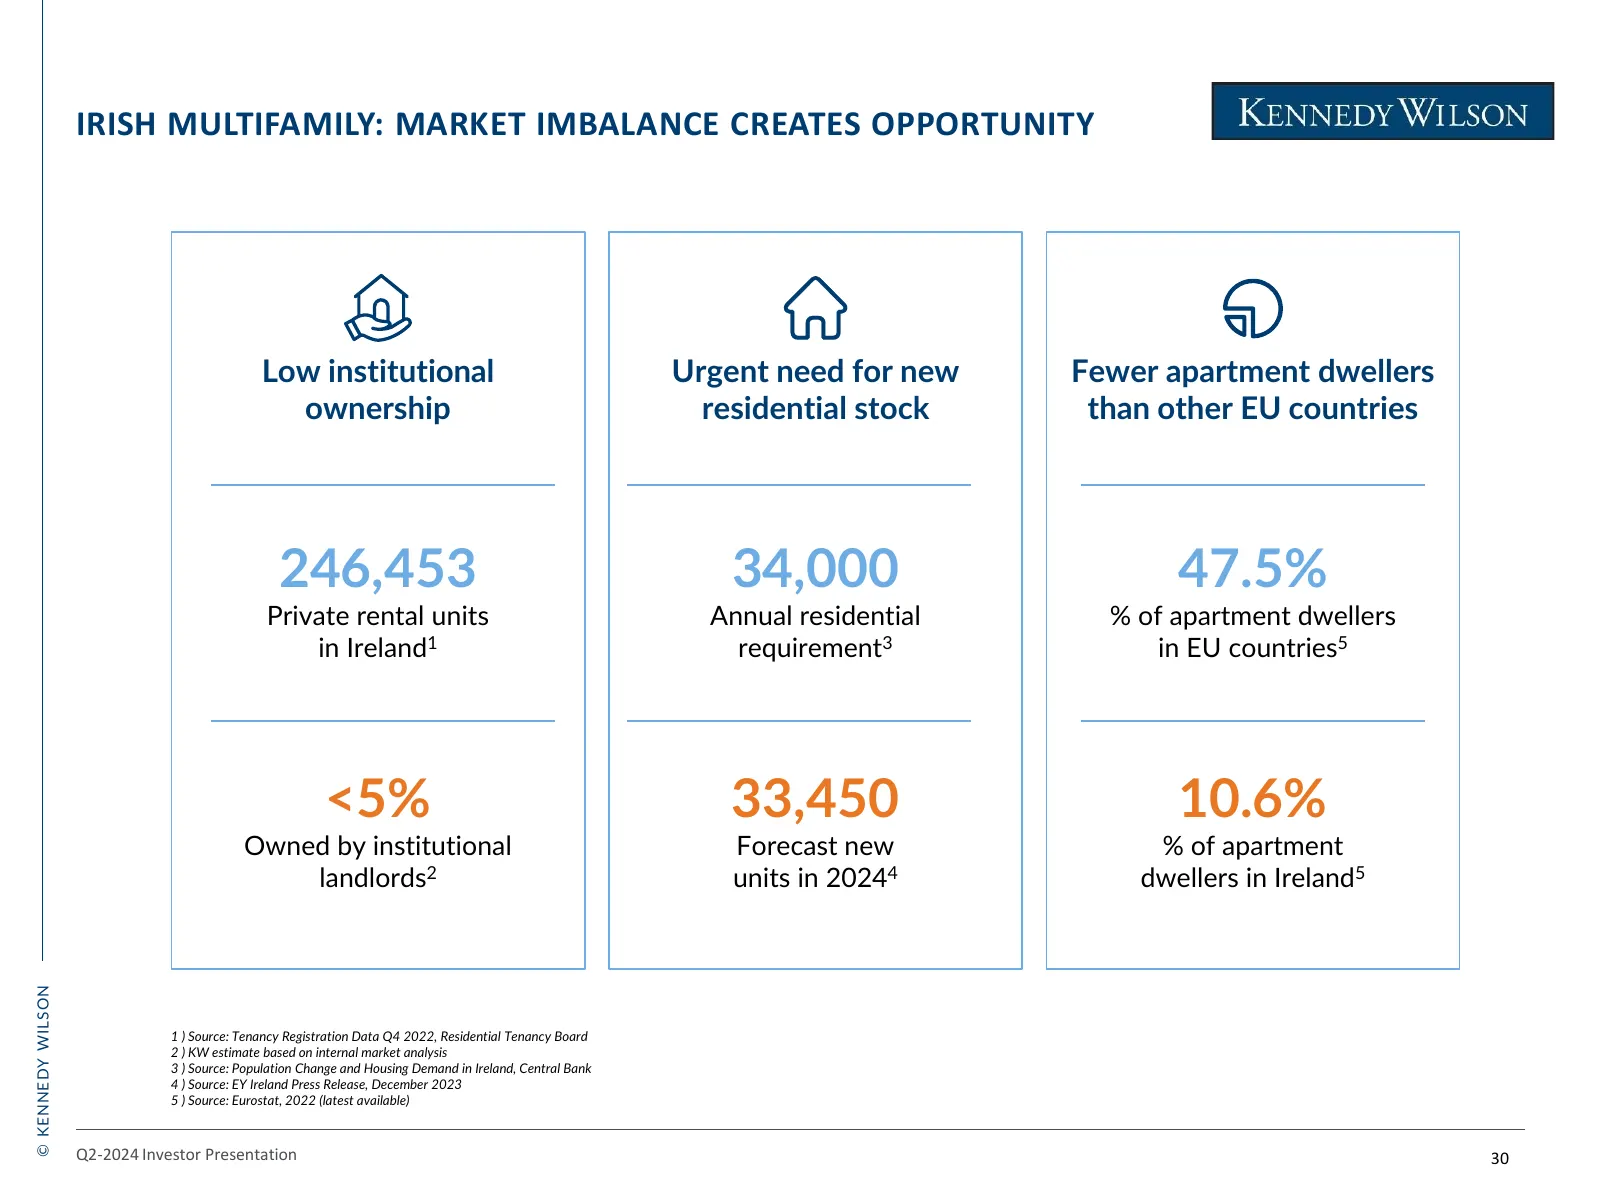
IRISH MULTIFAMILY: MARKET IMBALANCE CREATES OPPORTUNITY Low institutional Urgent need for new Fewer apartment dwellers ownership residential stock than other EU countries 246,453 34,000 47.5% Private rental units Annual residential % of apartment dwellers in Ireland1 requirement3 in EU countries5 <5
Slide 32: Strong Office Fundamentals and Favorable UK & Irish Lease Structures
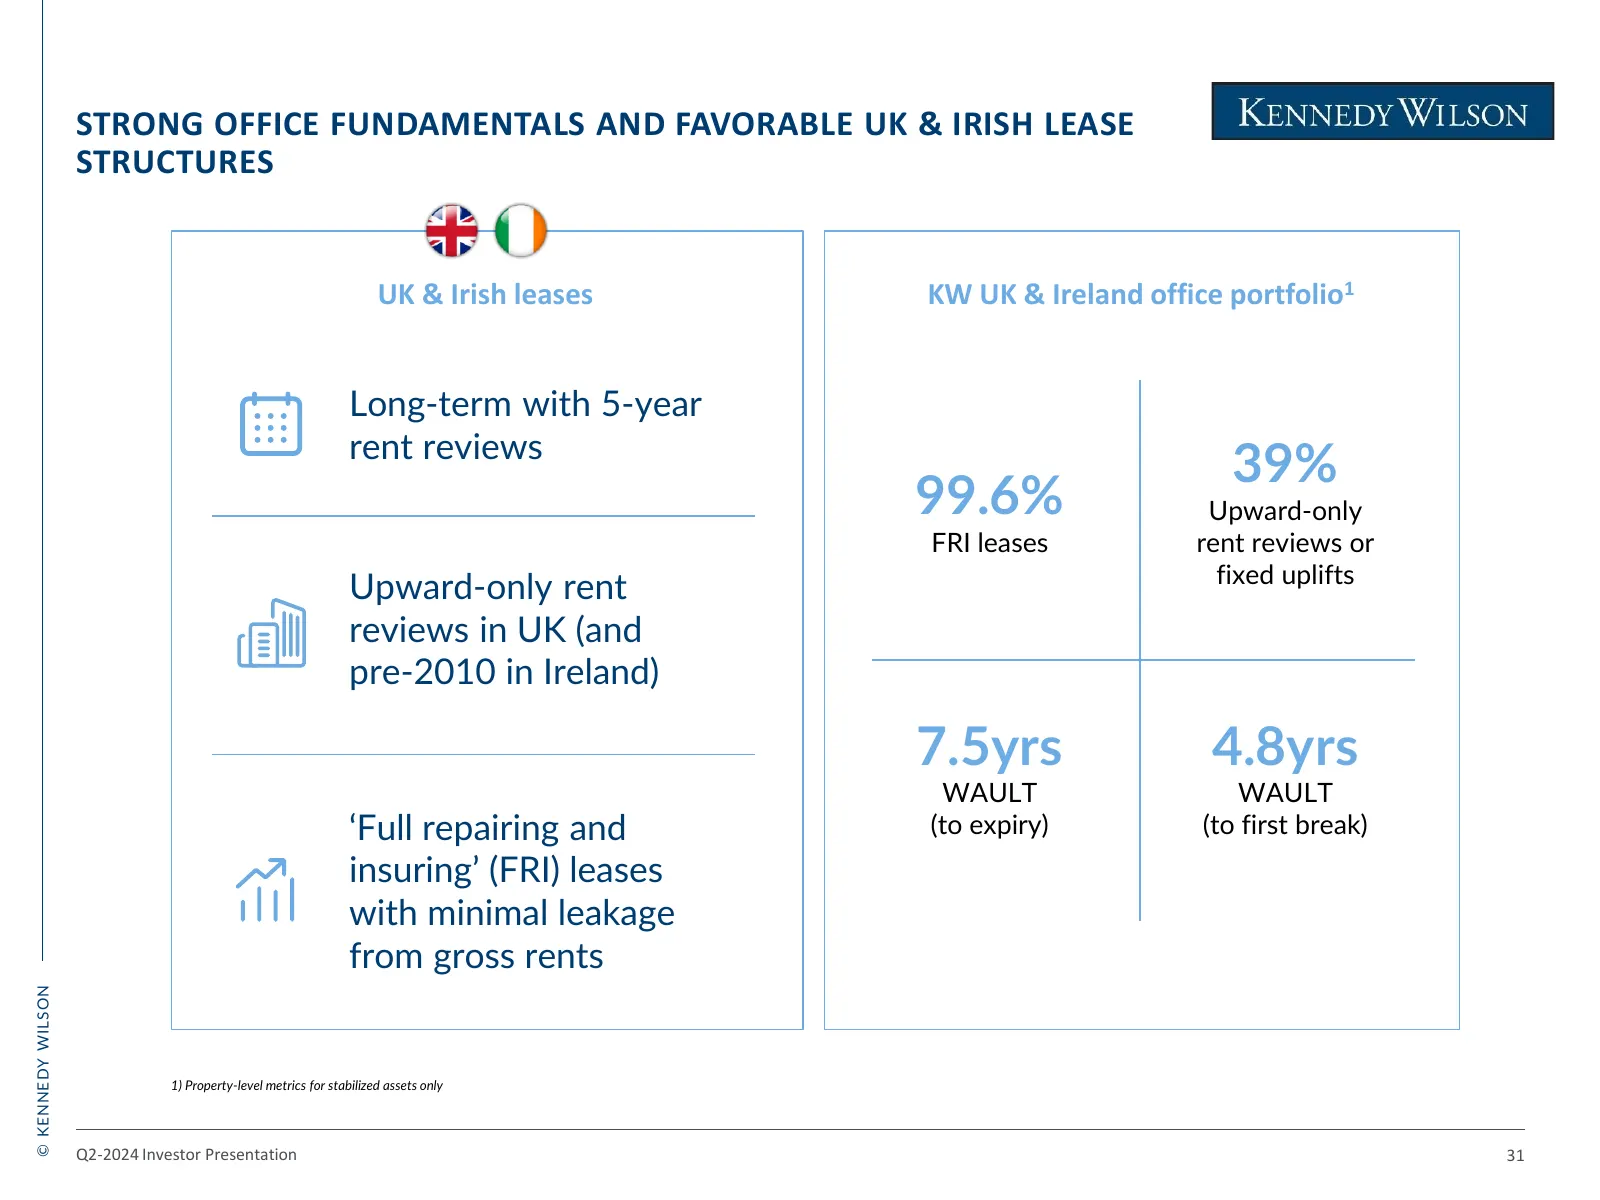
STRONG OFFICE FUNDAMENTALS AND FAVORABLE UK & IRISH LEASE STRUCTURES UK & Irish leases KW UK & Ireland office portfolio1 Long-term with 5-year rent reviews 39% 99.6% Upward-only FRI leases rent reviews or fixed uplifts Upward-only rent reviews in UK (and pre-2010 in Ireland) 7.5yrs 4.8yrs WAULT WAUL
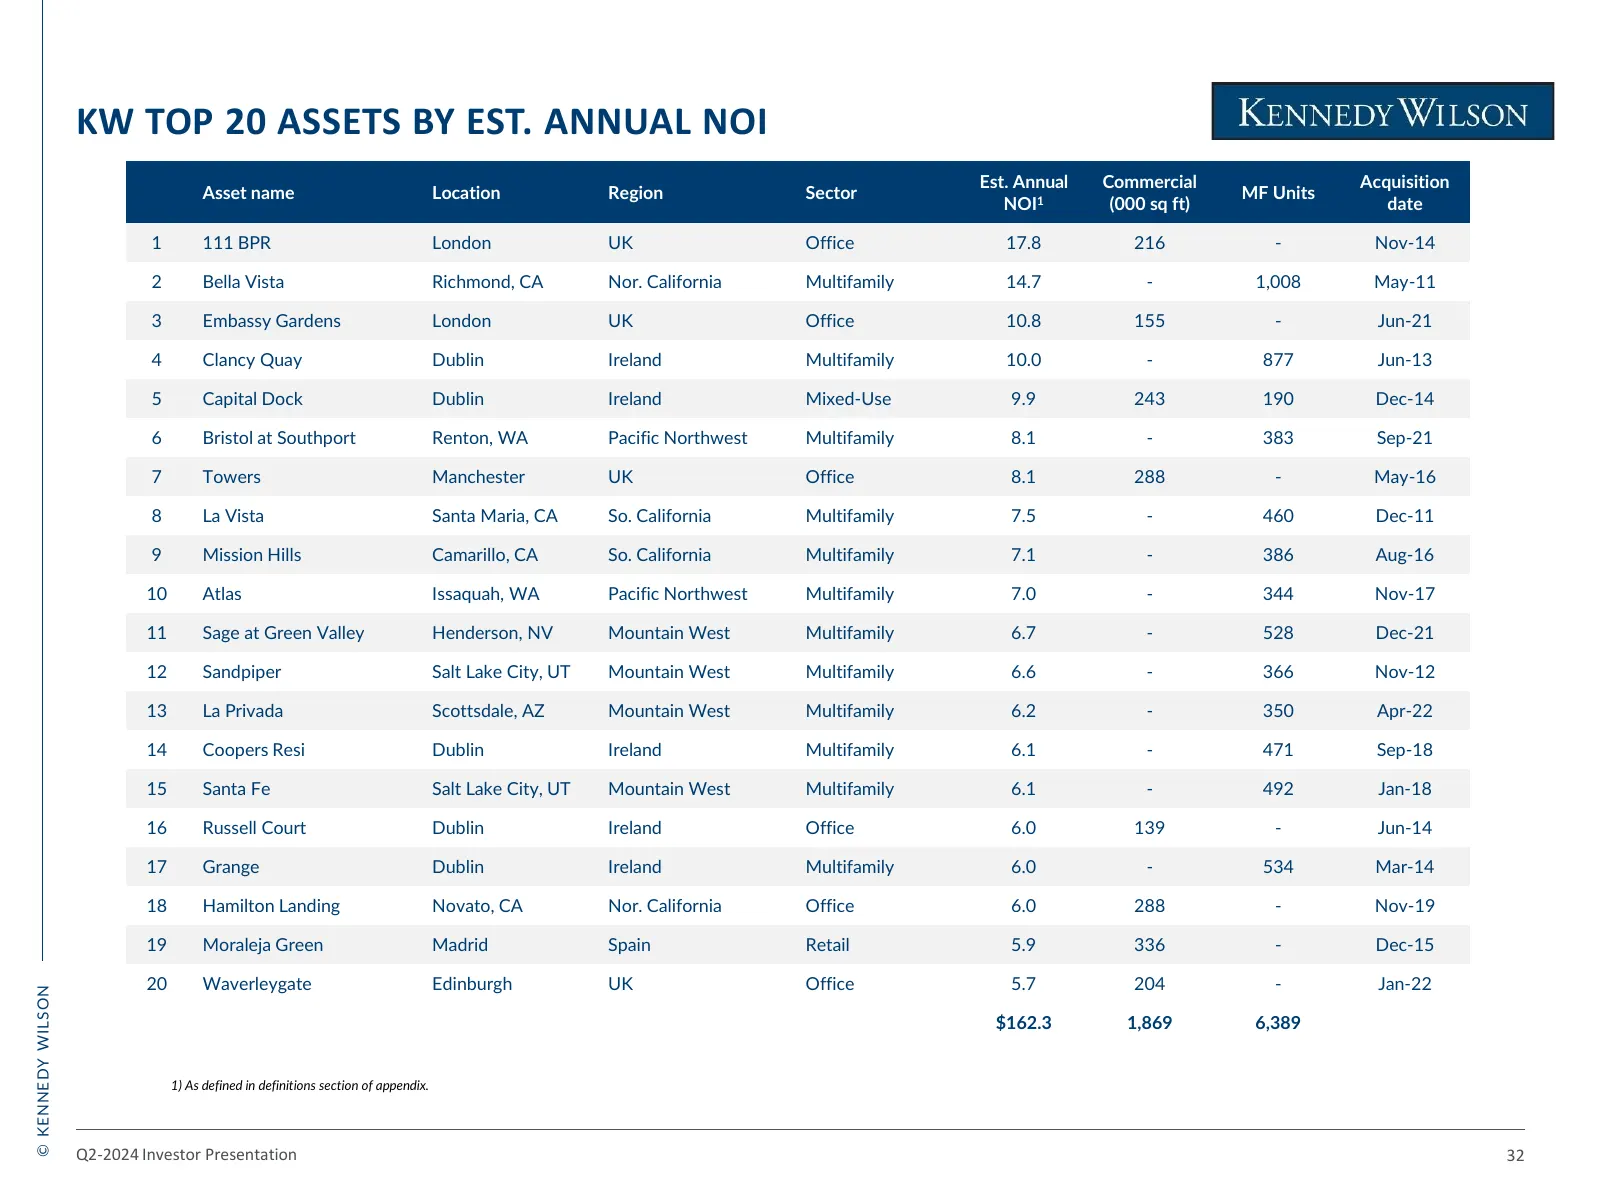
Slide 33: KW Top Assets by Est. Annual NOI
KW TOP 20 ASSETS BY EST. ANNUAL NOI Accounts Est. Annual Commercial Acquisition Asset name for 35% of Location Estimated Annual Region NOI Sector MF Units NOI1 (000 sq ft) date 1 111 BPR London UK Office 17.8 216 - Nov-14 2 Bella Vista Richmond, CA Nor. California Multifamily 14.7 - 1,008 May-11 3 E
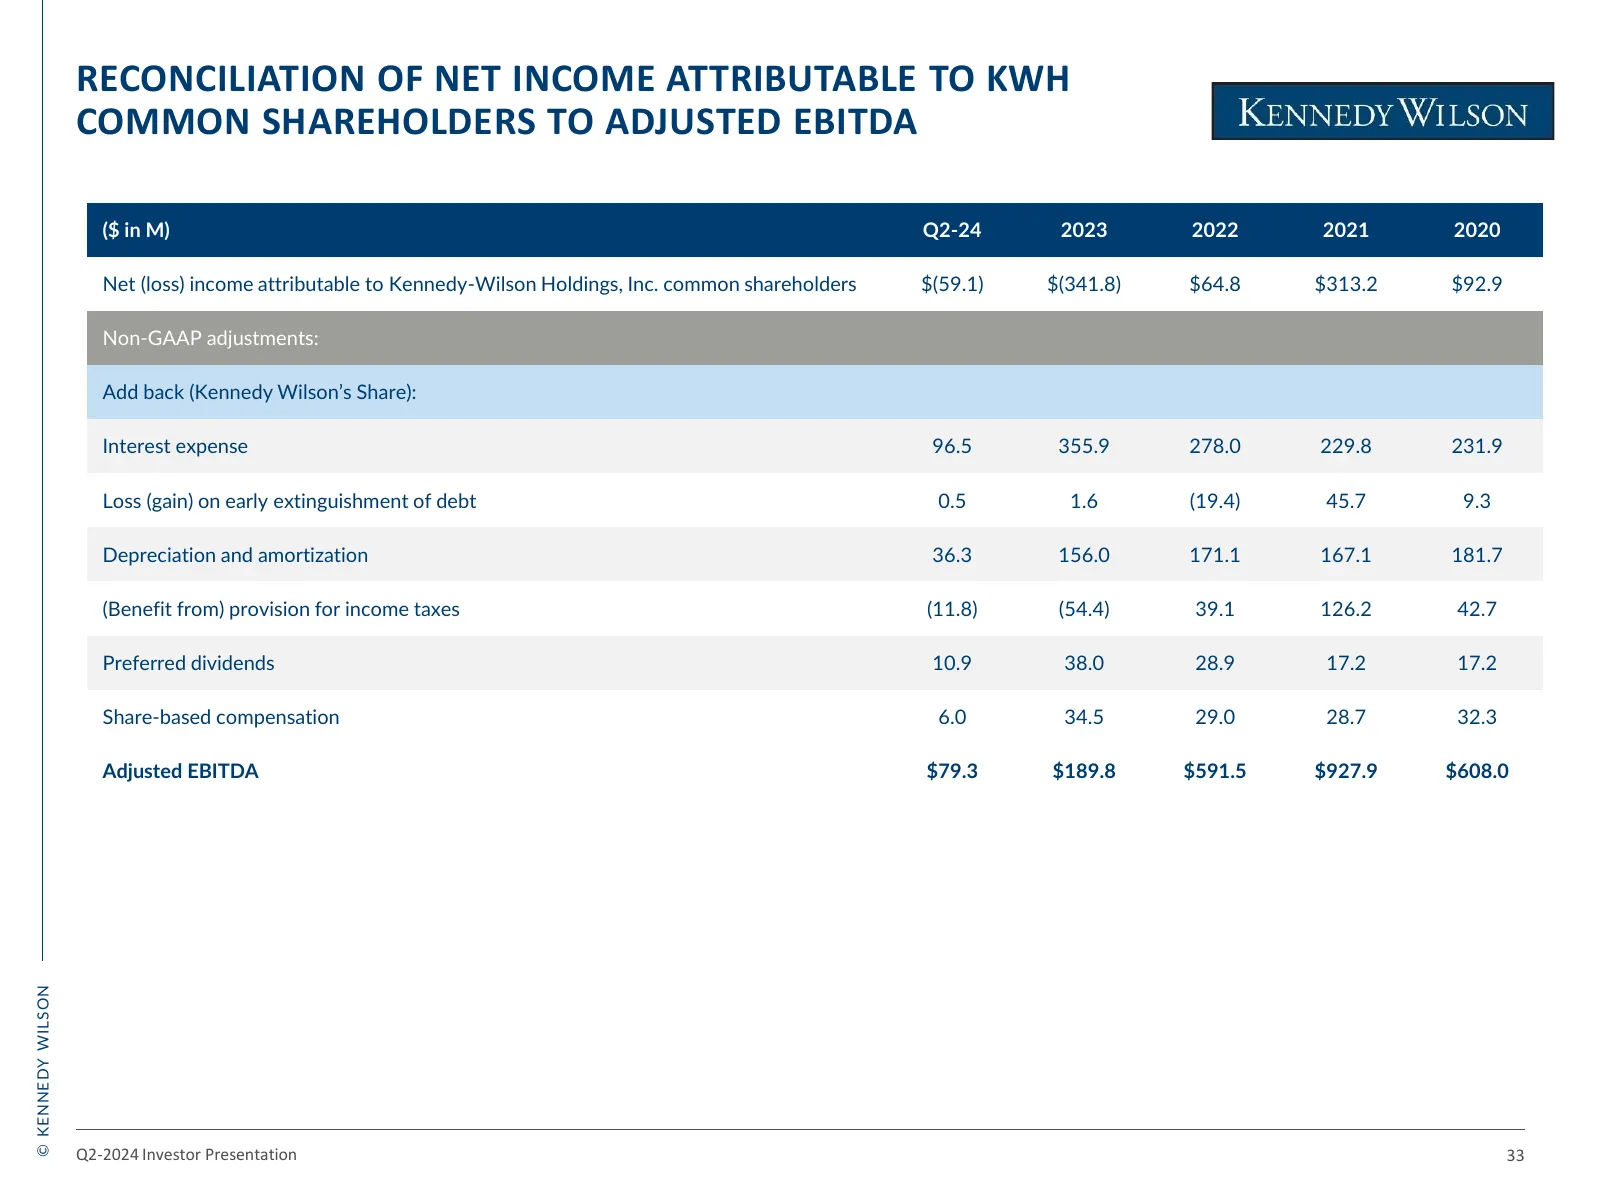
Slide 34: Reconciliation of Net Income to Adjusted EBITDA
RECONCILIATION OF NET INCOME ATTRIBUTABLE TO KWH COMMON SHAREHOLDERS TO ADJUSTED EBITDA ($ in M) Q2-24 2023 2022 2021 2020 Net (loss) income attributable to Kennedy-Wilson Holdings, Inc. common shareholders $(59.1) $(341.8) $64.8 $313.2 $92.9 Non-GAAP adjustments: Add back (Kennedy Wilson’s Share):
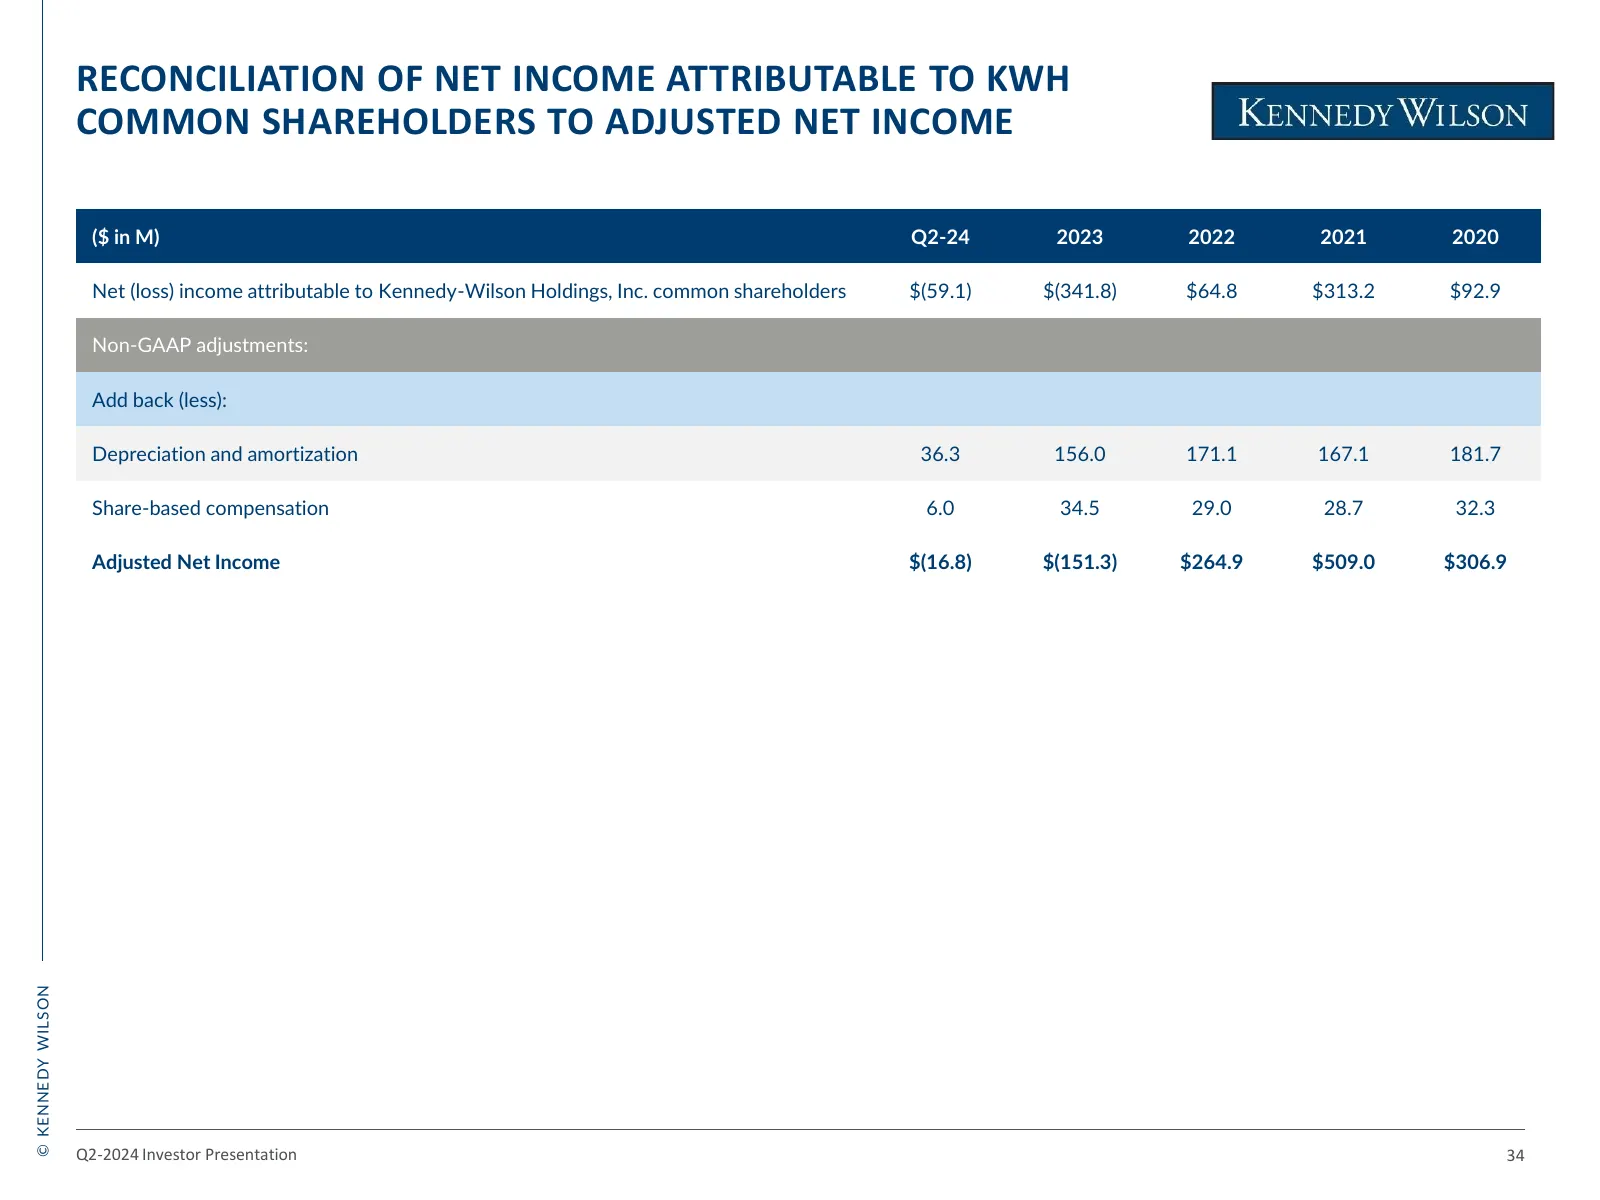
Slide 35: Reconciliation of Net Income to Adjusted Net Income
RECONCILIATION OF NET INCOME ATTRIBUTABLE TO KWH COMMON SHAREHOLDERS TO ADJUSTED NET INCOME ($ in M) Q2-24 2023 2022 2021 2020 Net (loss) income attributable to Kennedy-Wilson Holdings, Inc. common shareholders $(59.1) $(341.8) $64.8 $313.2 $92.9 Non-GAAP adjustments: Add back (less): Depreciation a
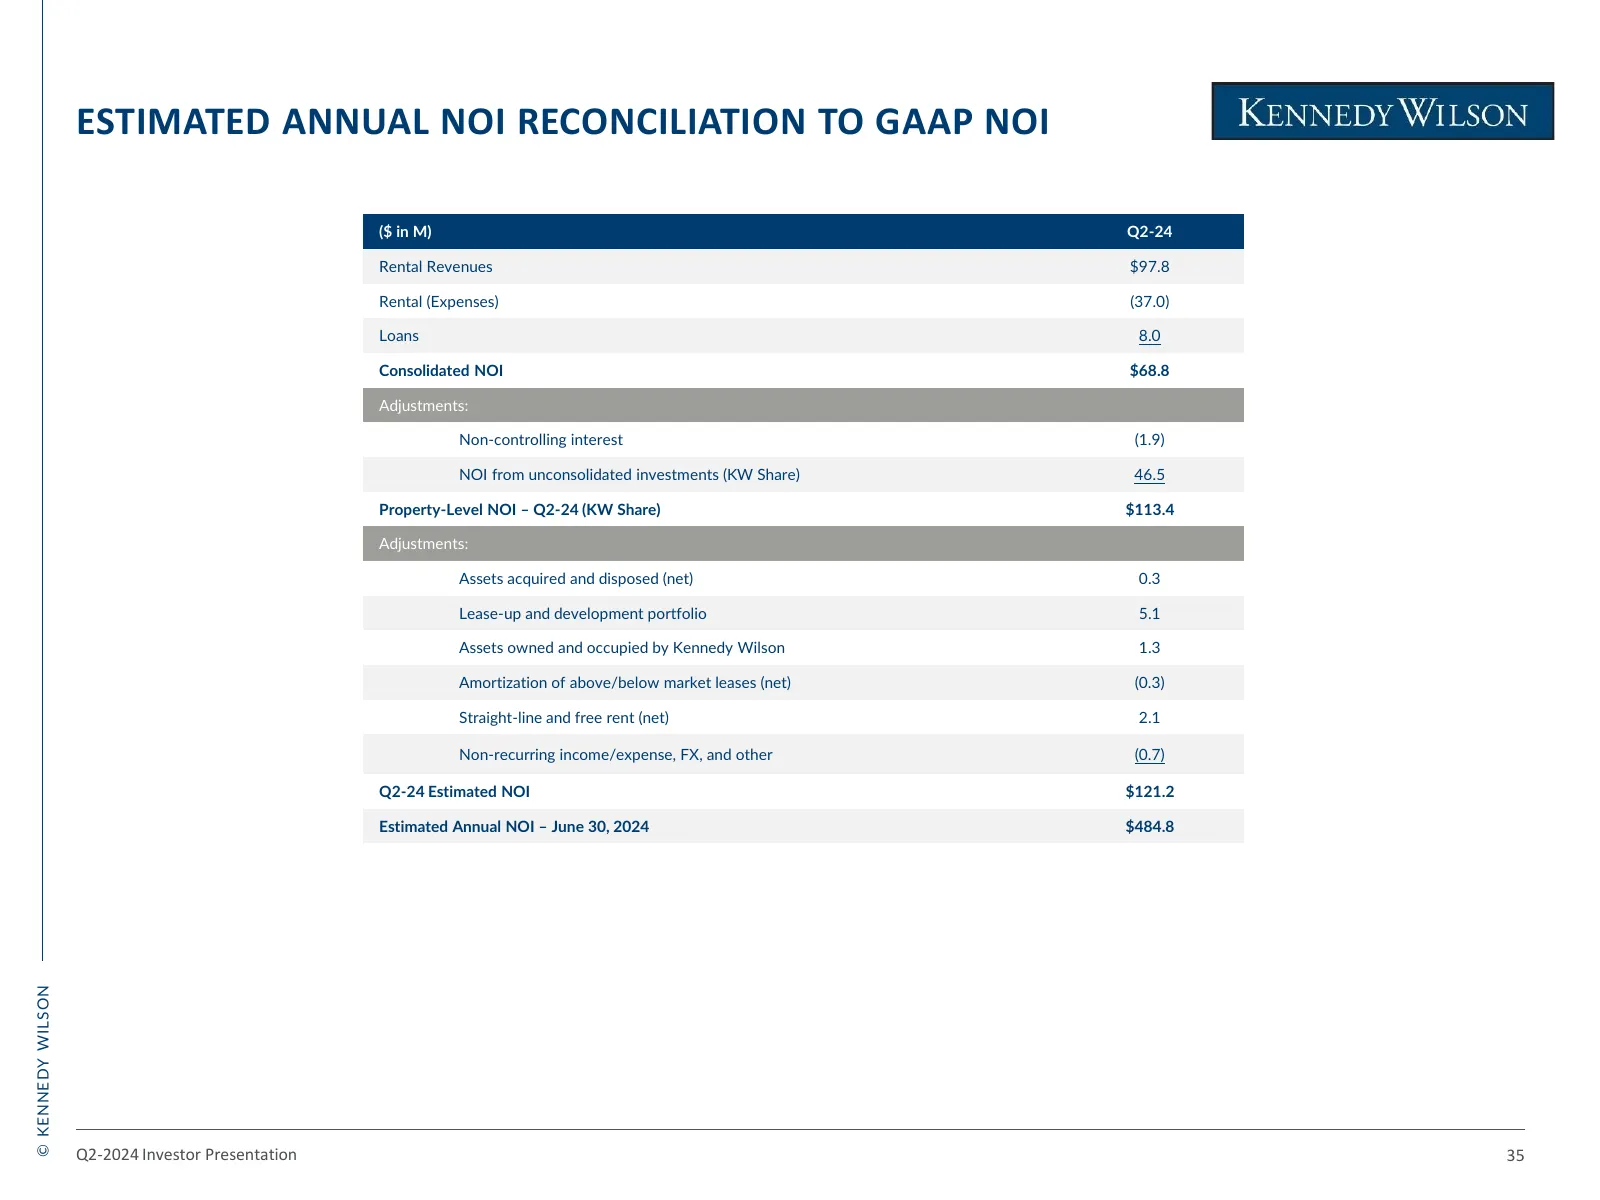
Slide 36: Estimated Annual NOI Reconciliation to GAAP NOI
ESTIMATED ANNUAL NOI RECONCILIATION TO GAAP NOI ($ in M) Q2-24 Rental Revenues $97.8 Rental (Expenses) (37.0) Loans 8.0 Consolidated NOI $68.8 Adjustments: Non-controlling interest (1.9) NOI from unconsolidated investments (KW Share) 46.5 Property-Level NOI – Q2-24 (KW Share) $113.4 Adjustments: Ass
Slide 37: Appendix: Definitions
APPENDIX DEFINITIONS: Adjusted EBITDA represents net income before interest expense, loss (gain) on early extinguishment of debt, our share of interest expense included in unconsolidated investments, depreciation and amortization, our share of depreciation and amortization included in unconsolidated
Source: company website
More decks from Kennedy-Wilson Holdings Inc.
 Q3 2025 Earnings Presentation39 slides · November 2025
 Q2 2025 Earnings Presentation35 slides · August 2025
 Q1 2025 Earnings Presentation34 slides · May 8, 2025
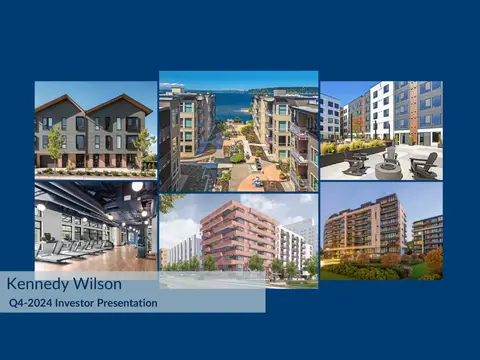 Q4 2024 Earnings Presentation33 slides · Feb 27, 2025
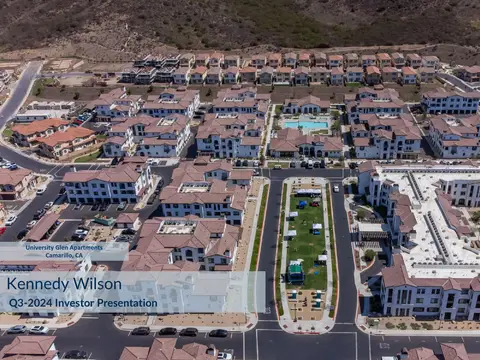 Q3 2024 Earnings Presentation36 slides · Nov 7, 2024
 Investor Presentation (October 2024)27 slides · October 2024