Guaranty Bancorp — Sterne Agee Investor Conference 2014
23 slides from Guaranty Bancorp's conference presentation, Feb 13, 2014

Slide 1: Sterne Agee Investor Conference Boca Raton, FL February 2014
Sterne Agee Investor Conference Boca Raton, FL February 2014
Slide 2: Forward-looking statements
This presentation contains forward-looking statements, which are included in accordance with the “safe harbor” provisions of the Private Securities Litigation Reform Act of 1995. In some cases, you can identify forward-looking statements by terminology such as “may,” “will,” “should,” “could,” “can,
Slide 3: About Us – Guaranty Bancorp
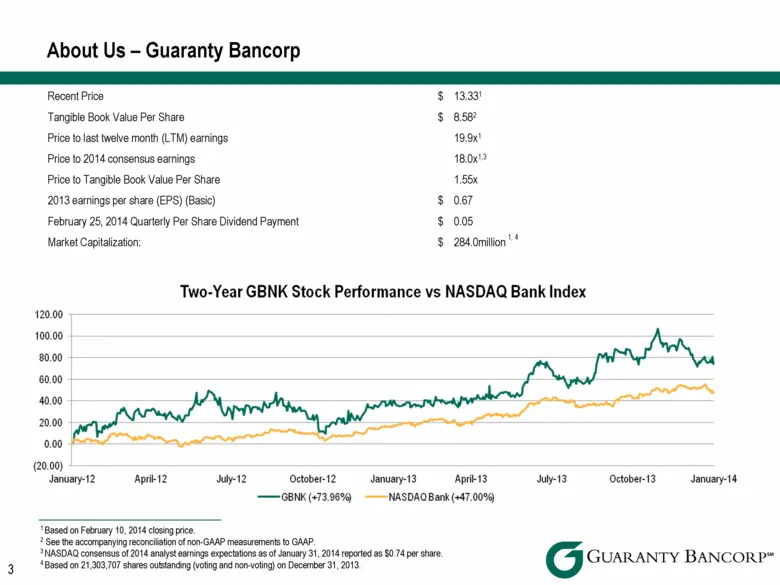
Recent Price $ 13.331 Tangible Book Value Per Share $ 8.582 Price to last twelve month (LTM) earnings 19.9x1 Price to 2014 consensus earnings 18.0x1,3 Price to Tangible Book Value Per Share 1.55x 2013 earnings per share (EPS) (Basic) $ 0.67 February 25, 2014 Quarterly Per Share Dividend Payment $ 0.
Slide 4: About Us - Guaranty Bancorp
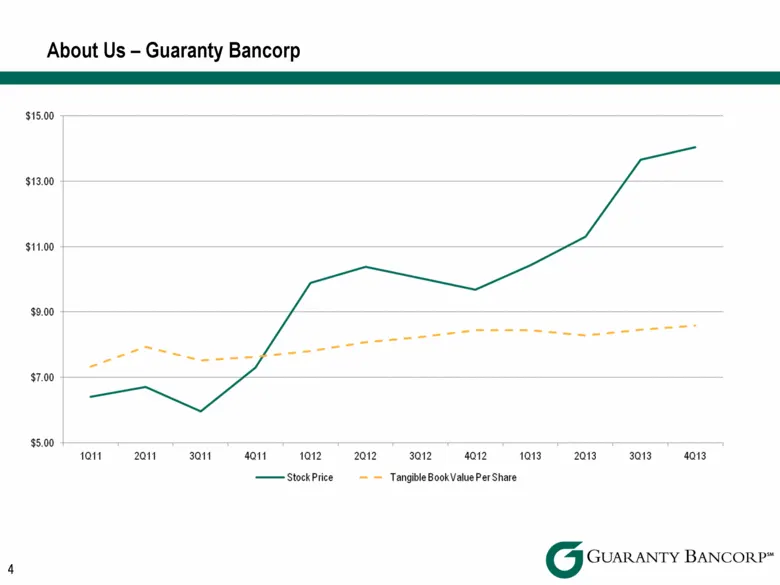
About Us - Guaranty Bancorp $13.00 $11.00 $9.00 $7.00 $5.00 fort 2011 sat, dat t0nearz 302 aa t03, 21s, s013 ats —StockPrice ~~ Tangible BookValuePer Share Govrranry BANCORP*
Slide 5: Guaranty Bancorp is uniquely positioned in the Colorado market
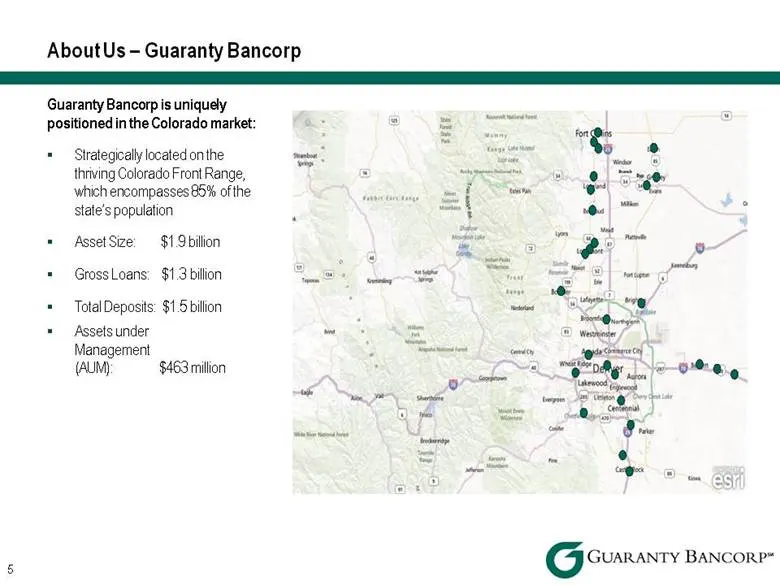
Guaranty Bancorp is uniquely positioned in the Colorado market: Strategically located on the thriving Colorado Front Range, which encompasses 85% of the state’s population Asset Size: $1.9 billion Gross Loans: $1.3 billion Total Deposits: $1.5 billion Assets under Management (AUM): $463 million Abou
Slide 6: Investment Considerations
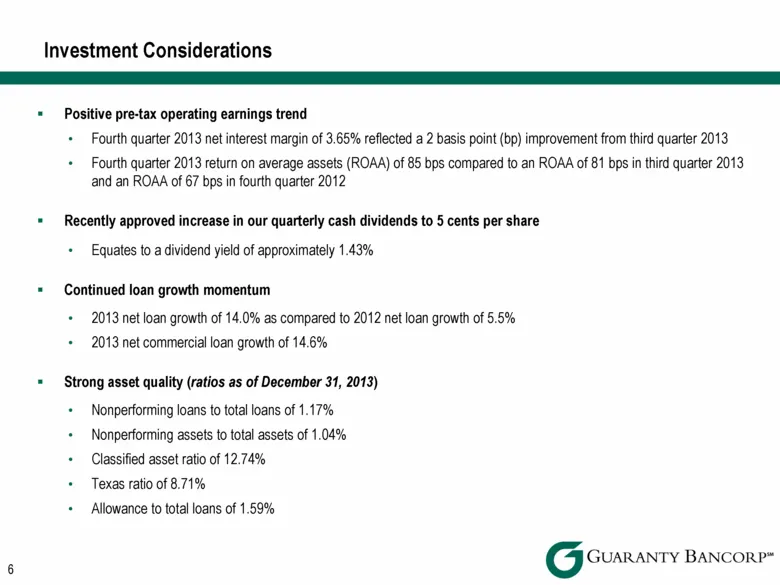
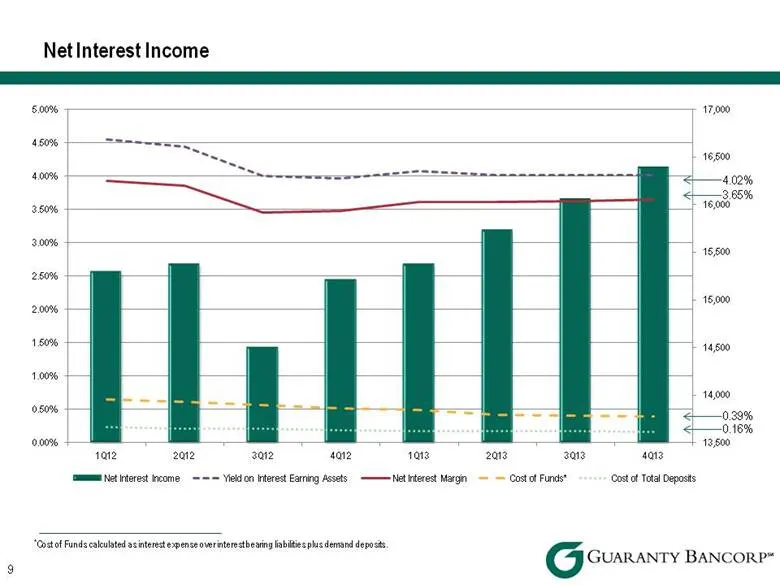
Positive pre-tax operating earnings trend Fourth quarter 2013 net interest margin of 3.65% reflected a 2 basis point (bp) improvement from third quarter 2013 Fourth quarter 2013 return on average assets (ROAA) of 85 bps compared to an ROAA of 81 bps in third quarter 2013 and an ROAA of 67 bps in fou
Slide 7: Investment Considerations: core deposits and noninterest income
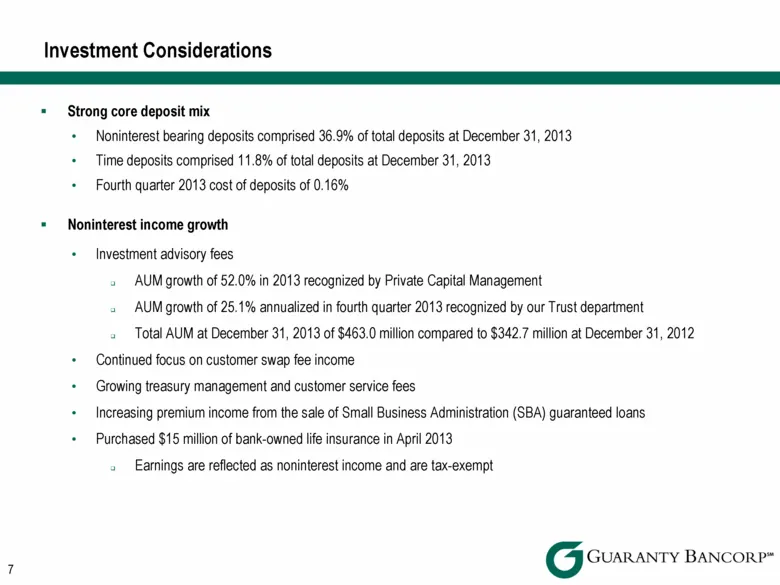
Strong core deposit mix Noninterest bearing deposits comprised 36.9% of total deposits at December 31, 2013 Time deposits comprised 11.8% of total deposits at December 31, 2013 Fourth quarter 2013 cost of deposits of 0.16% Noninterest income growth Investment advisory fees AUM growth of 52.0% in 201
Slide 8: Investment Considerations: capital structure and expense management
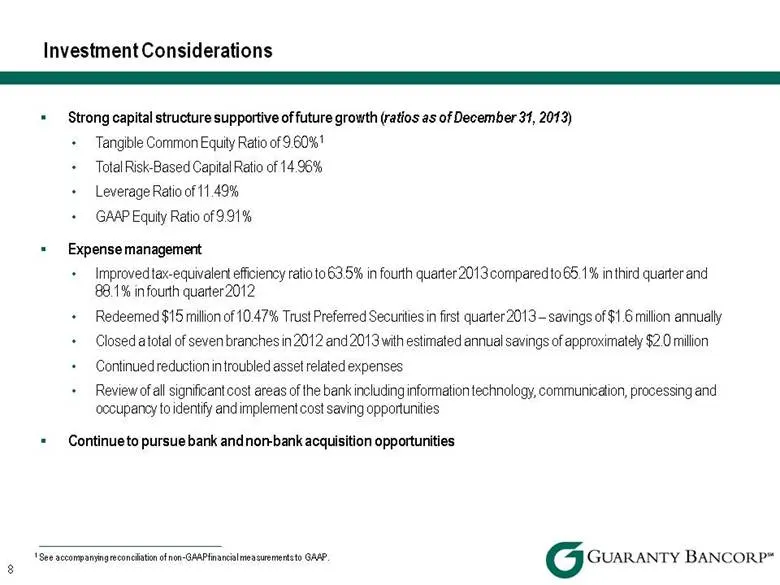
Strong capital structure supportive of future growth (ratios as of December 31, 2013) Tangible Common Equity Ratio of 9.60%1 Total Risk-Based Capital Ratio of 14.96% Leverage Ratio of 11.49% GAAP Equity Ratio of 9.91% Expense management Improved tax-equivalent efficiency ratio to 63.5% in fourth qua
Slide 9: Net Interest Income
Net Interest Income 9 *Cost of Funds calculated as interest expense over interest bearing liabilities plus demand deposits. 4.02% 3.65% 0.16% 0.39%
Slide 10: Core Noninterest Income and Tax Equivalent Efficiency Ratio
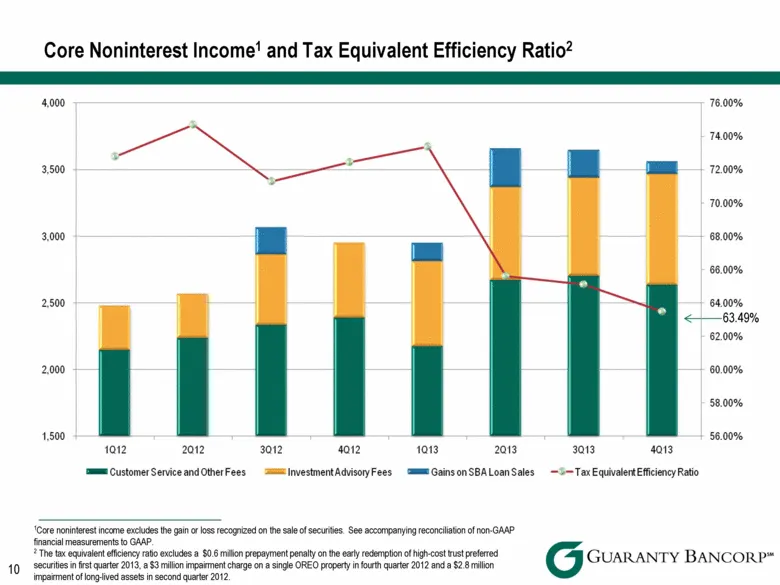
Core Noninterest Income1 and Tax Equivalent Efficiency Ratio2 1Core noninterest income excludes the gain or loss recognized on the sale of securities. See accompanying reconciliation of non-GAAP financial measurements to GAAP. 2 The tax equivalent efficiency ratio excludes a $0.6 million prepayment
Slide 11: December 31, 2013 Loan Composition
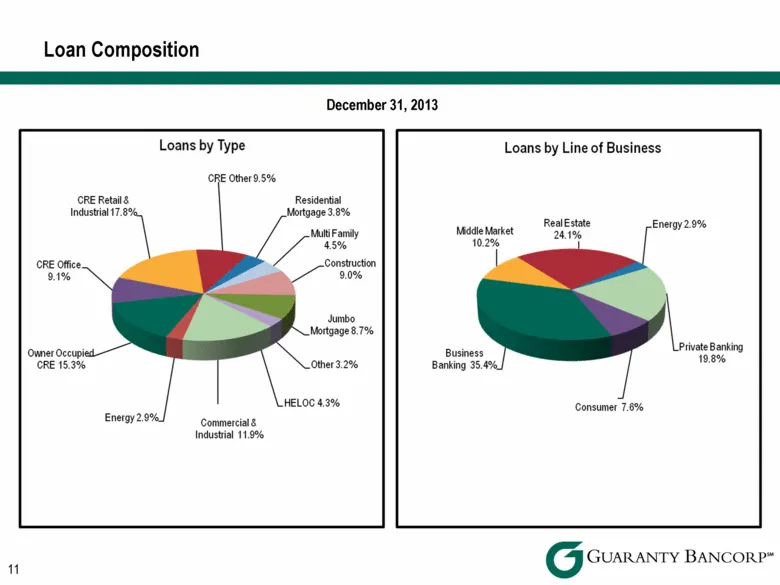
December 31, 2013 Loan Composition 11
Slide 12: Loan Growth
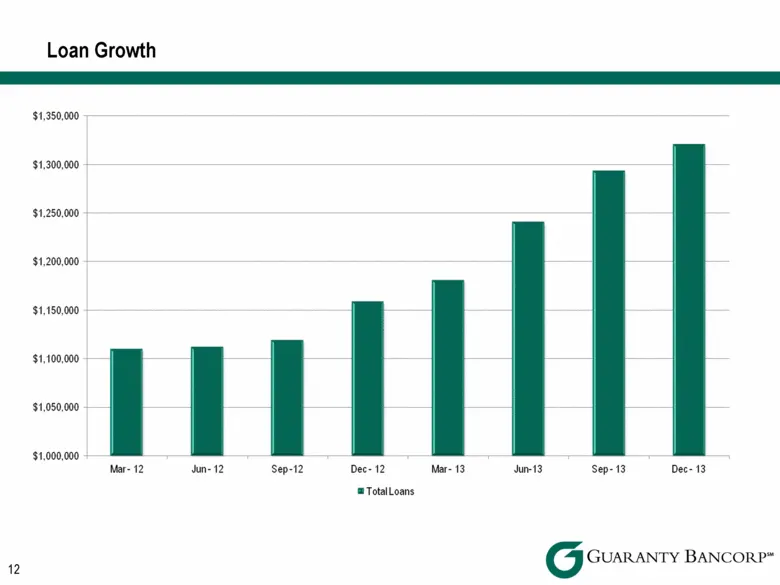
Loan Growth 12 $1,380,000 $1,300,000 $1,250,000 $1,200,000 $1,150,000 $1,100,000 $1,050,000 $1,000,000 Sep-t2 Dec- 12 ‘= TotalLoans ut Sep-13 G GUARANTY BANCORP*
Slide 13: Classified Assets
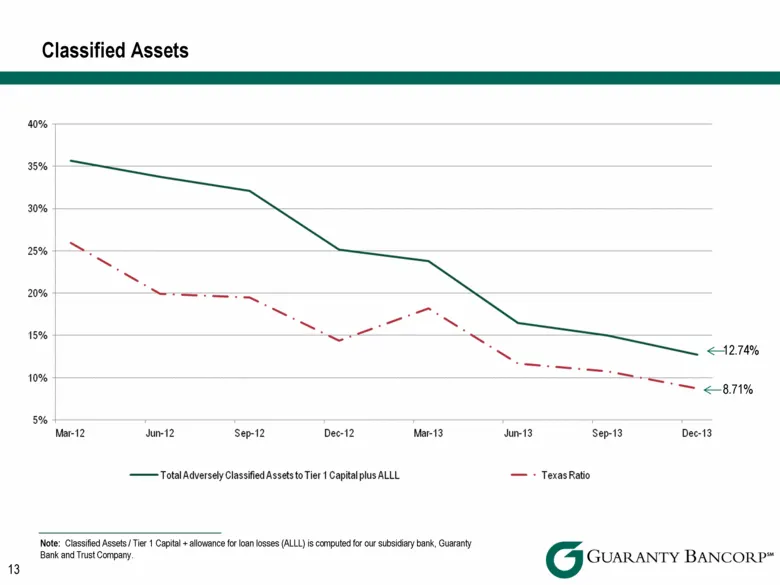
Note: Classified Assets / Tier 1 Capital + allowance for loan losses (ALLL) is computed for our subsidiary bank, Guaranty Bank and Trust Company. Classified Assets 13 12.74% 8.71%
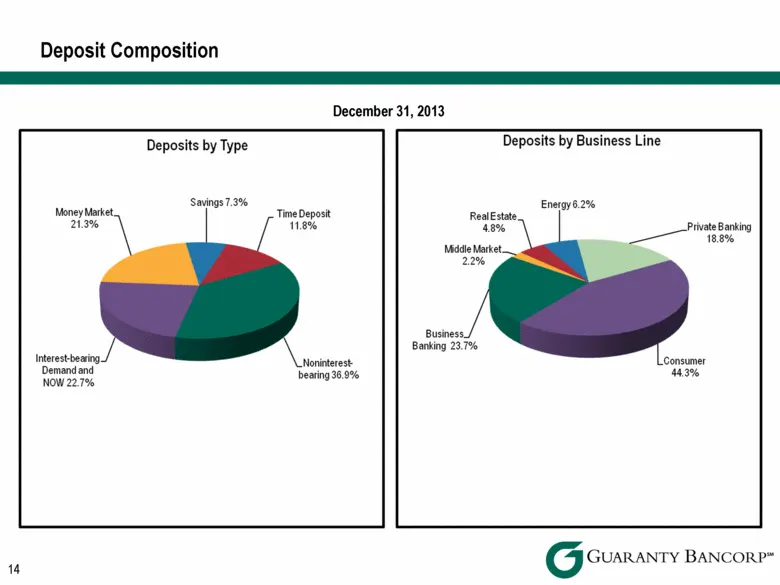
Slide 14: Deposit Composition December 31, 2013
Deposit Composition December 31, 2013 14
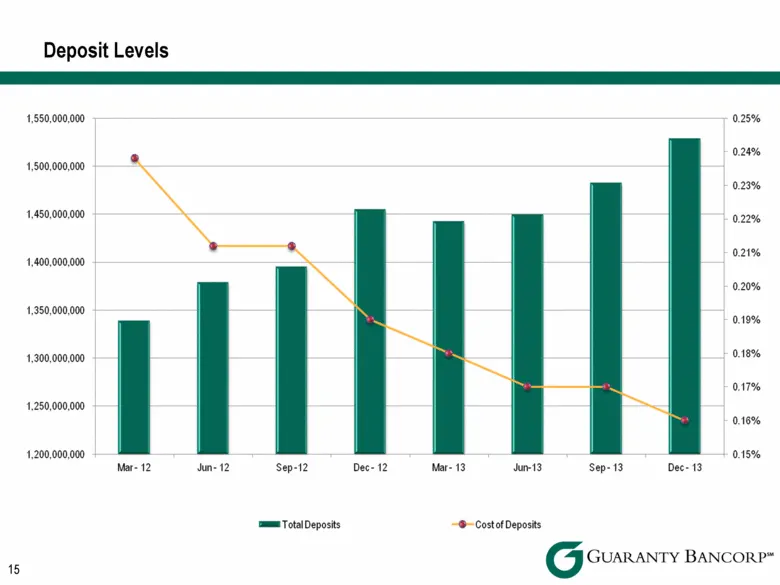
Slide 15: Deposit Levels
Deposit Levels 18 1.550,000,000 1,500,000,000 1,450,000,000 1,400,000,000 1,350,000,000 1,300,000,000 1,250,000,000 1,200,000,000 Mar=12 ne 12 Total Deposits Dee= 12 Mar= 13 unt -@-Costot Deposits 0.25% 0.24% 0.17% 0.16% 0.15% Sep 13 Dee 13 Gorseanry BANCORP*
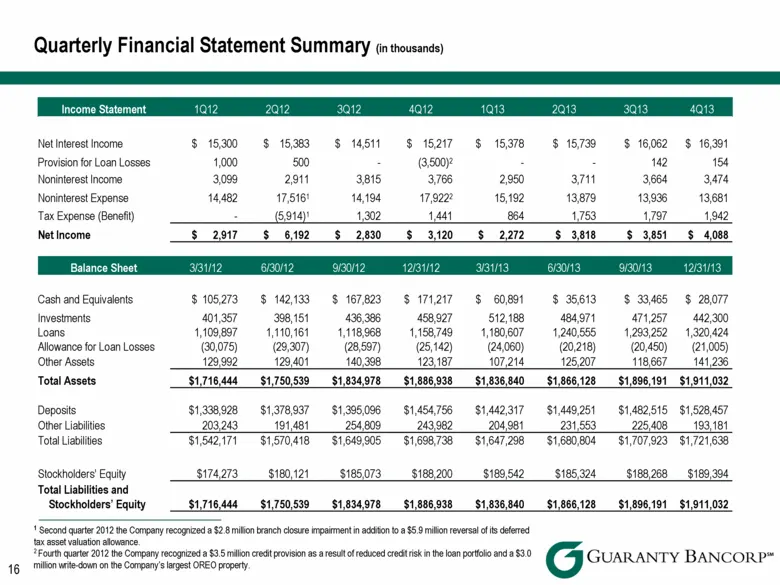
Slide 16: Income Statement and Balance Sheet
Income Statement 1Q12 2Q12 3Q12 4Q12 1Q13 2Q13 3Q13 4Q13 Net Interest Income $ 15,300 $ 15,383 $ 14,511 $ 15,217 $ 15,378 $ 15,739 $ 16,062 $ 16,391 Provision for Loan Losses 1,000 500 - (3,500)2 - - 142 154 Noninterest Income 3,099 2,911 3,815 3,766 2,950 3,711 3,664 3,474 Noninterest Expense 14,48

Slide 17: Colorado Market
Colorado Market Govreant Y BANCORP"
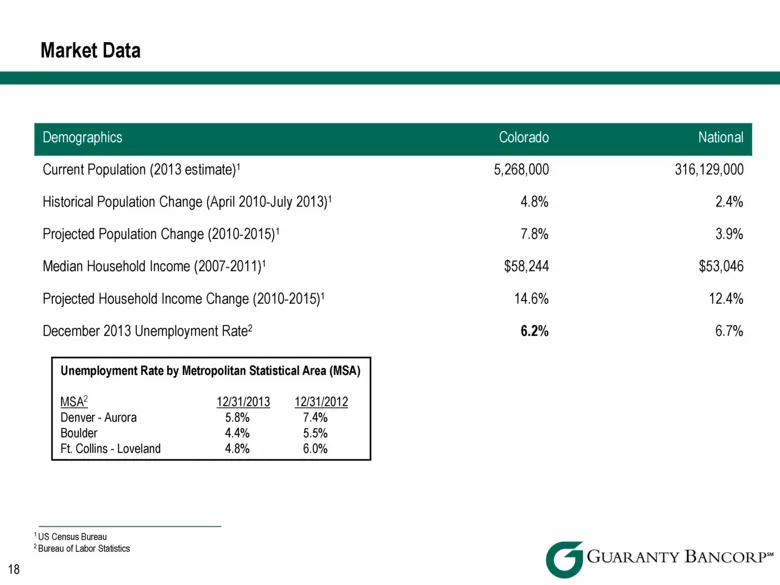
Slide 18: Demographics
Demographics Colorado National Current Population (2013 estimate)1 5,268,000 316,129,000 Historical Population Change (April 2010-July 2013)1 4.8% 2.4% Projected Population Change (2010-2015)1 7.8% 3.9% Median Household Income (2007-2011)1 $58,244 $53,046 Projected Household Income Change (2010-2015
Slide 19: Business Climate
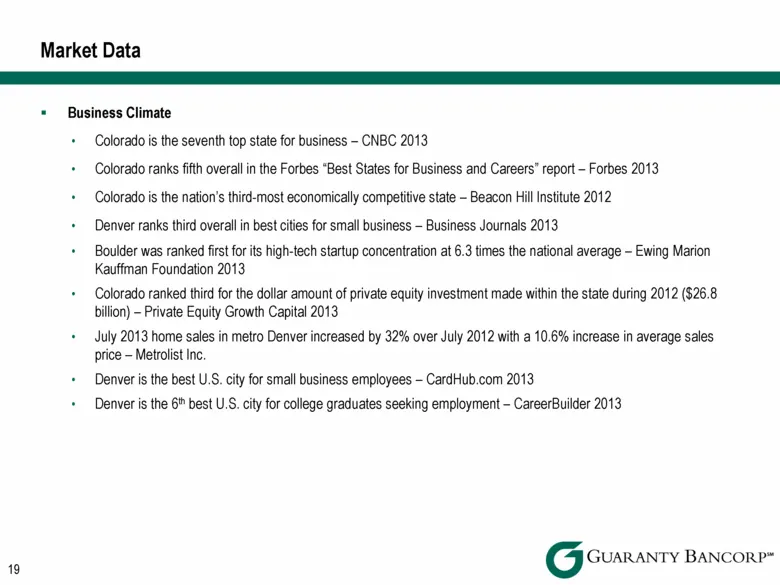
Business Climate Colorado is the seventh top state for business – CNBC 2013 Colorado ranks fifth overall in the Forbes “Best States for Business and Careers” report – Forbes 2013 Colorado is the nation’s third-most economically competitive state – Beacon Hill Institute 2012 Denver ranks third overal
Slide 20: Growth
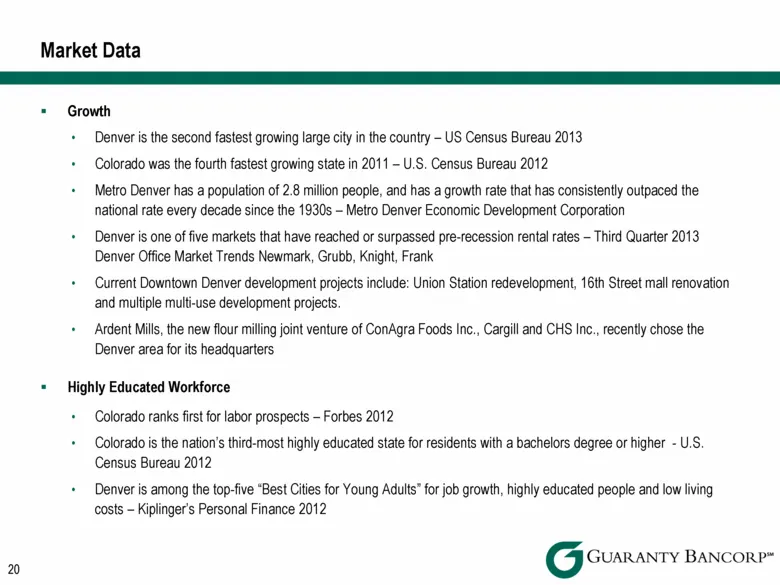
Growth Denver is the second fastest growing large city in the country – US Census Bureau 2013 Colorado was the fourth fastest growing state in 2011 – U.S. Census Bureau 2012 Metro Denver has a population of 2.8 million people, and has a growth rate that has consistently outpaced the national rate ev
Slide 21: Reconciliation of Non-GAAP Financial Measures
Reconciliation of Non-GAAP Financial Measures 21
Slide 22: Tangible Book Value and Tangible Common Equity Ratio
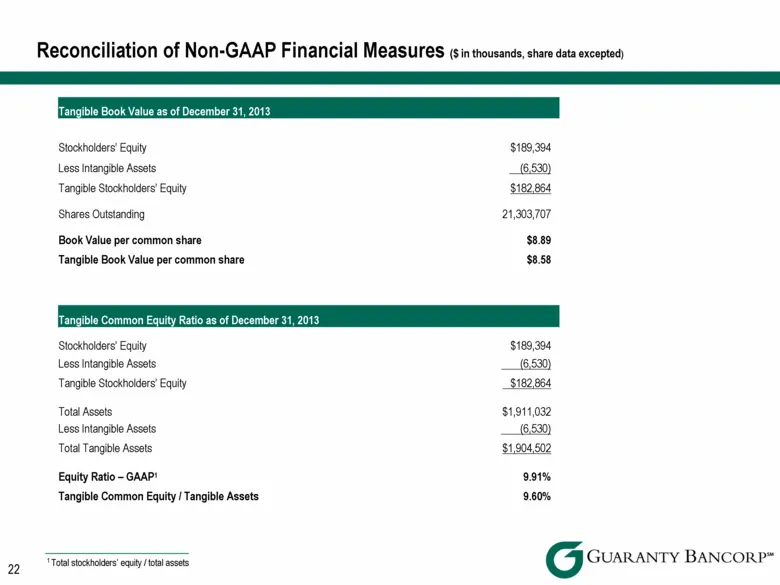
Tangible Book Value as of December 31, 2013 Stockholders’ Equity $189,394 Less Intangible Assets (6,530) Tangible Stockholders’ Equity $182,864 Shares Outstanding 21,303,707 Book Value per common share $8.89 Tangible Book Value per common share $8.58 Tangible Common Equity Ratio as of December 31, 2
Slide 23: Pre-tax Operating Earnings and Core Noninterest Income
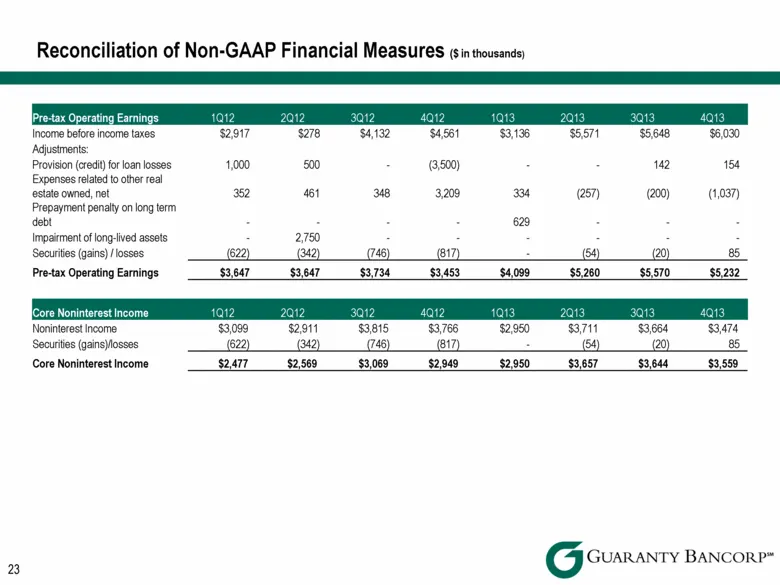
Pre-tax Operating Earnings 1Q12 2Q12 3Q12 4Q12 1Q13 2Q13 3Q13 4Q13 Income before income taxes $2,917 $278 $4,132 $4,561 $3,136 $5,571 $5,648 $6,030 Adjustments: Provision (credit) for loan losses 1,000 500 - (3,500) - - 142 154 Expenses related to other real estate owned, net 352 461 348 3,209 334 (
Source: SEC EDGAR · 8-K filed Feb 13, 2014
More decks from Guaranty Bancorp
 Merger or Acquisition (May 2018)19 slides · May 23, 2018
 Merger or Acquisition (July 2017)8 slides · Jul 19, 2017
 D.A. Davidson 19th Annual Financial Services Conference 201722 slides · May 9, 2017
 FIG Partners 8th Annual West Coast Bank CEO Forum 201727 slides · Jan 31, 2017
 2016 FBR 23rd Annual Investor Conference27 slides · Nov 28, 2016
 2016 KBW Community Bank Investor Conference26 slides · Aug 1, 2016