Guaranty Bancorp — 2016 FBR 23rd Annual Investor Conference
27 slides from Guaranty Bancorp's conference presentation, Nov 28, 2016
Slide 1: 2016 FBR 23rd Annual Investor Conference
2016 FBR 23rd Annual Investor Conference New York, NY November 29, 2016 Forward Looking Statements This presentation contains forward-looking statements, which are included in accordance with the “safe harbor” provisions of the Private Securities Litigation Reform Act of 1995. In some cases, you can
Slide 2: Forward Looking Statements
Forward Looking Statements This presentation contains forward-looking statements, which are included in accordance with the “safe harbor” provisions of the Private Securities Litigation Reform Act of 1995. In some cases, you can identify forward-looking statements by terminology such as “may,” “will
Slide 3: Guaranty Bancorp – About Us
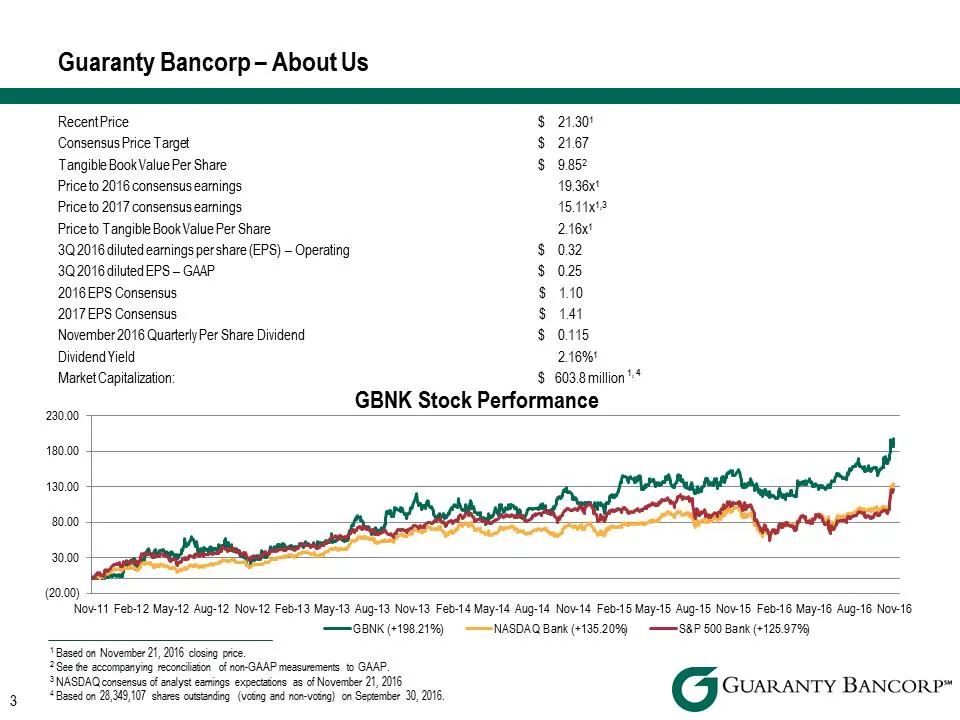
Guaranty Bancorp – About Us Recent Price $21.30 1 Consensus Price Target $21.67 Tangible Book Value Per Share $9.852 Price to 2016 consensus earnings 19.36 x1 Price to 2017 consensus earnings 15.11 x1, 3 Price to Tangible Book Value Per Share 2.16 x1 3Q 2016 diluted earnings per share (EPS) – Operat
Slide 4: About Us – Guaranty Bancorp
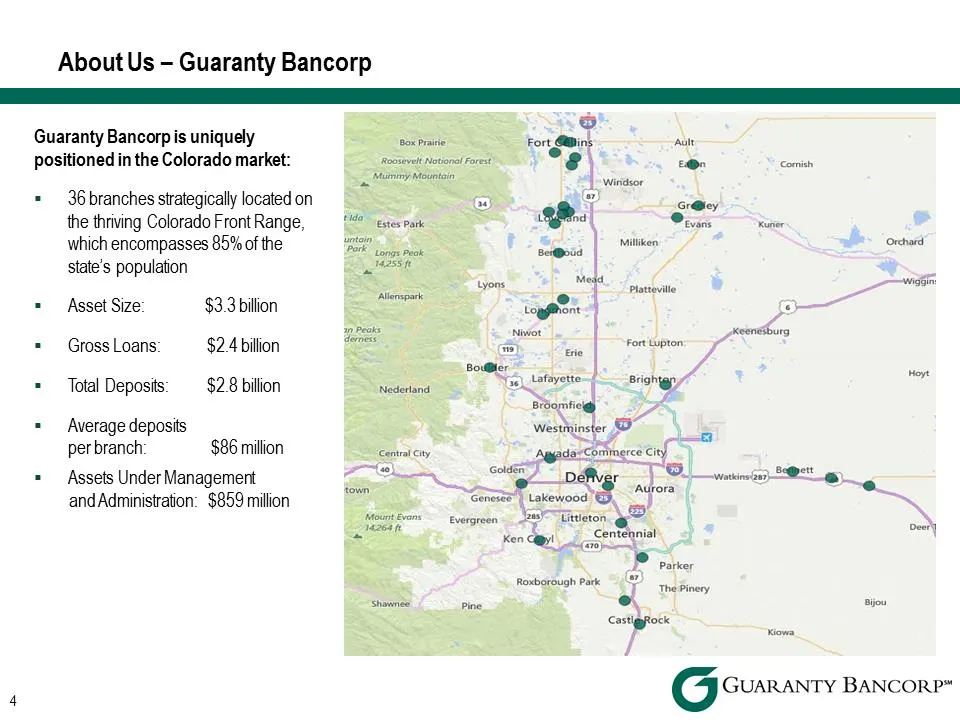
About Us – Guaranty Bancorp Guaranty Bancorp is uniquely positioned in the Colorado market: . 36 branches strategically located on the thriving Colorado Front Range, which encompasses 85% of the state’s population . Asset Size: $3.3 billion . Gross Loans: $2.4 billion . Total Deposits: $2.8 billion
Slide 5: About Us – KBW Best Ideas and SNL ranking
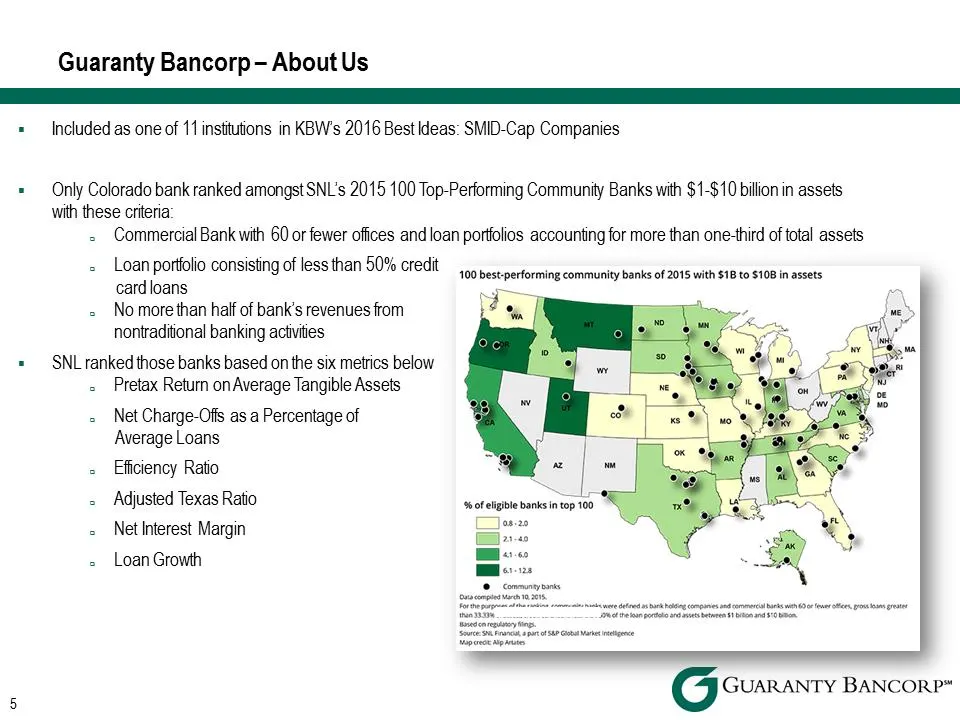
Guaranty Bancorp – About Us . Included as one of 11 institutions in KBW’s 2016 Best Ideas: SMID-Cap Companies . Only Colorado bank ranked amongst SNL’s 2015 100 Top-Performing Community Banks with $1-$10 billion in assets with these criteria: Commercial Bank with 60 or fewer offices and loan portfol
Slide 6: About Us – Sandler O'Neill Sm-All Stars award
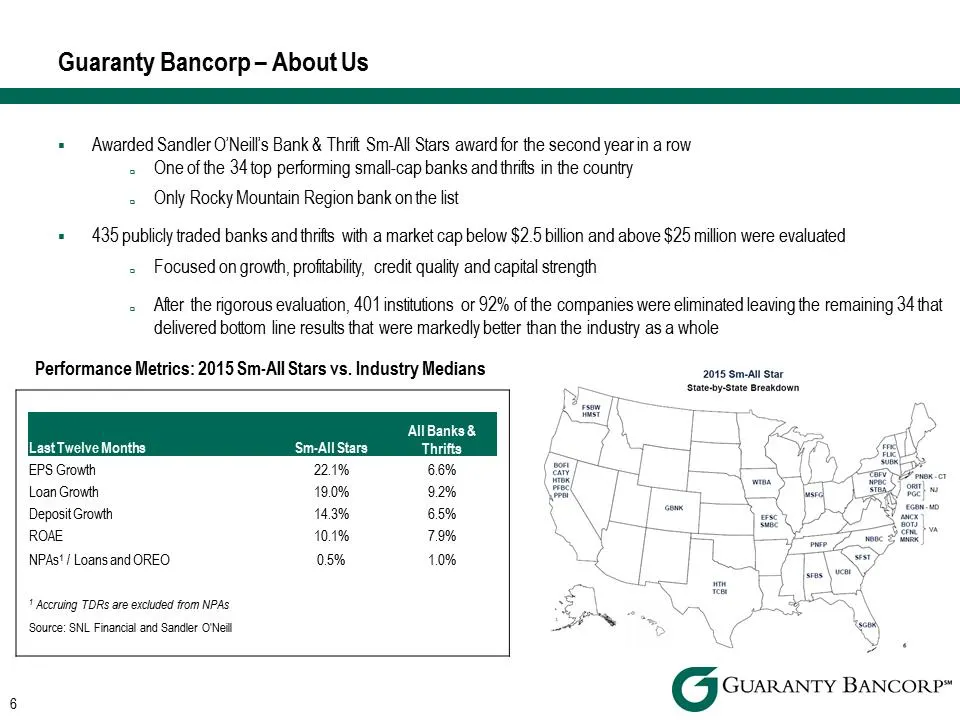
Guaranty Bancorp – About Us . Awarded Sandler O’Neill’s Bank & Thrift Sm-All Stars award for the second year in a row One of the 34 top performing small-cap banks and thrifts in the country Only Rocky Mountain Region bank on the list . 435 publicly traded banks and thrifts with a market cap below $2
Slide 7: Home State Bancorp Transaction Overview
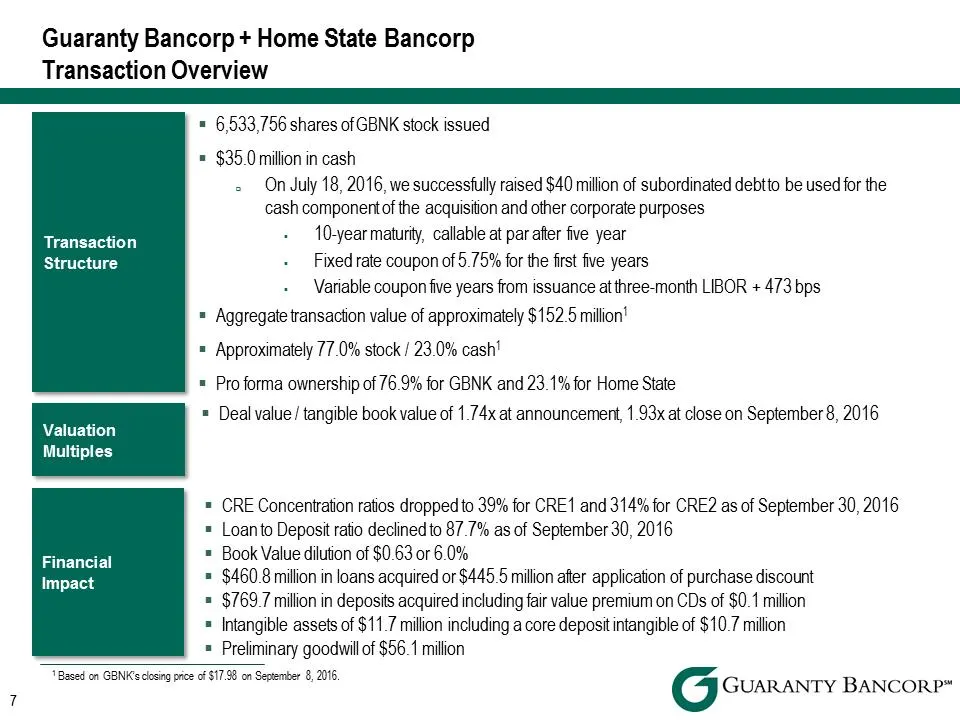
Guaranty Bancorp + Home State Bancorp Transaction Overview Transaction Structure Valuation Multiples Financial Impact . 6,533,756 shares of GBNK stock issued . $35.0 million in cash On July 18, 2016, we successfully raised $40 million of subordinated debt to be used for the cash component of the acq
Slide 8: Pre & Post Merger Comparison
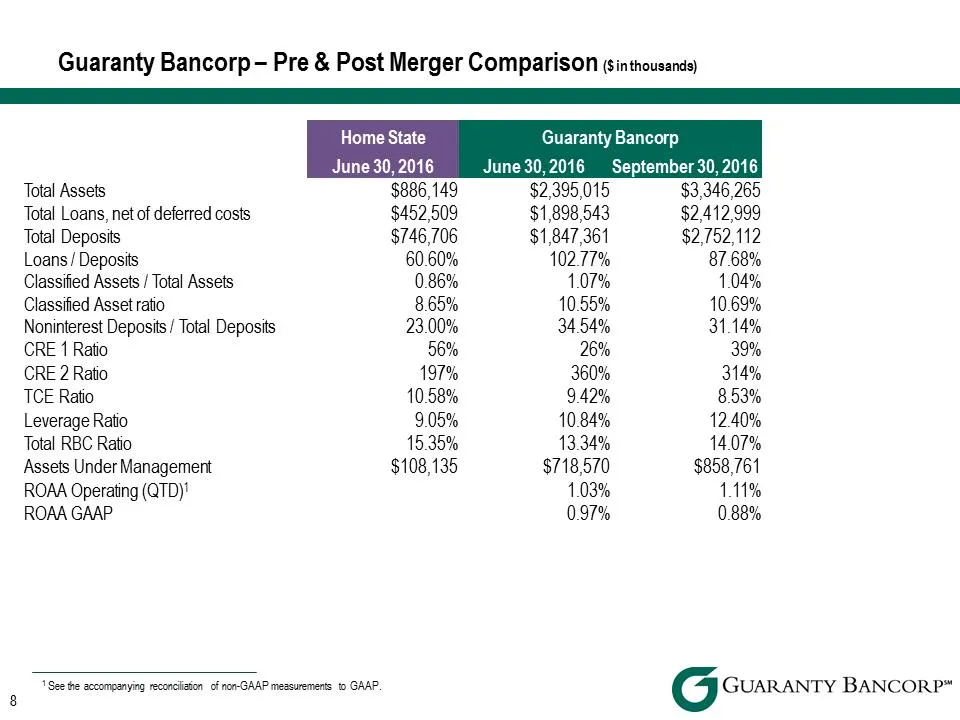
Guaranty Bancorp – Pre & Post Merger Comparison ($ in thousands) Home State Guaranty Bancorp June 30, 2016 June 30, 2016 September 30, 2016 Total Assets $886,149 $2,395,015 $3,346,265 Total Loans, net of deferred costs $452,509 $1,898,543 $2,412,999 Total Deposits $746,706 $1,847,361 $2,752,112 Loan
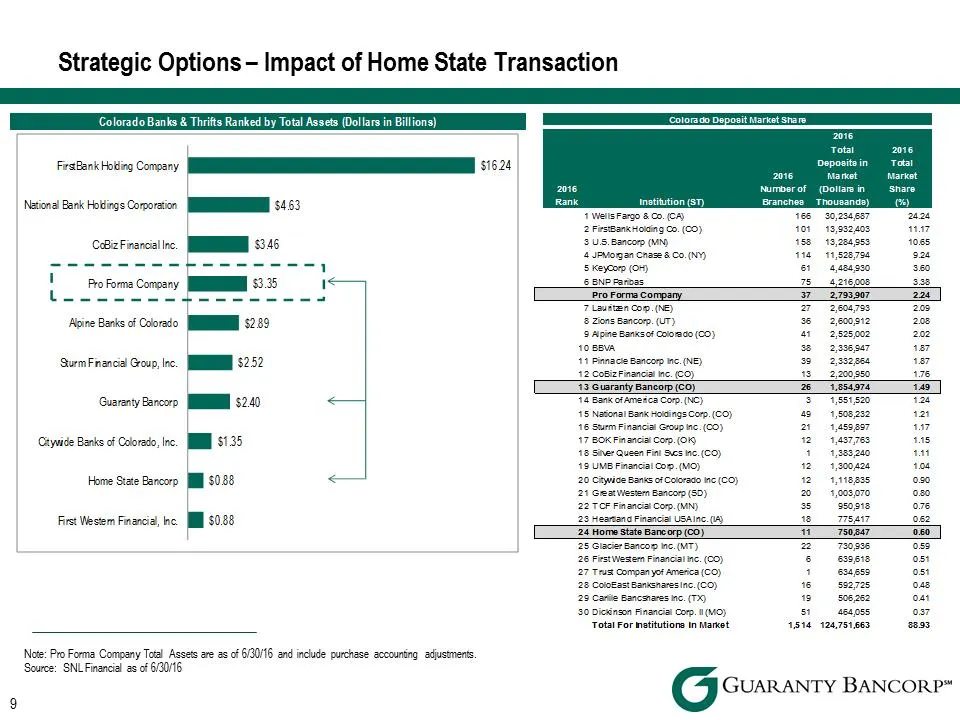
Slide 9: Strategic Options – Impact of Home State Transaction
Strategic Options – Impact of Home State Transaction Colorado Deposit Market Share 2016 Total 2016 2016 Deposits in Market Total Market 2016 Rank Institution (ST) Number of Branches (Dollars in Thousands) Share (% 1 Wells Fargo & Co. (CA) 166 30,234,687 24.24 2 FirstBank Holding Co. (CO) 101 13,932,
Slide 10: Branch Network
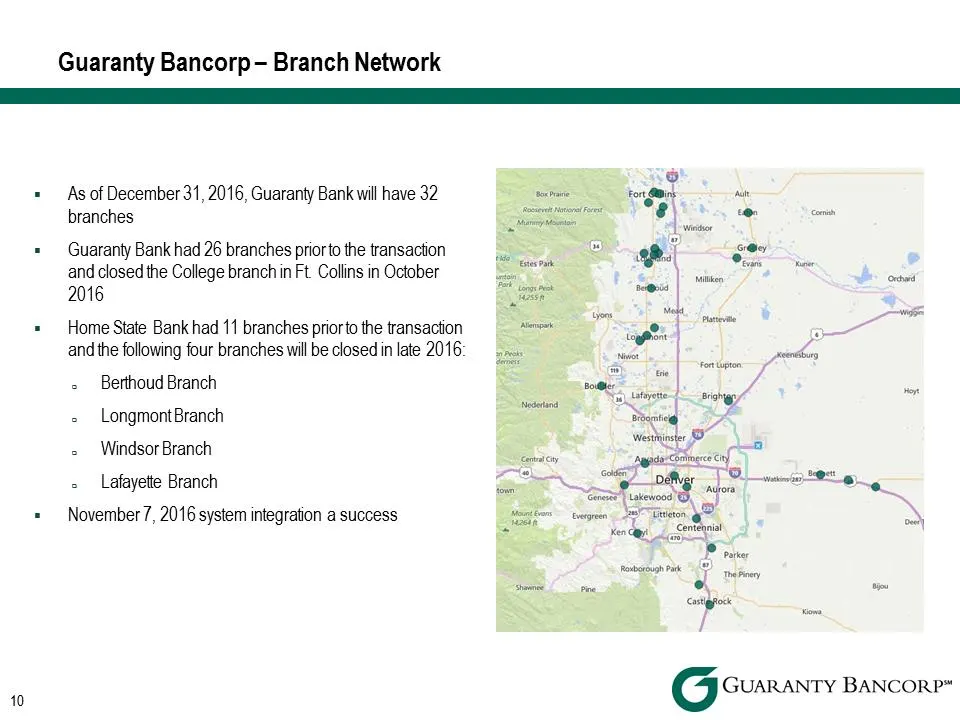
Guaranty Bancorp – Branch Network . As of December 31, 2016, Guaranty Bank will have 32 branches . Guaranty Bank had 26 branches prior to the transaction and closed the College branch in Ft. Collins in October 2016 . Home State Bank had 11 branches prior to the transaction and the following four bra
Slide 11: Investment Considerations
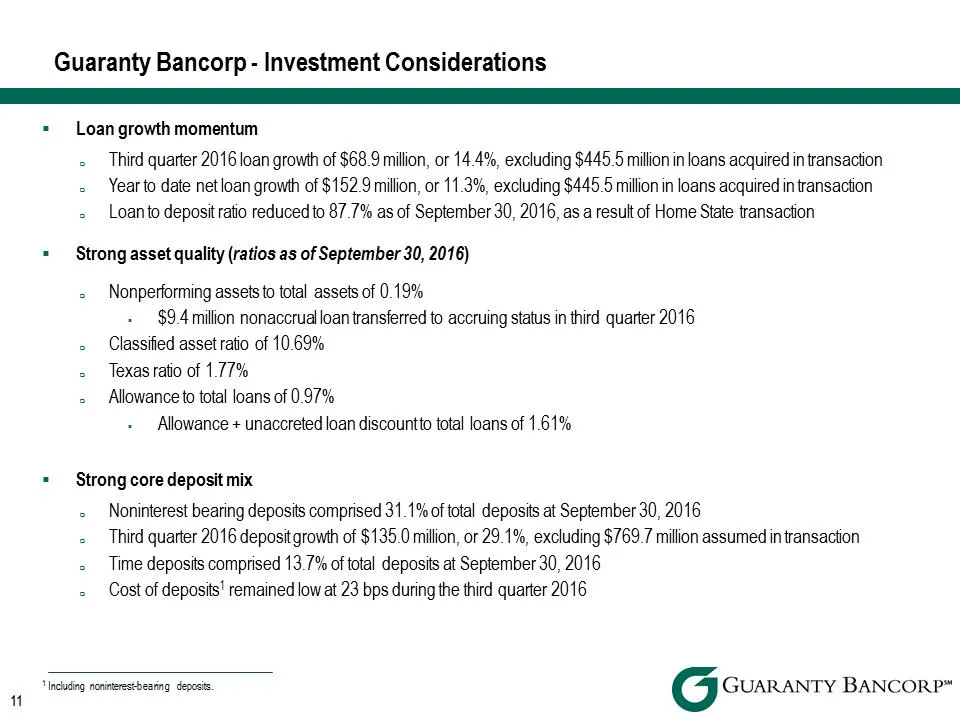
Guaranty Bancorp -Investment Considerations . Loan growth momentum Third quarter 2016 loan growth of $68.9 million, or 14.4%, excluding $445.5 million in loans acquired in transaction Year to date net loan growth of $152.9 million, or 11.3%, excluding $445.5 million in loans acquired in transaction
Slide 12: Loan Composition & Growth
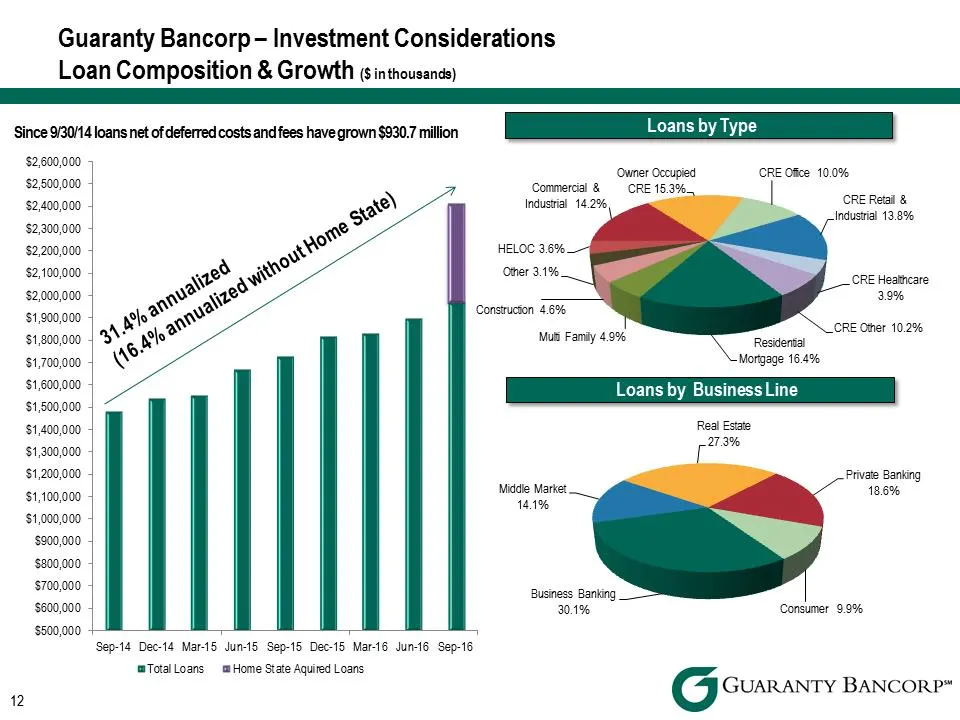
Guaranty Bancorp – Investment Considerations Loan Composition & Growth ($ in thousands) Since 9/30/14 loans net of deferred costs and fees have grown $930.7 million LoansbyType '''‘’’’''''''''''''''''''''''''''''' $2,600,000 Owner Occupied CRE Office 10.0% $2,500,000 Commercial & CRE 15.3% CRE Retai
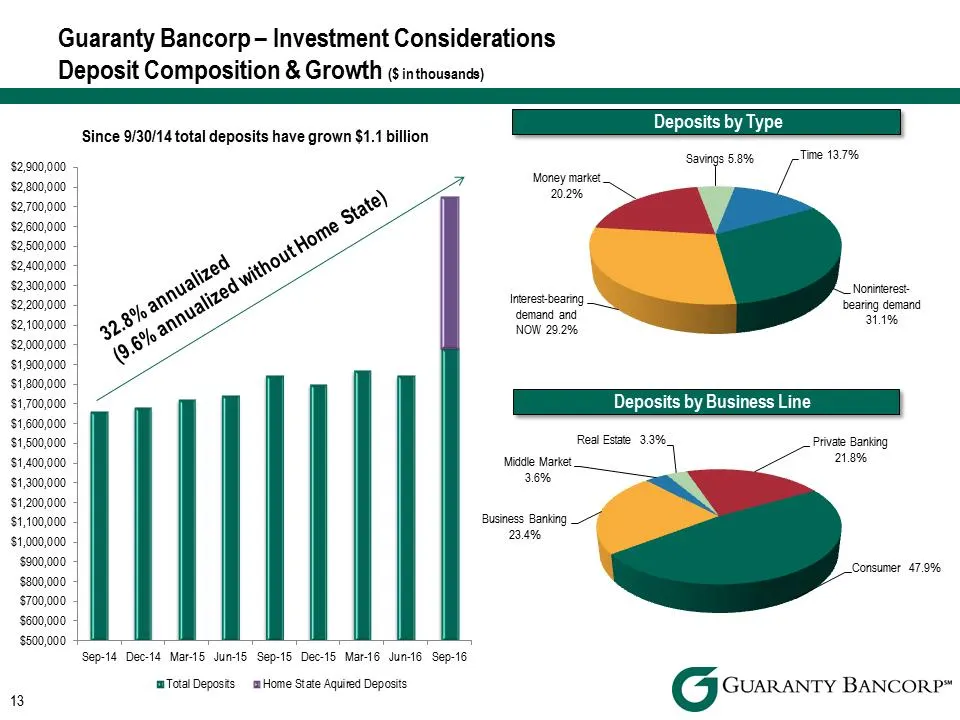
Slide 13: Deposit Composition & Growth
Guaranty Bancorp – Investment Considerations Deposit Composition & Growth ($ in thousands) Since 9/30/14 total deposits have grown $1.1 billion $2,900,000 $2,800,000 $2,700,000 $2,600,000 $2,500,000 $2,400,000 $2,300,000 $2,200,000 $2,100,000 $2,000,000 $1,900,000 $1,800,000 $1,700,000 $1,600,000 $1
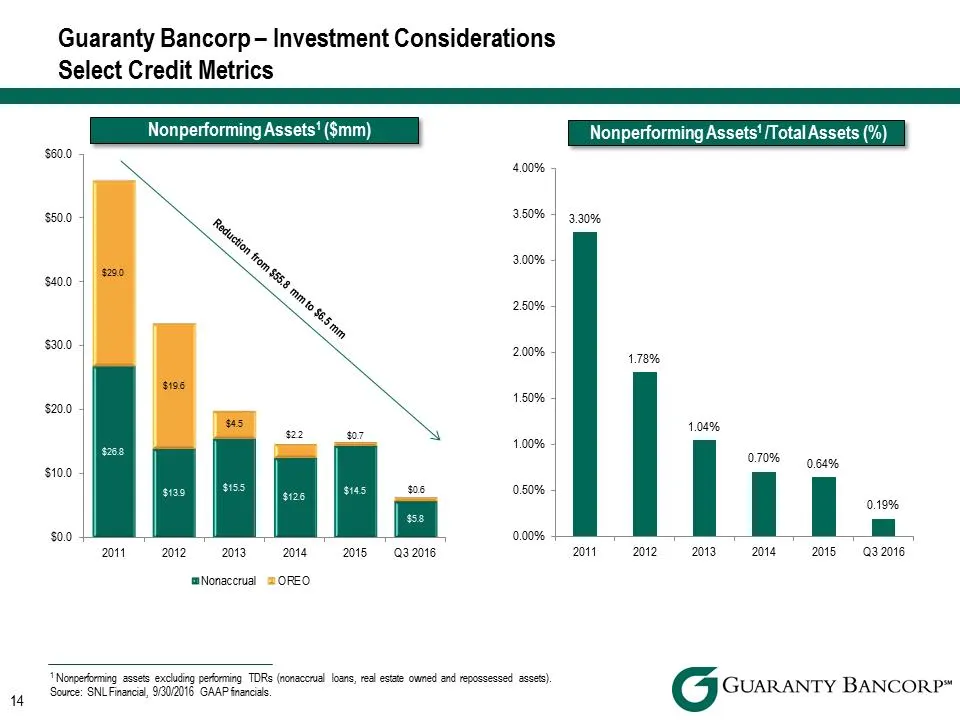
Slide 14: Select Credit Metrics
Reduction from $55.8 mm to $6.5 mm Guaranty Bancorp – Investment Considerations Select Credit Metrics $26.8 $13.9 $15.5 $12.6 $14.5 $5.8 $29.0 $19.6 $4.5 $2.2 $0.7 $0.6 $0.0 $10.0 $20.0 $30.0 $40.0 $50.0 $60.0 Nonperforming Assets 1 ($mm) ''''''''''' 3.30% 1.78% 1.04% 0.70% 0.64% 0.19% 0.00% 0.50% 1
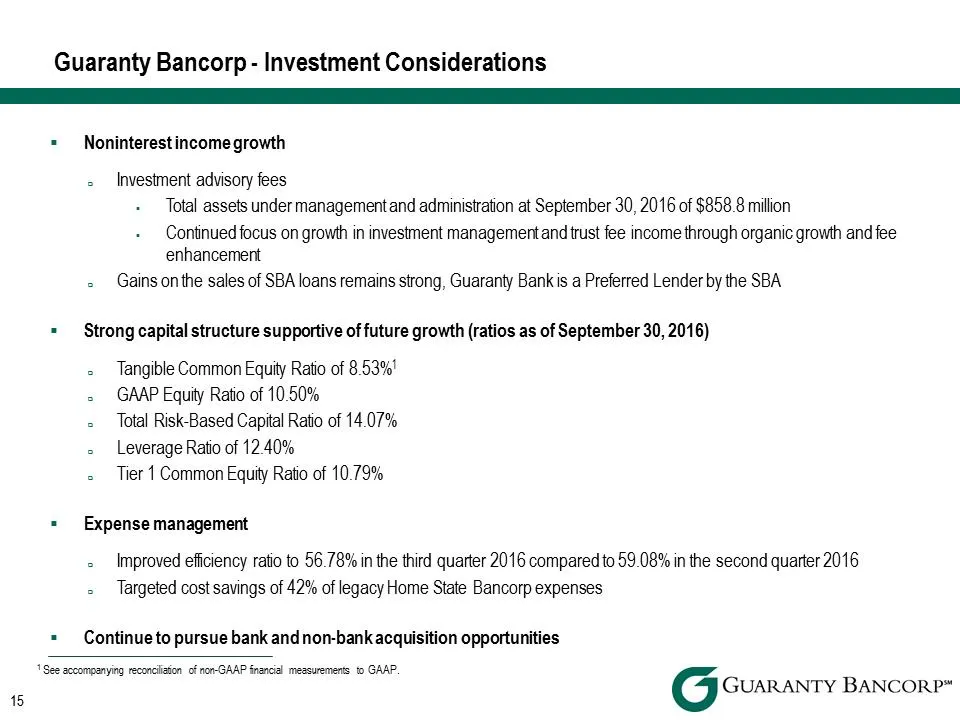
Slide 15: Investment Considerations – Noninterest income, capital, expenses
Guaranty Bancorp -Investment Considerations Noninterest income growth Investment advisory fees Total assets under management and administration at September 30, 2016 of $858.8 million Continued focus on growth in investment management and trust fee income through organic growth and fee enhancement G
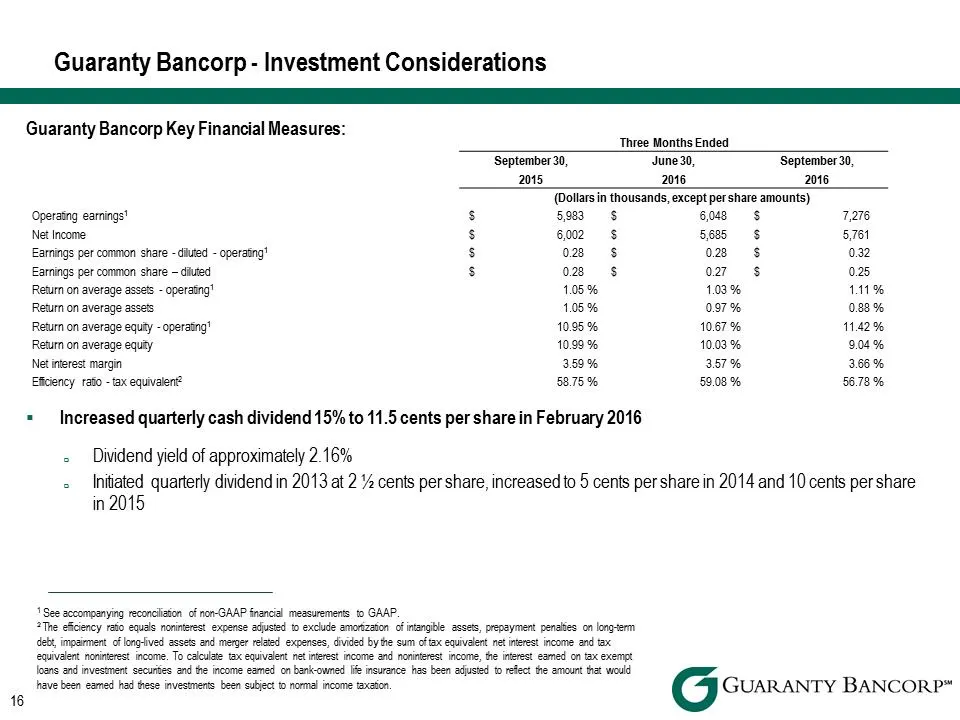
Slide 16: Key Financial Measures
Guaranty Bancorp -Investment Considerations Guaranty Bancorp Key Financial Measures: Three Months Ended September 30, June 30, September 30, 2015 2016 2016 (Dollars in thousands, except per share amounts) Operating earnings 1 $5,983 $6,048 $7,276 Net Income $6,002 $5,685 $5,761 Earnings per common s
Slide 17: Operating Earnings
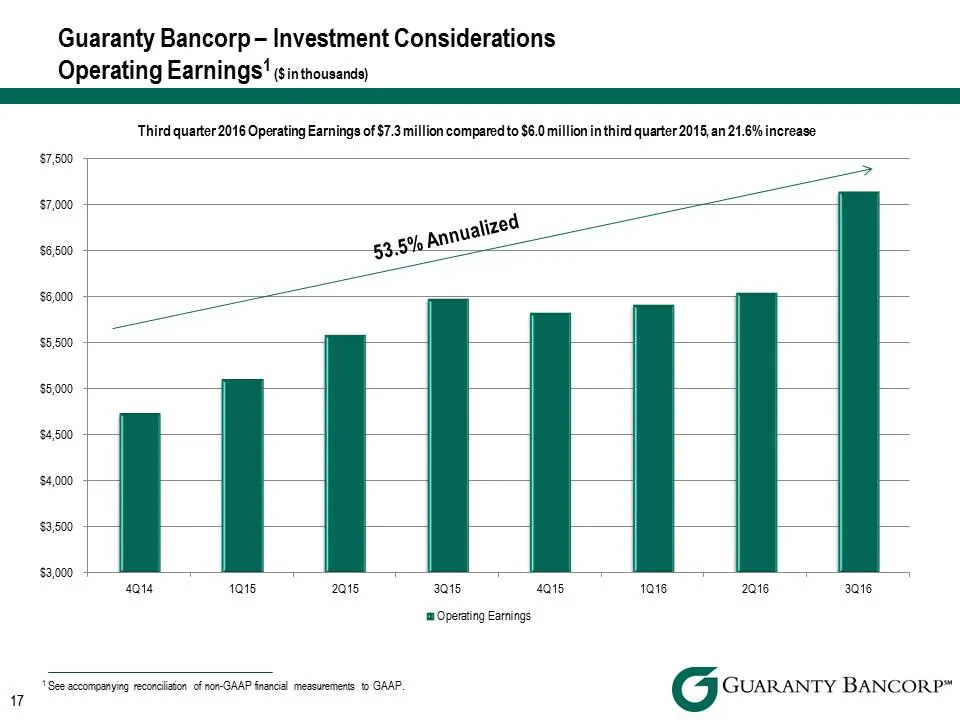
53.5% Annualized Guaranty Bancorp – Investment Considerations Operating Earnings 1 ($ in thousands) Third quarter 2016 Operating Earnings of $7.3 million compared to $6.0 million in third quarter 2015, an 21.6% increase Operating Earnings $3,000 $3,500 $4,000 $4,500 $5,000 $5,500 $6,000 $6,500 $7,00
Slide 18: Net Interest Income
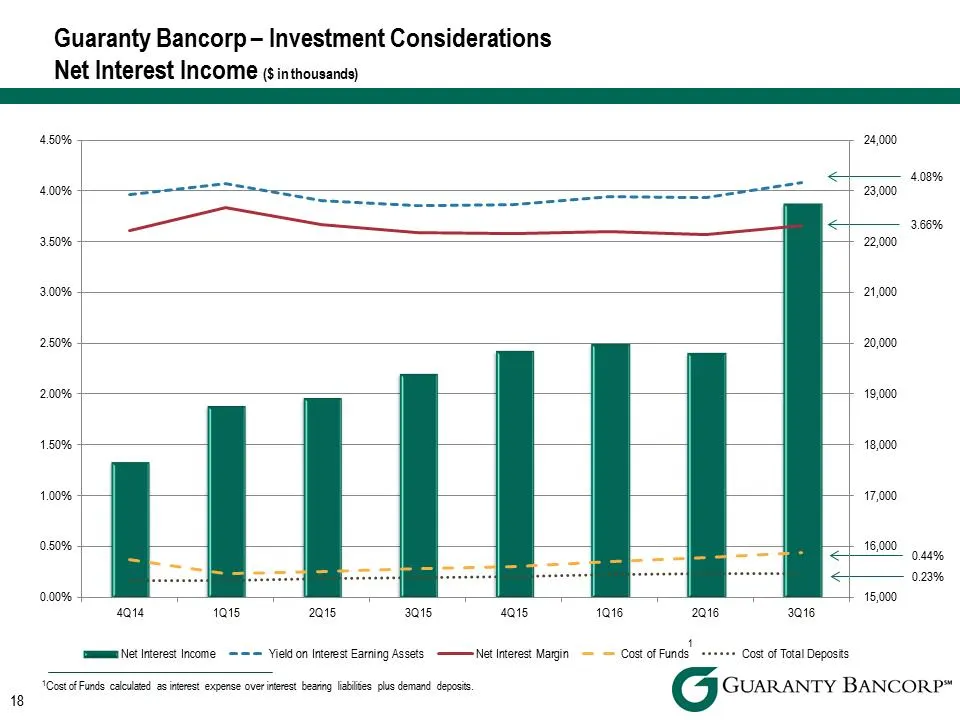
Guaranty Bancorp – Investment Considerations Net Interest Income ($ in thousands) 4.50% 24,000 4.08% 4.00% 23,000 3.66% 3.50% 22,000 3.00% 21,000 2.50% 20,000 2.00% 19,000 1.50% 18,000 1.00% 17,000 0.50% 16,000 0.44% 0.23% 0.00% 15,000 4Q14 1Q15 2Q15 3Q15 4Q15 1Q16 2Q16 3Q16 1 Net Interest Income Yi
Slide 19: Quarterly Financial Statement Summary
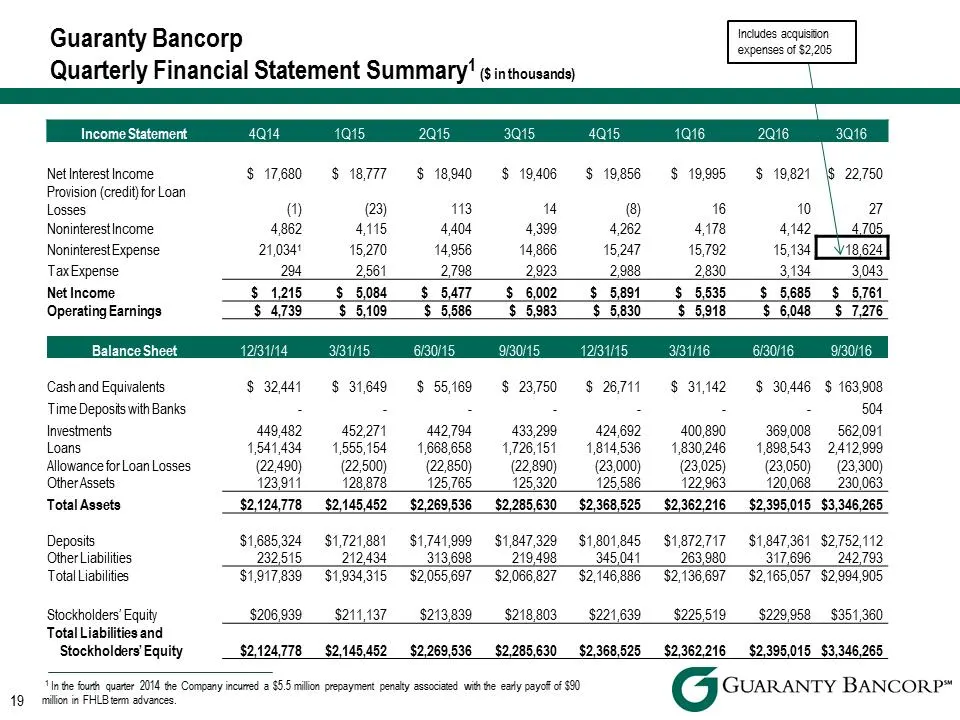
Guaranty Bancorp Quarterly Financial Statement Summary 1 ($ in thousands) Includes acquisition expenses of $2,205 Income Statement 4Q14 1Q15 2Q15 3Q15 4Q15 1Q16 2Q16 3Q16 Net Interest Income $17,680 $ 8,777 $18,940 $19,406 $19,856 $19,995 $19,821 $22,750 Provision (credit) for Loan Losses (1) (23) 1
Slide 20: Colorado Market
Colorado Market G GUARANTY BANCORP”
Slide 21: Market Data – Demographics
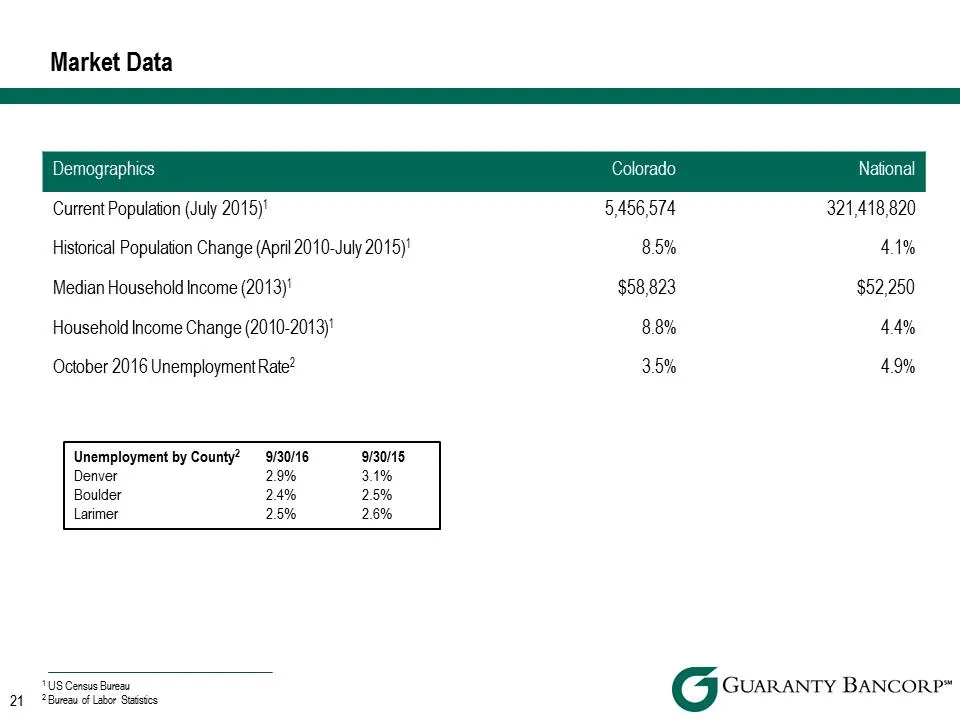
Market Data Demographics Colorado National Current Population (July 2015) 1 5,456,574 321,418,820 Historical Population Change (April 2010-July 2015) 1 8.5% 4.1% Median Household Income (2013) 1 $58,823 $52,250 Household Income Change (2010-2013) 1 8.8% 4.4% October 2016 Unemployment Rate 2 3.5% 4.9
Slide 22: Market Data – Business Climate
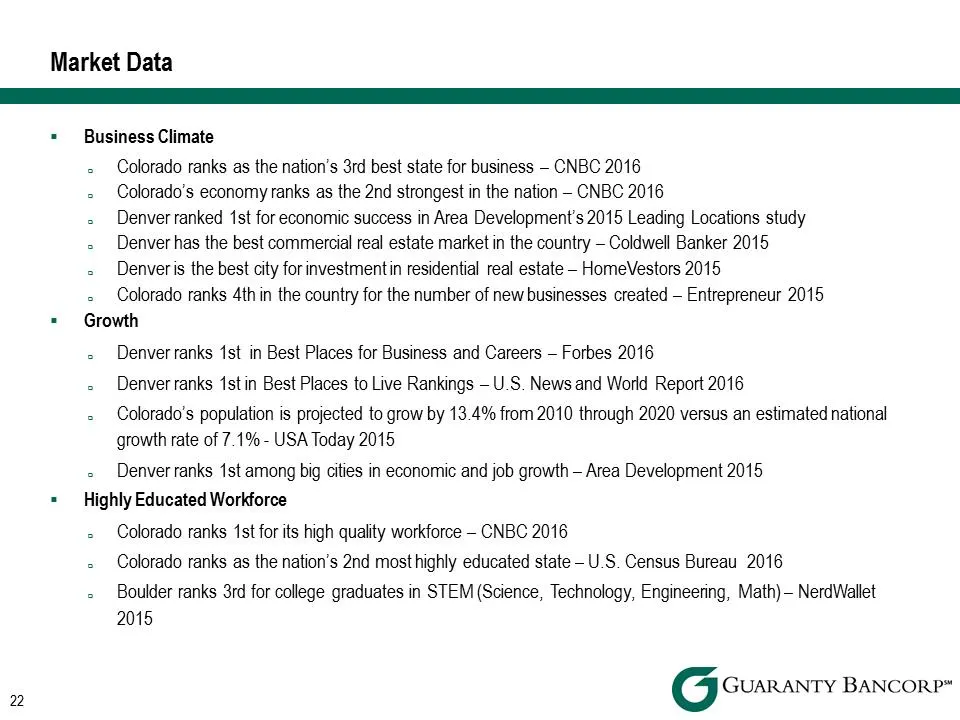
Market Data . Business Climate Colorado ranks as the nation’s 3rd best state for business – CNBC 2016 Colorado’s economy ranks as the 2nd strongest in the nation – CNBC 2016 Denver ranked 1st for economic success in Area Development’s 2015 Leading Locations study Denver has the best commercial real
Slide 23: Market Data – Largest Metro Denver Employers
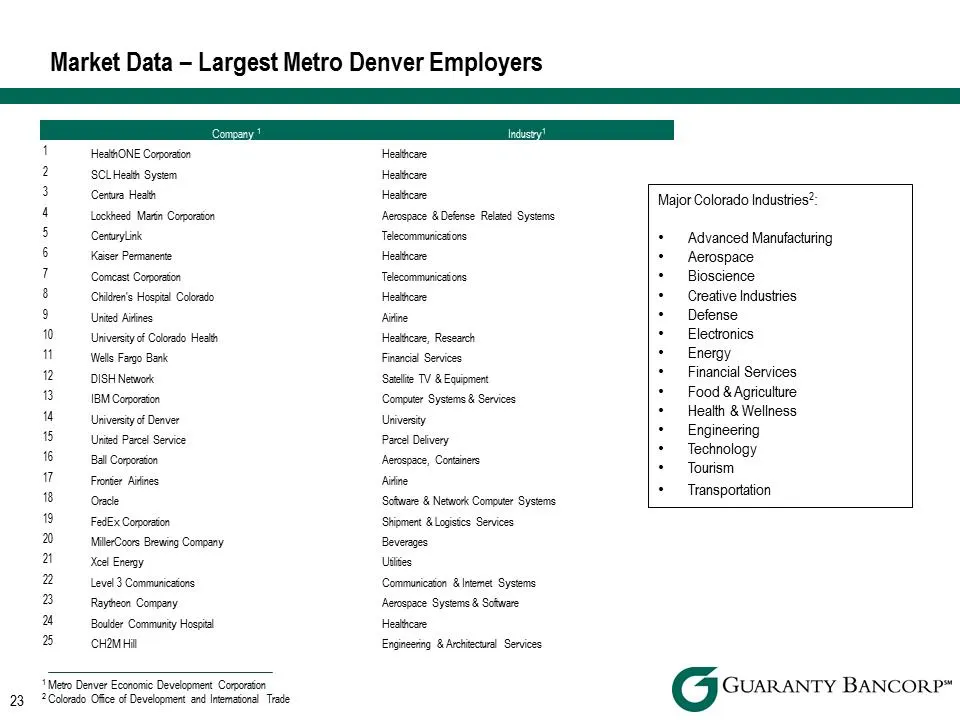
Market Data – Largest Metro Denver Employers Company1Industry11 HealthONE Corporation Healthcare 2 SCL Health System Healthcare 3 Centura Health Healthcare 4 Lockheed Martin Corporation Aerospace & Defense Related Systems CenturyLink Telecommunications 6 Kaiser Permanente Healthcare 7 Comcast Corpor
Slide 24: Market Data – Largest Northern Colorado Employers
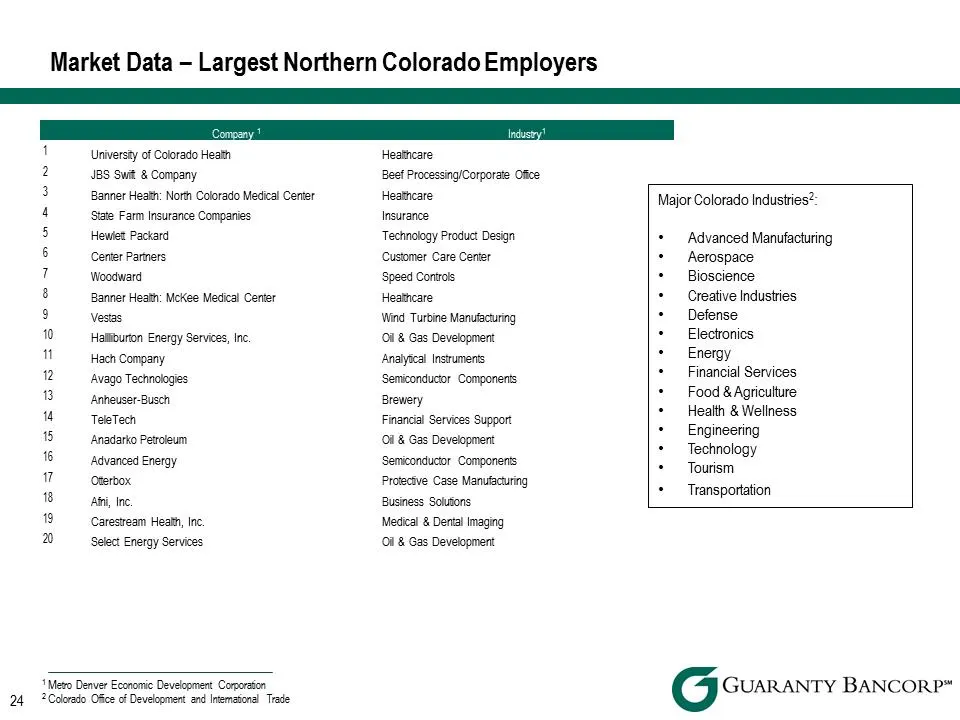
Market Data – Largest Northern Colorado Employers Company1Industry11 University of Colorado Health Healthcare 2 JBS Swift & Company Beef Processing/Corporate Office 3 Banner Health: North Colorado Medical Center Healthcare 4 State Farm Insurance Companies Insurance 5 Hewlett Packard Technology Produ
Slide 25: Reconciliation of Non-GAAP Financial Measures
Reconciliation of Non-GAAP Financial Measures
Slide 26: Reconciliation of Non-GAAP Financial Measures
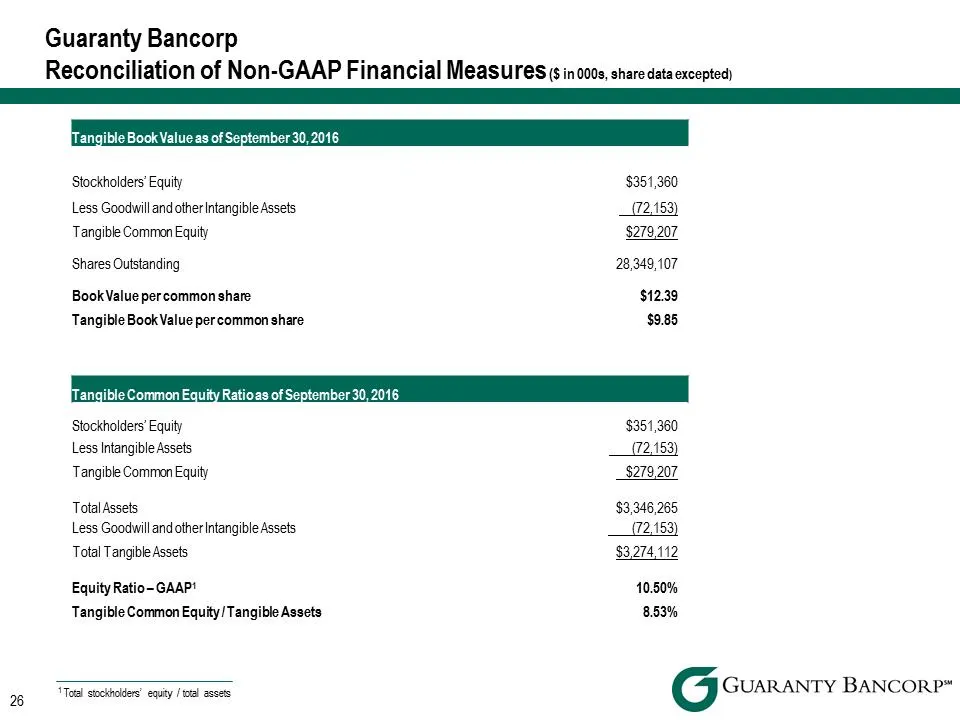
Guaranty Bancorp Reconciliation of Non-GAAP Financial Measures ($ in 000s, share data excepted) Tangible Book Value as of September 30, 2016 Stockholders’ Equity $351,360 Less Goodwill and other Intangible Assets (72,153) Tangible Common Equity $279,207 Shares Outstanding 28,349,107 Book Value per c
Slide 27: Reconciliation of Non-GAAP Financial Measures
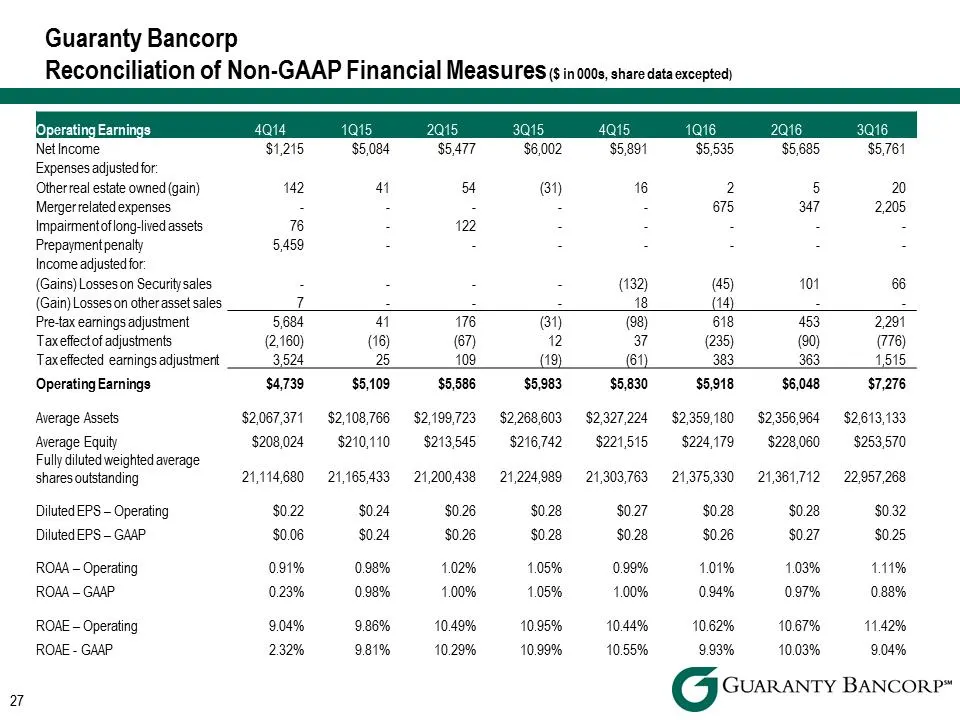
Guaranty Bancorp Reconciliation of Non-GAAP Financial Measures ($ in 000s, share data excepted) Operating Earnings 4Q14 1Q15 2Q15 3Q15 4Q15 1Q16 2Q16 3Q16 Net Income $1,215 $5,084 $5,477 $6,002 $5,891 $5,535 $5,685 $5,761 Expenses adjusted for: Other real estate owned (gain) 142 41 54 (31) 16 2 20 M
Source: SEC EDGAR · 8-K filed Nov 28, 2016
More decks from Guaranty Bancorp
 Merger or Acquisition (May 2018)19 slides · May 23, 2018
 Merger or Acquisition (July 2017)8 slides · Jul 19, 2017
 D.A. Davidson 19th Annual Financial Services Conference 201722 slides · May 9, 2017
 FIG Partners 8th Annual West Coast Bank CEO Forum 201727 slides · Jan 31, 2017
 2016 KBW Community Bank Investor Conference26 slides · Aug 1, 2016
 IPO Roadshow (July 2016)30 slides · Jul 13, 2016