CenterState Bank — CenterState Banks — KBW Boston Bank Conference 2014
36 slides from CenterState Bank's conference presentation, Feb 24, 2014
Slide 1: KBW Boston Bank Conference
KBW Boston Bank Conference February 26, 2014 Exhibit 99.1
Slide 2: Forward Looking Statement
2 This presentation contains forward-looking statements, as defined by Federal Securities Laws, relating to present or future trends or factors affecting the operations, markets and products of CenterState Banks, Inc. (CSFL). These statements are provided to assist in the understanding of future fin

Slide 3: Company Overview
Company Overview
Slide 4: Corporate Overview
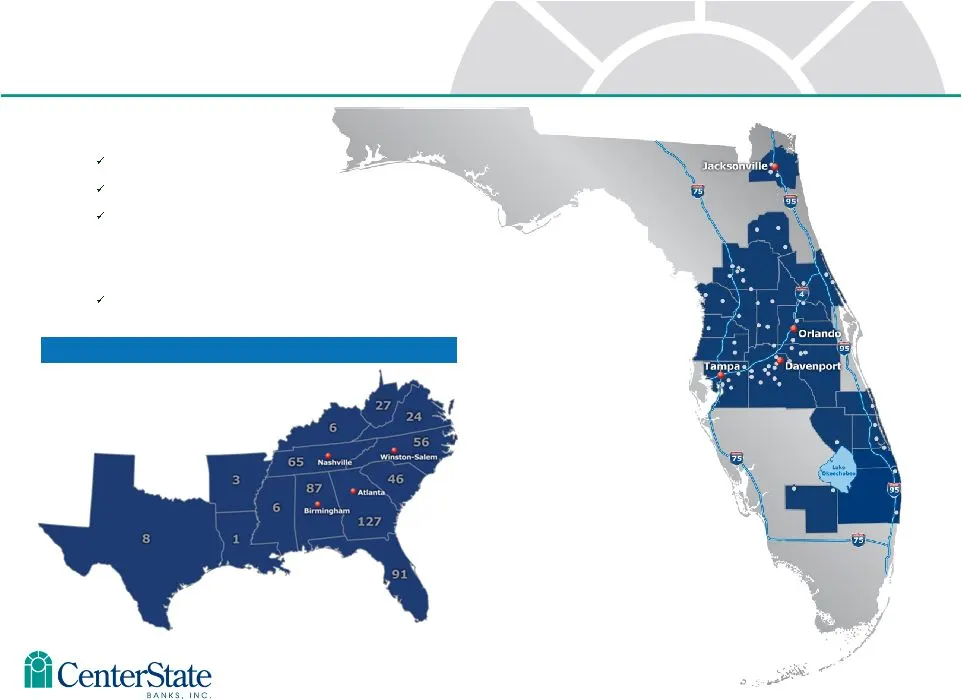
Correspondent Banking Market Pro forma for Gulfstream acquisition • Headquartered in Davenport, FL $3.0 billion in assets $1.9 billion in loans $2.5 billion in deposits • Company formed: June 2000 1 Subsidiary Bank Corporate Overview
Slide 5: CSFL – Best Positioned Florida Consolidator
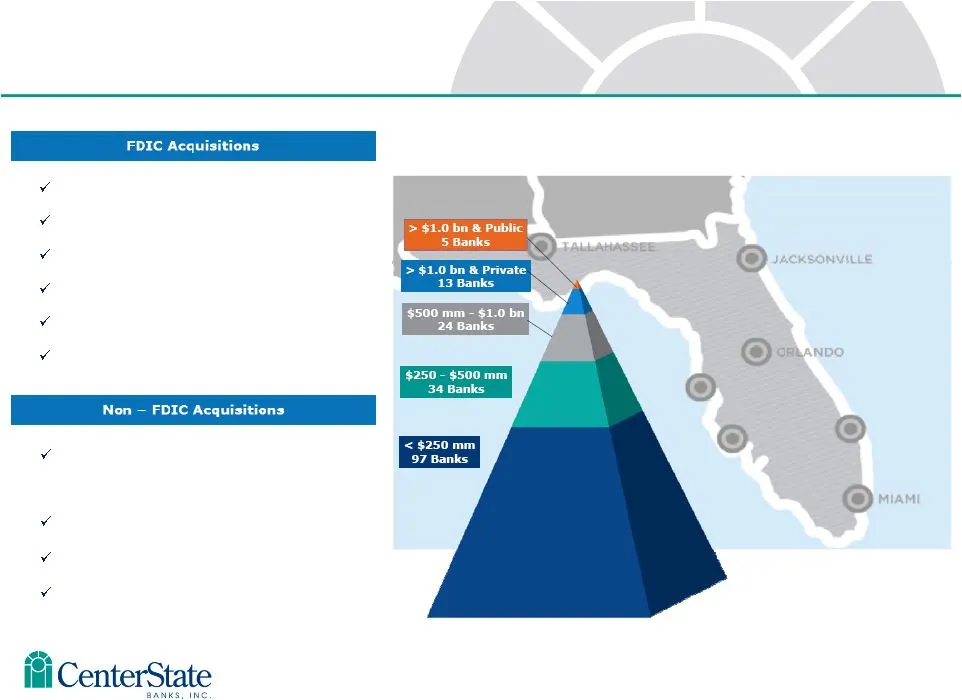
18 CSFL – Best Positioned Florida Consolidator Source: SNL Financial Data as of MRQ available Federal Trust Acquisition from The Hartford Insurance Company TD Bank divesture in Putnam Gulfstream Business Bank in Stuart First Southern Bancorp Ocala National Bank Olde Cypress Community Bank Independen
Slide 6: Florida Real Estate – Single Family Homes
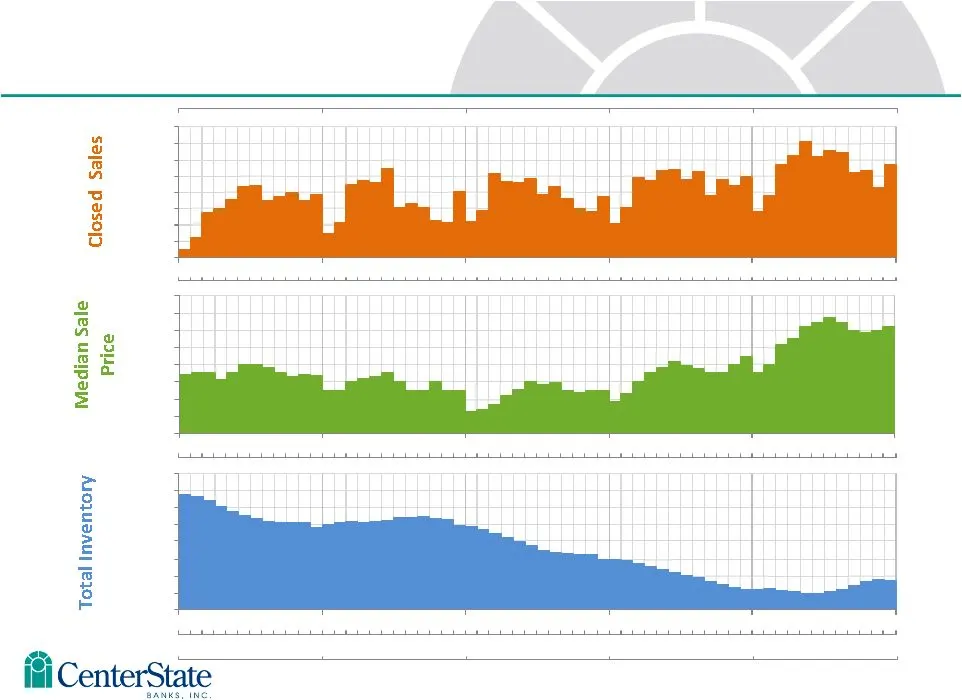
6 Source: Florida Realtors Monthly Market Detail (December 2013) – Single Family Homes Florida Real Estate – Single Family Homes 24,000 22,000 20,000 18,000 16,000 14,000 12,000 10,000 8,000 $190K $180K $170K $160K $150K $140K $130K $120K $110K 230,000 210,000 190,000 170,000 150,000 130,000 110,000

Slide 7: 4th Quarter Financial Summary
th Quarter Financial Summary
Slide 8: Quarter Summary of Financial Results
4Q 2013 3Q 2013 Current Qtr take-aways th Quarter Summary of Financial Results EPS $0.06 $0.10 • Lower loan loss provision $183 vs. ($1,273) • Higher IA amortization • Lower bond sales • Loan growth • Resilient NIM • 4.65% vs. 4.96% • Covered loan performance • Potential future ALLL release • Valuab
Slide 9: Loan Production by Quarter
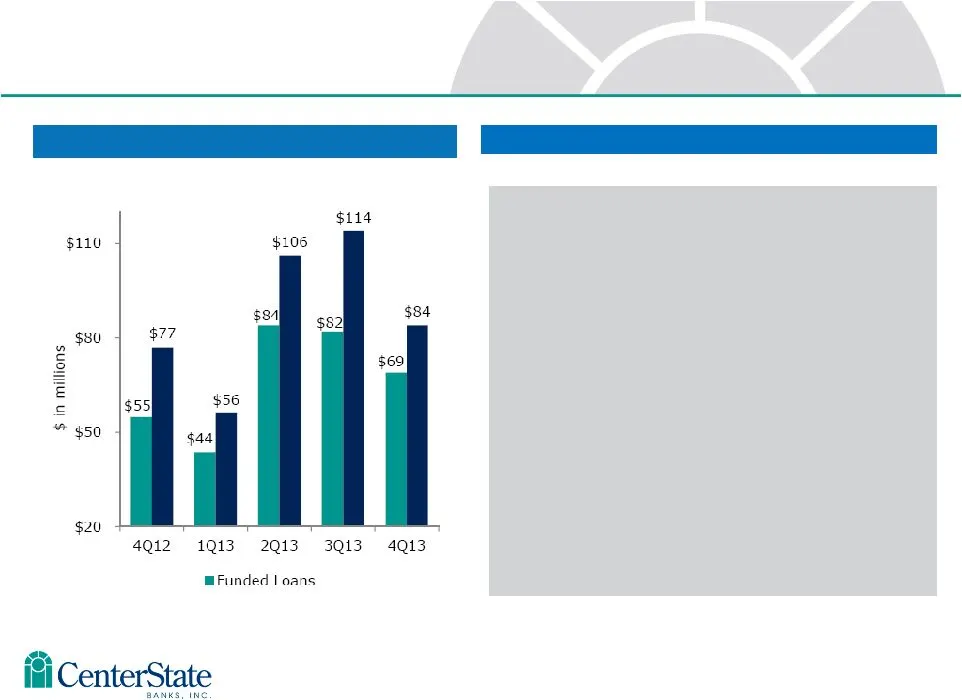
Loan Production by Quarter Current Quarter Loan Production Non-Covered Loan Growth • Current Qtr annualized growth 9.3% • YTD annualized growth 9.4% • Avg yld funded loans 4.25% • 35% Resi • 28% CRE • 26% C&I • 11% all other • Loan pipeline: End of 4Q13: $114M End of 3Q13: $124M End of 2Q13: $150M E
Slide 10: Profitability Metrics – Years
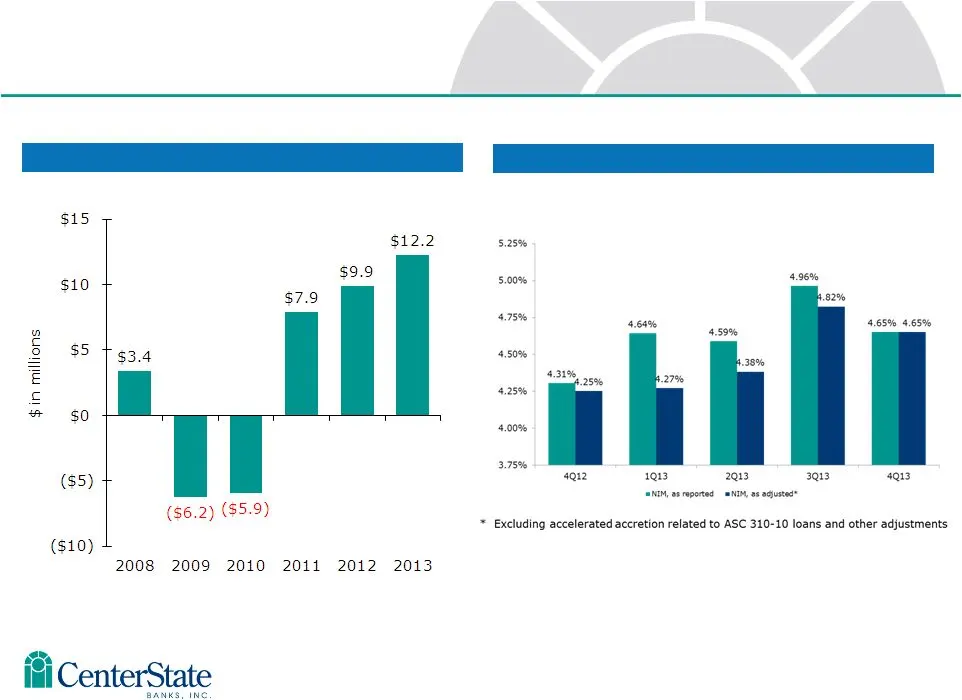
Net Income Net Interest Margin Profitability Metrics – 6 Years
Slide 11: Operating Efficiencies
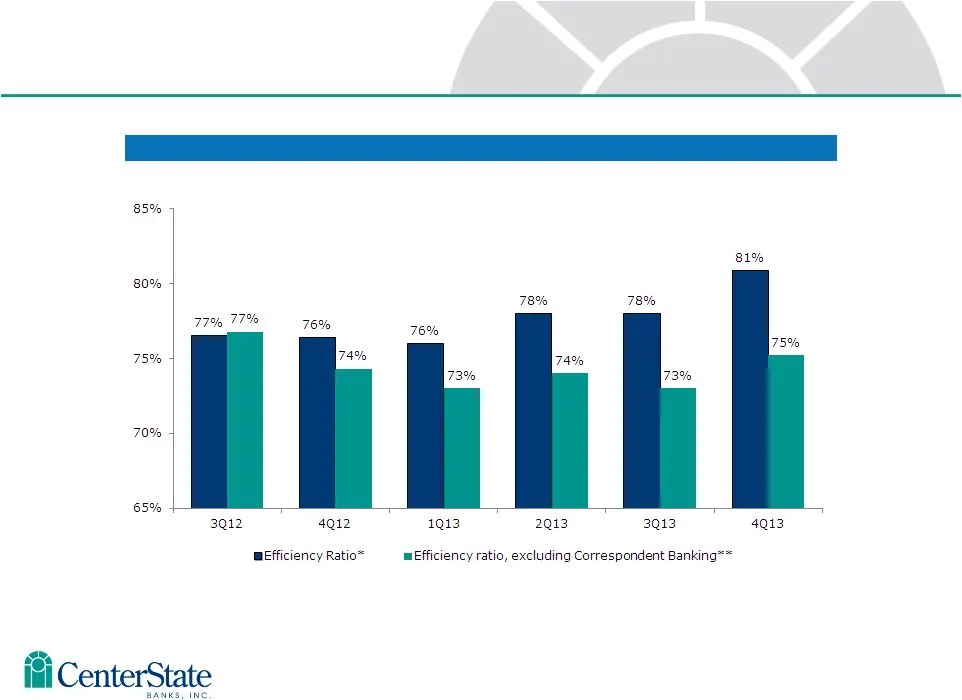
10 Efficiency Ratio Operating Efficiencies * Efficiency Ratio is defined as follows: [non-interest expense – intangible amortization – credit related expenses – merger related expenses – other nonrecurring expense] / [net interest income (fully tax equivalent) + non-interest income – gain on sale of
Slide 12: Efficiency and Enhanced Profitability Initiatives
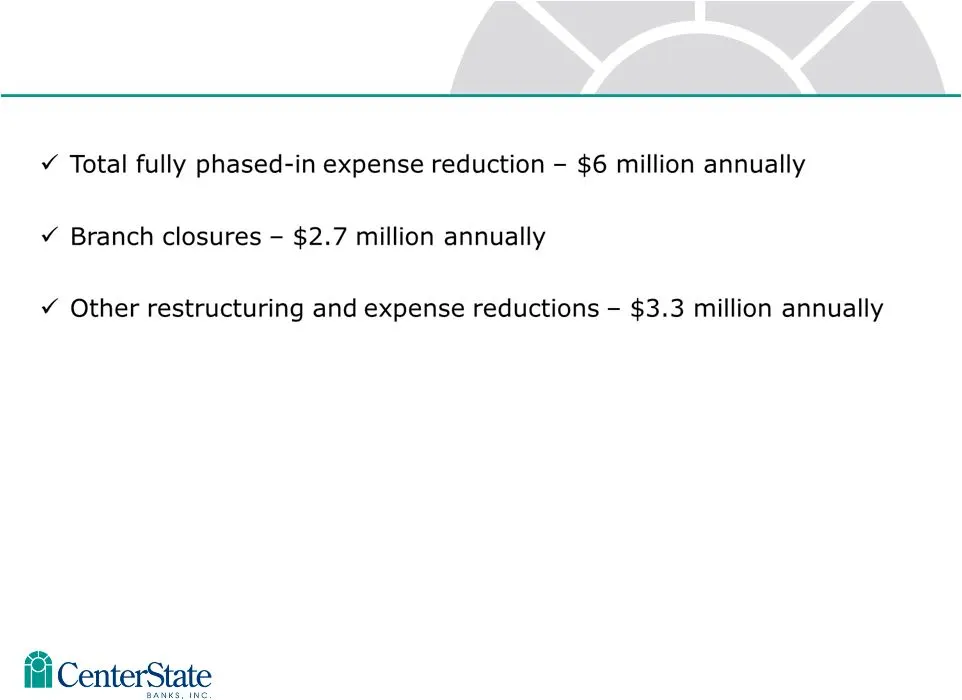
Efficiency and Enhanced Profitability Initiatives

Slide 13: Loan Portfolio
Loan Portfolio
Slide 14: Total Loans by Type and Detail
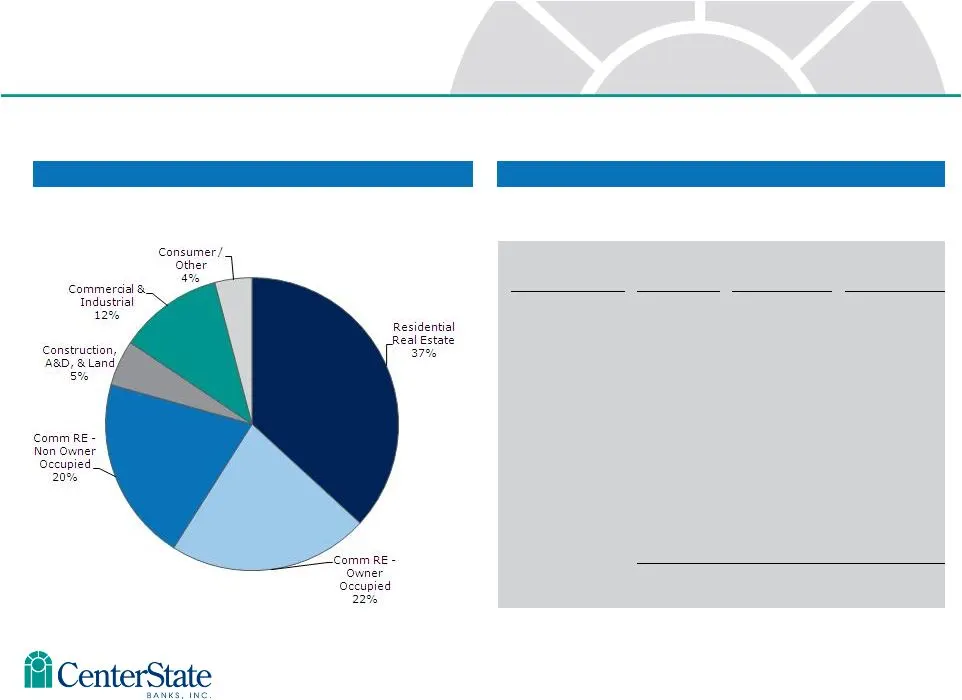
Total Loans by Type Total Loans Detail Loan Type No. of Loans Balance Avg Loan Balance Residential Real Estate 3,798 $ 458 MM $120,600 CRE-Owner Occupied $ 276 MM $371,500 CRE-Non Owner Occupied $ 253 MM $476,500 Construction, A&D, & Land $ 63 MM $143,800 Commercial & Industrial 1,344 $ 143 MM $106,
Slide 15: Non-Covered Loans – Yields, Balances, New Production
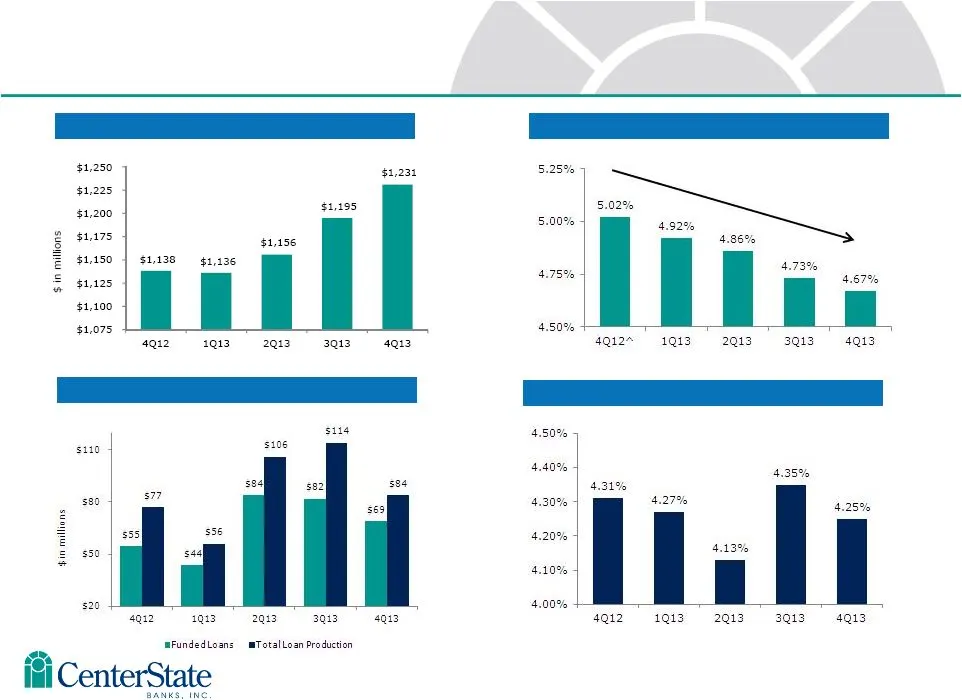
Non-Covered Loans - Average Yields, FTE Non-Covered Loans – Average Balances New Loan Production New Loan Production – Average Yields Non-Covered Loans ^ Adjusted for accelerated accretion related to noncovered ASC 310-10 loans
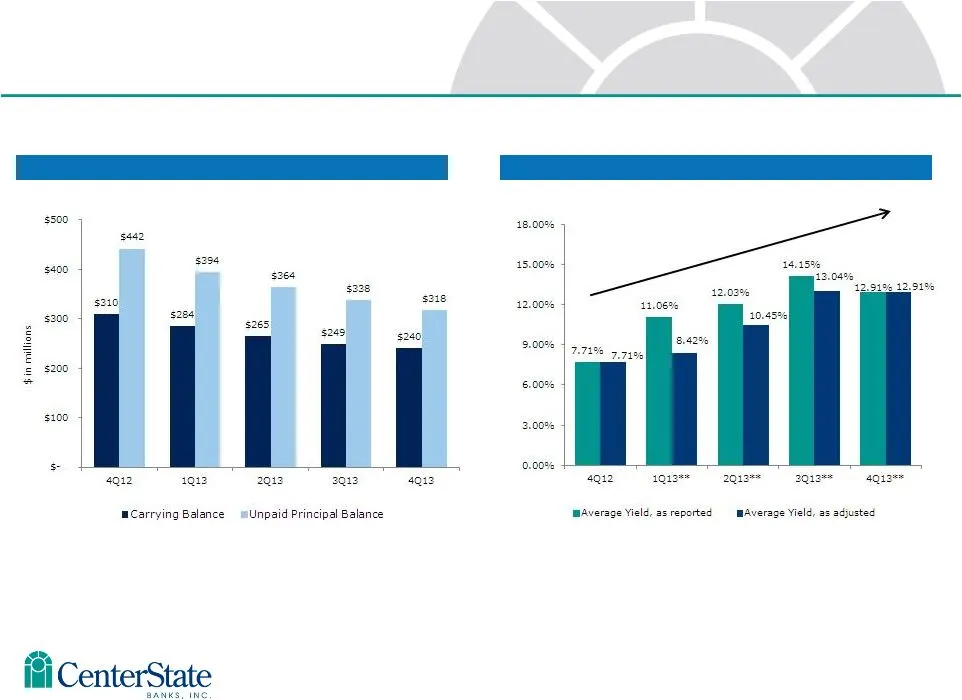
Slide 16: Covered Loans – Average Yields and Balances
Covered Loans – Average Yields* Covered Loans – Average Balances* Covered Loans * Adjusted for measurement period adjustment. ** Excluding accelerated accretion related to ASC 310-10 loans
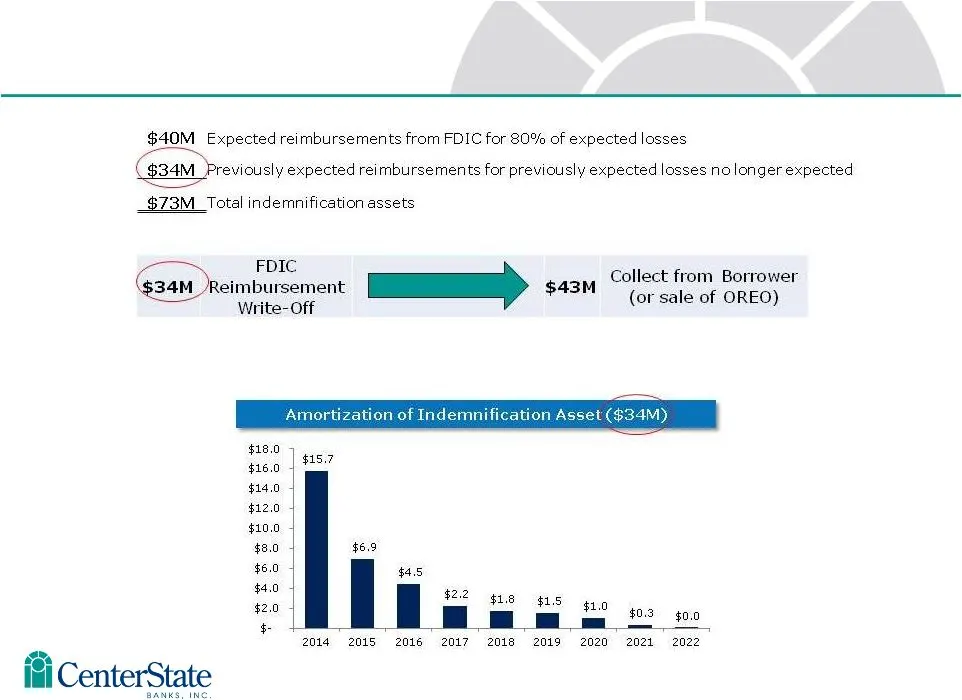
Slide 17: FDIC Indemnification Asset as of December 31, 2013
17 FDIC Indemnification Asset as of December 31, 2013 Written off over the lesser of the remaining expected life of the related loan pool(s) or the remaining term of the related loss share agreement(s).
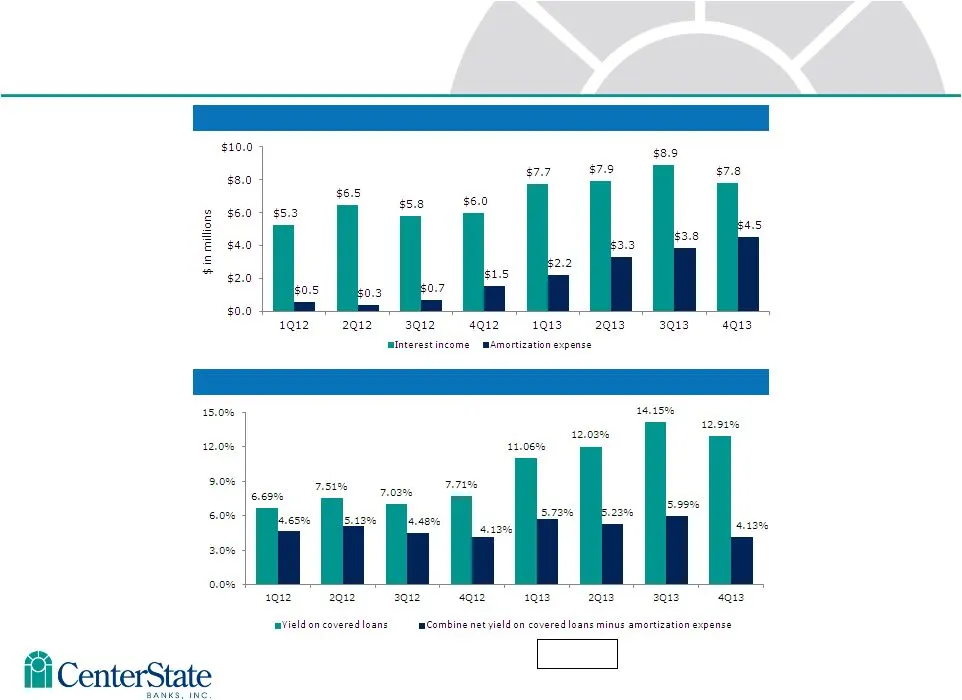
Slide 18: Interest Income and Amortization Expense Yields
18 Interest Income and Amortization Expense Yields on Covered Loans and Indemnification Asset Indemnification Asset (“IA”) amortization and its relationship with FDIC covered loan interest income accretion 8 Quarter Average = 4.93%
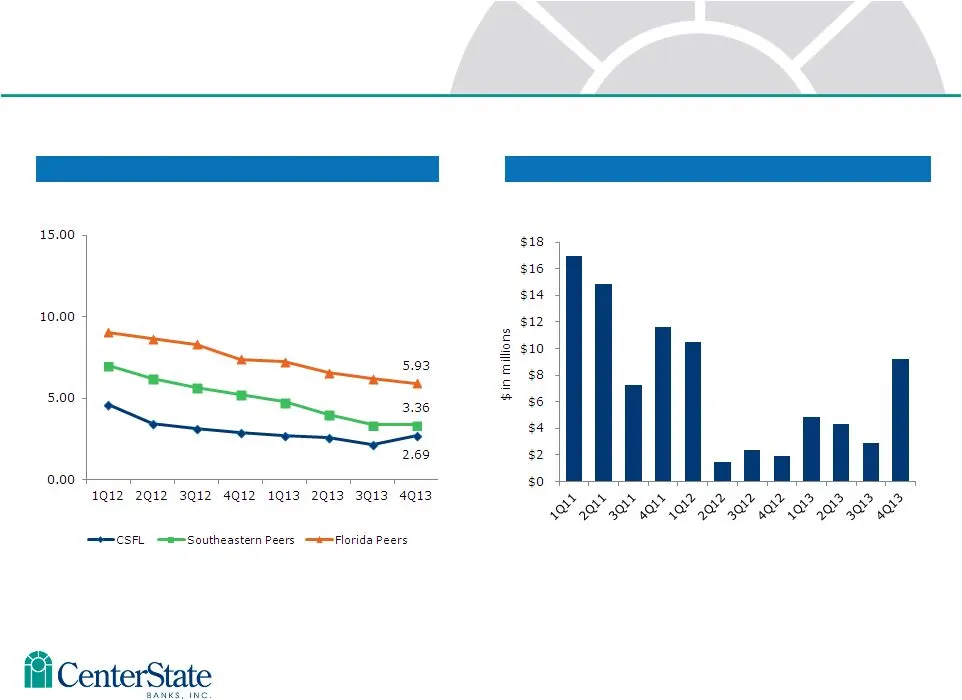
Slide 19: Credit Trends
NPAs / Loans & OREO (%) NPA Inflows Credit Trends Source: SNL Financial Nonperforming assets include loans 90 days or more past due, nonaccrual loans, and OREO/ORA; and exclude FDIC covered assets Southeastern peers include ABCB, PNFP, RNST, SCBT, UBSH and UCBI. Florida peers include all banks headq
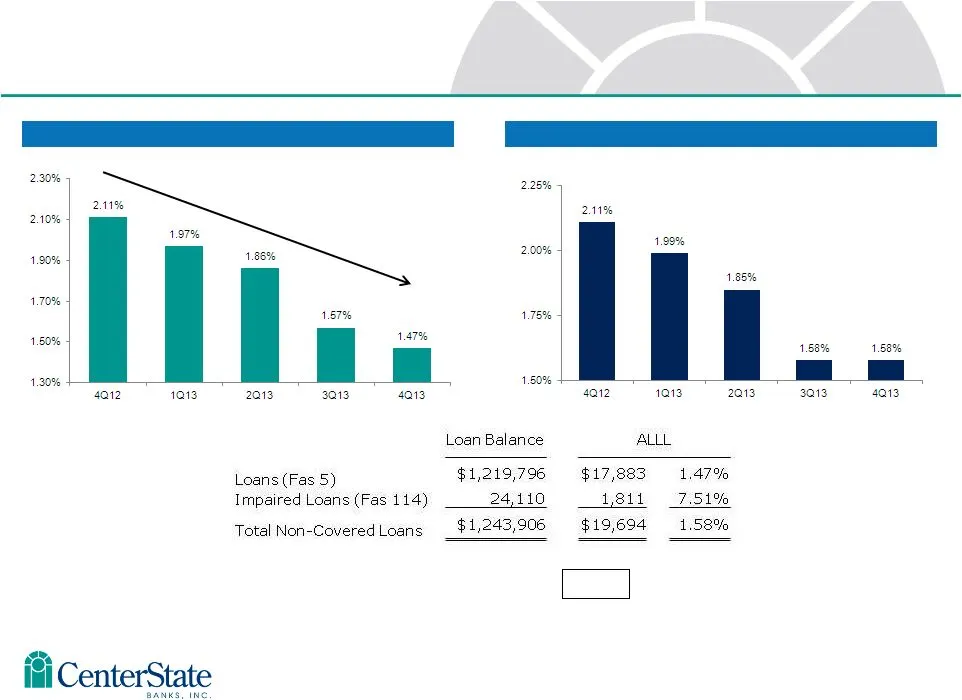
Slide 20: Total ALLL – Non-Covered Loans
20 FAS 5 Component Total ALLL – Non-Covered Loans ALLL – Non-Covered Loans ALLL as a % of NPLs= 73%

Slide 21: Deposit Portfolio
Deposit Portfolio
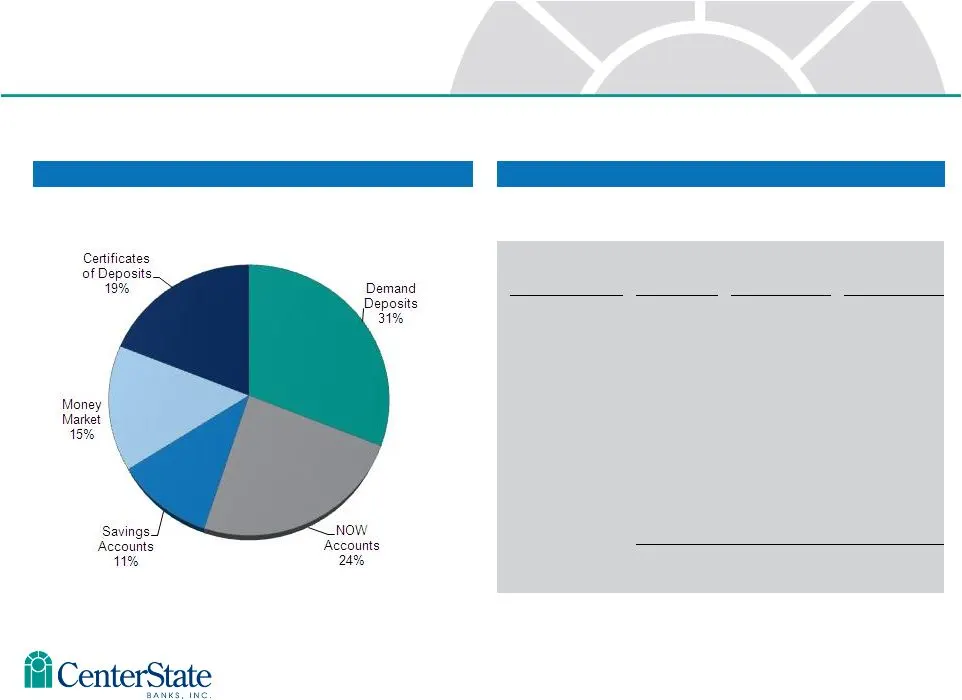
Slide 22: Total Deposits by Type and Detail
Total Deposits by Type Total Deposits Detail 23 Total Deposit Portfolio as of December 31, 2013 Deposit Type No. of Deposits Balance Avg Deposit Balance Demand Deposits 38,188 $ 645 MM $16,900 Now Accounts 50,572 $ 484 MM $9,600 Savings Deposits 17,564 $ 233 MM $13,300 Money Market 3,045 $ 309 MM $1
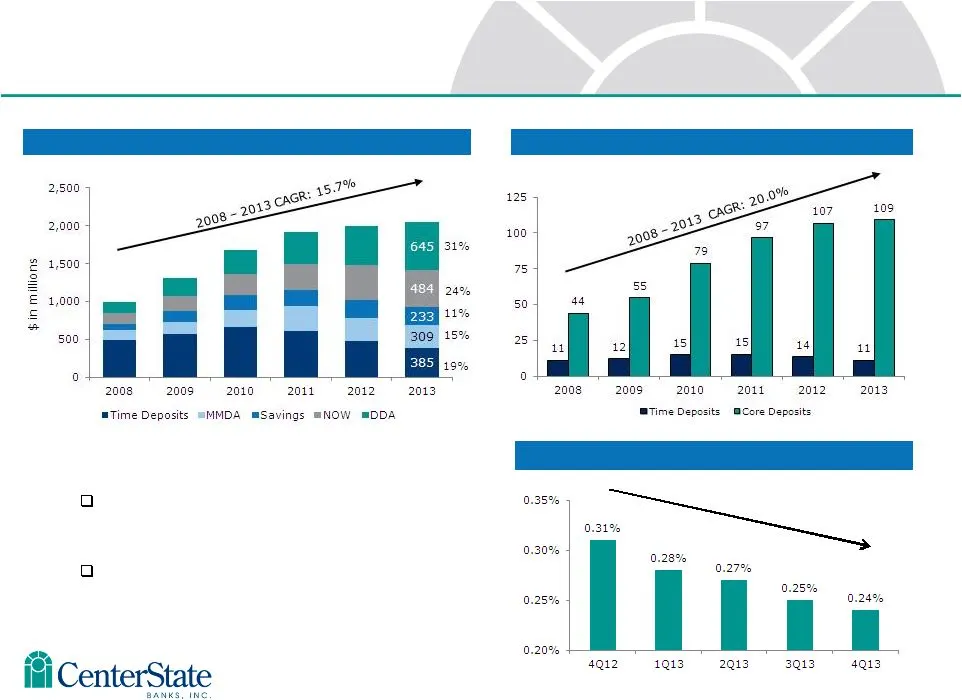
Slide 23: Building Franchise Value with Core Deposits
Total Deposits Number of Deposit Accounts (000’s) Cost of Deposits Value of core deposits not fully realized in this low rate environment. Approximately 120,386 total accounts - $17,080 average balance per account Core deposits defined as non-time deposits. Building Franchise Value with Core Deposit
Slide 24: Acquisition of First Southern Bancorp, Inc.
Acquisition of First Southern Bancorp, Inc.
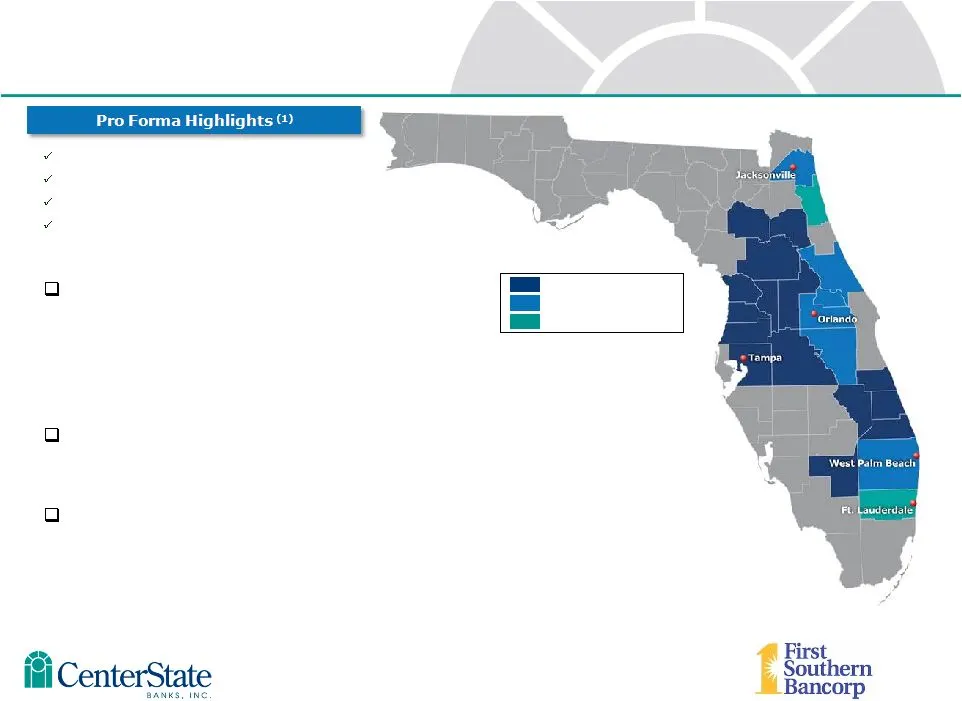
Slide 25: Overview of Pro Forma Franchise
Overview of Pro Forma Franchise (1) Based on financial data as of December 31, 2013 excluding purchase accounting adjustments; previously announced branch closings are excluded (2) Based on financial data as of November 30, 2013 Source: CSFL Management, FSOF Management Offices: Assets: $4.0 billion
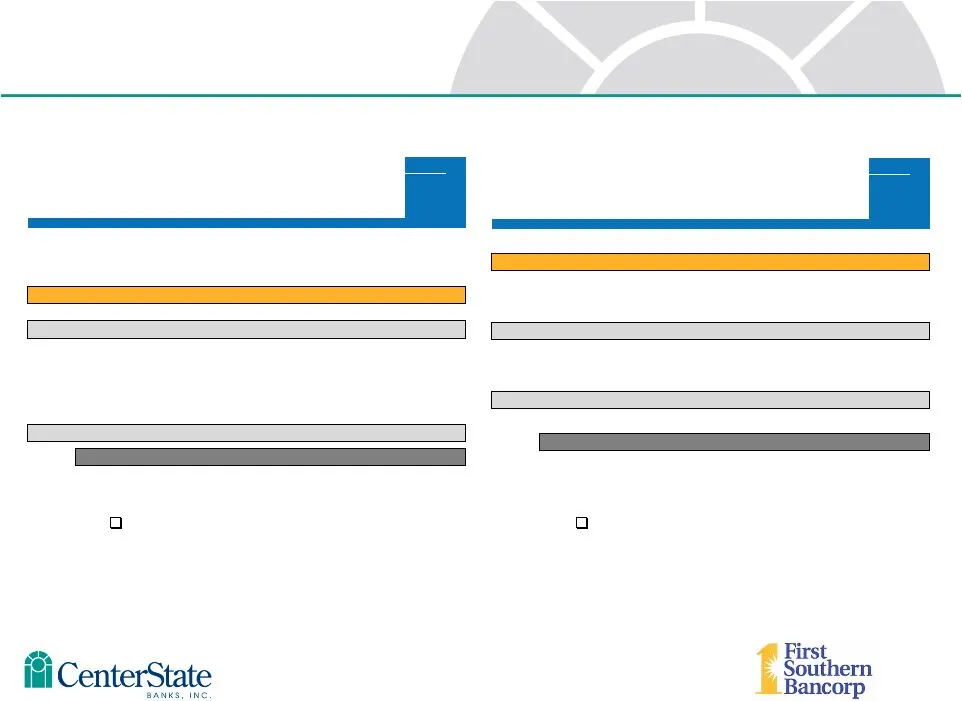
Slide 26: Las
____ i__. Las Ls a La a First di CenterState [Sette
Slide 27: Summary of Transaction Terms
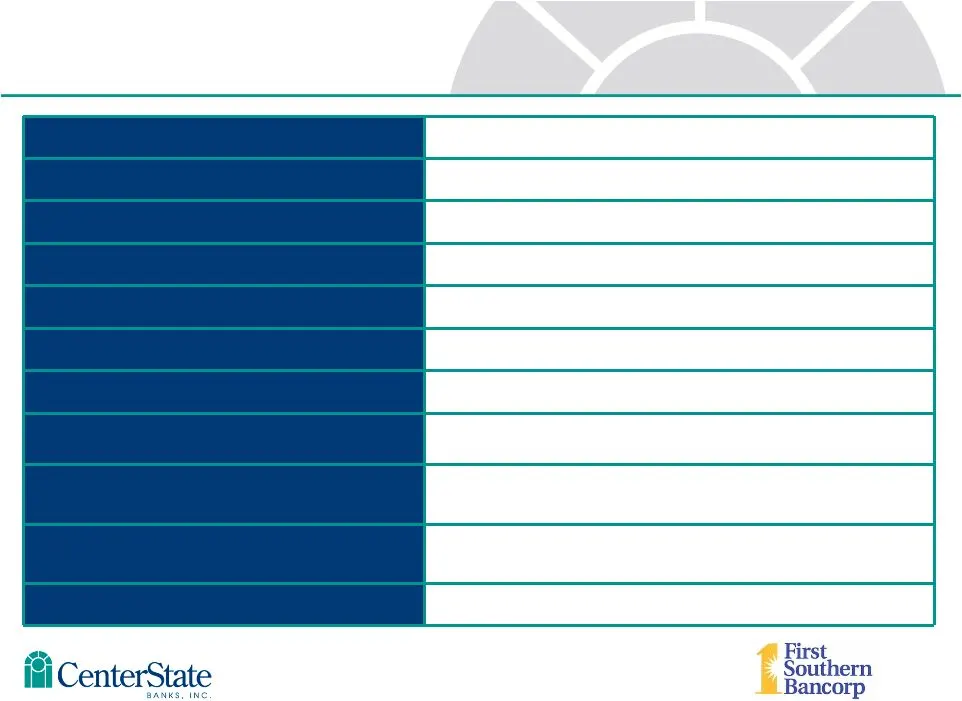
Acquiror: Target: Transaction Value (1) : Consideration Mix (1) (2) : Consideration Per Share (1) (2) : Per Share Consideration: Price / Tangible Book Value (%) (1) (2) (3) : Capital Raise: Board Seats: Required Approvals: Expected Closing: Summary of Transaction Terms CenterState Banks, Inc. (NASDA
Slide 28: Transaction Impact and Capital Ratios
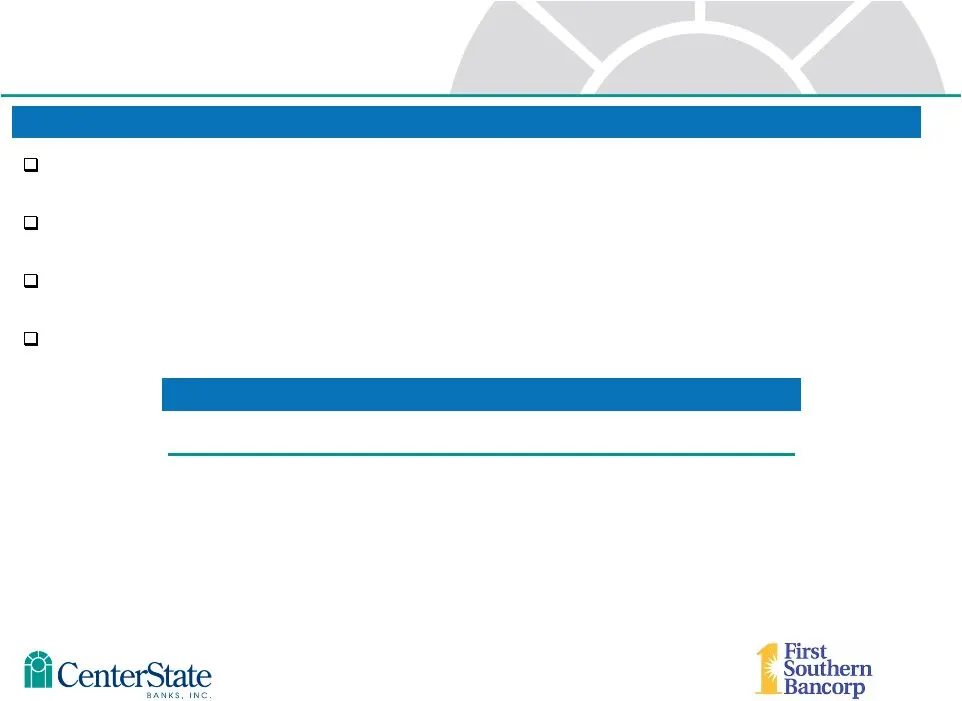
Transaction Impact Capital Ratios Immediately Accretive to Tangible Book Value (1.4% Accretive) Low Double-Digit EPS Accretion Fully Phased-In (2015: 10.3% Accretive) High Teens Internal Rate of Return (19.5%) Strong Pro Forma Capital Ratios Financial Impact Pro Forma (1) Pro Forma at Close TCE / TA
Slide 29: Transaction Assumptions
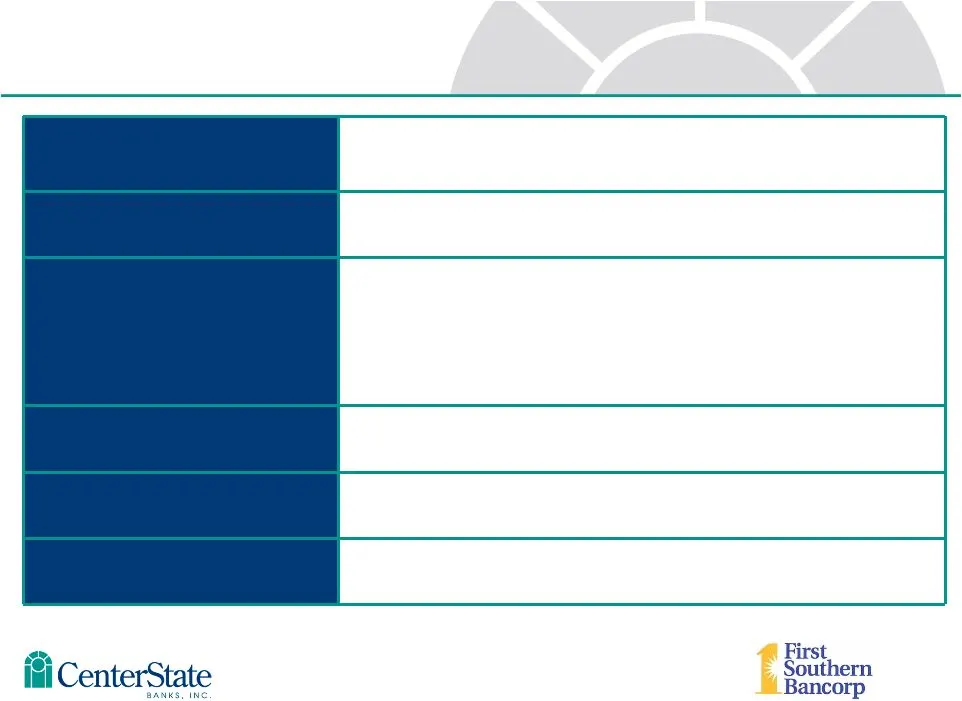
Cost Savings: Merger Related Expenses (1) : Credit mark (2) : Revenue Synergies: Core Deposit Intangible: First Southern Preferred Equity: Transaction Assumptions • 46% cost savings fully phased-in • $16.0 million in pre-tax savings in 2015 • $4.6 million after-tax • Gross credit mark to loans of $2
Slide 30: i€iCenterState (einer
i€iCenterState (einer Bancorp
Slide 31: Credit Due Diligence Highlights
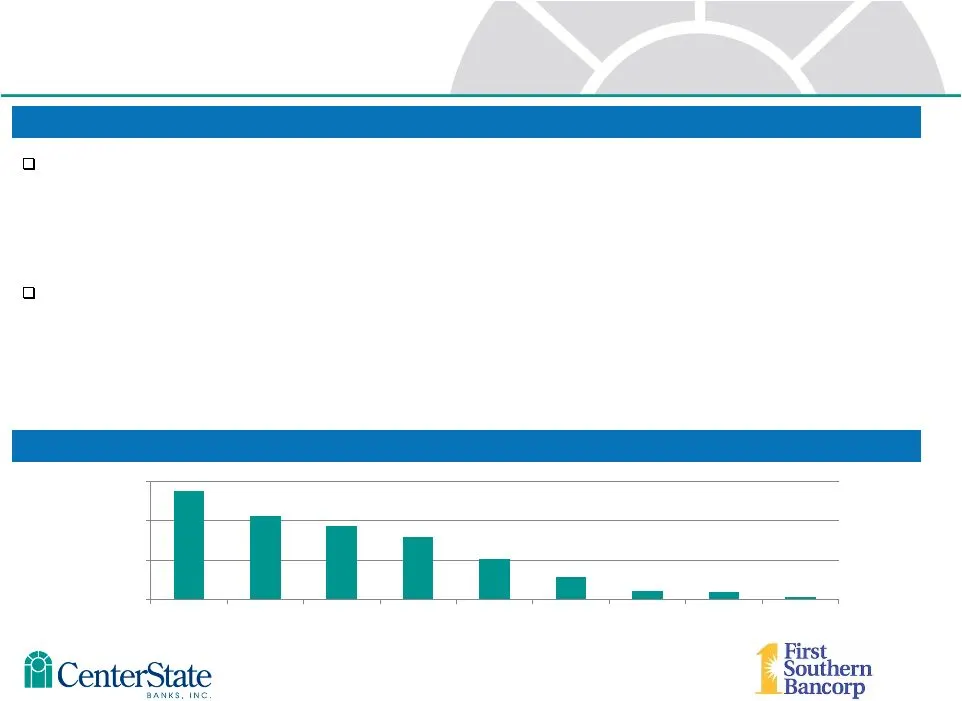
Diligence Highlights Non-Covered Portfolio: NPAs / Loans + OREO Comprehensive review process for First Southern’s loans and OREO portfolios • Credit team reviewed 82% of the dollar balance of First Southern’s loan portfolio • Completed due diligence on 28 banks since 2008 – all acquired banks are ou
Slide 32: First Southern Bancorp, Inc. Highlights
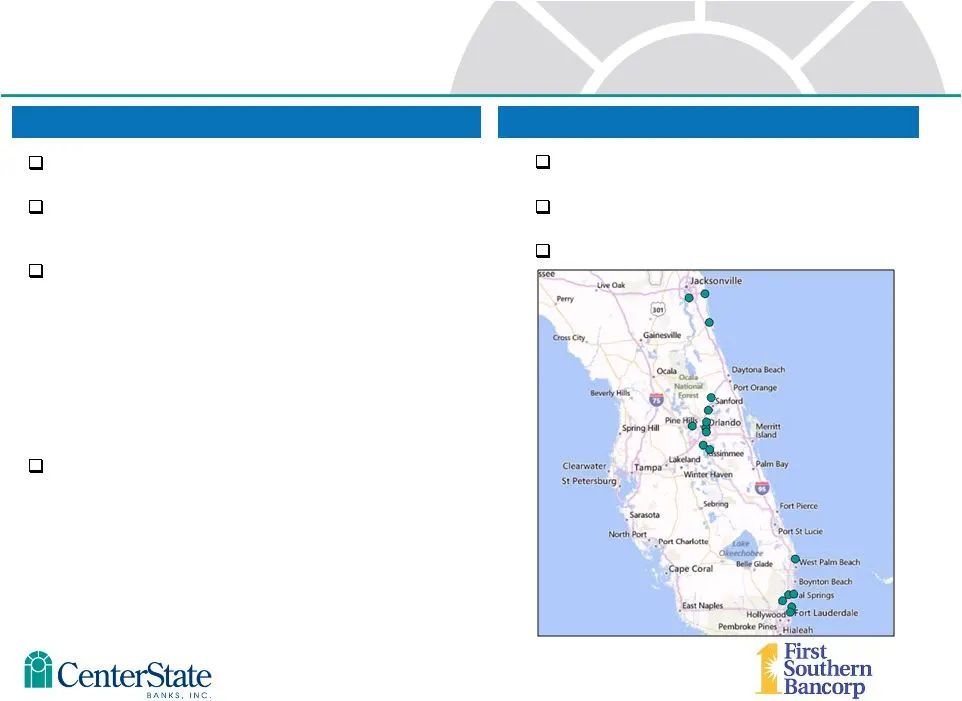
Company Highlights Financial Highlights First Southern Bancorp, Inc. Highlights Note: Data as of December 31, 2013; capital ratios assume conversion of preferred shares Source: FSOF Management and SNL Financial LLC Founded – Significant Excess Capital • 16.2% TCE / TA FDIC Acquisitions • Haven Trust
Slide 33: Pro Forma Loan Composition
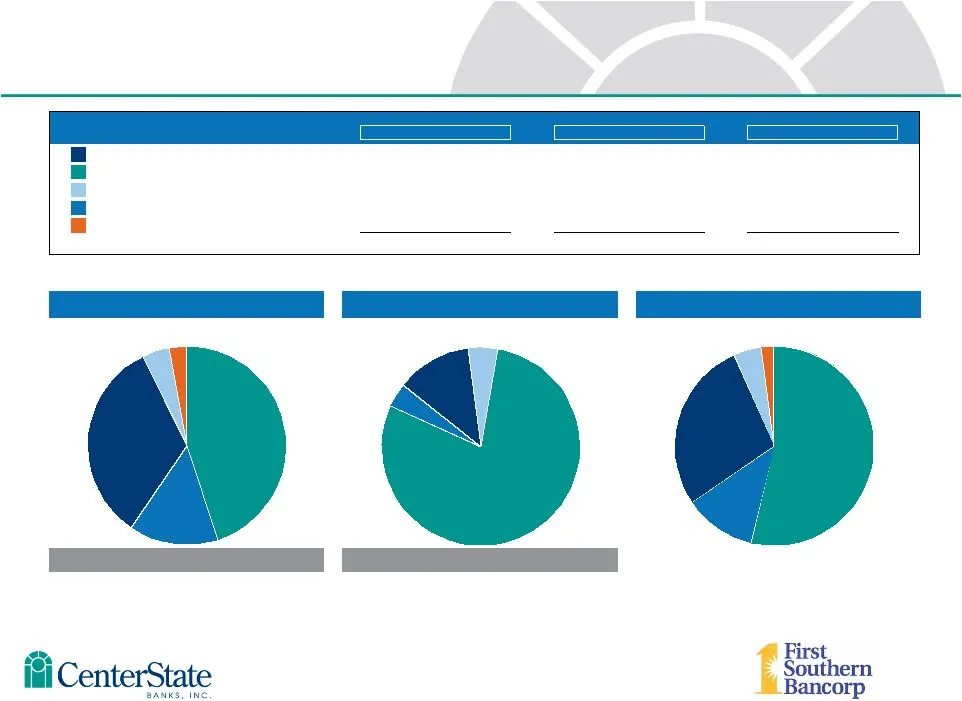
CRE 45% C&I 14% Resi RE 33% CSFL Loan Composition CRE 79% Resi RE 12% FSOF Loan Composition CRE 54% C&I 12% Resi RE 28% Pro Forma Loan Composition Dollars in thousands For the period ended December 31, 2013 Pro Forma CSFL (1) FSOF Pro Forma (2) Pro Forma Loan Composition (1) Pro forma for Gulfstream
Slide 34: Pro Forma Deposit Composition
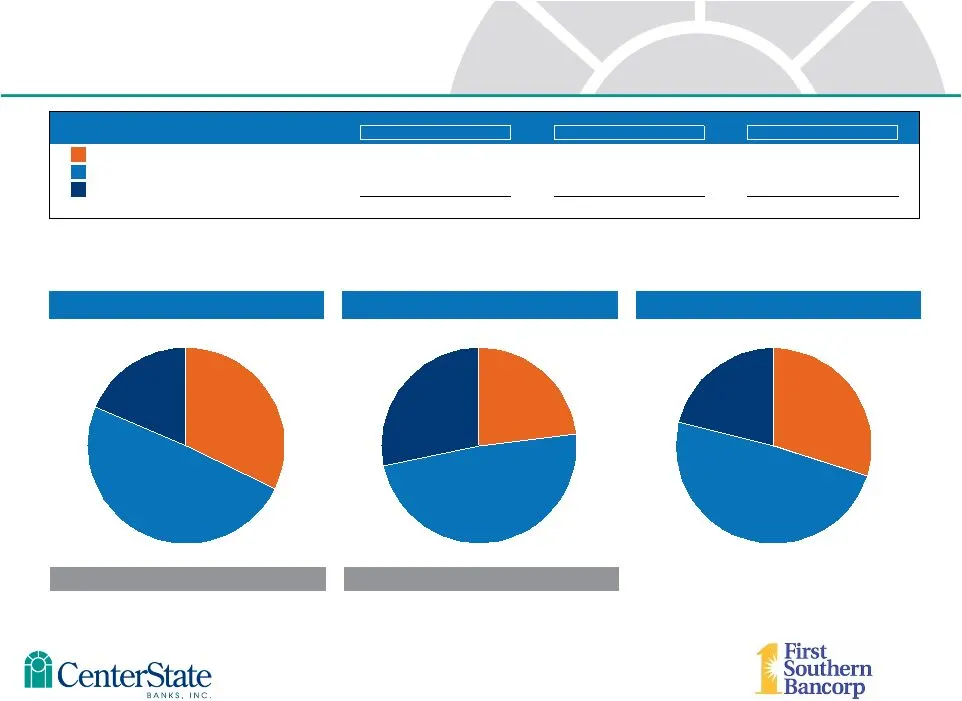
Non- Interest Bearing DDA 32% NOW, Money Market, and Savings 49% Time Deposits 19% CSFL Deposit Composition Non- Interest Bearing DDA 23% NOW, Money Market, and Savings 49% Time Deposits 28% FSOF Deposit Composition Non- Interest Bearing DDA 30% NOW, Money Market, and Savings 49% Time Deposits 21% P
Slide 35: ini CenterState
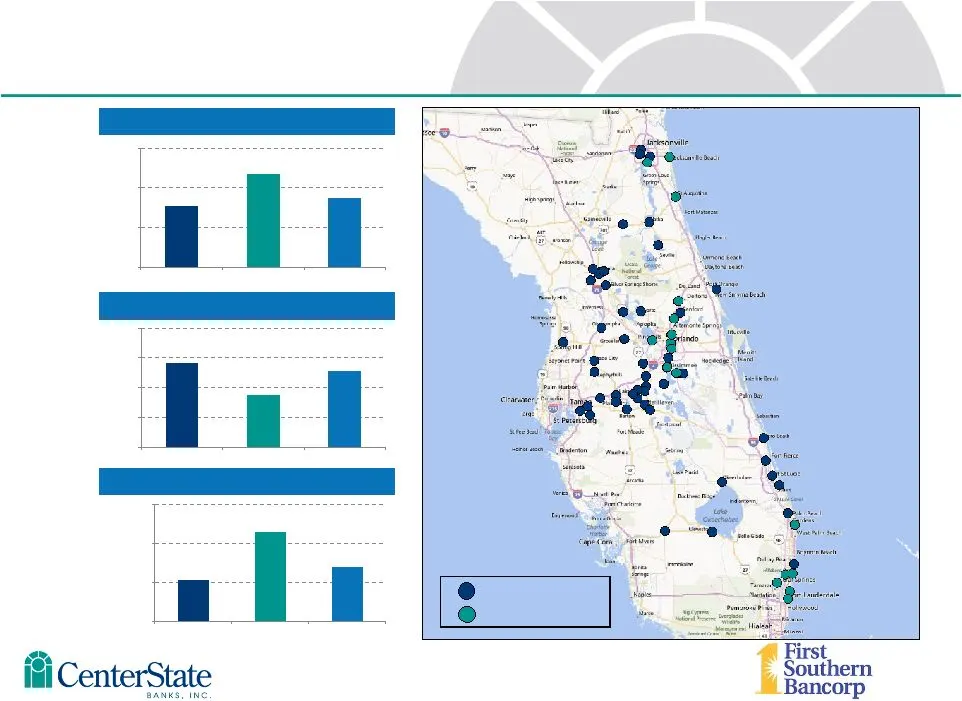
ee ini CenterState
Slide 36: igi CenterState
igi CenterState www.centerstatebaniscom BANKS. INC
Source: SEC EDGAR · 8-K filed Feb 24, 2014
More decks from CenterState Bank Corporation
 IPO Roadshow (May 2020)42 slides · May 21, 2020
 D.A. Davidson 22nd Annual Financial Institution Virtual Conference (May 2020)25 slides · May 6, 2020
 Q1 2020 Earnings Presentation25 slides · Apr 23, 2020
 Merger or Acquisition (January 2020)24 slides · Jan 27, 2020
 Q3 2019 Earnings Presentation28 slides · Nov 4, 2019
 Investor Presentation (July 2019)28 slides · Jul 30, 2019