CenterState Bank — Investor Presentation (July 2019)
28 slides from CenterState Bank's investor presentation, Jul 30, 2019
Slide 1: 2nd Quarter 2019 Investor Presentation
2nd Quarter 2019 Investor Presentation Exhibit 99.1
Slide 2: Forward Looking Statements
Forward Looking Statements Information in this presentation, other than statements of historical facts, may constitute forward-looking statements, within the meaning of the Private Securities Litigation Reform Act of 1995. These statements include, but are not limited to, CenterState’s plans, object
Slide 3: Overview of Franchise
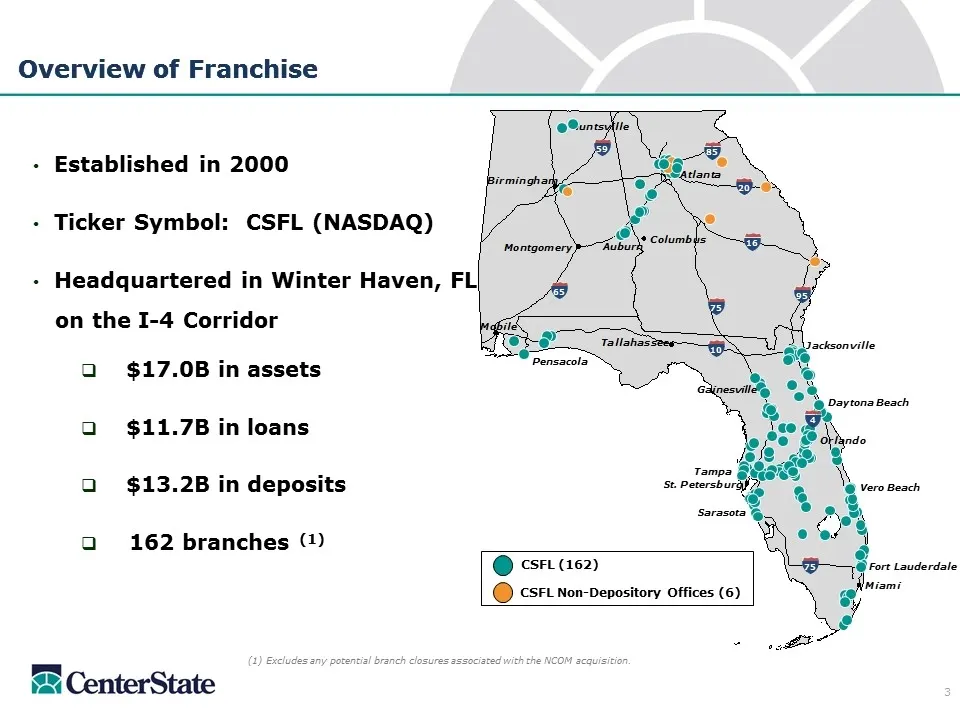
Overview of Franchise (1) Excludes any potential branch closures associated with the NCOM acquisition. Overview of Franchise Auburn Sarasota Vero Beach Daytona Beach 85 20 95 16 65 59 75 10 75 4 Pensacola Gainesville Established in 2000 Ticker Symbol: CSFL (NASDAQ) Headquartered in Winter Haven, FL
Slide 4: Stock Price Performance Over 1, 3 & 5 Year Periods
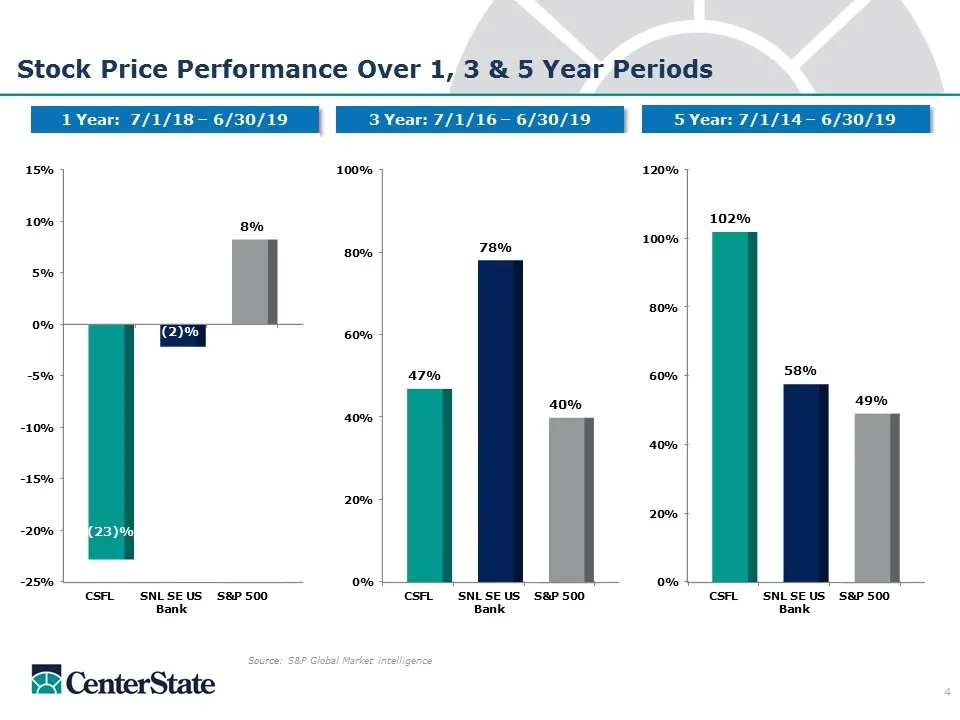
Stock Price Performance Over 1, 3 & 5 Year Periods Source: S&P Global Market intelligence 1 Year: 7/1/18 – 6/30/19 3 Year: 7/1/16 – 6/30/19 5 Year: 7/1/14 – 6/30/19

Slide 5: Superior Growth Markets
Superior Growth Markets
Slide 6: Why Invest in Florida?
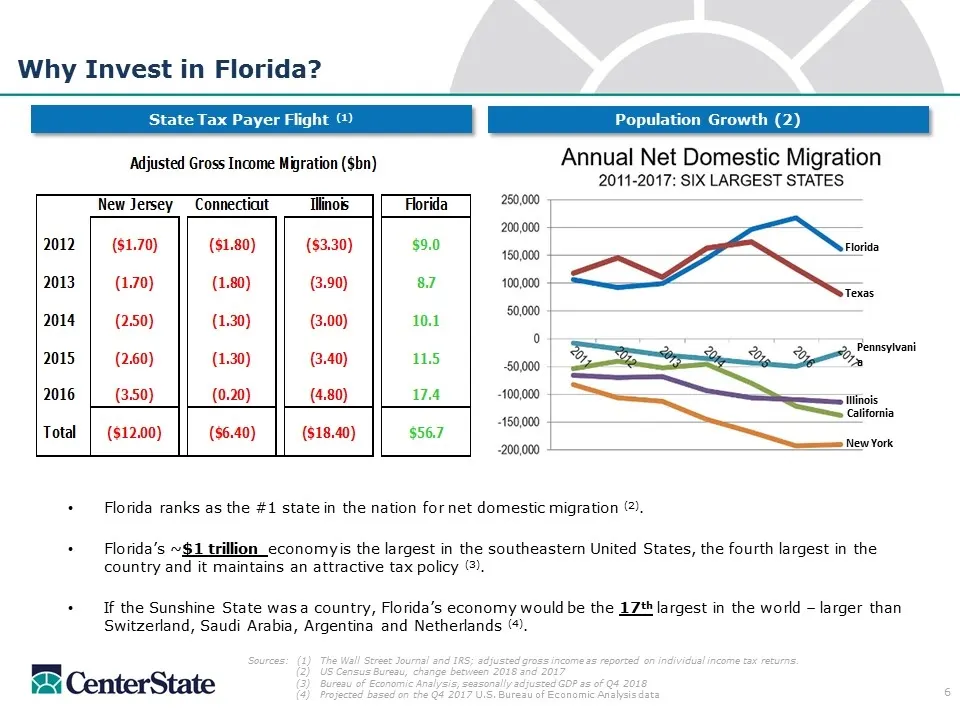
Florida ranks as the #1 state in the nation for net domestic migration (2). Florida’s ~$1 trillion economy is the largest in the southeastern United States, the fourth largest in the country and it maintains an attractive tax policy (3). If the Sunshine State was a country, Florida’s economy would b
Slide 7: Single Family Housing is a Tailwind
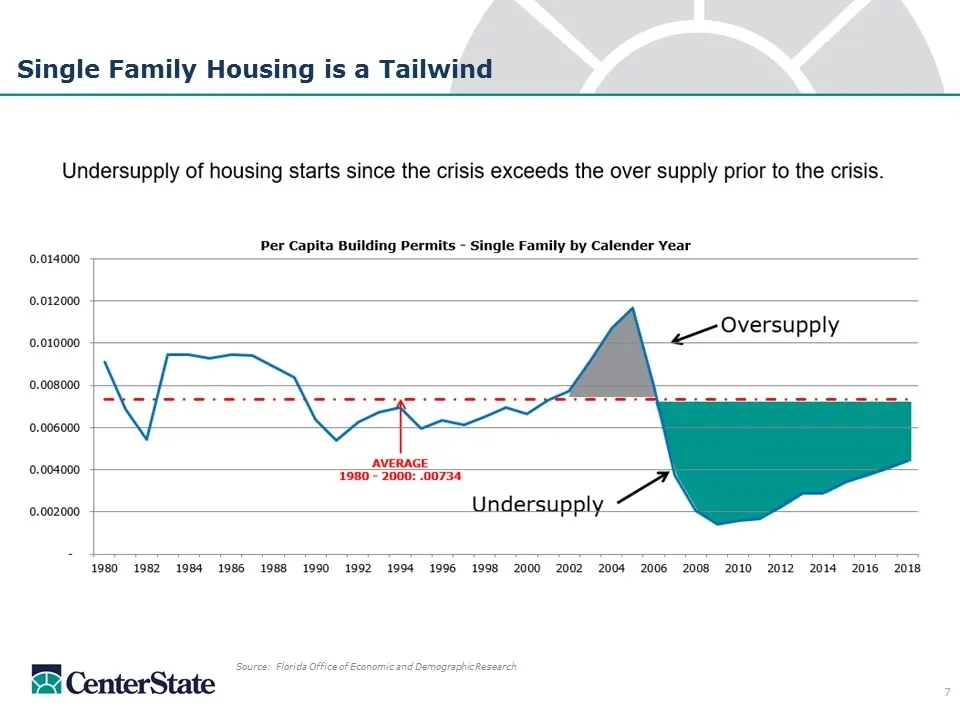
Single Family Housing is a Tailwind Source: Florida Office of Economic and Demographic Research
Slide 8: Demographics versus Peers
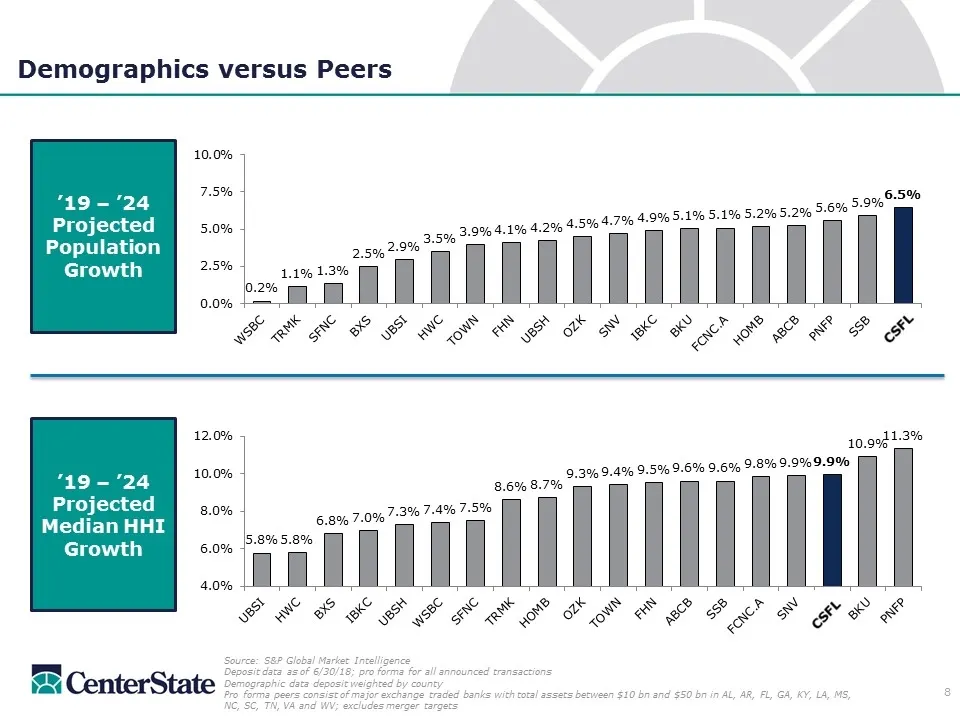
Demographics versus Peers ’19 – ’24 Projected Population Growth ’19 – ’24 Projected Median HHI Growth Source: S&P Global Market Intelligence Deposit data as of 6/30/18; pro forma for all announced transactions Demographic data deposit weighted by county Pro forma peers consist of major exchange trad
Slide 9: Best Growth Markets in the Southeast
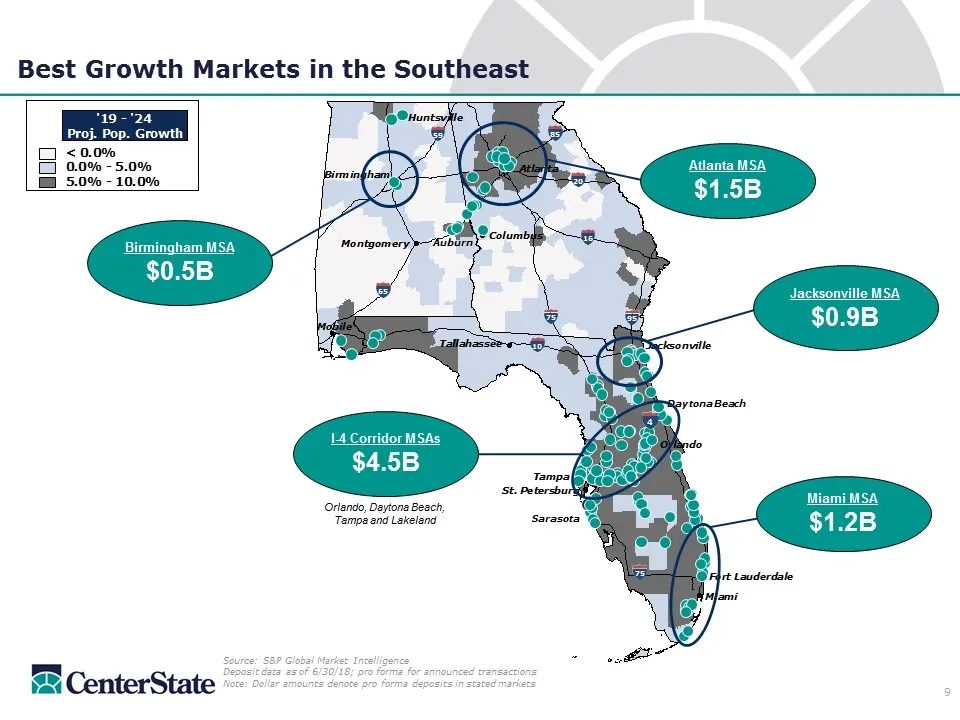
Best Growth Markets in the Southeast Auburn Sarasota Daytona Beach Source: S&P Global Market Intelligence Deposit data as of 6/30/18; pro forma for announced transactions Note: Dollar amounts denote pro forma deposits in stated markets 20 95 16 65 59 75 10 75 85 Atlanta MSA $1.5B Jacksonville MSA $0

Slide 10: Capital Management
Capital Management
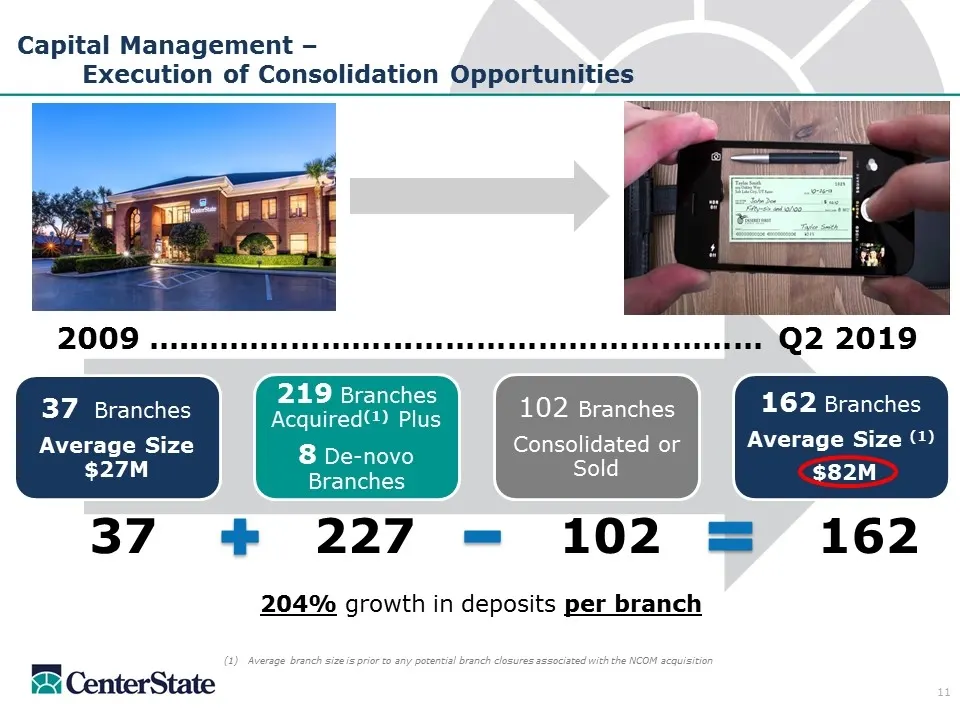
Slide 11: Capital Management – Execution of Consolidation Opportunities
Capital Management – Execution of Consolidation Opportunities 204% growth in deposits per branch 37 227 102 162 2009 …..………………...…………………….……… Q2 2019 (1) Average branch size is prior to any potential branch closures associated with the NCOM acquisition 37 Branches Average Size $27M 219 Branches Acqu
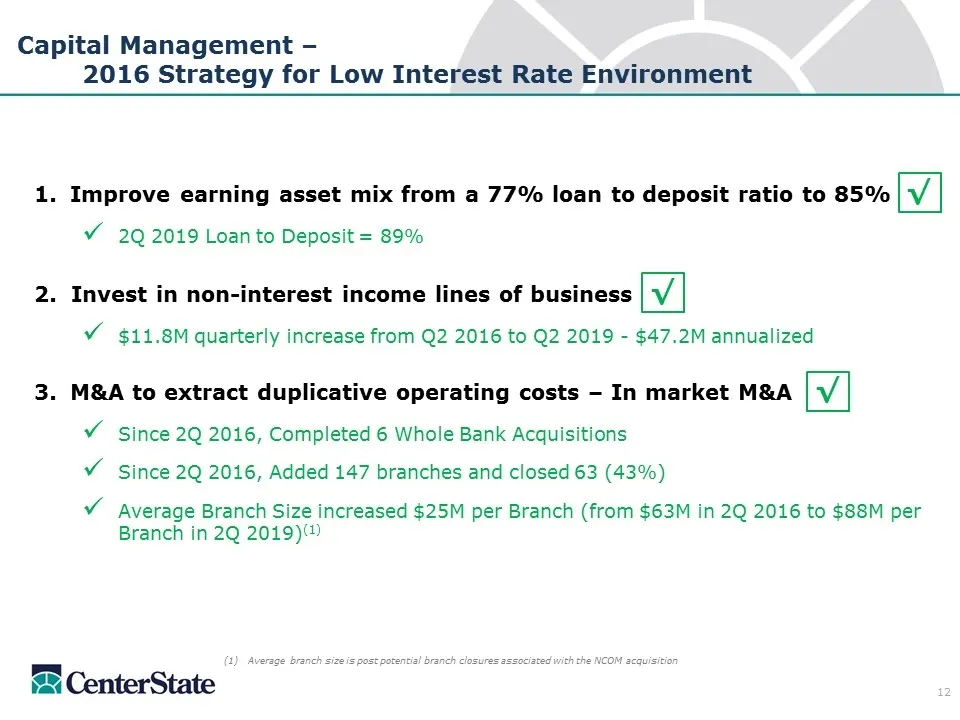
Slide 12: Capital Management – 2016 Strategy for Low Interest Rate Environment
Capital Management – 2016 Strategy for Low Interest Rate Environment Improve earning asset mix from a 77% loan to deposit ratio to 85% √ 2Q 2019 Loan to Deposit = 89% 2. Invest in non-interest income lines of business √ $11.8M quarterly increase from Q2 2016 to Q2 2019 - $47.2M annualized M&A to ext
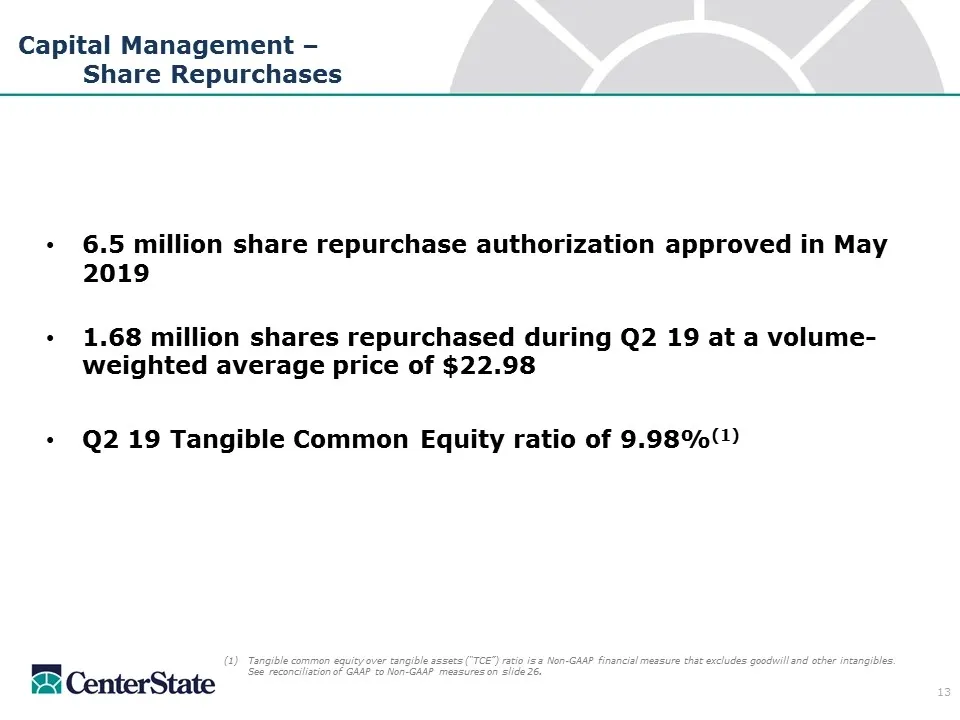
Slide 13: Capital Management – Share Repurchases
Capital Management – Share Repurchases 6.5 million share repurchase authorization approved in May 2019 1.68 million shares repurchased during Q2 19 at a volume-weighted average price of $22.98 Q2 19 Tangible Common Equity ratio of 9.98%(1) (1) Tangible common equity over tangible assets (“TCE”) rati
Slide 14: Operating Performance
Operating Performance
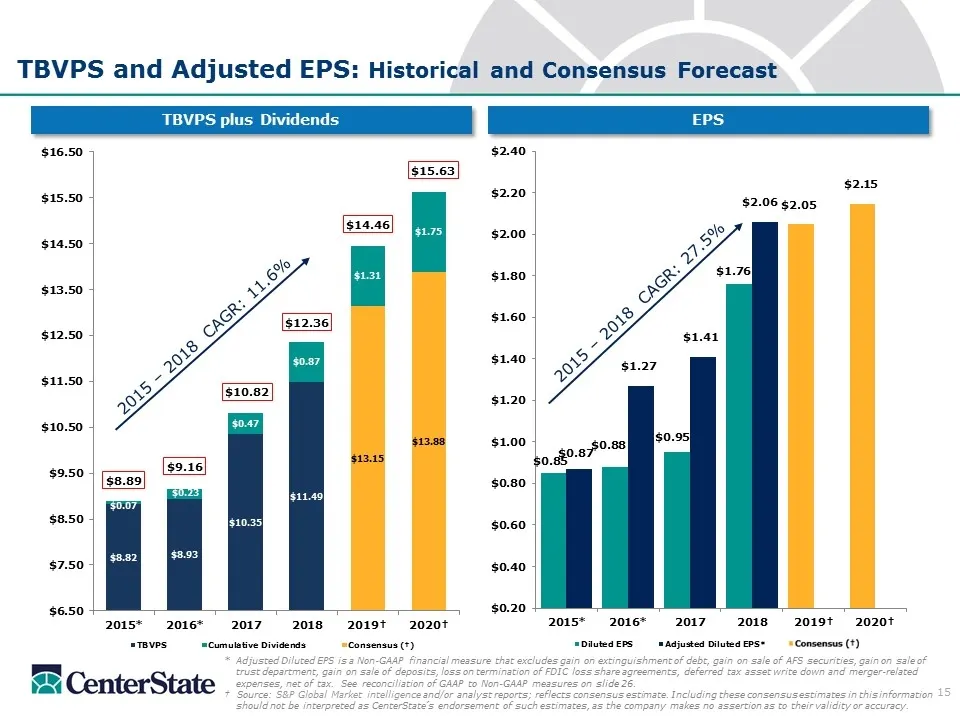
Slide 15: TBVPS and Adjusted EPS: Historical and Consensus Forecast
TBVPS and Adjusted EPS: Historical and Consensus Forecast *Adjusted Diluted EPS is a Non-GAAP financial measure that excludes gain on extinguishment of debt, gain on sale of AFS securities, gain on sale of trust department, gain on sale of deposits, loss on termination of FDIC loss share agreements,
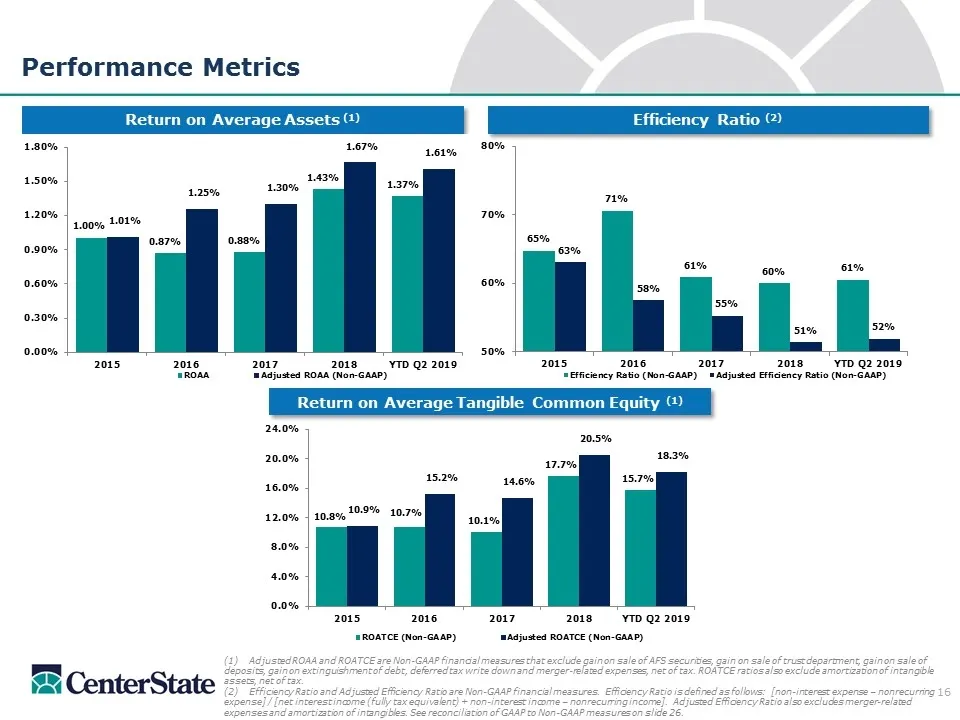
Slide 16: Performance Metrics
(1) Adjusted ROAA and ROATCE are Non-GAAP financial measures that exclude gain on sale of AFS securities, gain on sale of trust department, gain on sale of deposits, gain on extinguishment of debt, deferred tax write down and merger-related expenses, net of tax. ROATCE ratios also exclude amortizati
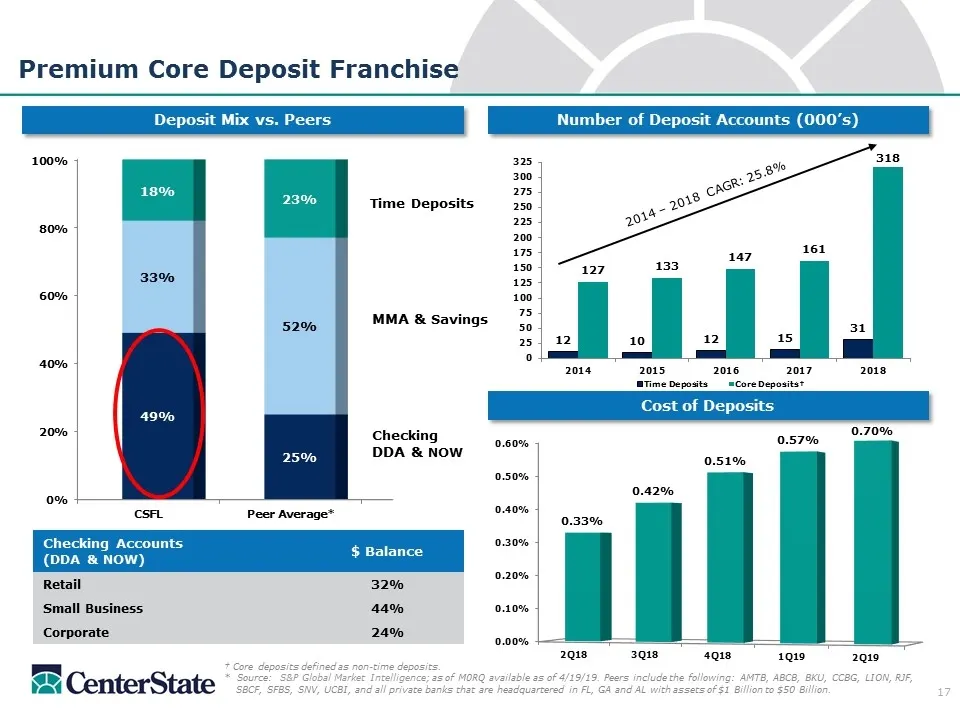
Slide 17: Premium Core Deposit Franchise
Number of Deposit Accounts (000’s) Premium Core Deposit Franchise Cost of Deposits Deposit Mix vs. Peers † Core deposits defined as non-time deposits. * Source: S&P Global Market Intelligence; as of M0RQ available as of 4/19/19. Peers include the following: AMTB, ABCB, BKU, CCBG, LION, RJF, SBCF, SF
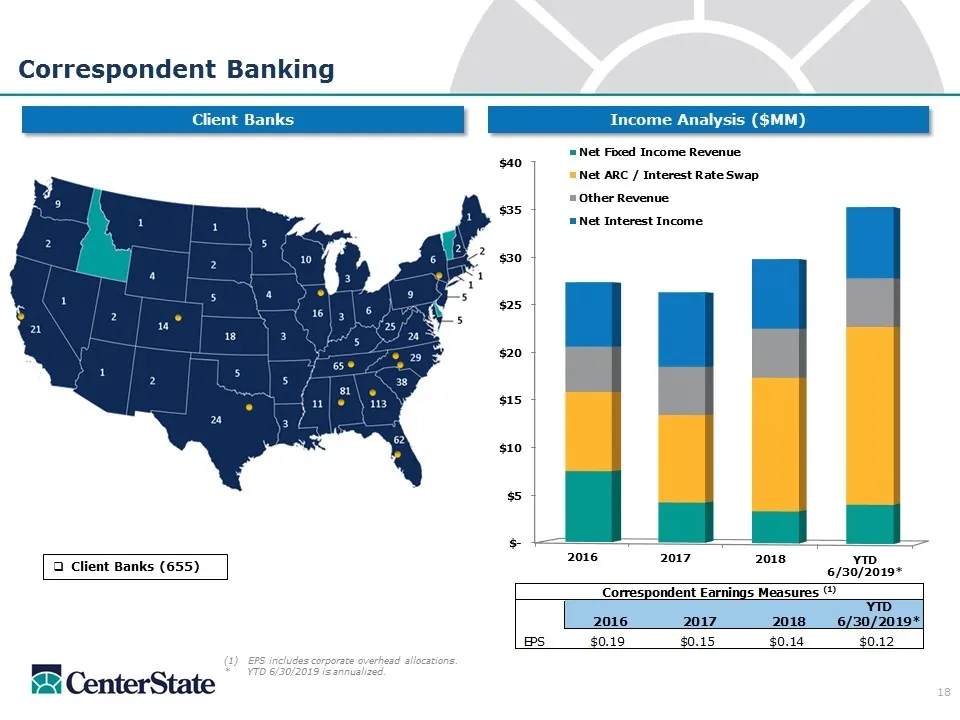
Slide 18: Correspondent Banking Income Analysis
Client Banks (655) EPS includes corporate overhead allocations. * YTD 6/30/2019 is annualized. Correspondent Banking Income Analysis ($MM) Client Banks
Slide 19: Investment Thesis
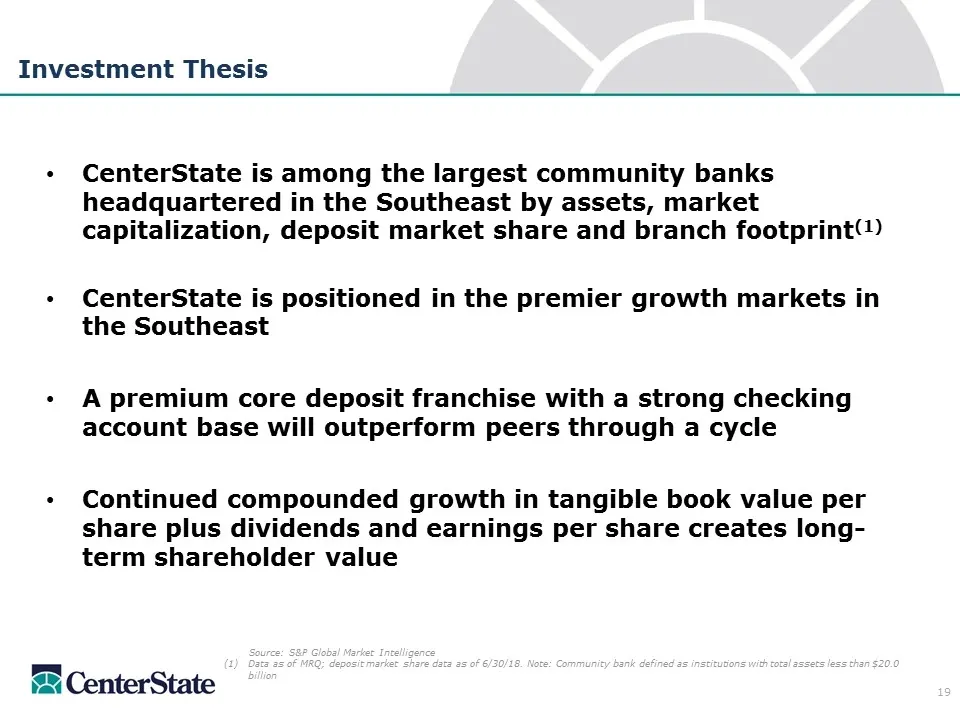
Investment Thesis Source: S&P Global Market Intelligence (1)Data as of MRQ; deposit market share data as of 6/30/18. Note: Community bank defined as institutions with total assets less than $20.0 billion CenterState is among the largest community banks headquartered in the Southeast by assets, marke

Slide 20: Supplemental
Supplemental
Slide 21: Total Loan Portfolio as of June 30, 2019
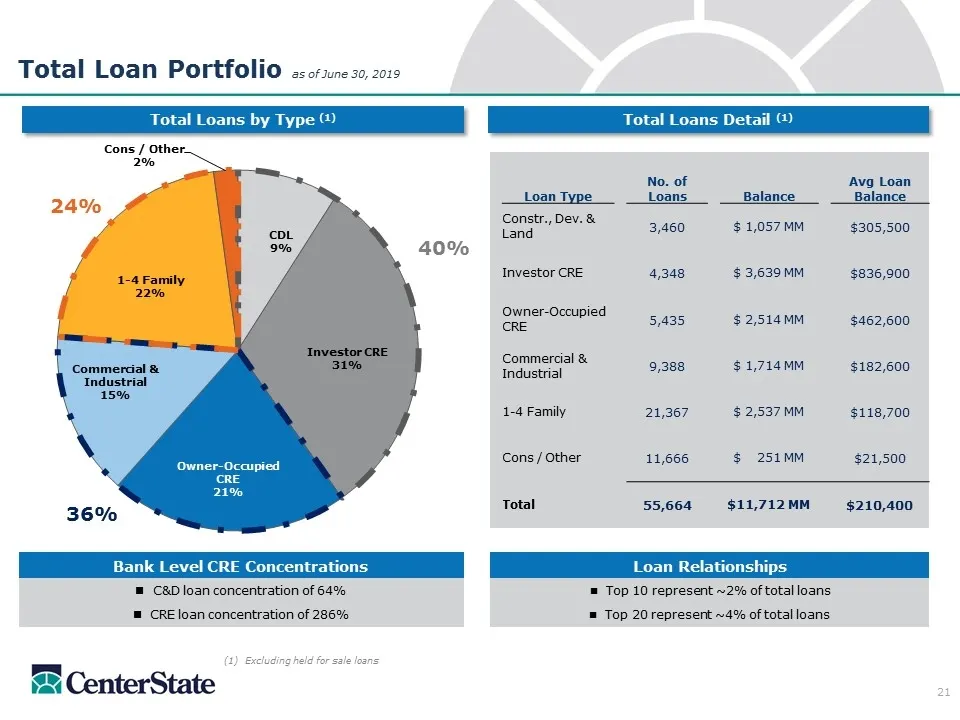
Total Loan Portfolio as of June 30, 2019 Total Loans by Type (1) Total Loans Detail (1) (1) Excluding held for sale loans Loan Relationships n Top 10 represent ~2% of total loans n Top 20 represent ~4% of total loans Bank Level CRE Concentrations C&D loan concentration of 64% CRE loan concentration
Slide 22: Loan Portfolio
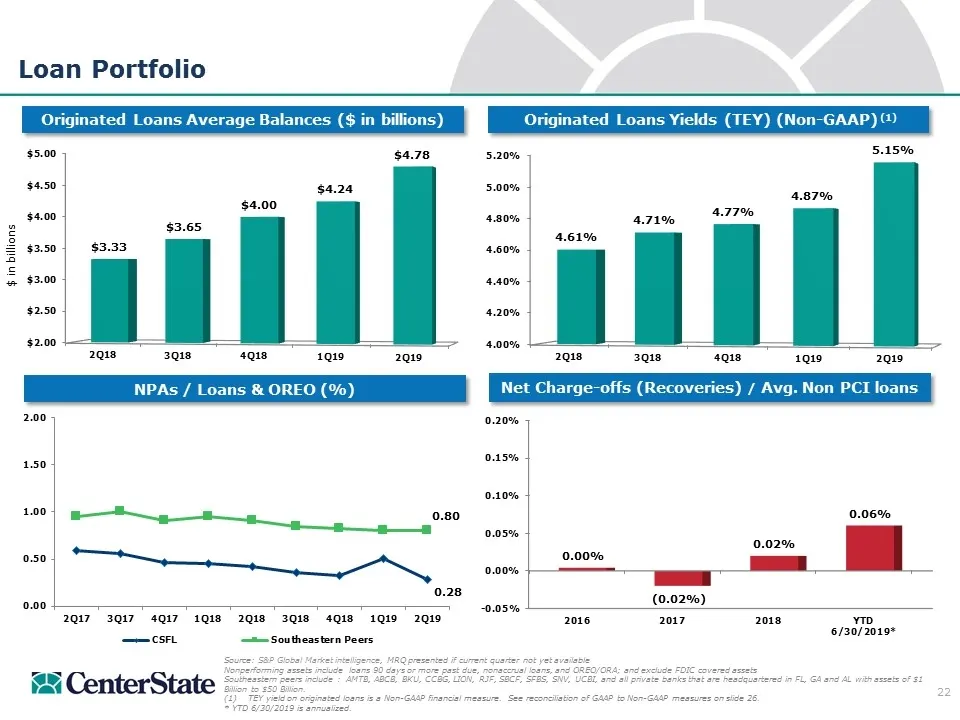
Loan Portfolio Originated Loans Yields (TEY) (Non-GAAP) (1) Originated Loans Average Balances ($ in billions) Source: S&P Global Market intelligence, MRQ presented if current quarter not yet available Nonperforming assets include loans 90 days or more past due, nonaccrual loans, and OREO/ORA; and ex
Slide 23: Acquired Loan Portfolio
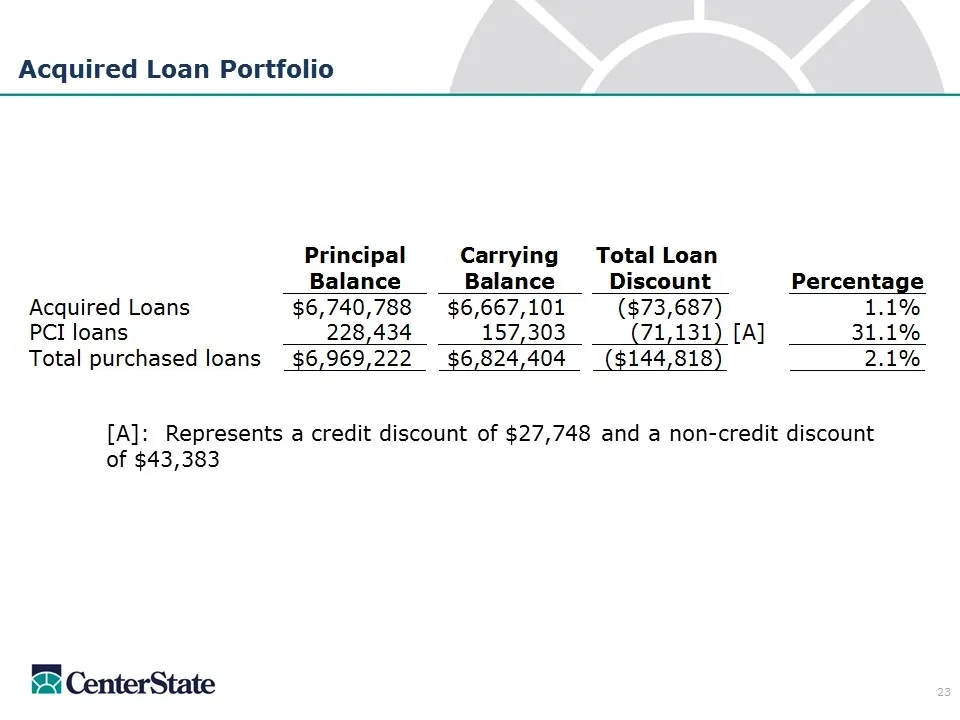
Acquired Loan Portfolio [A]: Represents a credit discount of $27,748 and a non-credit discount of $43,383
Slide 24: Deposit Relationships
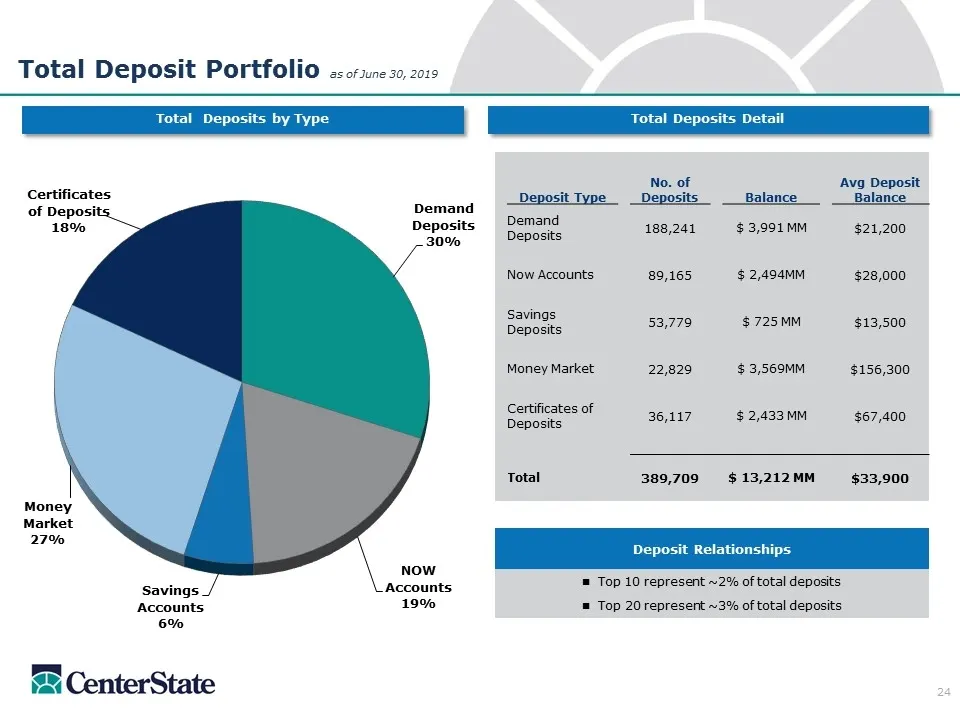
Deposit Relationships n Top 10 represent ~2% of total deposits n Top 20 represent ~3% of total deposits Total Deposits by Type Total Deposits Detail Total Deposit Portfolio as of June 30, 2019 Deposit Type No. of Deposits Balance Avg Deposit Balance Demand Deposits 188,241 $ 3,991 MM $21,200 Now Acc
Slide 25: Analyst Coverage
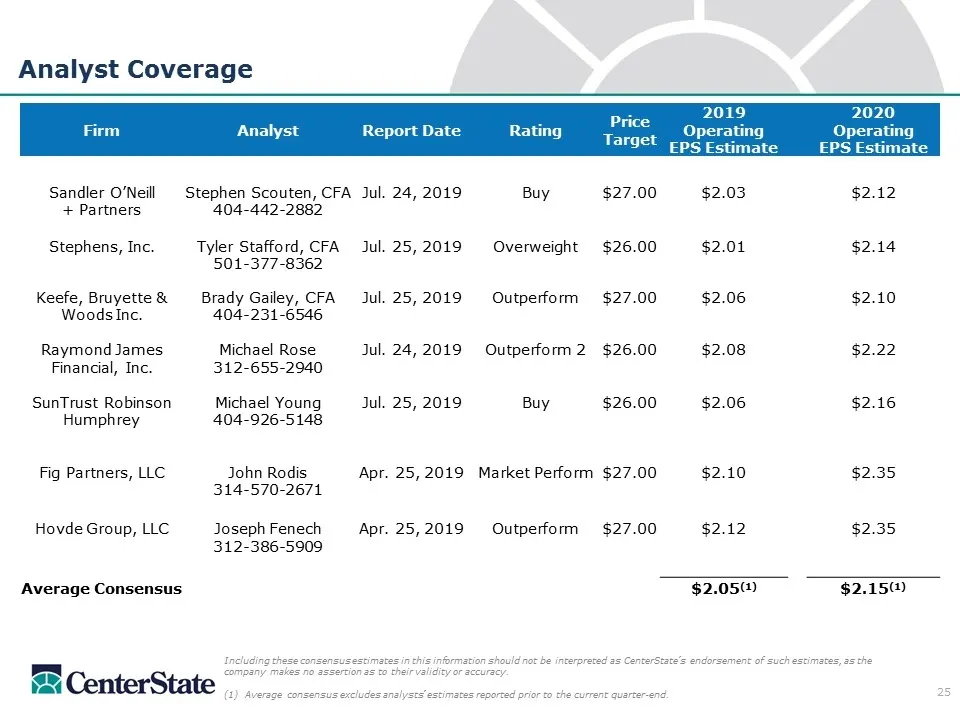
Analyst Coverage Including these consensus estimates in this information should not be interpreted as CenterState’s endorsement of such estimates, as the company makes no assertion as to their validity or accuracy. (1) Average consensus excludes analysts’ estimates reported prior to the current quar
Slide 26: Reconciliation of GAAP to Non-GAAP Measures
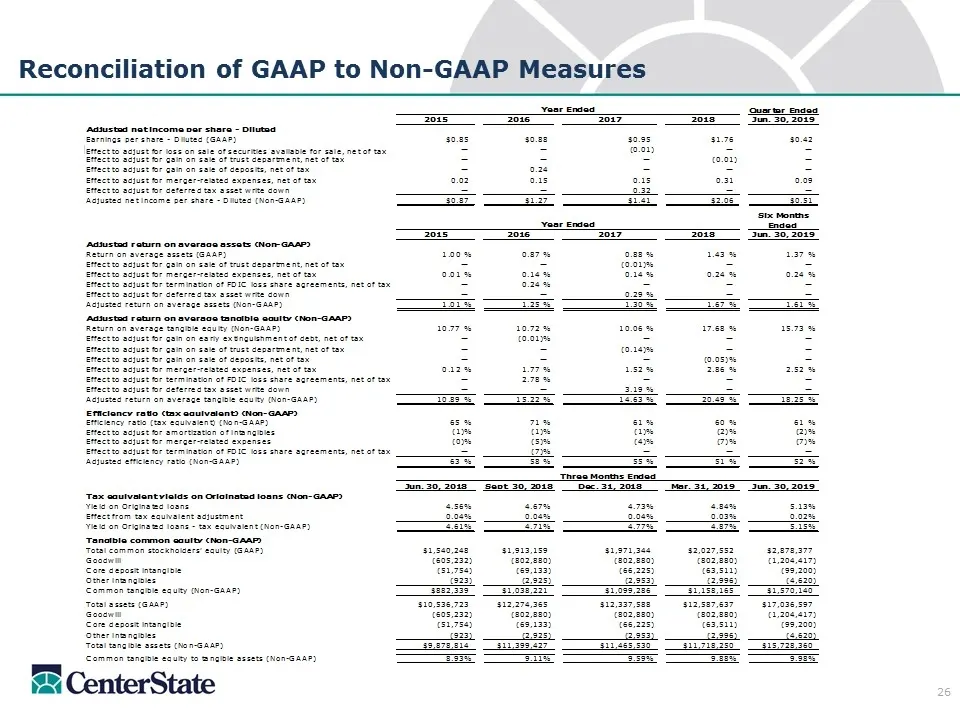
Reconciliation of GAAP to Non-GAAP Measures
Slide 27: Investor Contacts
Investor Contacts John Corbett President & CEO [email protected] Steve Young Chief Operating Officer [email protected] Phone Number 863-293-4710 Richard Murray CEO of CenterState Bank, N.A. [email protected] Will Matthews Chief Financial Officer wmatthews@centerstateban
Slide 28: CenterState
ms CenterState
Source: SEC EDGAR · 8-K filed Jul 30, 2019
More decks from CenterState Bank Corporation
 IPO Roadshow (May 2020)42 slides · May 21, 2020
 D.A. Davidson 22nd Annual Financial Institution Virtual Conference (May 2020)25 slides · May 6, 2020
 Q1 2020 Earnings Presentation25 slides · Apr 23, 2020
 Merger or Acquisition (January 2020)24 slides · Jan 27, 2020
 Q3 2019 Earnings Presentation28 slides · Nov 4, 2019
 Q1 2019 Earnings Presentation32 slides · Apr 30, 2019