Teppco Partners LP — Investor Presentation (November 2004)
38 slides from Teppco Partners LP's investor presentation, Nov 3, 2004
Slide 1: TEPPCO Partners, L.P. Analyst and Investor Presentation
TEPPCO Partners, L.P. Analyst and Investor Presentation November, 2004 TEPPCO
Slide 2: Forward-looking Statements
Forward-looking Statements m= The material and information furnished in this presentation contains forward-looking statements as such are described within various provisions of the Federal Securities Laws. Forward-looking statements include projections, estimates, forecasts, plans and objectives and
Slide 3: TEPPCO Partners, L.P.
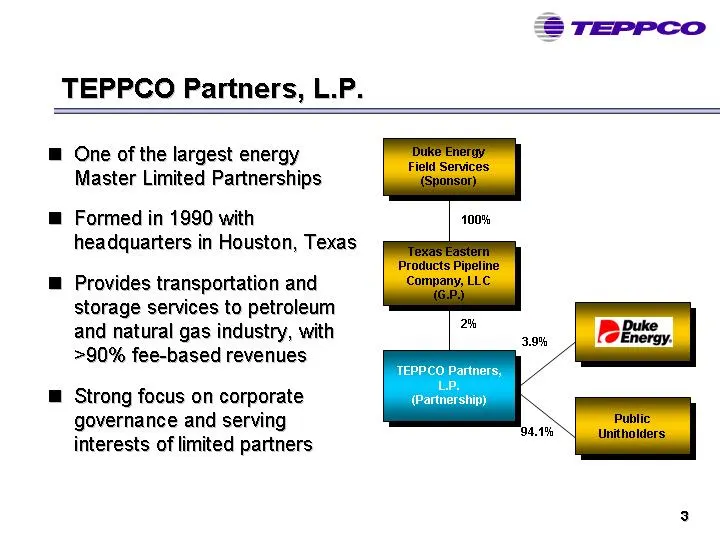
TEPPCO Partners, L.P. m@ One of the largest energy Master Limited Partnerships @ Formed in 1990 with headquarters in Houston, Texas @ Provides transportation and storage services to petroleum and natural gas industry, with >90% fee-based revenues TEPPCO Partners, LP. ™@ Strong focus on corporate (Pa
Slide 4: The Sponsor: Duke Energy Field Services
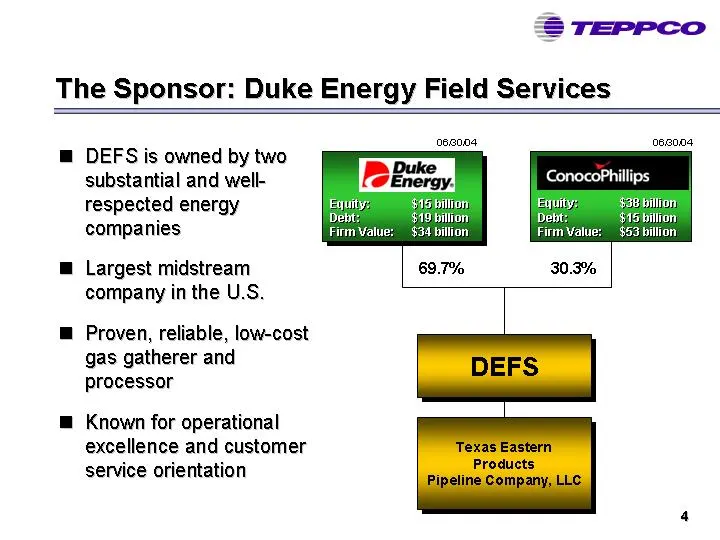
The Sponsor: Duke Energy Field Services DEFS is owned by two substantial and well- respected energy companies Largest midstream company in the U.S. Proven, reliable, low-cost gas gatherer and processor Known for operational excellence and customer service orientation Equiys Debt; Firm Valuer 62004 6
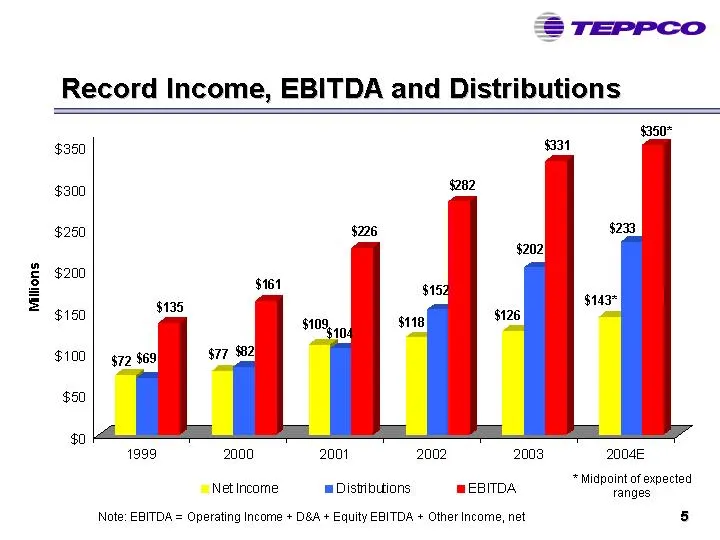
Slide 5: Record Income, EBITDA and Distributions
Record Income, EBITDA and Distributions $360 $331 $300 $260 $200 $160 $100 $60 $0 1999 2000 2001 2002 2003 2004 * Midpoint of eqpected = Net Income = Distibutions EBITDA eae Note: EBITDA = Operating Income + D&A + Equity EBITDA + Other Income, net 5
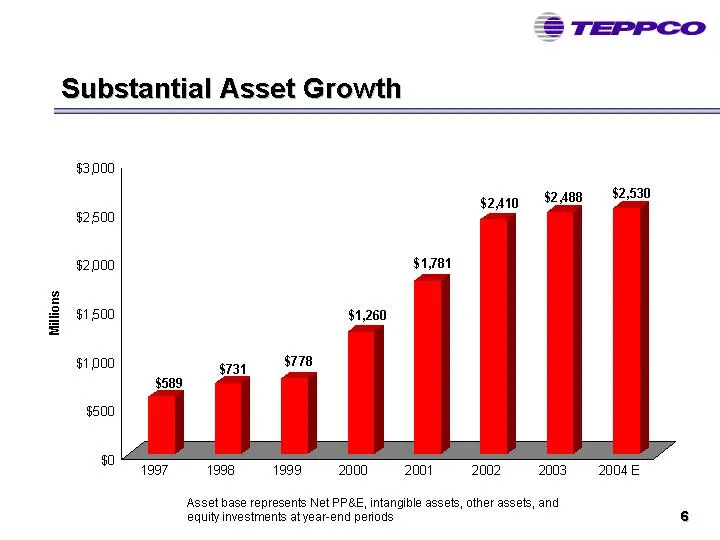
Slide 6: Substantial Asset Growth
Substantial Asset Growth $3,000 $2600 $2000 $1,600 $1,000 $500 $0 197) 19981999 20002001 20022008 M4 Asset base represents Net P&E, intangible assets, other assets, and equity investments at year-end periods 6
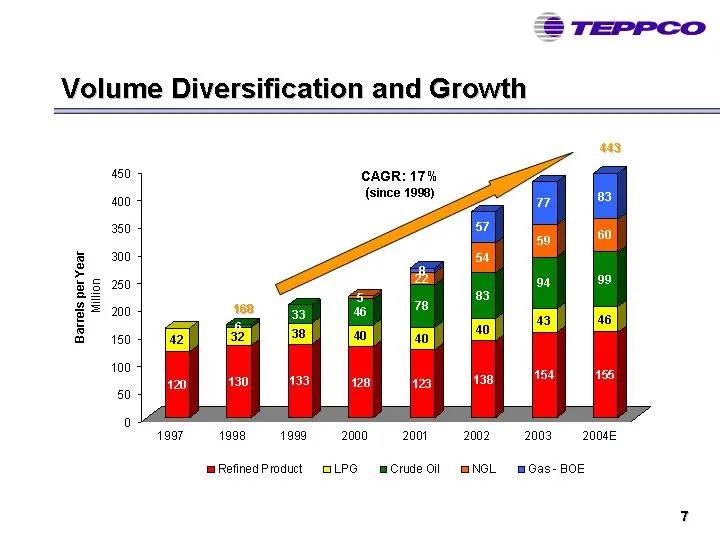
Slide 7: Volume Diversification and Growth
Volume Diversification and Growth CAGR: 17% (since 1998) Barrels perYear i997 1998 = 1999» 2000» 2001, «= 2002-2003 200KE mRefinedProduct =GLPG mCrude ill @NGL |Gas-BOE
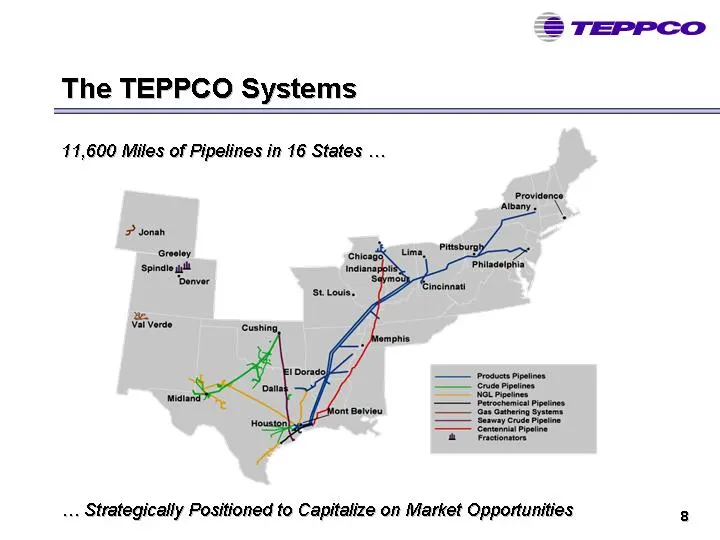
Slide 8: The TEPPCO Systems
The TEPPCO Systems 11,600 Miles of Pipelines in 16 States ... ... Strategically Positioned to Capitalize on Market Opportunities 8
Slide 9: TEPPCO's Three Business Segments
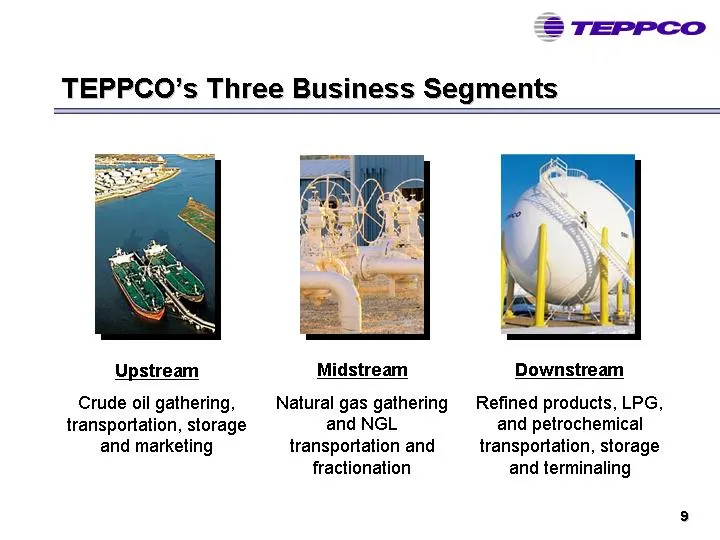
TEPPCO’s Three Business Segments Upstream Midstream Downstream Crude oil gathering, Natural gas gathering Refined products, LPG, transportation, storage and NGL and petrochemical and marketing transportation and transportation, storage fractionation and terminaling
Slide 10: TEPPCO Corporate Strategy
TEPPCO Corporate Strategy @ Focus on internal growth prospects — Increase throughput on our pipeline systems — Expand / upgrade existing assets and construct new pipeline and gathering systems ™@ Target accretive acquisitions in our core businesses that provide growth potential — Utilize competitive
Slide 11: TEPPCO's Upstream Business
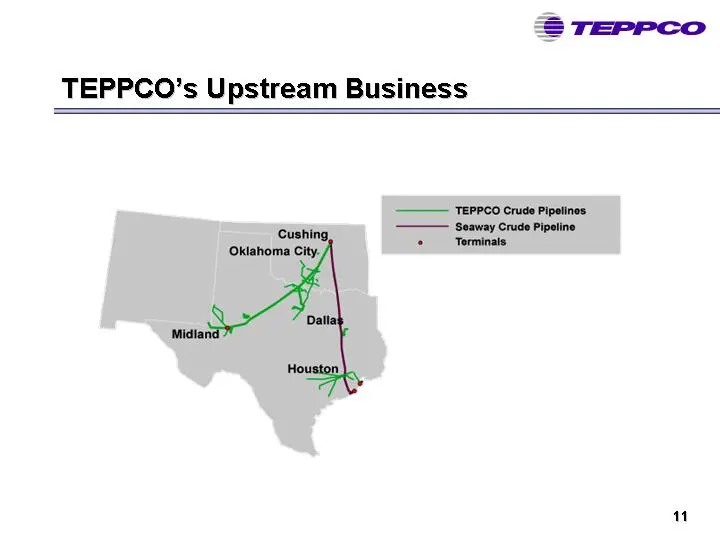
TEPPCO’s Upstream Business —— TEPPCO Crude Pipelines Seaway Crude Pipeline © Terminals "
Slide 12: Upstream EBITDA Contribution
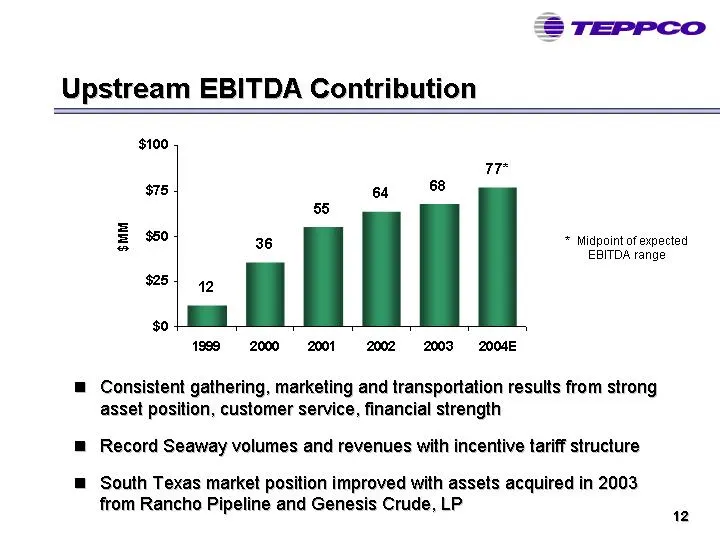
; Upstream EBITDA Contribution $100 $75 $50 sum * Midpoint of expected EBITDA range $25 $0 1999 2000 2001-2002, 2003 20ME. @ Consistent gathering, marketing and transportation results from strong asset position, customer service, financial strength m Record Seaway volumes and revenues with incentive
Slide 13: Upstream Strategy
Upstream Strategy @ Strengthen market position around existing asset base — Focus activity in West Texas, South Texas and Red River areas — Increase margins by improving/expanding services and reducing costs through asset optimization @ Pursue strategic acquisitions to complement existing assets @ R
Slide 14: TEPPCO's Midstream Business
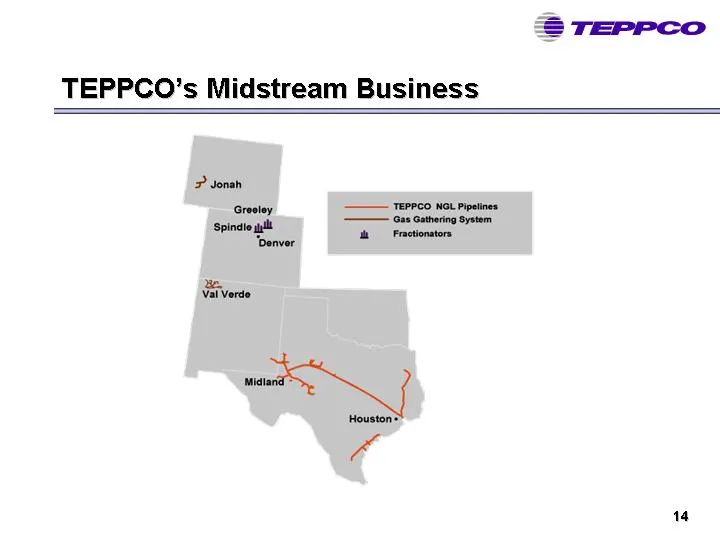
TEPPCO’s Midstream Business P Jonah - FESS = Sein 7 2 Be 14
Slide 15: Midstream EBITDA Contribution
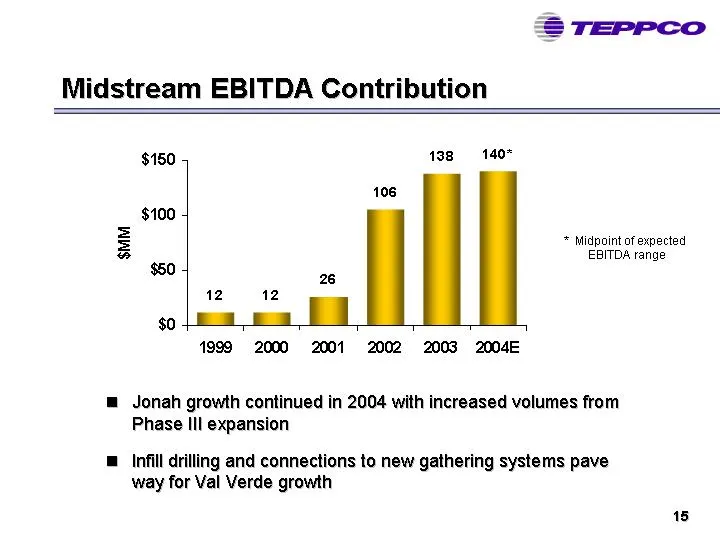
Midstream EBITDA Contribution $150 138 140° 106 $100 = = Midpoint orexpectea B EBITDA range $50 26 120 12 $0 1999 2000 2001 2002 2003 2004E @ Jonah growth continued in 2004 with increased volumes from Phase Ill expansion @ Infill drilling and connections to new gathering systems pave way for Val Ver
Slide 16: Midstream Strategy
Midstream Strategy @ Strong portfolio of high quality assets in prolific gas producing basins — Assets positioned in basins playing an increasingly vital role in the United States’ domestic gas supply @ Realize full potential of existing assets — Increase throughput on Val Verde, Jonah and Chaparral
Slide 17: Val Verde Gas Gathering System
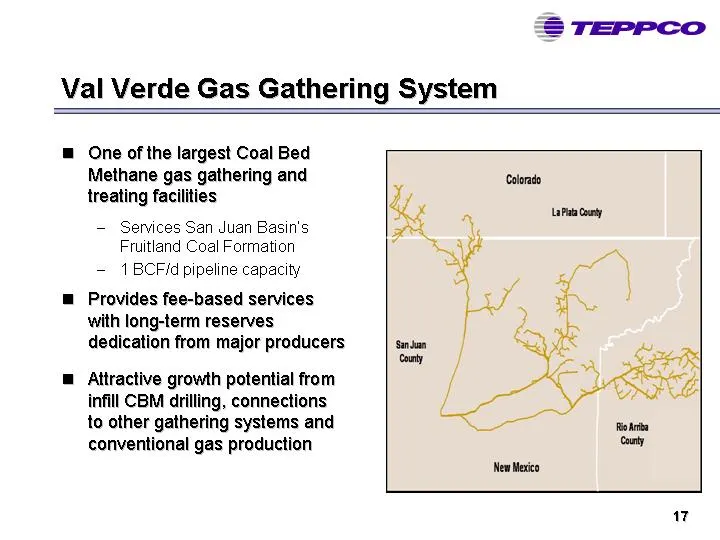
: Val Verde Gas Gathering System ™@ One of the largest Coal Bed Methane gas gathering and treating facilities - Services San Juan Basin's Fruitland Coal Formation — 1 BCFid pipeline capacity ™@ Provides fee-based services with long-term reserves dedication from major producers @ Attractive growth po
Slide 18: Val Verde Growth Potential
Val Verde Growth Potential @ Near-term volume growth from Coal Bed Methane infill drilling and connections to adjacent systems — Volumes from infill wells dedicated to Val Verde and within footprint of existing gathering system — Full completion of infill wells by producers occurring at a slower pac
Slide 19: Gas Gathering Volumes — Val Verde
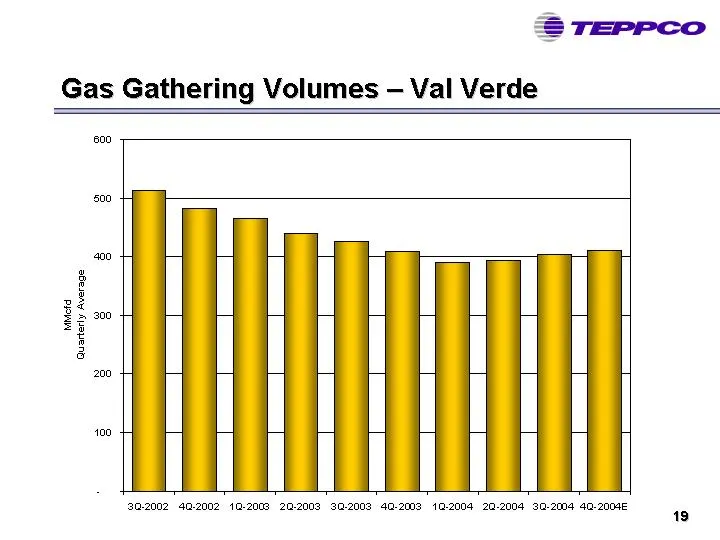
Gas Gathering Volumes — Val Verde 00 500 00 Meta Guarterly Average 200 100 20-2002 40-2002 10-2008 20-2003 20-2002 40-2009 10-2004 20-200 30-2004 40-2006
Slide 20: Jonah Gas Gathering System
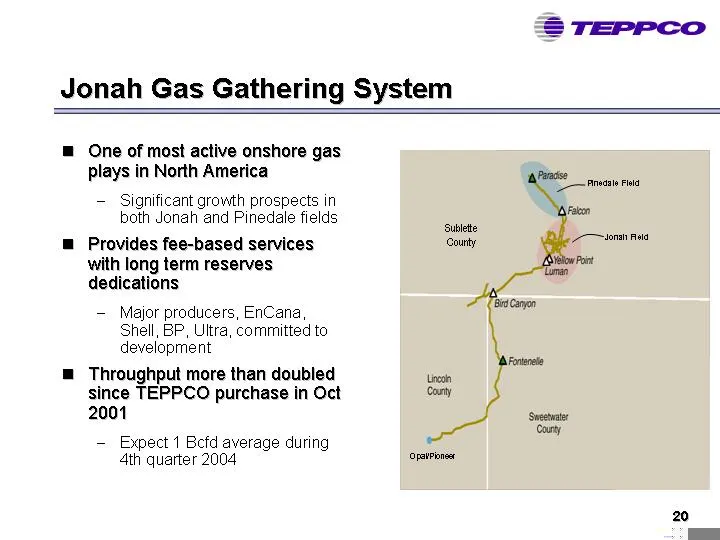
Jonah Gas Gathering System @ One of most active onshore gas plays in North America — Significant growth prospects in both Jonah and Pinedale fields ™ Provides fee-based services with long term reserves dedications — Major producers, EnCana, Shell, BP, Ultra, committed to development @ Throughput mor
Slide 21: System Expansion and Pioneer Plant
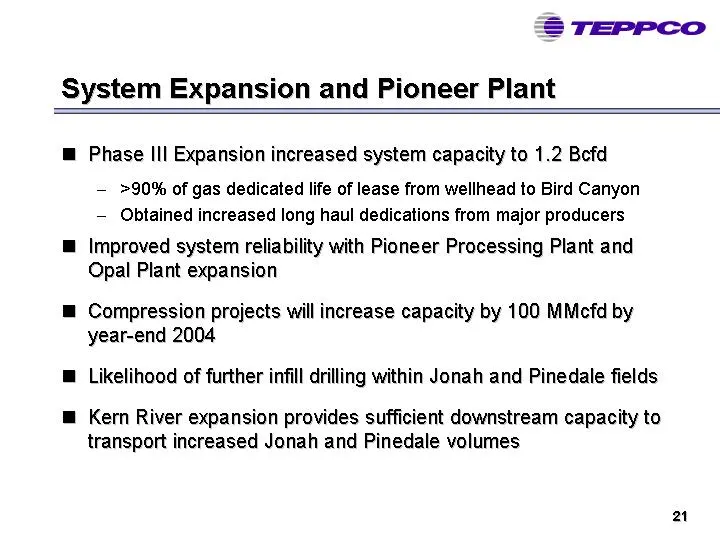
System Expansion and Pioneer Plant @ Phase Ill Expansion increased system capacity to 1.2 Befd — >90% of gas dedicated life of lease from wellhead to Bird Canyon — Obtained increased long haul dedications from major producers @ Improved system reliability with Pioneer Processing Plant and Opal Plant
Slide 22: Gas Gathering Volumes — Jonah
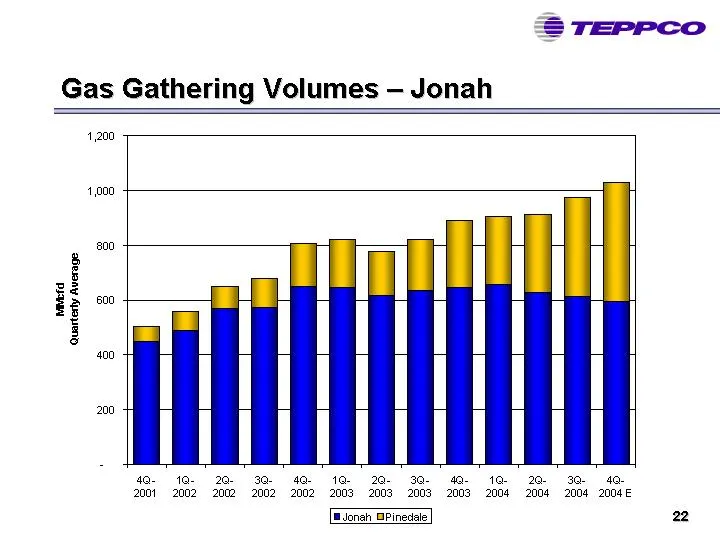
Gas Gathering Volumes — Jonah 4,200 4,000 00 600 neta Quarterly Average 400 200 40- 2001 10- 2002 20. 2002 30. 2002 40. 2002 10. 2008 20- 2008 nah 30- 2008 neal 40 2008 10. 2008 20. 2008 30-40. 2004 2004 22
Slide 23: TEPPCO's Downstream Business
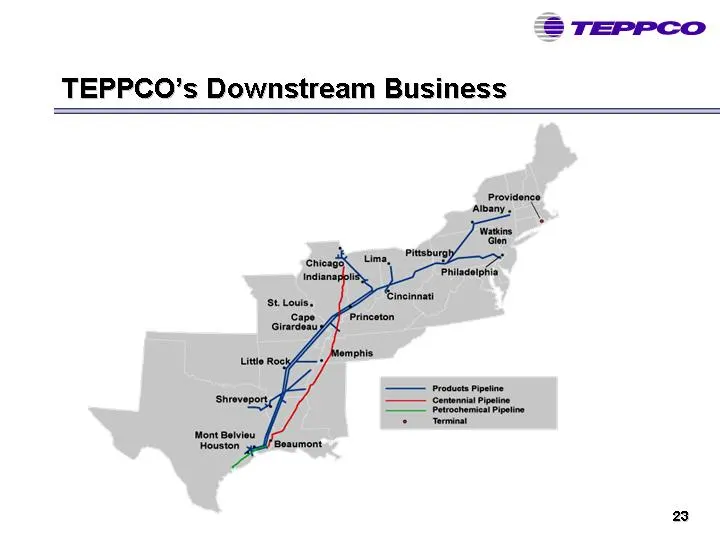
TEPPCO’s Downstream Business Mont Bolview ‘Houston 23
Slide 24: Downstream EBITDA Contribution
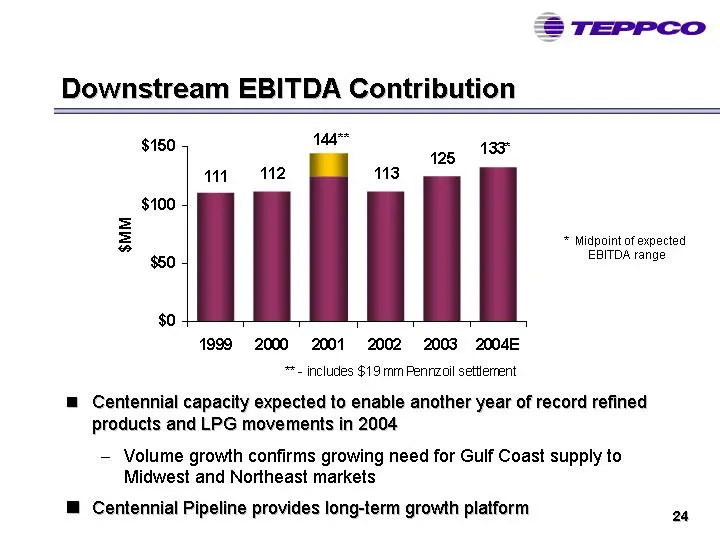
Downstream EBITDA Contribution $150 144" 133" $100 $MM * Midpoint of expected EBITDA range $50 $0 1999 2000 2001 2002 2003 2004E **- includes $19 mm Pennzoil settlerrent ™@ Centennial capacity expected to enable another year of record refined products and LPG movements in 2004 — Volume growth confir
Slide 25: Midwest Refined Products Supply
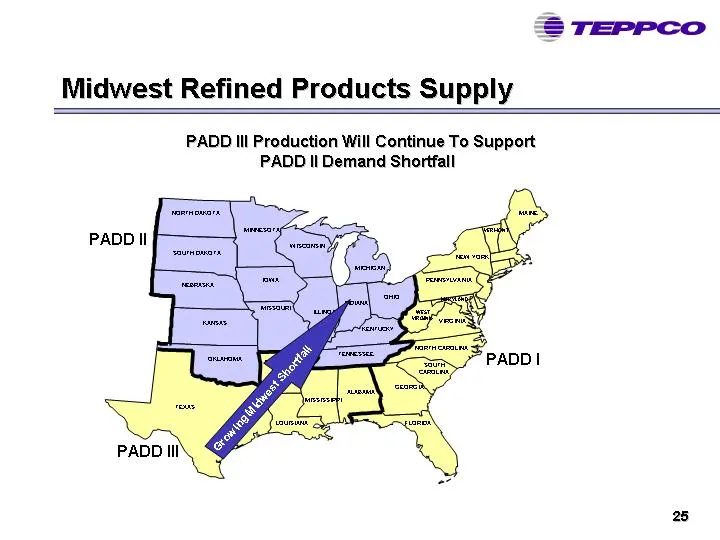
Midwest Refined Products Supply PADD Ill Production Will Continue To Support PADD II Demand Shortfall PADD Il sen a lay ae & a OE PADD Ill 25
Slide 26: Downstream Strategy
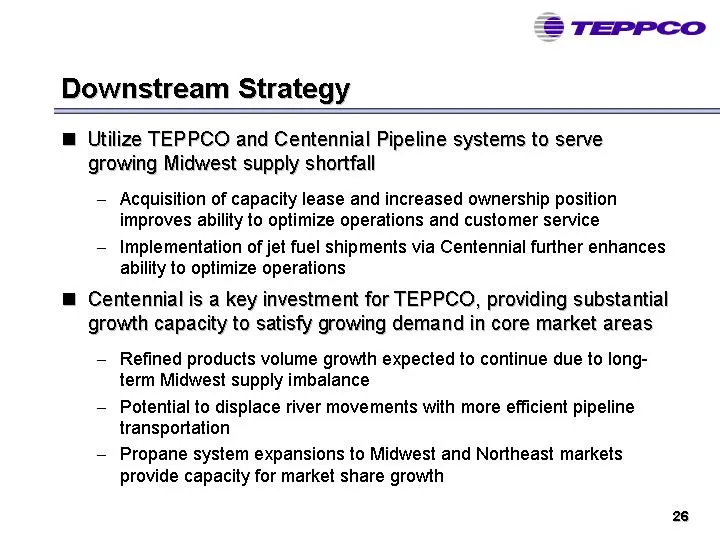
Downstream Strategy @ Utilize TEPPCO and Centennial Pipeline systems to serve growing Midwest supply shortfall — Acquisition of capacity lease and increased ownership position improves ability to optimize operations and customer service — Implementation of jet fuel shipments via Centennial further e
Slide 27: Integrity Management Program
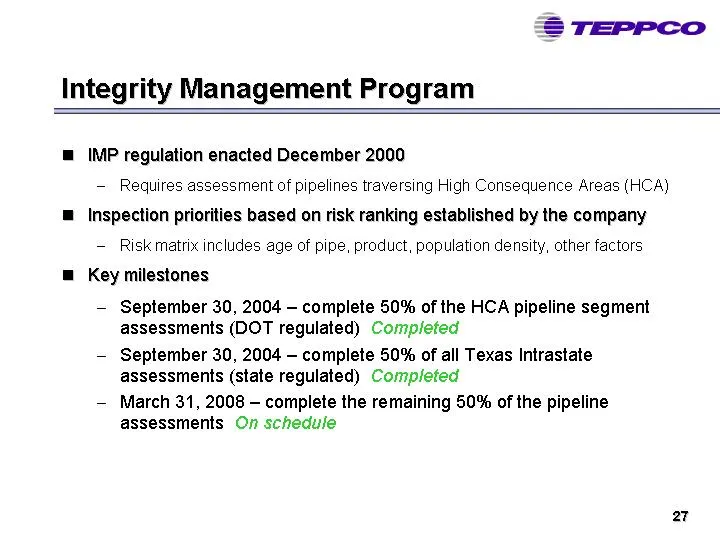
Integrity Management Program @ IMP regulation enacted December 2000 — Requires assessment of pipelines traversing High Consequence Areas (HCA) @ Inspection priorities based on risk ranking established by the company = Risk matrix includes age of pipe, product, population density, other factors @ Key
Slide 28: Integrity Management Program
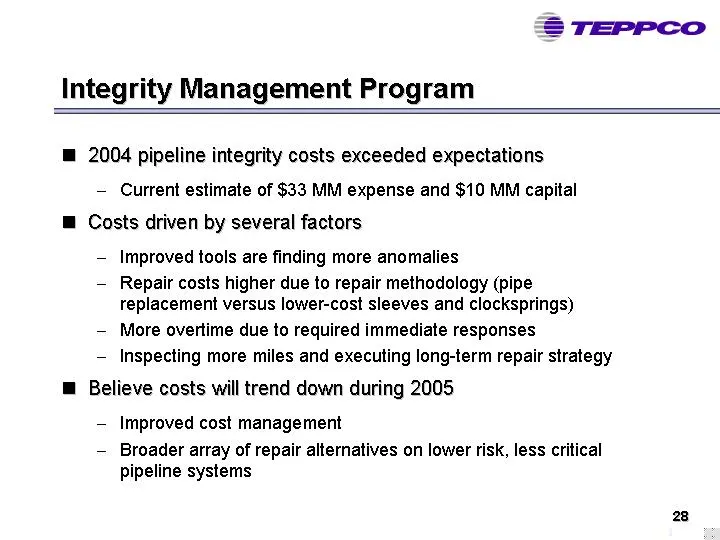
Integrity Management Program @ 2004 pipeline integrity costs exceeded expectations — Current estimate of $33 MM expense and $10 MM capital @ Costs driven by several factors — Improved tools are finding more anomalies — Repair costs higher due to repair methodology (pipe replacement versus lower-cost
Slide 29: 3rd Quarter 2004 Earnings/2004 Outlook
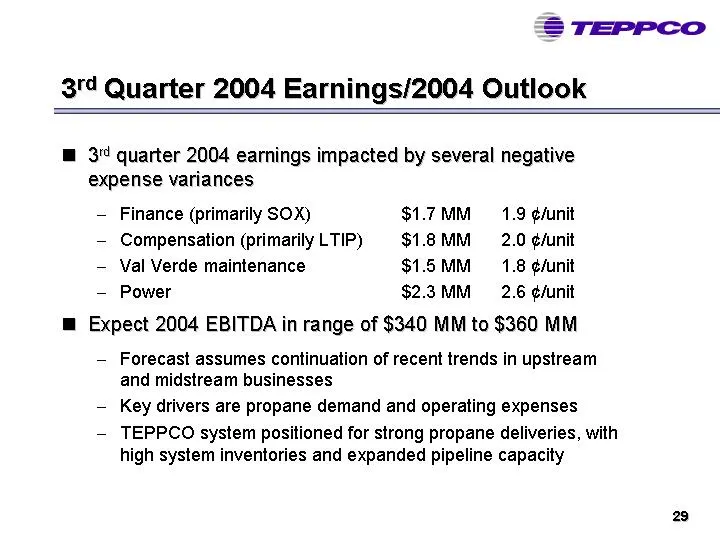
34 Quarter 2004 Earnings/2004 Outlook @ 3% quarter 2004 earnings impacted by several negative expense variances — Finance (primarily SOX) $1.7MM = 1.9 ¢/unit — Compensation (primarily LTIP) $1.8MM = 2.0 ¢/unit — Val Verde maintenance $1.5MM = 1.8 ¢/unit — Power $2.3MM = 2.6 ¢/unit m Expect 2004 EBIT
Slide 30: Operating and G&A Costs
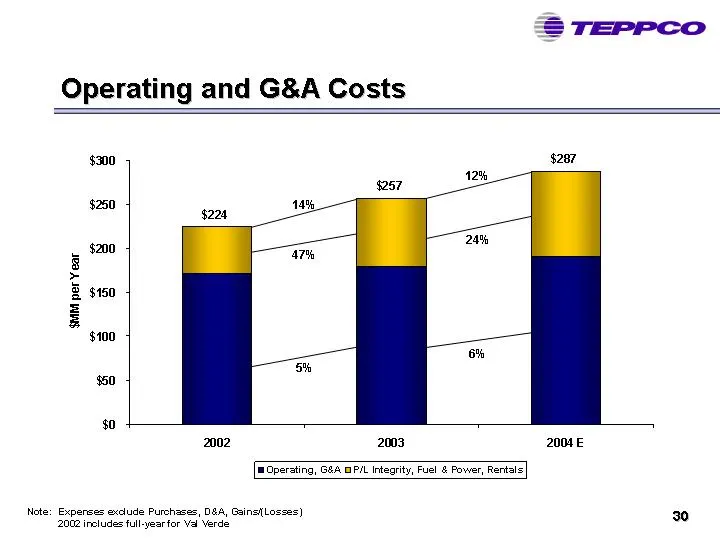
Operating and G&A Costs $300 $250 $200 $150 $MM per Year $100 $60 so + 2002 2003 2004 E Note: Expenses exclude Purchases, D&A, Gainsi(Losses) 30 2002 includes full-year for Val Verde
Slide 31: Balance Sheet and Distribution Coverage
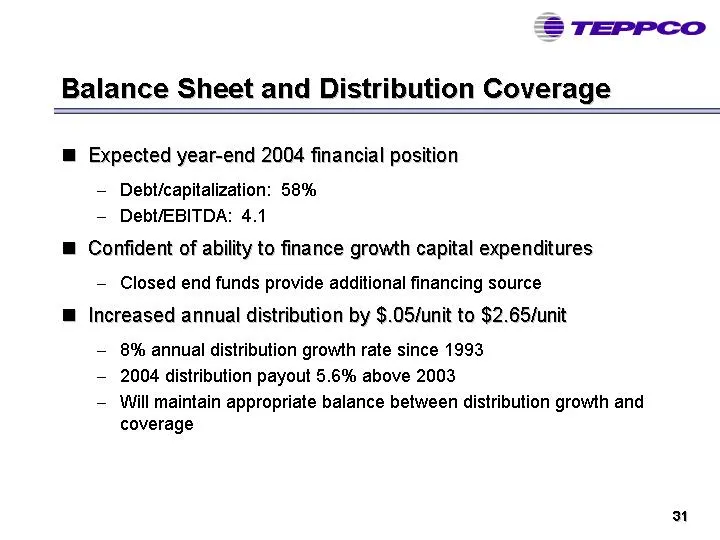
TEPPCO Balance Sheet and Distribution Coverage m@ Expected year-end 2004 financial position — Debt/capitalization: 58% — Debt/fEBITDA: 4.1 @ Confident of ability to finance growth capital expenditures — Closed end funds provide additional financing source @ Increased annual distribution by $.05/unit
Slide 32: Consistent distribution growth since 1993
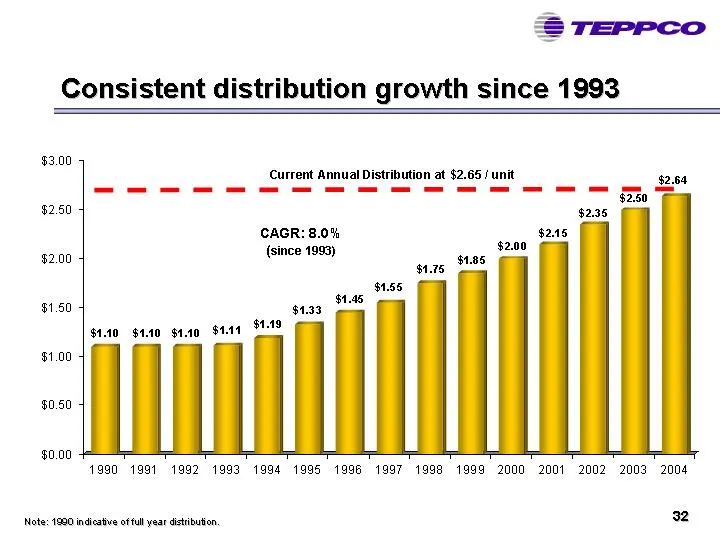
Consistent distribution growth since 1993 $3.00 Current Annual Distribution at $2.65 / unit $2.64 ee ee ee ee eK eK HH - - -t $2.60 CAGR: 8.0% $2.00 (since 1993) 1.46 $1.50 $1.33 * 4 $149 $1.10 $4.10 $1.10 $44 $1.00 $0.50 $0.00 1990 1991 1992 1993 1994 1995 1996 1997 1998 1999 2000 2001 2002 2003 20
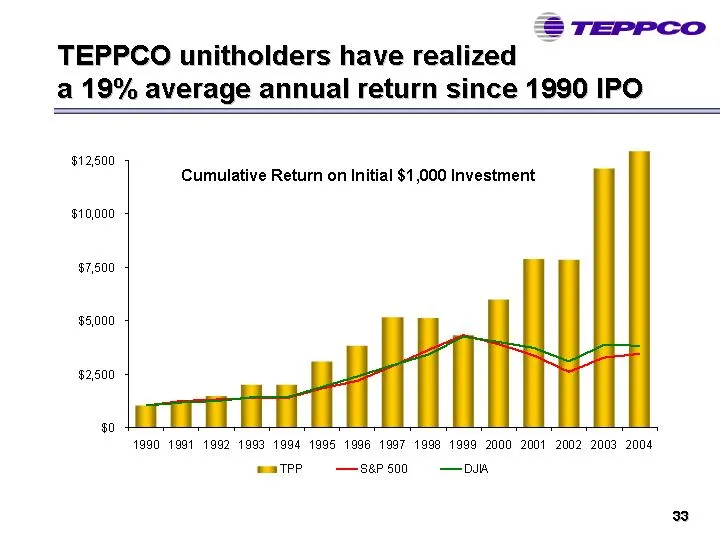
Slide 33: TEPPCO unitholders have realized a 19% average annual return
TEPPCO unitholders have realized a 19% average annual return since 1990 IPO $12,500 Cumulative Return on Initial $1,000 Investment $10,000 $7,500 $6,000 $2500 $0 1990 1991 1992 1993 1994 1996 1996 1997 1998 1999 2000 2001 2002 2003 2004 we=aTPP |= —saP 500 + =—DJA 33
Slide 34: Summary
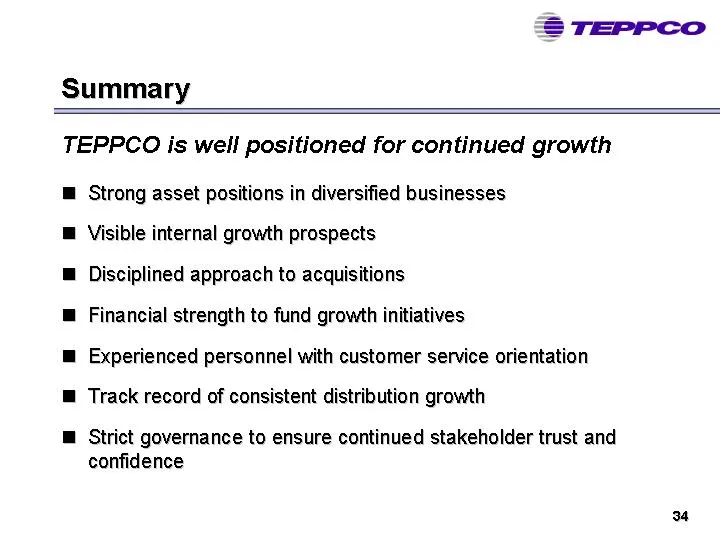
Summary TEPPCO is well positioned for continued growth Strong asset positions in diversified businesses Visible internal growth prospects Disciplined approach to acquisitions Financial strength to fund growth initiatives Experienced personnel with customer service orientation Track record of consist
Slide 35: Reconciliation of Non-GAAP Measures
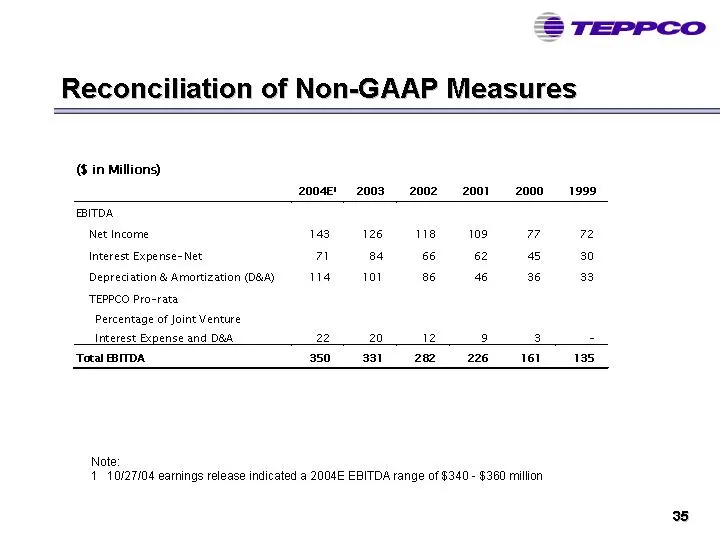
TEPPCO Reconciliation of Non-GAAP Measures in Millions) 2004e 2003 20022001 ~—-2000—_—1999 EBITDA Net Incorne 14300«126 081 7 72 Interest Expense-Net ral 846662 45 30 Depreciation & Amortization (O&A) «114101 8 46 36 33 TEPPCO Pro-rata Percentage of Joint Venture Interest Expense and D&A 22 20 2 8 3
Slide 36: Reconciliation of Non-GAAP Measures
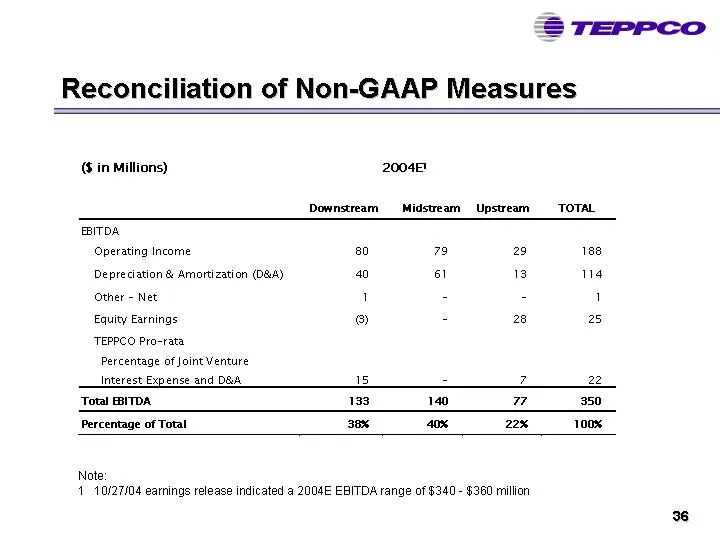
TEPPCO Reconciliation of Non-GAAP Measures in Millions) 200461 Downstream Midstream Upstream TOTAL EBITDA Operating Income 80 79 29 188 Depreciation & Amortization (D&A) 40 6 13 na Other - Net 1 5 - 1 Equity Earnings c) - 28 25 TEPPCO Pro-rata Percentage of Joint Venture Interest Expense and D&A 15
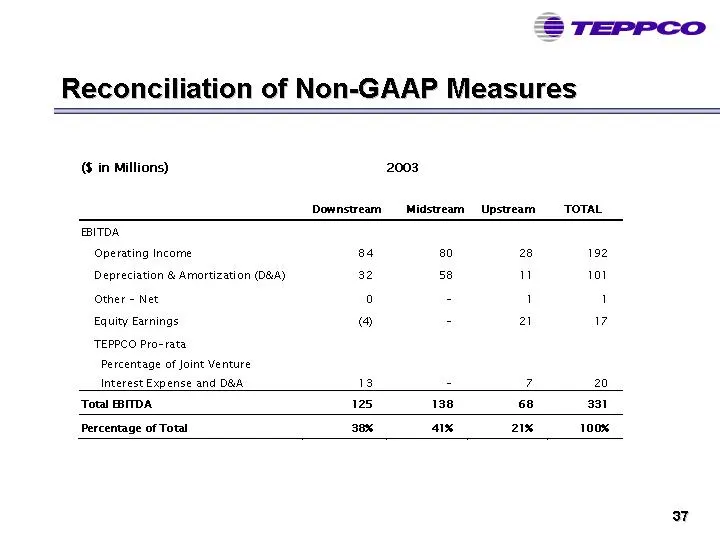
Slide 37: Reconciliation of Non-GAAP Measures
Reconciliation of Non-GAAP Measures TEPPCO G in Millions) 2003 Downstream Midstream Upstream TOTAL EBITDA Operating Income a4 80 28 192 Depreciation & Amartization (D&A) 32 58 u 101 Other - Net 0 = 1 1 Equity Earnings @ - 21 7 TEPPCO Pro-rata Percentage of Joint Venture Interest Expense and D&A 13 -
Slide 38: Searchable text section of graphics shown above
Searchable text section of graphics shown above TEP PCO Partners, L.P. Analyst and Investor Presentation November, 2004 [LOGO] [ LOG O] Forward-looking Statements • The material and information furnished in this presentation contains forward-looking statements as such are described within various pr
Source: SEC EDGAR · 8-K filed Nov 3, 2004
More decks from Teppco Partners LP
 Morgan Stanley MLP Reception (October 2009)26 slides · Oct 7, 2009
 Master Limited Partnerships Investor Conference (September 2009)27 slides · Sep 16, 2009
 Wells Fargo Retail Meeting (September 2009)27 slides · Sep 15, 2009
 Barclays Capital CEO Energy/Power Conference 200929 slides · Sep 9, 2009
 Merger or Acquisition (August 2009)29 slides · Aug 26, 2009
 Wachovia Securities Investor Presentation (June 2007)51 slides · Jun 1, 2007