Teppco Partners LP — Merger or Acquisition (August 2009)
29 slides from Teppco Partners LP's merger presentation, Aug 26, 2009
Slide 1: Breakfast Meeting
Breakfast Meeting River Oaks Country Club August 26, 2009 W. Randall Fowler Executive Vice President & CFO © Allrights reserved. Enterprise Products Partners L.P.
Slide 2: Forward Looking Statements
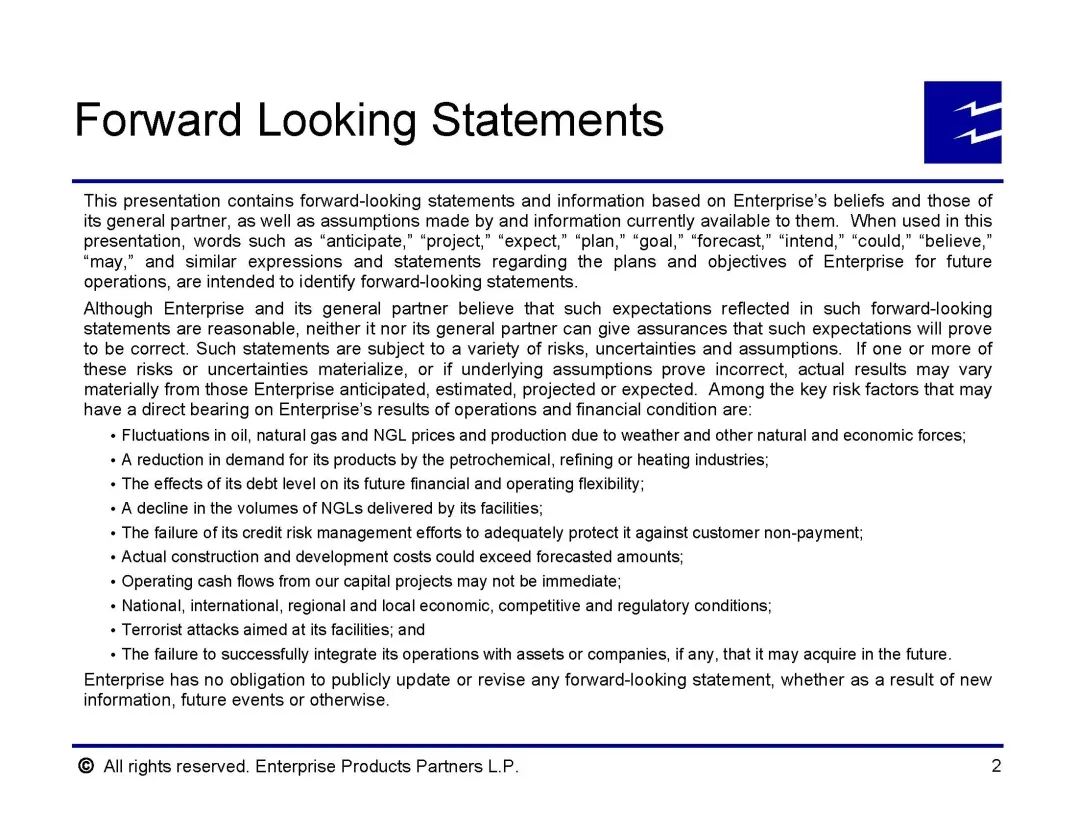
Forward Looking Statements This presentation contains forward-looking statements and information based on Enterprise's beliefs and those of its general partner, as well as assumptions made by and information currently available to them. When used in this presentation, words such as “anticipate,” “pr
Slide 3: Investor Notice
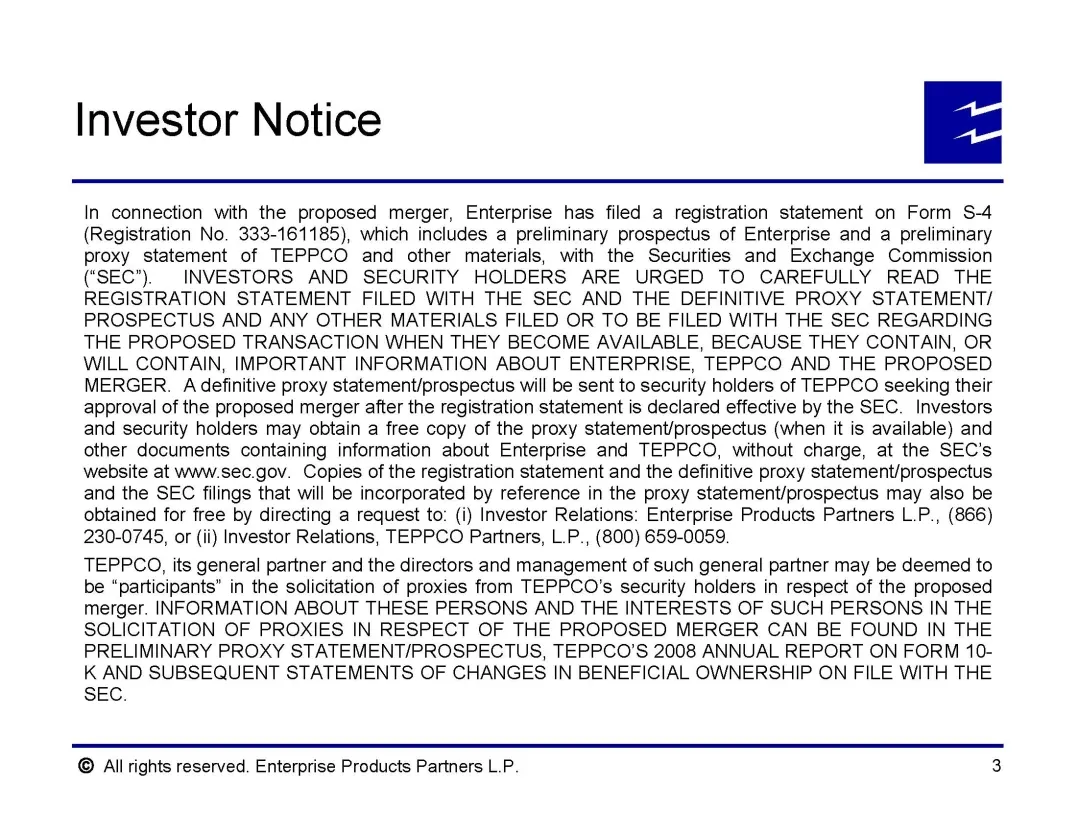
Investor Notice In connection with the proposed merger, Enterprise has filed a registration statement on Form S-4 (Registration No. 333-161185), which includes a preliminary prospectus of Enterprise and a preliminary proxy statement of TEPPCO and other materials, with the Securities and Exchange Com
Slide 4: Key Investment Considerations
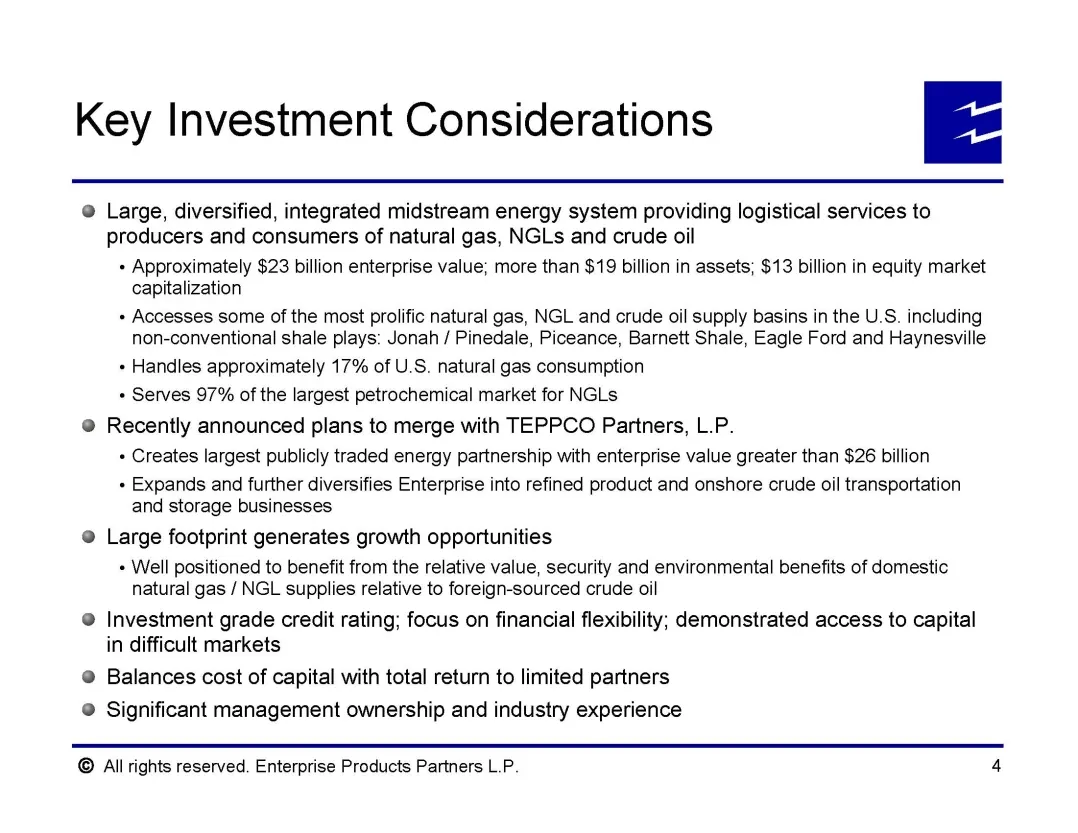
Key Investment Considerations @ Large, diversified, integrated midstream energy system providing logistical services to producers and consumers of natural gas, NGLs and crude oil + Approximately $23 billion enterprise value; more than $19 billion in assets; $13 billion in equity market capitalizatio
Slide 5: Significant Management Ownership
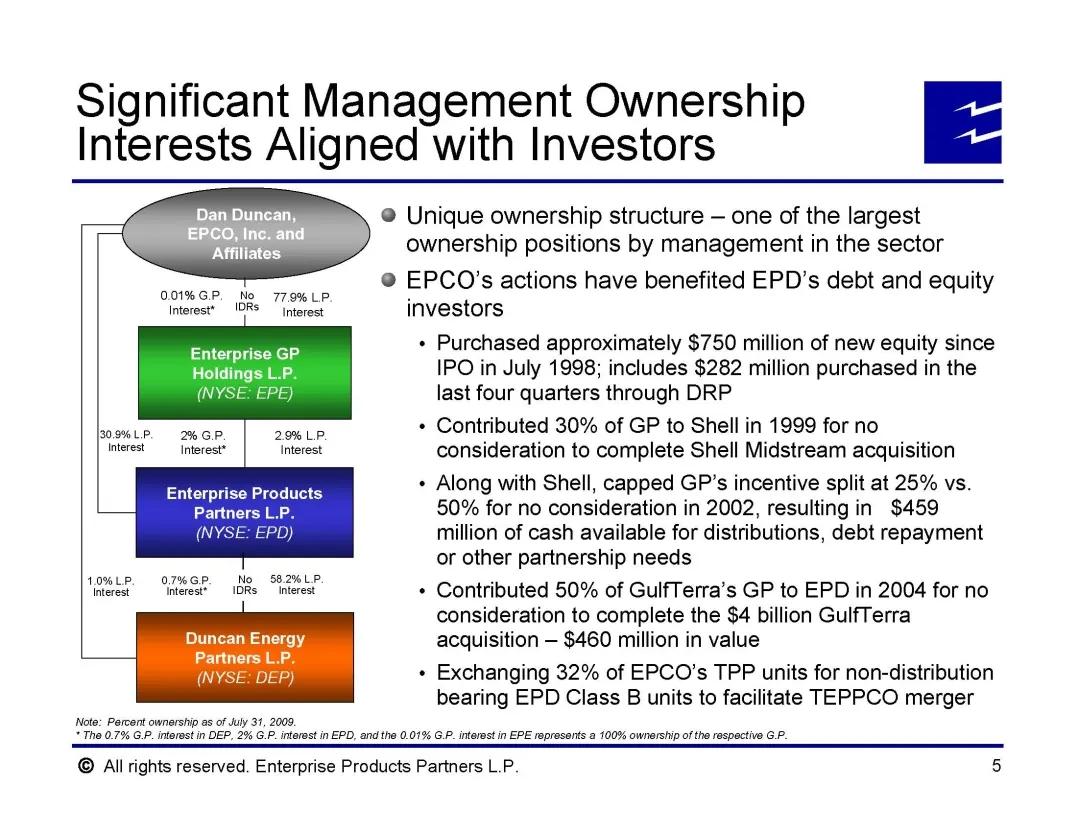
Significant Management Ownership Interests Aligned with Investors 0.01%G.P. No 77.9%LP. Interest? IRS "interest Enterprise GP Holdings L.P. (NYSE: EPE) ls0.996 LP. Interest 2% GP. interest” 2.9% LP. Interest Enterprise Products Partners L.P. (NYSE: EPD) 10%LP. O7%GP. No S82%LP. interest’ Interest” =
Slide 6: EPD's Premier Midstream Network
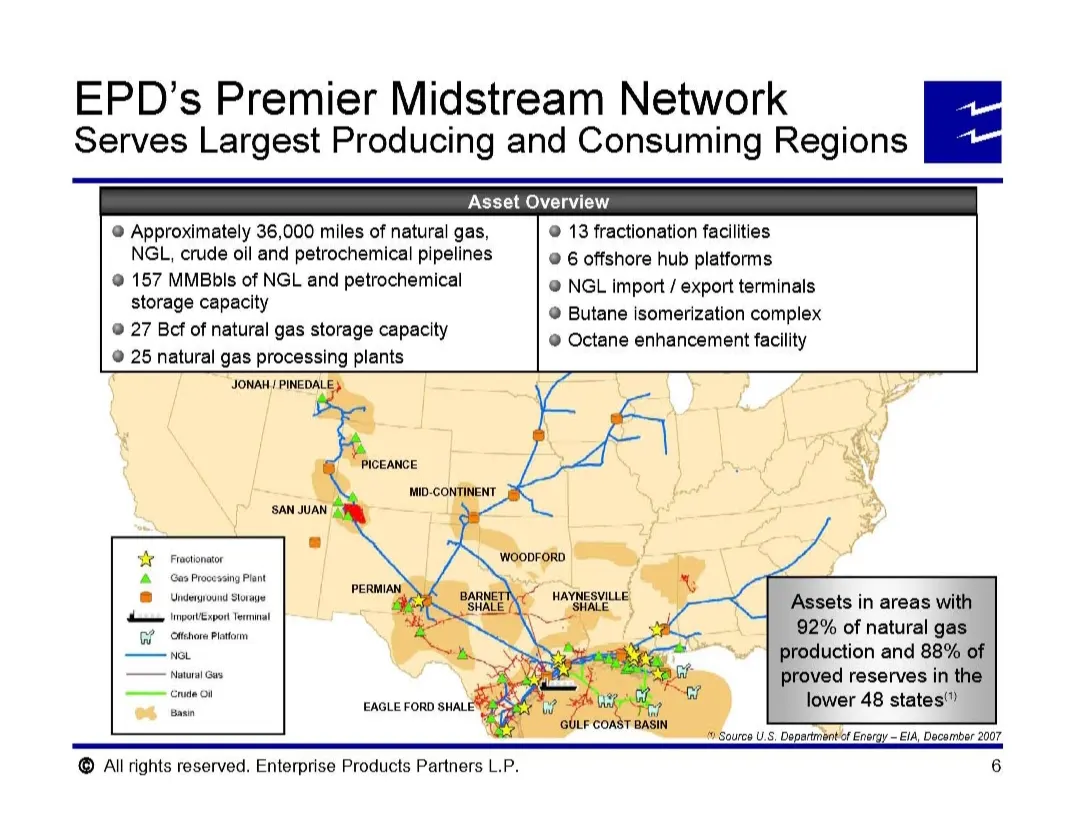
EPD’s Premier Midstream Network Serves Largest Producing and Consuming Regions Asset Overview @ Approximately 36,000 miles of natural gas, @ 13 fractionation facilities NGL, crude oil and petrochemical pipelines © 6 offshore hub platforms @ 157 MMBbls of NGL and petrochemical @ NGL import / export t
Slide 7: Geographic and Business Diversification
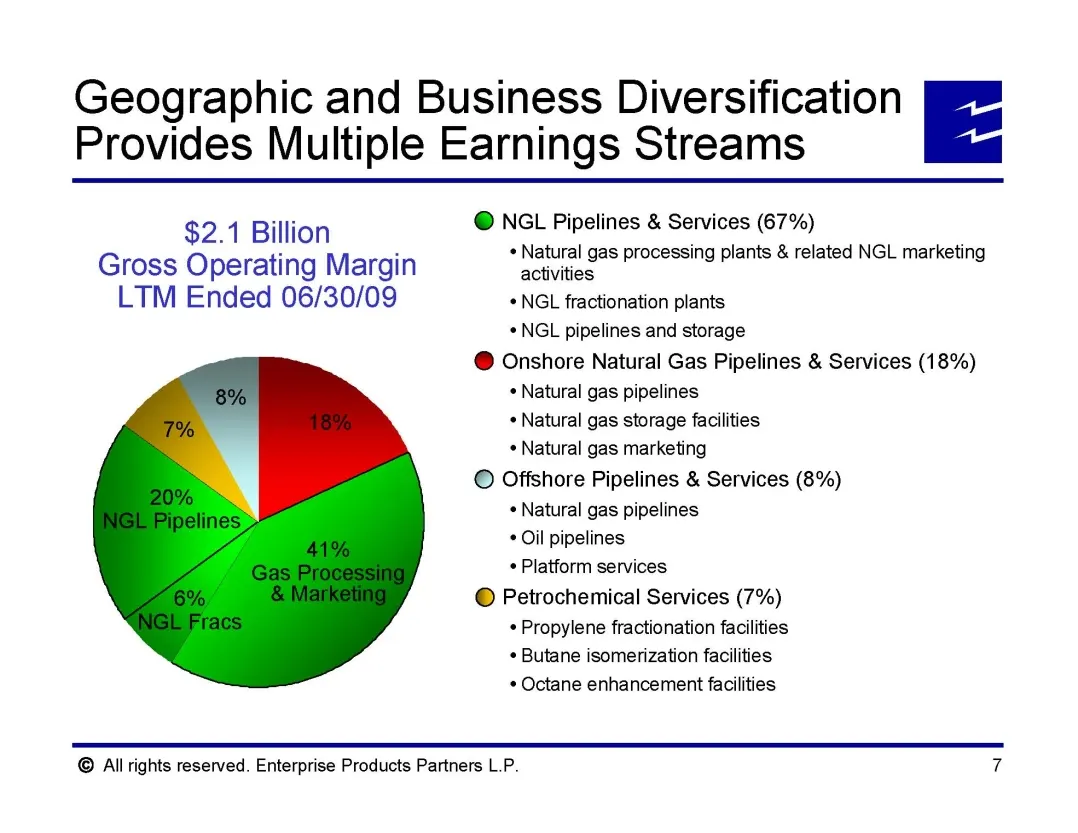
Geographic and Business Diversification E Provides Multiple Earnings Streams $2.1 Billion @ NGL Pipelines & Services (67%) . é + Natural gas processing plants & related NGL marketing Gross Operating Margin activities LTM Ended 06/30/09 * NGL fractionation plants * NGL pipelines and storage @ Onshore
Slide 8: Merger with TEPPCO Rationale
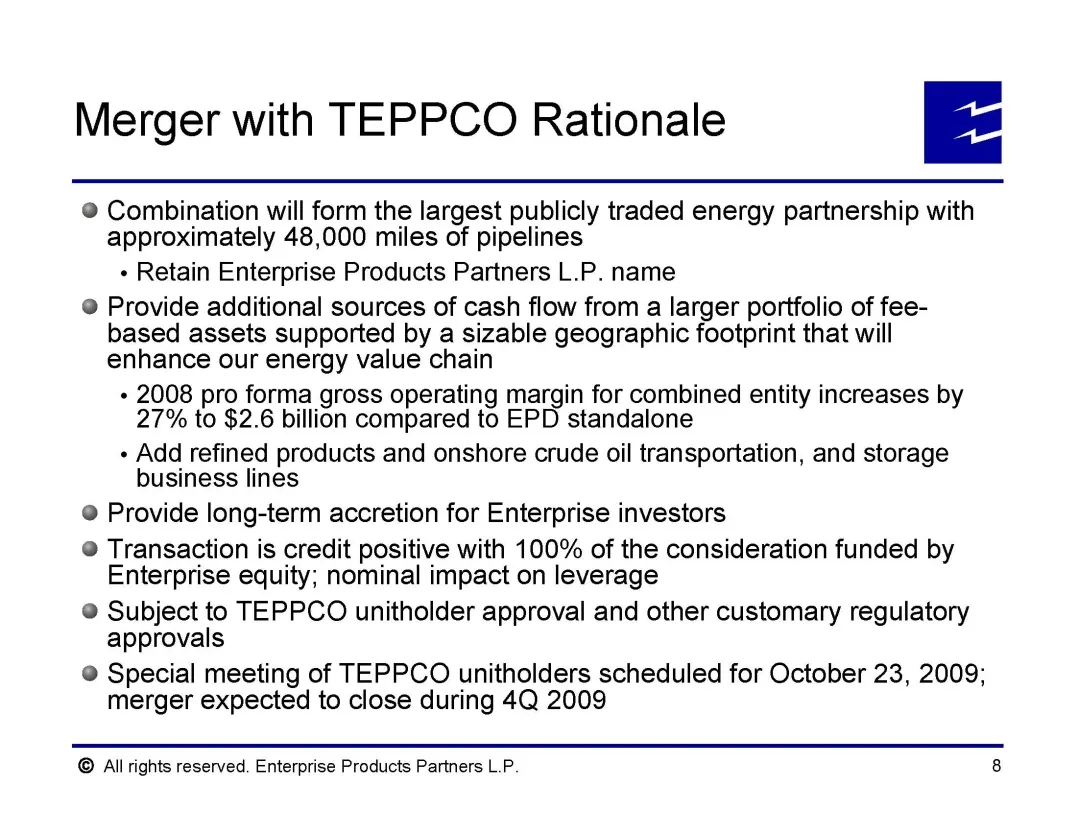
Merger with TEPPCO Rationale Ee ®@ Combination will form the largest publicly traded energy partnership with approximately 48,000 miles of pipelines « Retain Enterprise Products Partners L.P. name @ Provide additional sources of cash flow from a larger portfolio of fee- based assets supported by a s
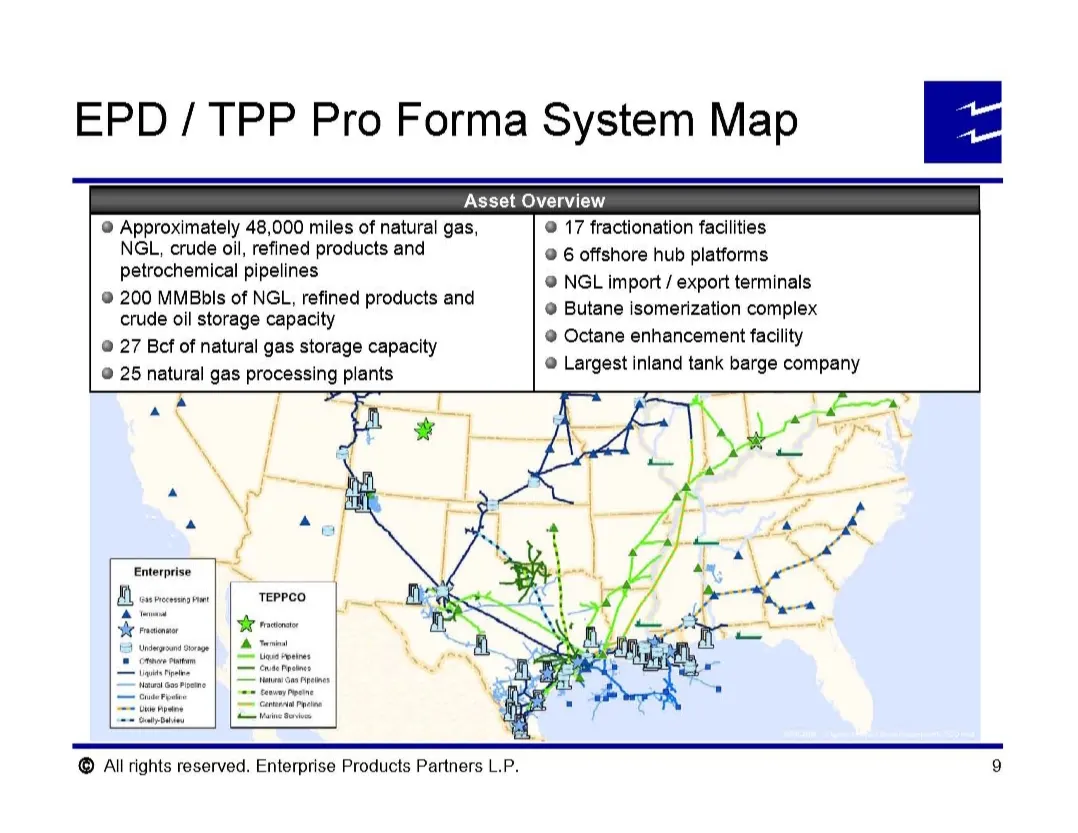
Slide 9: EPD / TPP Pro Forma System Map
EPD / TPP Pro Forma System Map Asset Overview @ Approximately 48,000 miles of natural gas, @ 17 fractionation facilities NGL, crude oil, refined products and © 6 offshore hub platforms petrochemical pipelines ®@ NGL import / export terminals @ 200 MMBDbIs of NGL, refined products and @ Butane isomer
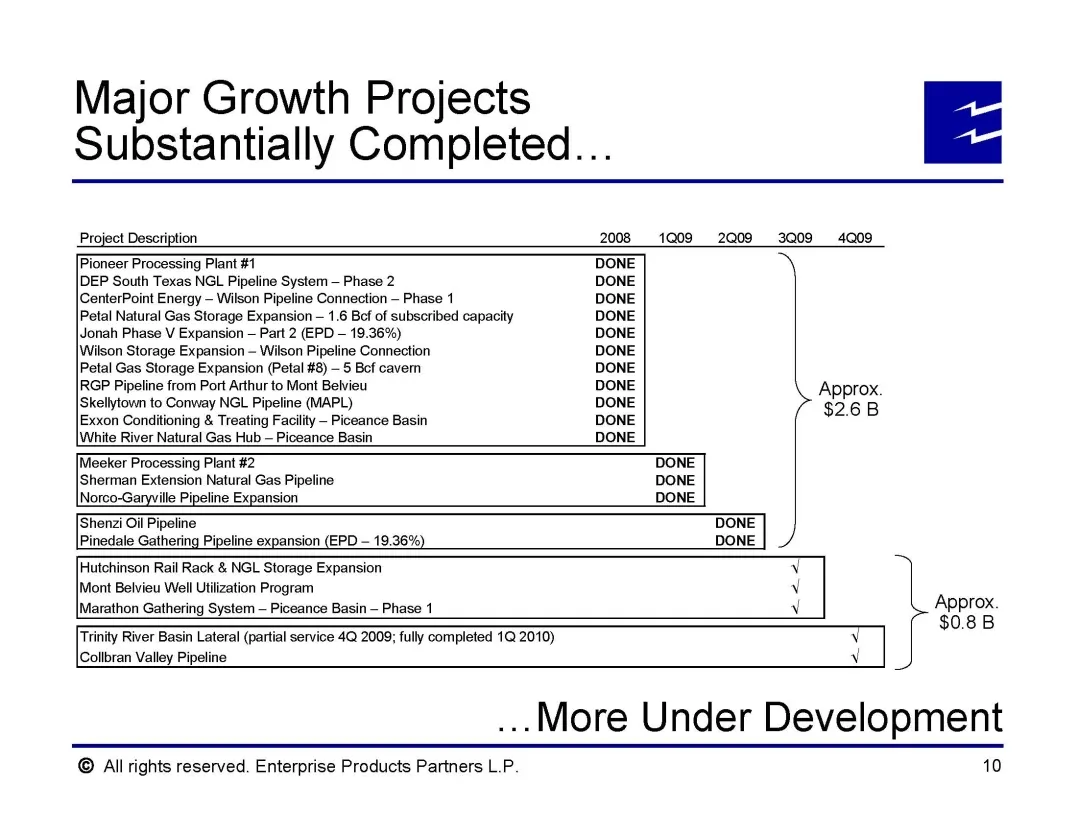
Slide 10: Major Growth Projects
Major Growth Projects Substantially Completed... Project Description 20081092009 3009 _4c09 Pioneer Processing Plant #1 DONE DEP South Texas NGL Pipeline System — Phase 2 DONE ICenterPoint Energy — Wilson Pipeline Connection ~ Phase 1 DONE Petal Natural Gas Storage Expansion — 1.6 Bcf of subscribed
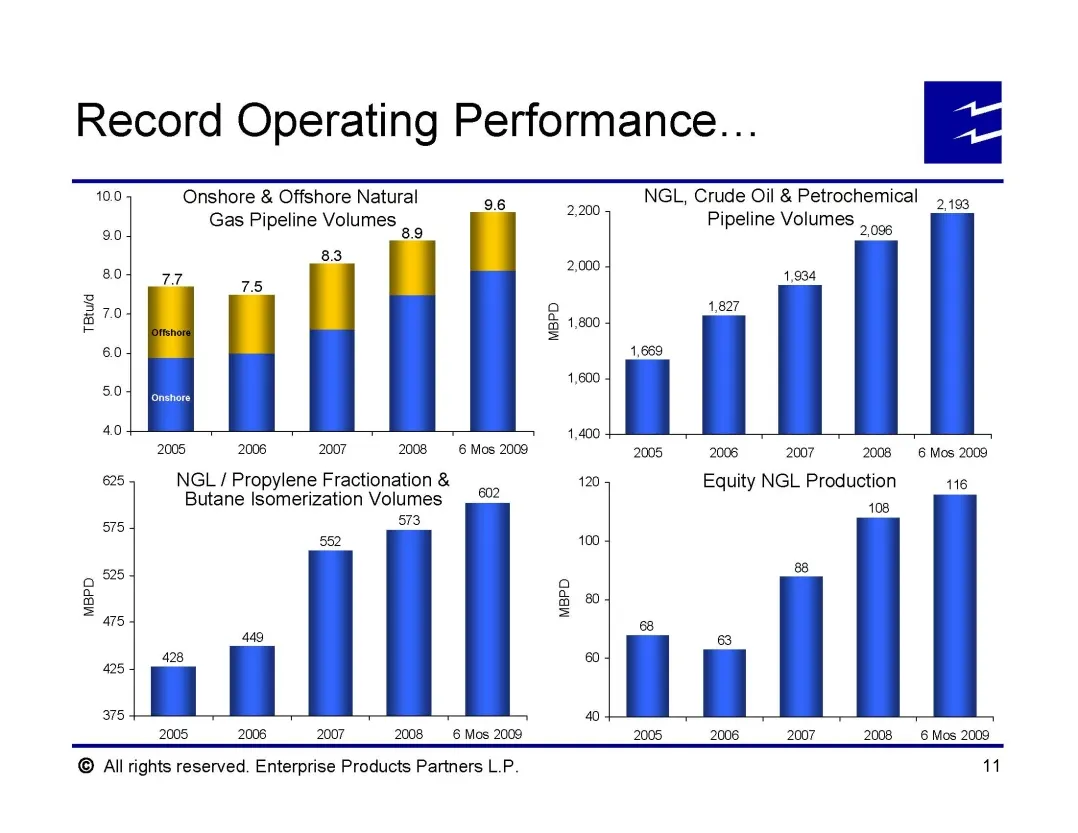
Slide 11: Record Operating Performance...
Record Operating Performance... 10.0 Onshore & Offshore Natural 96 NGL, Crude Oil & Petrochemical Gas Pipeline Volumes 89 2,193 2200 Pipeline Volumes 2,096 1,934 TBtwd 4,600 2005 2006 2007 2008 6 Mos 2008 2005 2006 2007 2008 6 Mos 2009 625 NGL / Propylene Fractionation & 120 Equity NGL Production 11
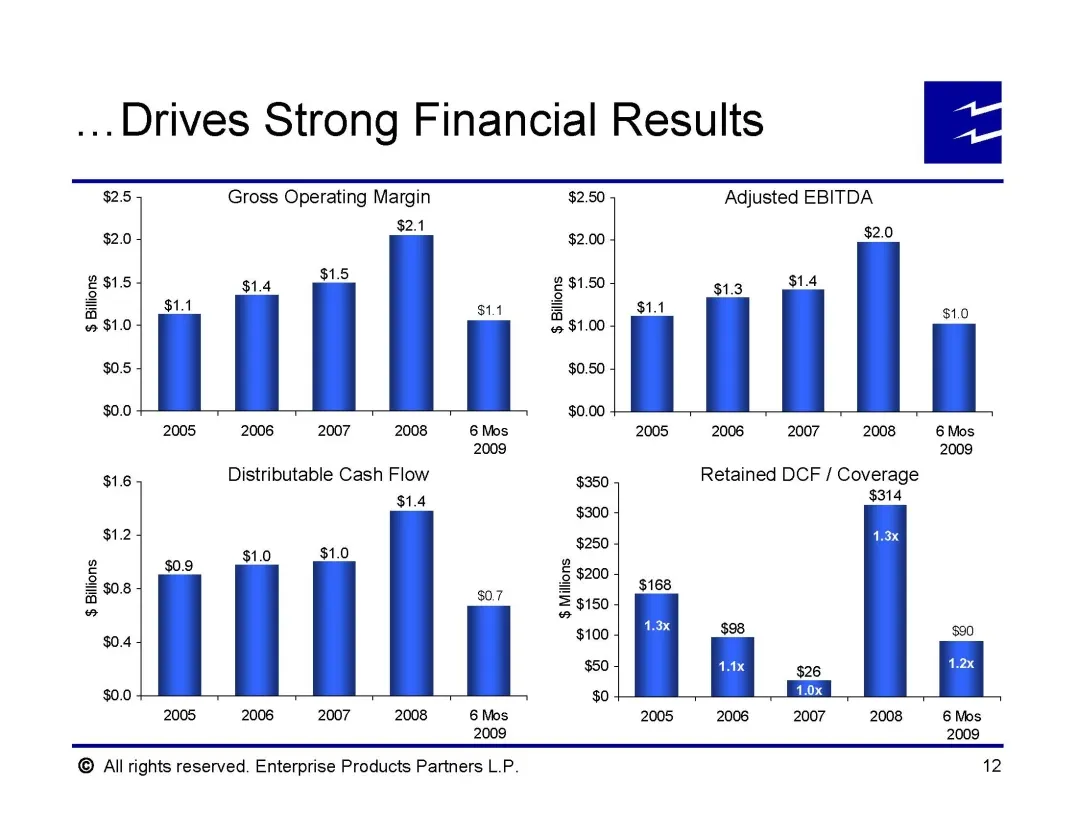
Slide 12: ...Drives Strong Financial Results
...Drives Strong Financial Results $2.5 Gross Operating Margin $2.50 Adjusted EBITDA $2.4 $2.0 $2.00 $2.0 esis $1.4 Ps s $1.1 $1.1 S sto $0.5 $0.0 2005 = 2006«= 2007 «2008 «= 6 Mos 2005 2006-= 2007. «2008 «= 6 Mos 2009 2009 316 Distributable Cash Flow $350 Retained DCF / Coverage $1.4 $200 oot $12 x
Slide 13: NGL Feedstock Demand by Ethylene Producers has Rebounded
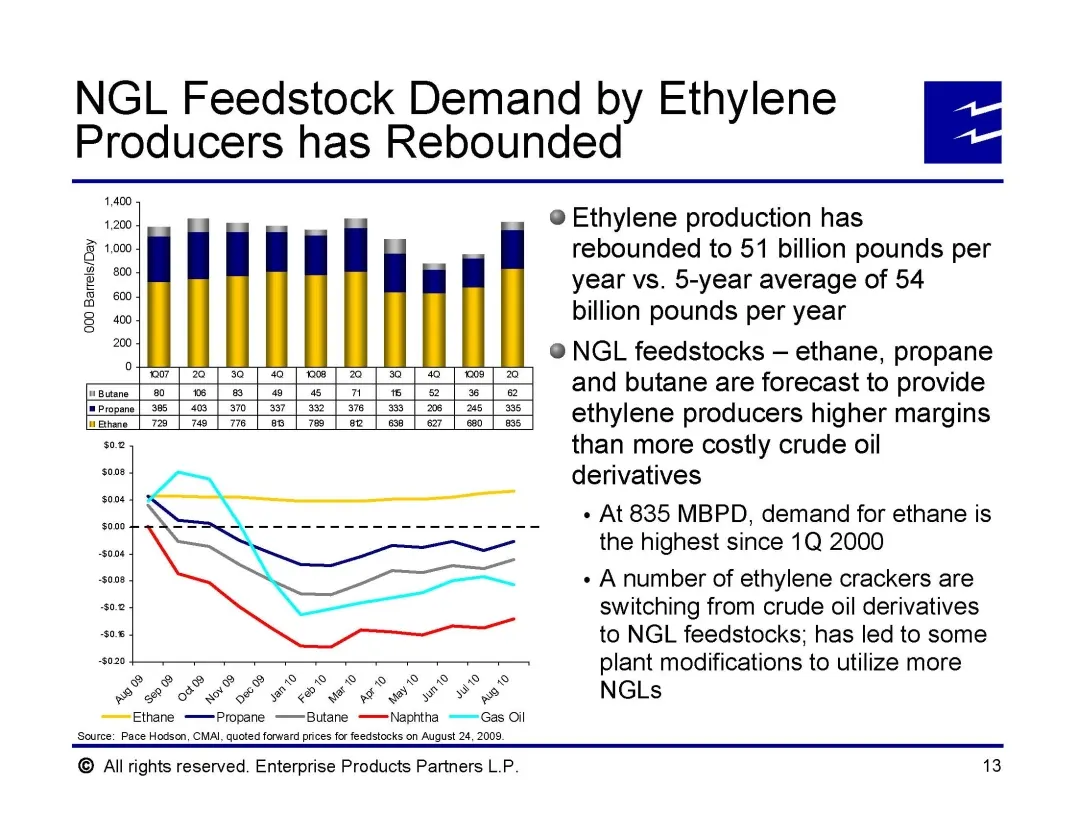
NGL Feedstock Demand by Ethylene Producers has Rebounded 1,400 41,200 [Day 8 000 Barrels/Day PP PP PF SO Fw GO S © PL FOL LS EC ESS TH Ethane ——=Propane ———Butane ——=Naphtha --=—=Gas Oil sauce: Bae Heden,CMA, uct want poe fr feedlot on Aug 24, 2008 @ Ethylene production has rebounded to 51 billion p
Slide 14: Rockies Overview
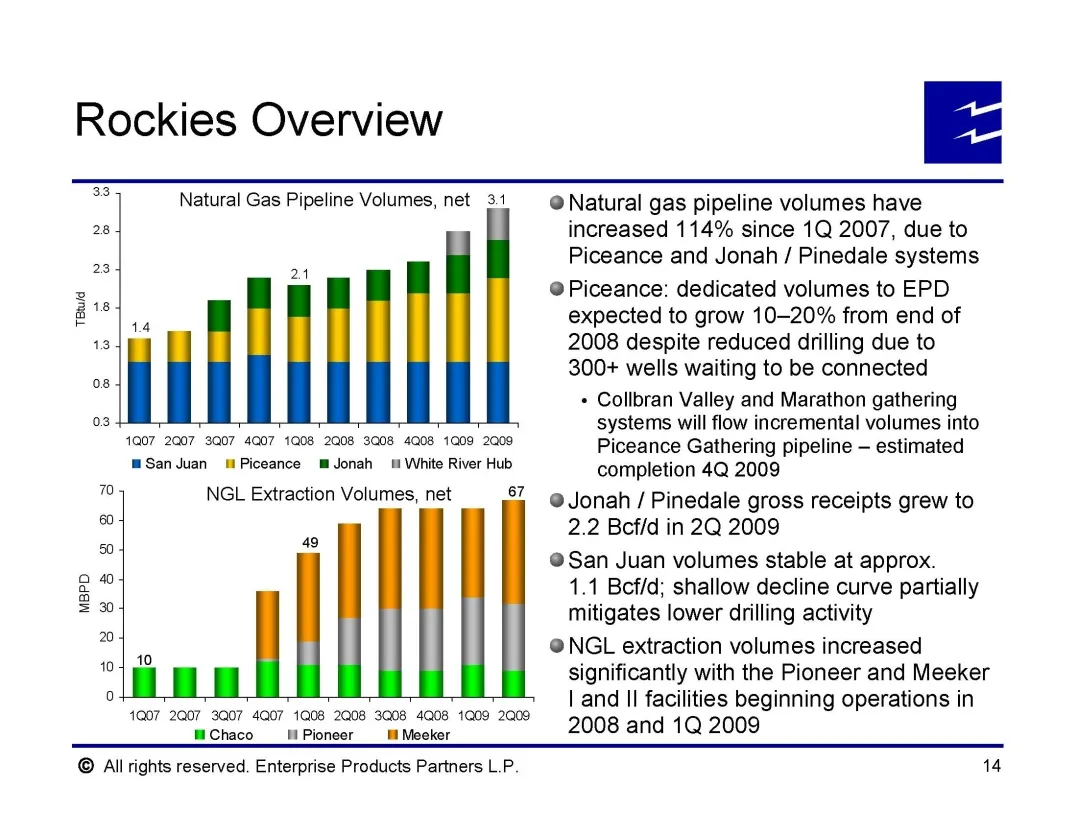
Rockies Overview Natural Gas Pipeline Volumes, net 3.1 @ Natural gas pipeline volumes have increased 114% since 1Q 2007, due to Piceance and Jonah / Pinedale systems @Piceance: dedicated volumes to EPD expected to grow 10-20% from end of 2008 despite reduced drilling due to 300+ wells waiting to be
Slide 15: Rockies Overview (continued)
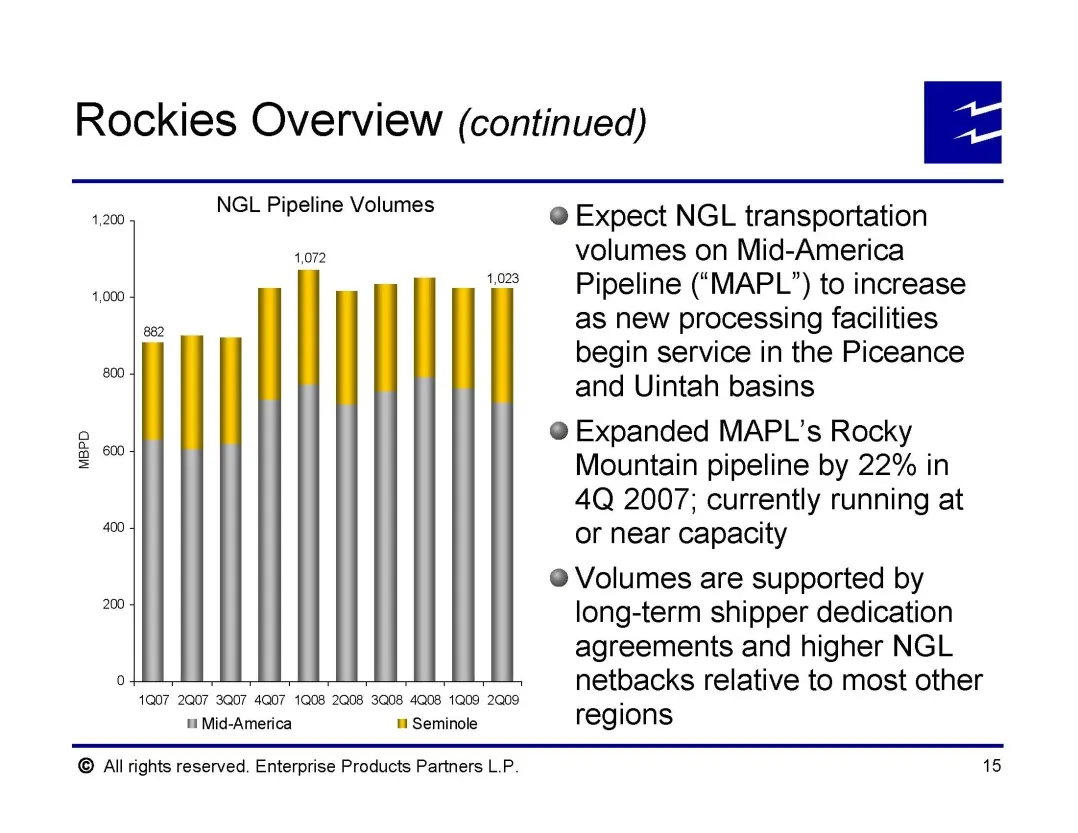
Rockies Overview (continued) Ee NGL Pipeline Volumes 1,200 @ Expect NGL transportation 1072 volumes on Mid-America 4,000 i Pipeline (“MAPL’) to increase = as new processing facilities begin service in the Piceance o and Uintah basins soo @ Expanded MAPL’s Rocky Mountain pipeline by 22% in 4Q 2007; c
Slide 16: Barnett Shale Growth Projects
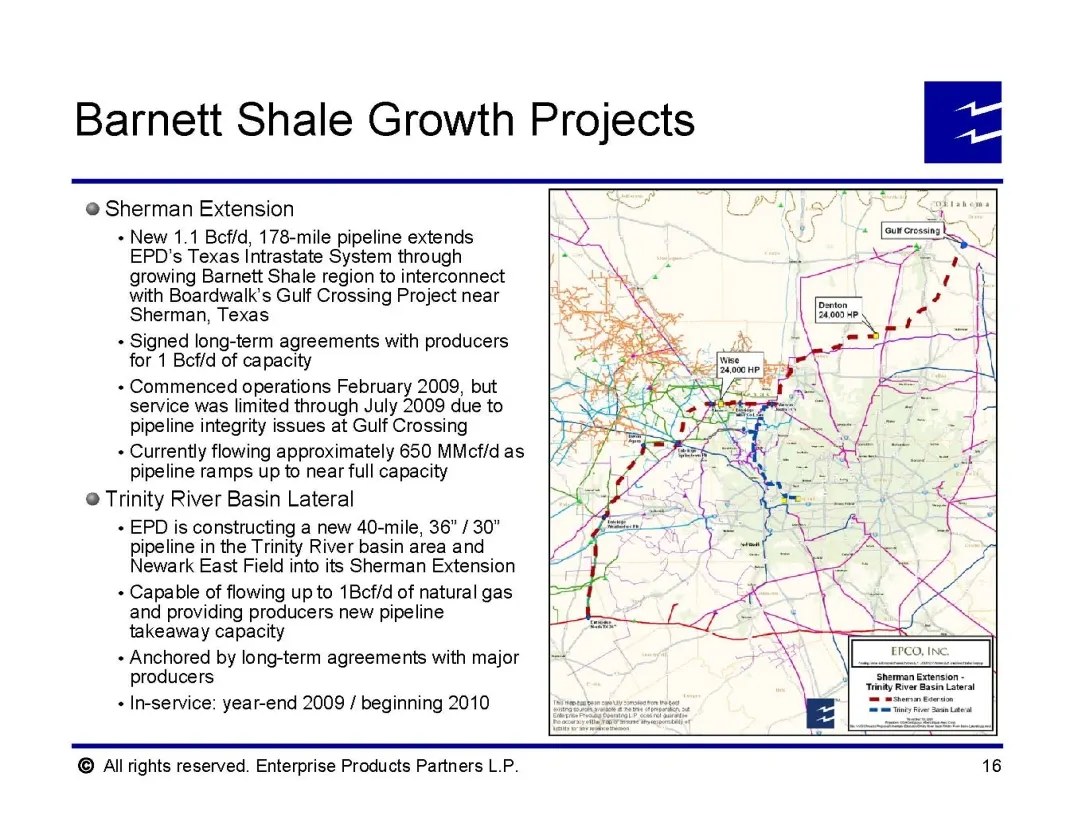
Barnett Shale Growth Projects @ Sherman Extension + New 1.1 Beffd, 178-mile pipeline extends EPD's Texas Intrastate System through growing Barnett Shale region to interconnect with Boardwalk’s Gulf Crossing Project near Sherman, Texas + Signed long-term agreements with producers for 1 Beffd of capac
Slide 17: Eagle Ford Shale Opportunities
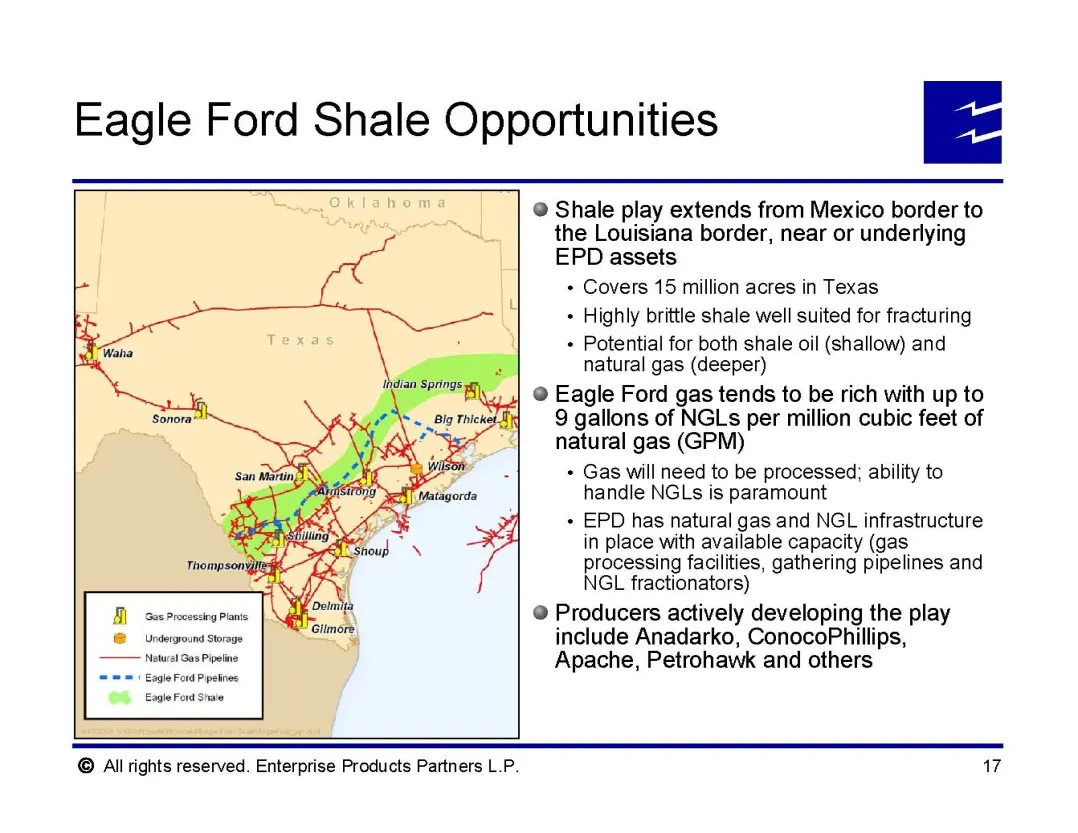
Eagle Ford Shale Opportunities | xe Oklahoma | a = Texas - Waa \e Thompson\ BH) sae Preccssng Plans feats (@__ Underground Storage fake Natura es Pine = = ale FordPpetoes 6 Faerora ste LET mateo @ Shale play extends from Mexico border to the Louisiana border, near or underlying EPD assets + Covers 1
Slide 18: Fractionation Assets
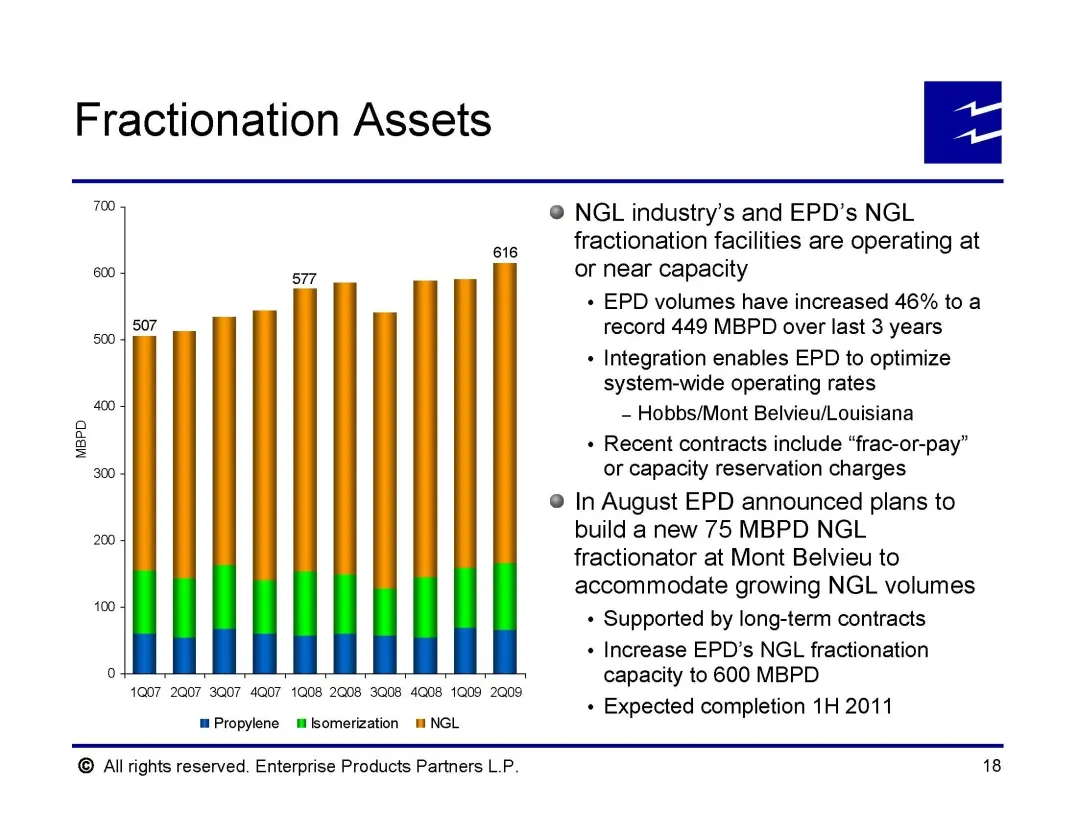
Fractionation Assets 700 616 507 MBPD 200 1Q07 2007 307 4Q07 1Q08 2Q08 3Q08 4Q08 1Q09 2009 ™Propylene mlsomerization mm NGL @ NGL industry's and EPD’s NGL fractionation facilities are operating at or near capacity + EPD volumes have increased 46% to a record 449 MBPD over last 3 years + Integration
Slide 19: Offshore Assets
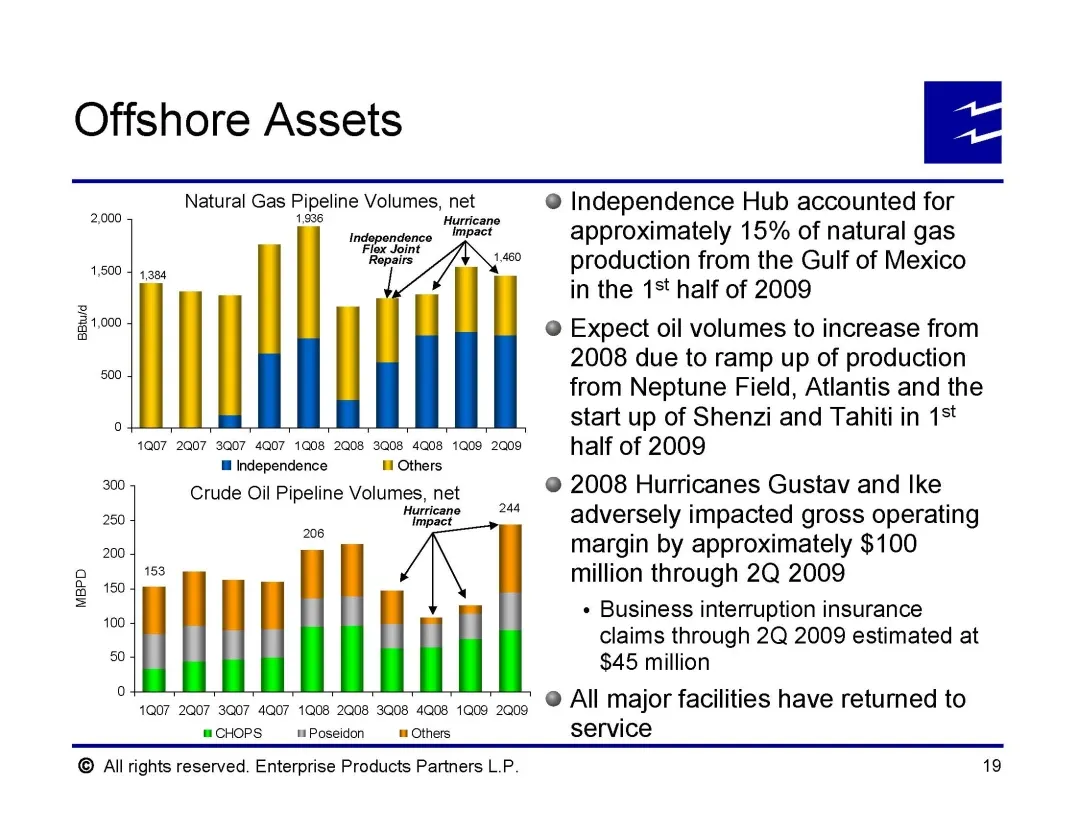
Offshore Assets Ee 500 MBPD 3 Natural Gas Pipeline Volumes, net @ Independence Hub accounted for 1986 ‘ inggpnoce Mimpect™ approximately 15% of natural gas fe Jom Repairs aie production from the Gulf of Mexico in the 1st half of 2009 @ Expect oil volumes to increase from 2008 due to ramp up of produ
Slide 20: Financial Snapshot
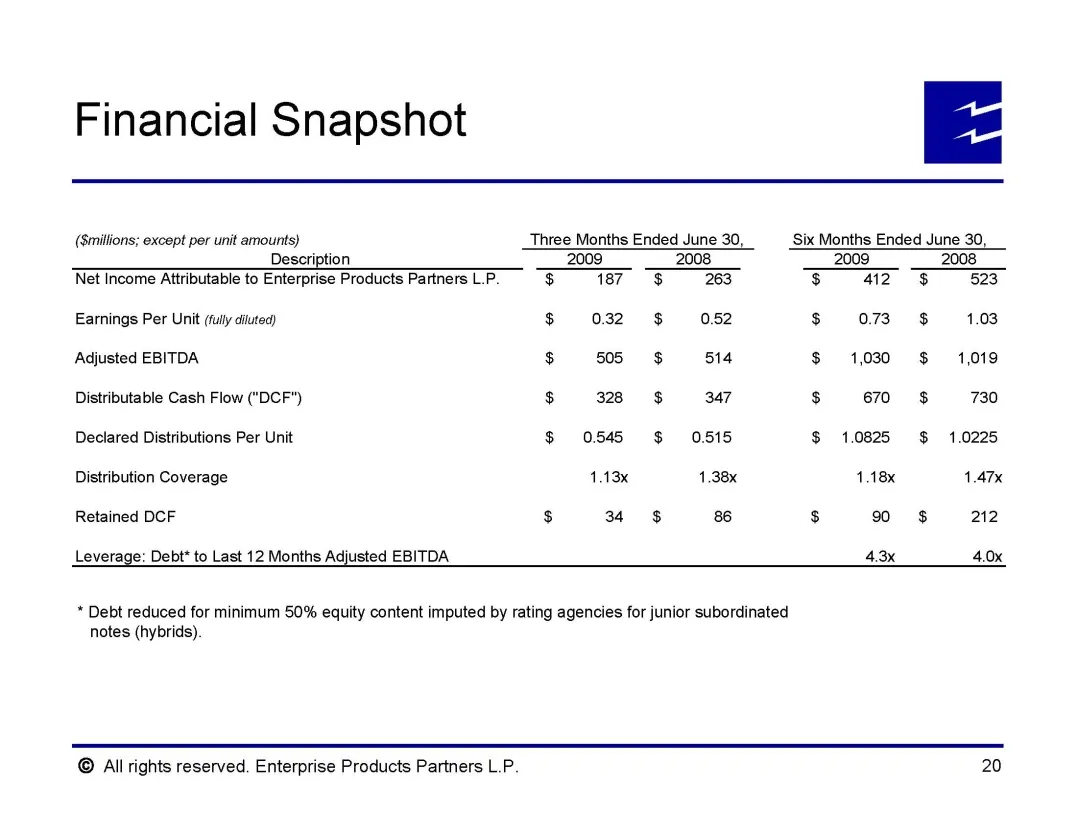
Financial Snapshot (Smitlions; except per unit amounts) Three Months Ended June 30, Six Months Ended June 30, Description 2009 2008 2009 2008 Net Income Attributable fo Enterprise Products Partners LP. $ ‘167 263 $ 412 $ 523 Earnings Per Unit (lly clluted) $ 032 052 $ 073 $ 1.03 Adjusted EBITDA $ 50
Slide 21: Substantial Financial Flexibility Added by Eliminating GP's 50% IDR
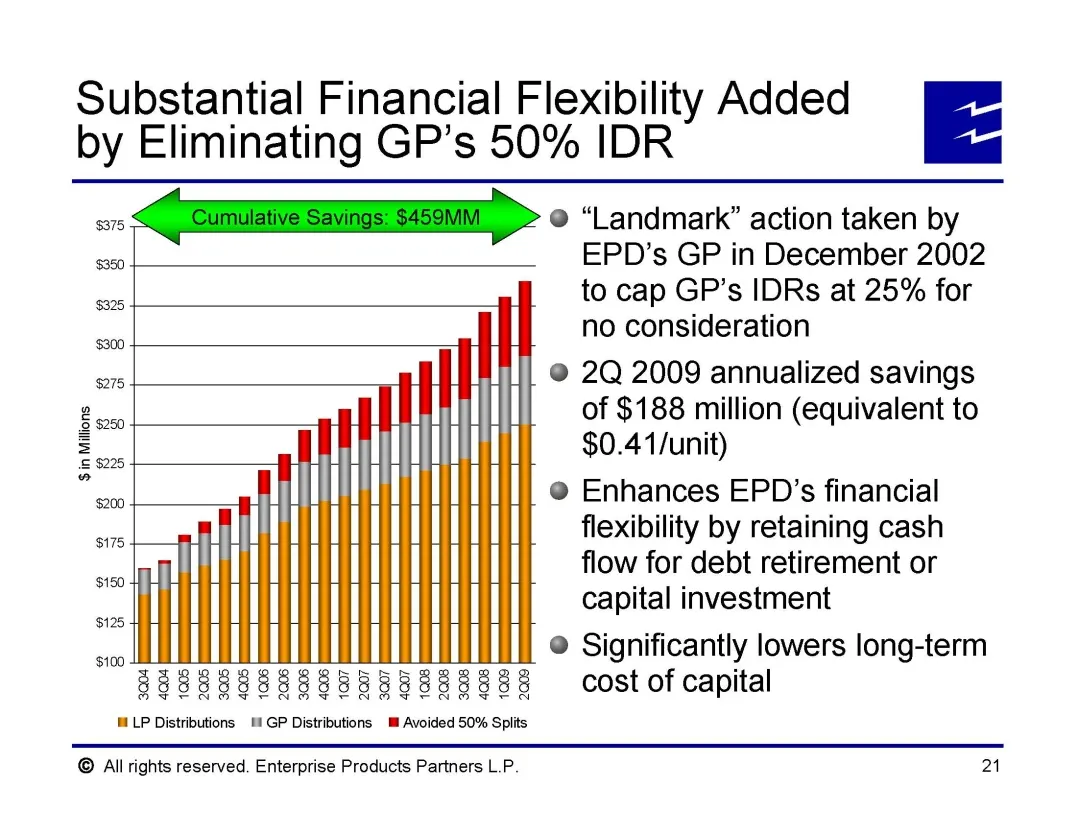
Substantial Financial Flexibility Added Ee by Eliminating GP’s 50% IDR ors qT @ “Landmark” action taken by EPD’s GP in December 2002 to cap GP’s IDRs at 25% for no consideration @ 2Q 2009 annualized savings of $188 million (equivalent to $0.4 1/unit) @ Enhances EPD’s financial flexibility by retaini
Slide 22: History of Financial Discipline
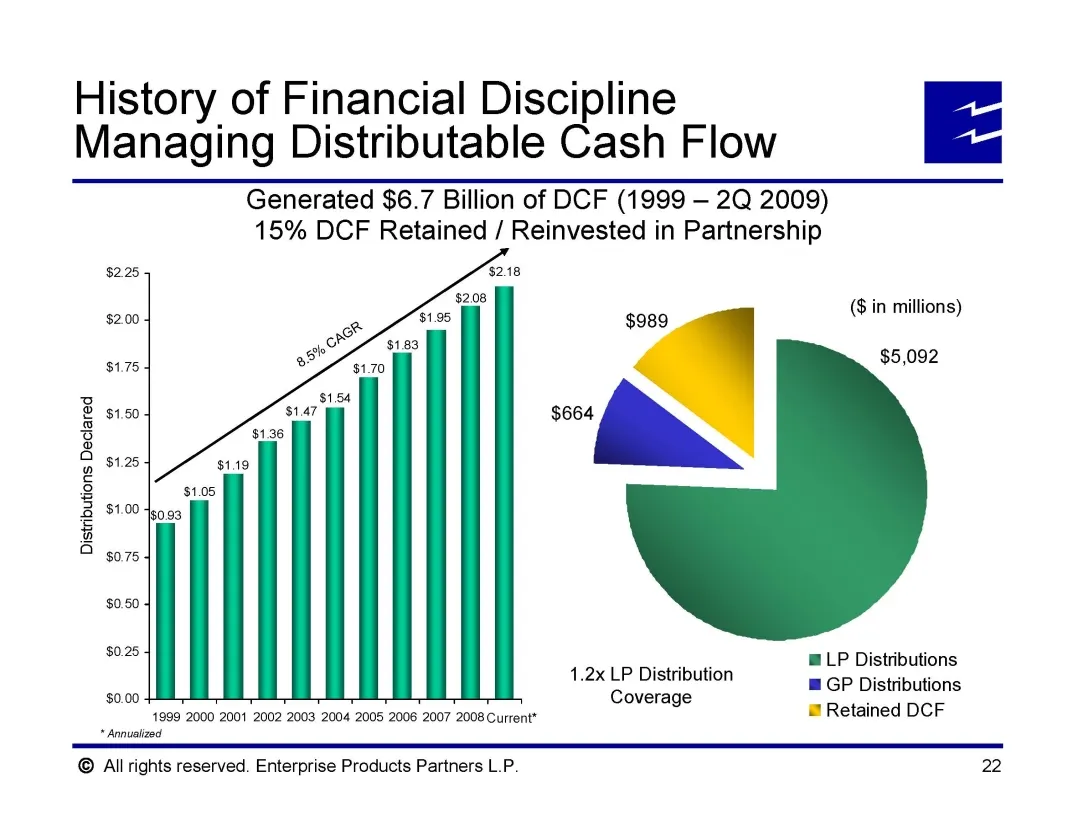
History of Financial Discipline Ee Managing Distributable Cash Flow Generated $6.7 Billion of DCF (1999 — 2Q 2009) 15% DCF Retained / Reinvested in Partnership $225 $2.00 ($ in millions) $1.75 $5,092 = B sis 5 o a o $1.25 z 5 S B $1.00 B 2 075 $0.50 so28 ox LP Distibuti LP Distributions ar Govern eo
Slide 23: Proven Track Record
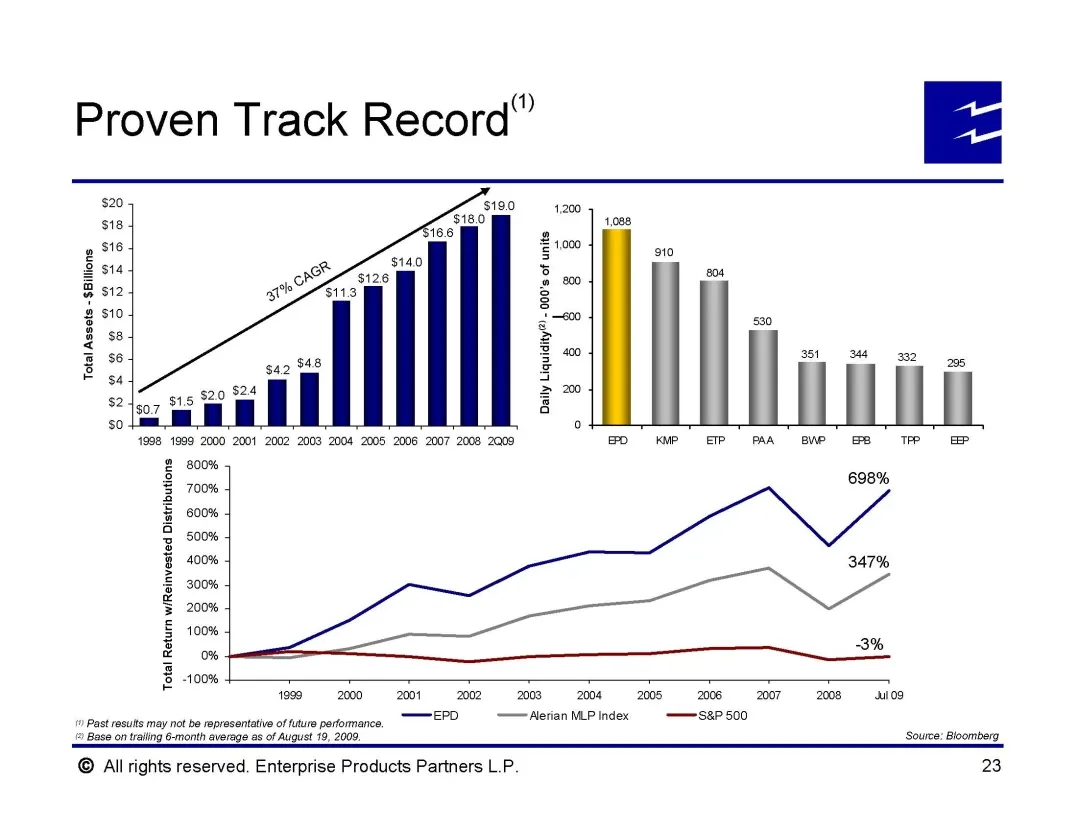
Proven Track Record” $20 $18 9 S16 3 si4 B si2 2 10 B88 BE 86 © 54 $2 so 1998 1999 2000 2001 2002 2003 2004 2005 2006 2007 2008 2009 2 800% g 700% 698% % 800% 3 500% % 400% 347% = 300% $ 200% E 100% Ew 3% 3 -100% | 1929 2000 ©2001-2002 20032008 2005.08 OUT 2008. 8 1?) Past results may not be represe
Slide 24: Key Investment Considerations
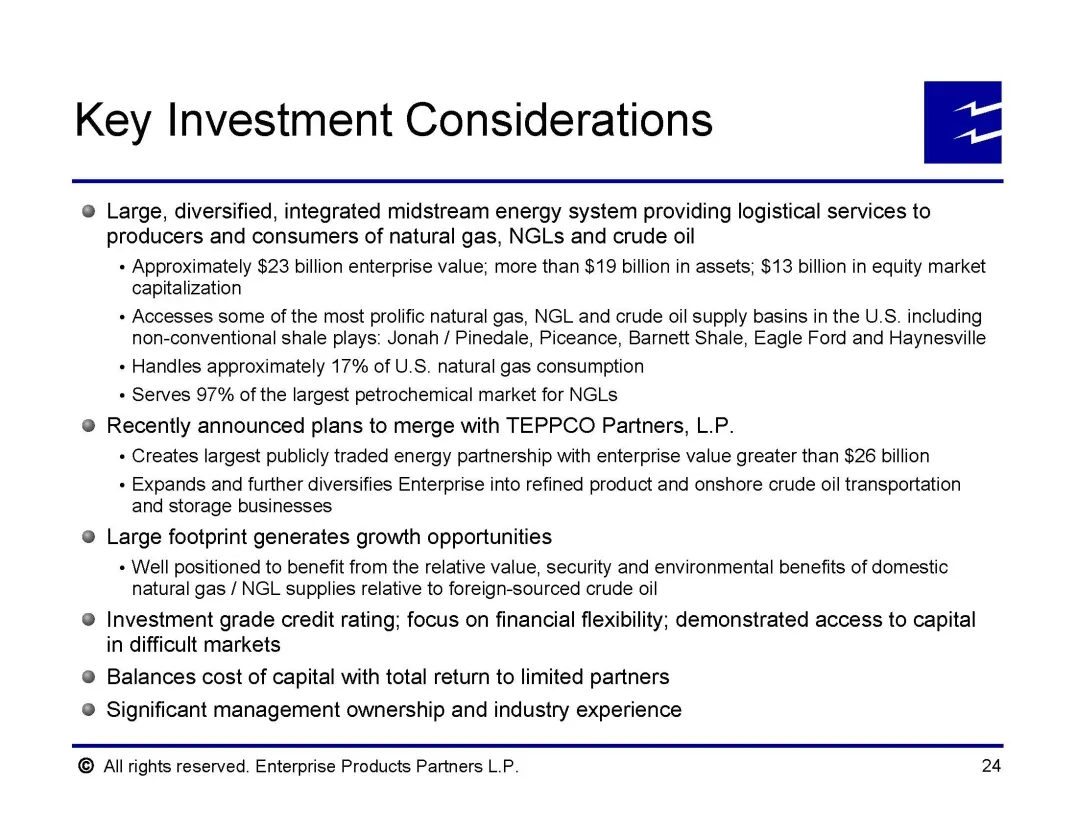
Key Investment Considerations @ Large, diversified, integrated midstream energy system providing logistical services to producers and consumers of natural gas, NGLs and crude oil + Approximately $23 billion enterprise value; more than $19 billion in assets; $13 billion in equity market capitalizatio
Slide 25: Non-GAAP Reconciliations
Non-GAAP Reconciliations © Allrights reserved. Enterprise Products Partners L.P.
Slide 26: Non-GAAP Financial Measures
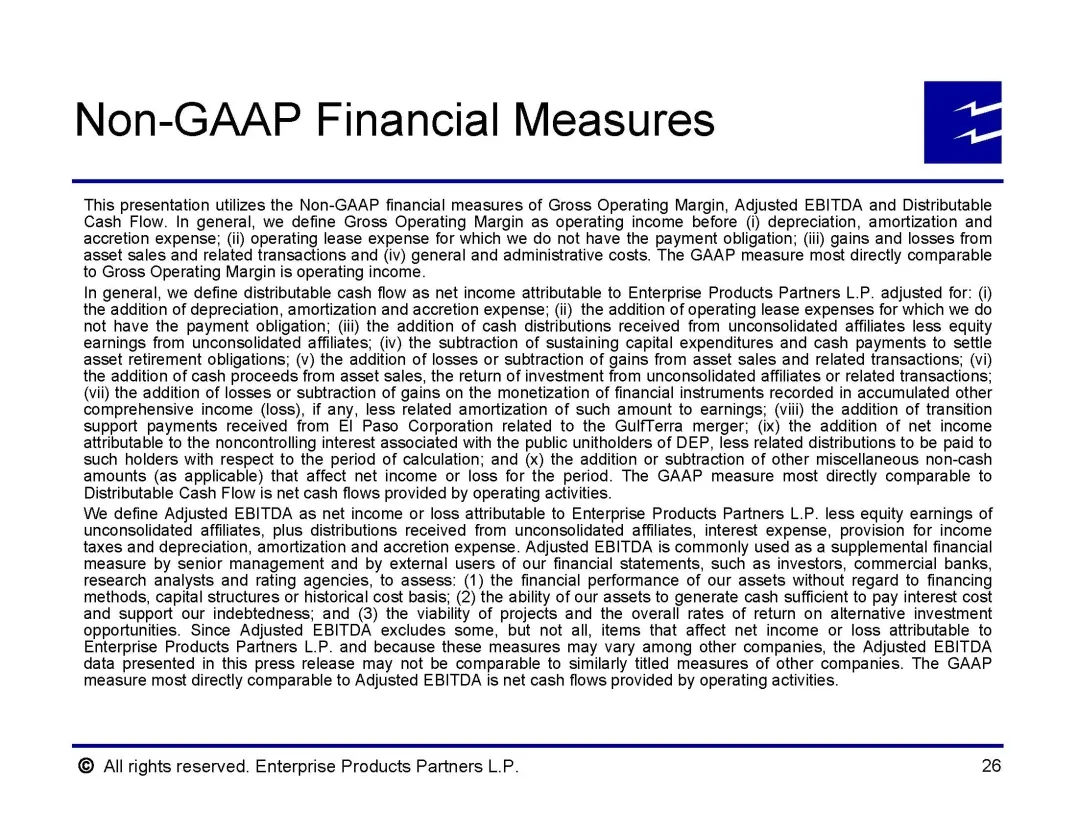
Non-GAAP Financial Measures This presentation utilizes the Non-GAAP financial measures of Gross Operating Margin, Adjusted EBITDA and Distributable Cash Flow. In general, we define Gross Operating Margin as operating income before (i) depreciation, amortization and accretion expense; (ii) operating
Slide 27: Non-GAAP Reconciliations
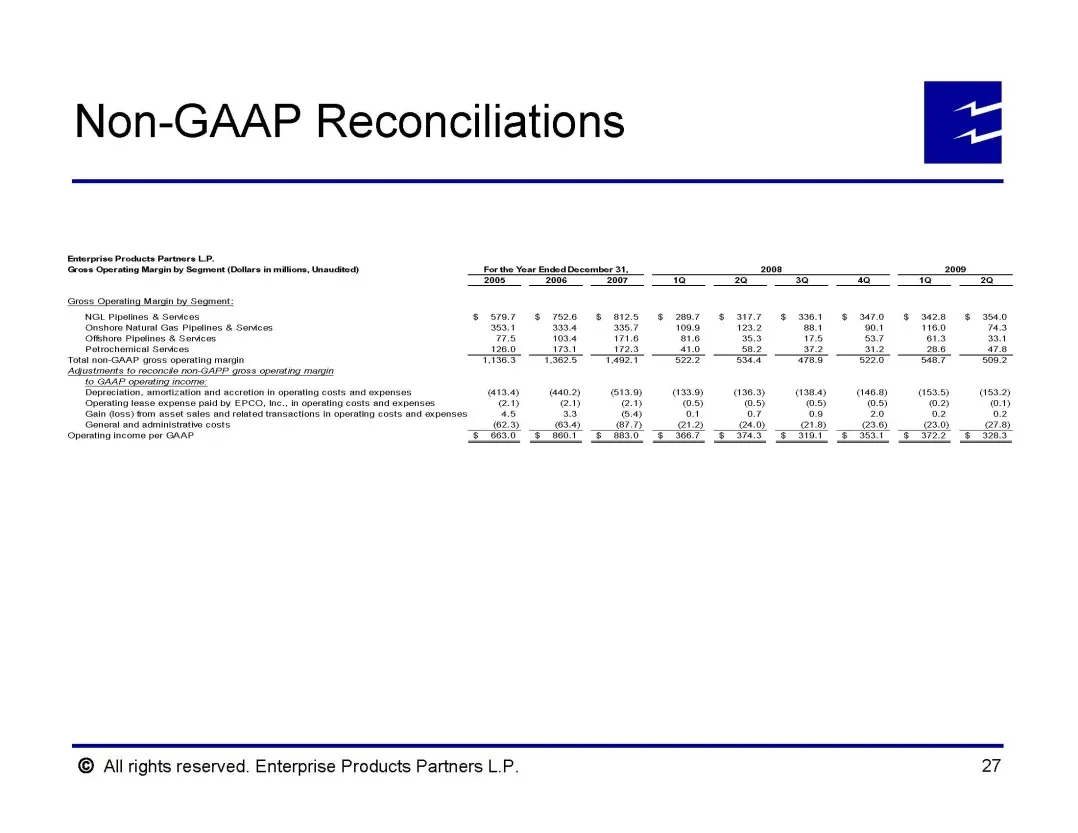
Non-GAAP Reconciliations Eorprise Prosicts Partners LP. ‘Grons Operating Margin by Segment (tlars in millions, Unaudited) "2005 "2006 2007. co] 3a cr 12 a Onshore Natural Ga S340 Seat aaa 6.7 ton 28. 1 ‘01 n60 743 775 (Whe 7G 818 38.3, 7 sar 13 ou 134) 4402) 13.9) 1339) 138) 9B) (4B) S|) 52) cay 2)
Slide 28: Non-GAAP Reconciliations
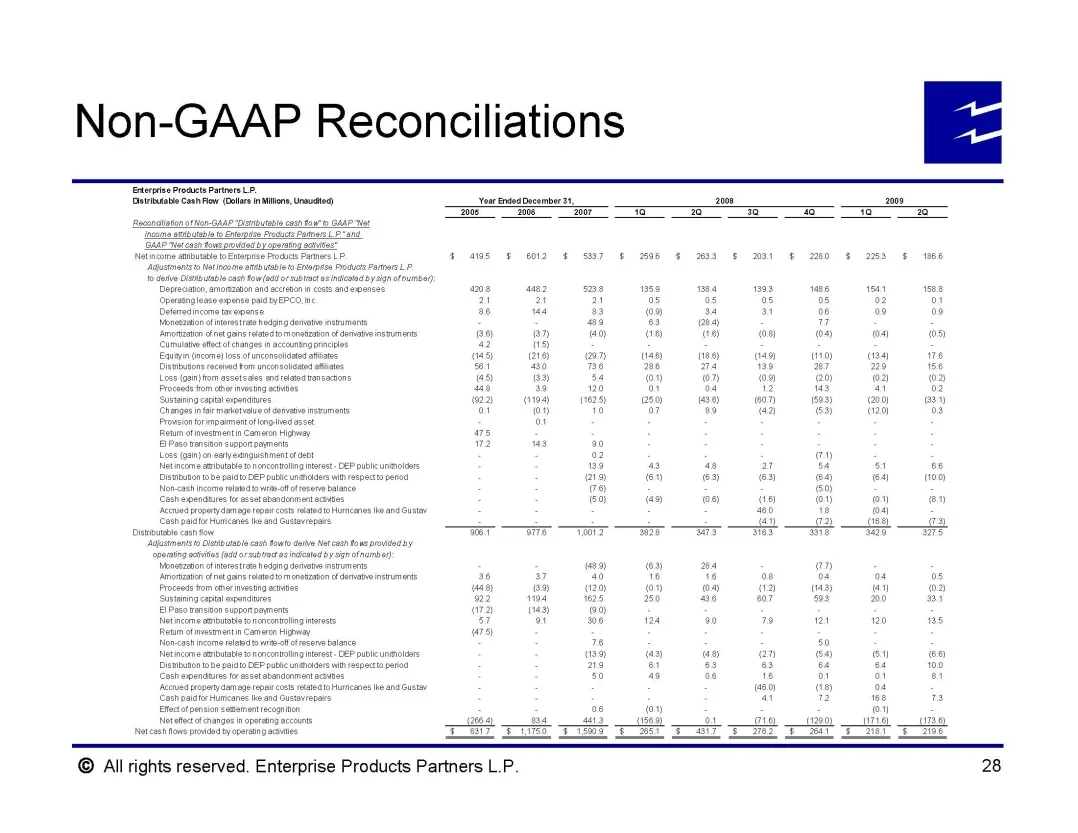
Non-GAAP Reconciliations TEtargie roars Parma P ‘striate Cash (Oars nine, Uauateg) $ as § e012 $ su7 $ 2598 § 233 § mI $ 20 $ 253 6 158 plese pense pat byEPCO nc cn 21 a 05 05 05 08 02 Deleratincome tacenenre a6 ea aa 09 a n 06 00 09 Nonezaton ol esate hedsngdenabw atuments aa 83) ” mote cnet ans ra
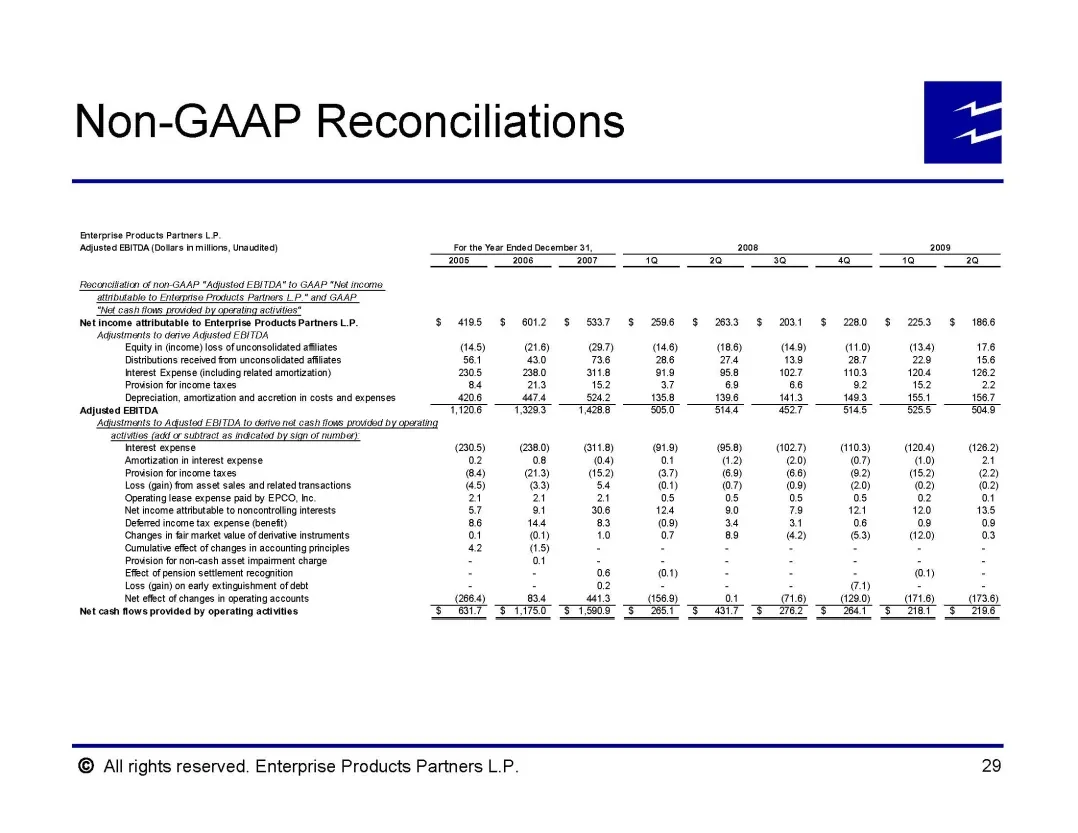
Slide 29: Non-GAAP Reconciliations
Non-GAAP Reconciliations [Enterprise Products Partnees LP. ‘Adjusted EBITDA (Ootars milion, Unauited) For the Year Ended December 31 2008 2008 2005. 2006. 2007 73 7 3a 7 7 7 fnop.GAAP “Adusiod EBITDA” to GAAP “Net ncemo “albu to Entorpise Prods Parlors LP” and GAAP. "el cash flows prado by operating
Source: SEC EDGAR · 425 filed Aug 26, 2009
More decks from Teppco Partners LP
 Morgan Stanley MLP Reception (October 2009)26 slides · Oct 7, 2009
 Master Limited Partnerships Investor Conference (September 2009)27 slides · Sep 16, 2009
 Wells Fargo Retail Meeting (September 2009)27 slides · Sep 15, 2009
 Barclays Capital CEO Energy/Power Conference 200929 slides · Sep 9, 2009
 Wachovia Securities Investor Presentation (June 2007)51 slides · Jun 1, 2007
 Investor Day (March 2007)75 slides · Mar 29, 2007