Strategic Hotels and Resorts Inc
Strategic Hotels and Resorts — Investor Presentation (May 2013)
34 slides from Strategic Hotels and Resorts's investor presentation, May 14, 2013

Slide 1: Investor Presentation May 2013
Investor Presentation May 2013 Exhibit 99.1
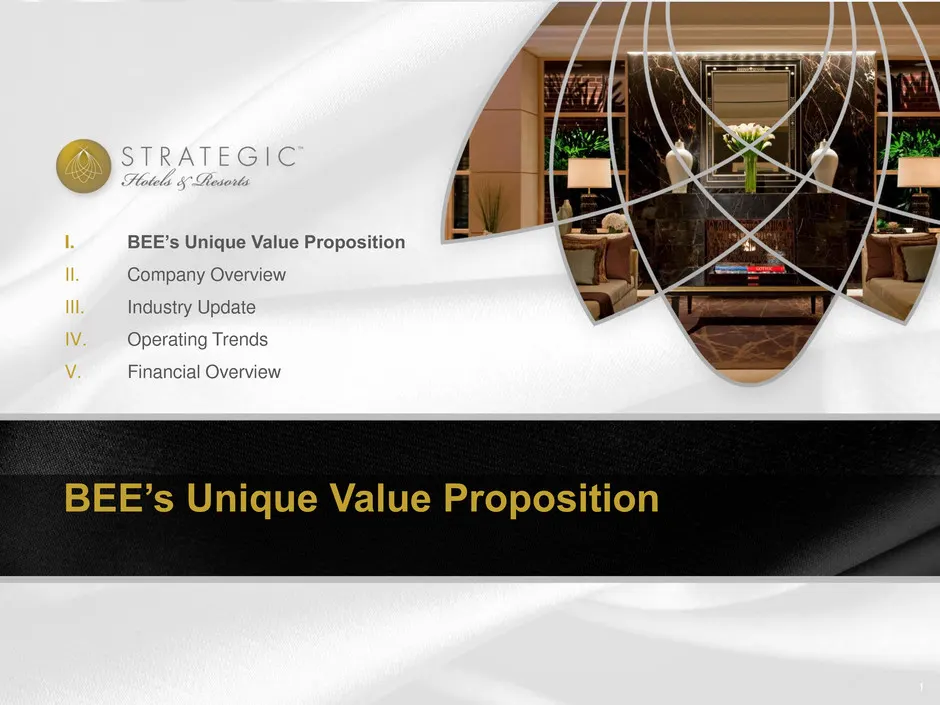
Slide 2: BEE's Unique Value Proposition: Agenda
I. BEE’s Unique Value Proposition II. Company Overview III. Industry Update IV. Operating Trends V. Financial Overview BEE’s Unique Value Proposition 1
Slide 3: The best investment proposition in the lodging space
o The only pure play high-end lodging REIT o High-end outperforms the industry in a recovery o Industry leading asset management expertise o Assets are in pristine condition o Embedded organic growth through revenue growth and ROI opportunities o Historically low supply growth environment, particula
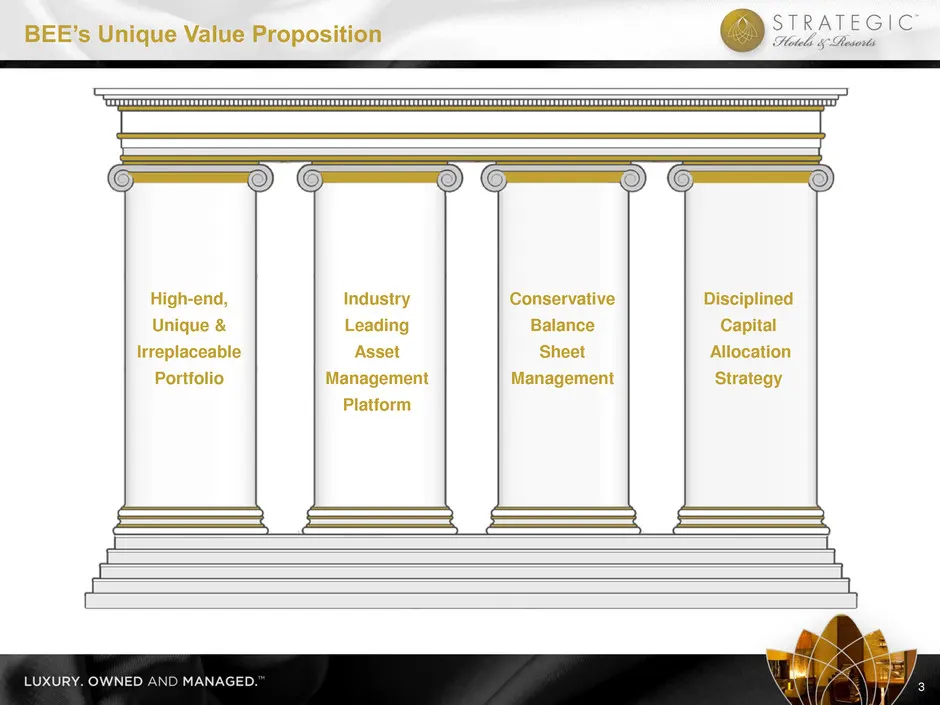
Slide 4: BEE's Unique Value Proposition
BEE’s Unique Value Proposition 3 High-end, Unique & Irreplaceable Portfolio Industry Leading Asset Management Platform Conservative Balance Sheet Management Disciplined Capital Allocation Strategy
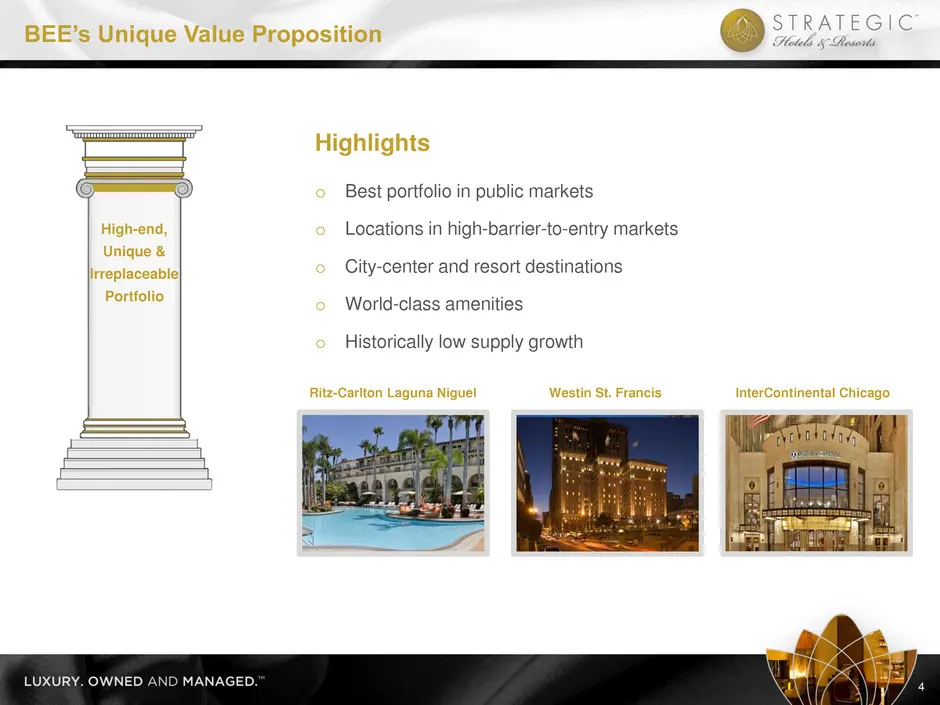
Slide 5: High-end, Unique & Irreplaceable Portfolio
Highlights o Best portfolio in public markets o Locations in high-barrier-to-entry markets o City-center and resort destinations o World-class amenities o Historically low supply growth Westin St. Francis Ritz-Carlton Laguna Niguel InterContinental Chicago BEE’s Unique Value Proposition 4 High-end,
Slide 6: Industry Leading Asset Management Platform
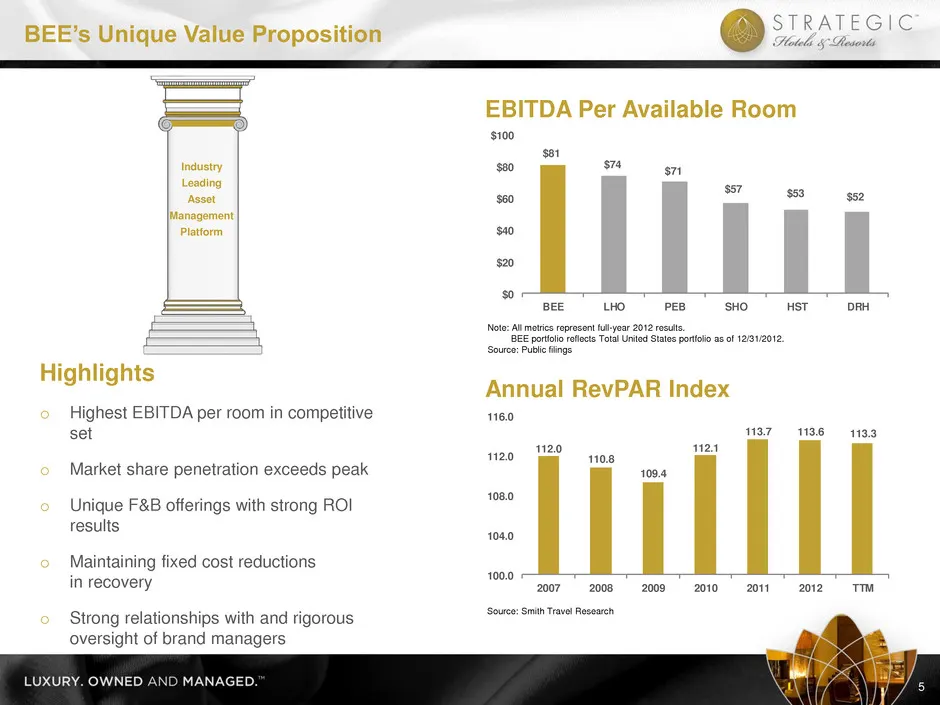
Highlights o Highest EBITDA per room in competitive set o Market share penetration exceeds peak o Unique F&B offerings with strong ROI results o Maintaining fixed cost reductions in recovery o Strong relationships with and rigorous oversight of brand managers EBITDA Per Available Room Annual RevPAR
Slide 7: Conservative Balance Sheet Management
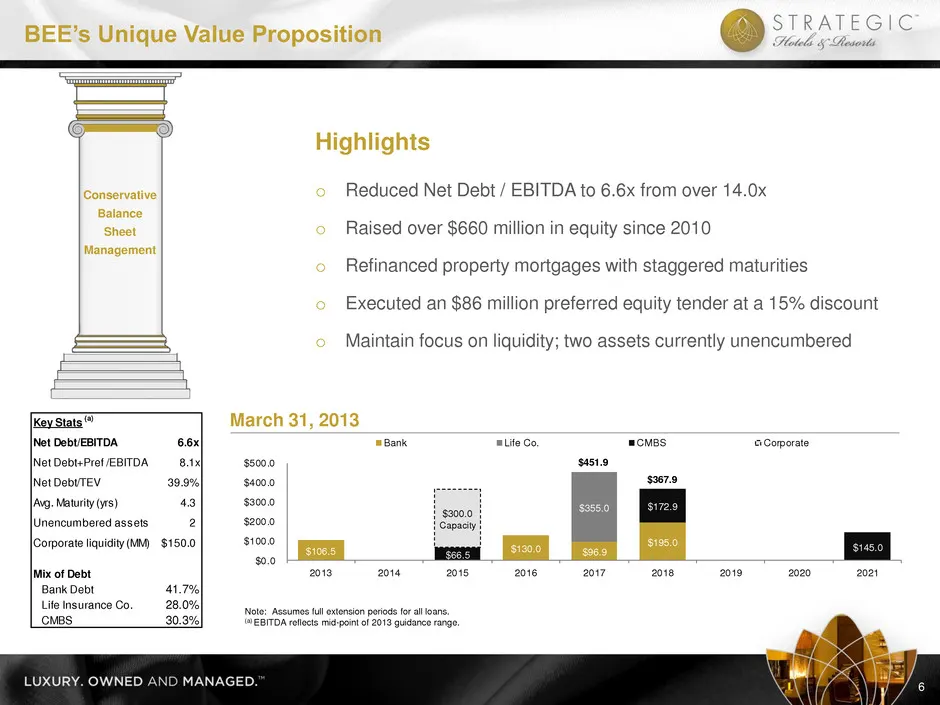
Key Stats (a) Net Debt/EBITDA 6.6x Net Debt+Pref /EBITDA 8.1x Net Debt/TEV 39.9% Avg. Maturity (yrs) 4.3 Unencumbered assets 2 Corporate liquidity (MM) $150.0 Mix of Debt Bank Debt 41.7% Life Insurance Co. 28.0% CMBS 30.3% Highlights o Reduced Net Debt / EBITDA to 6.6x from over 14.0x o Raised over
Slide 8: Disciplined Capital Allocation Strategy
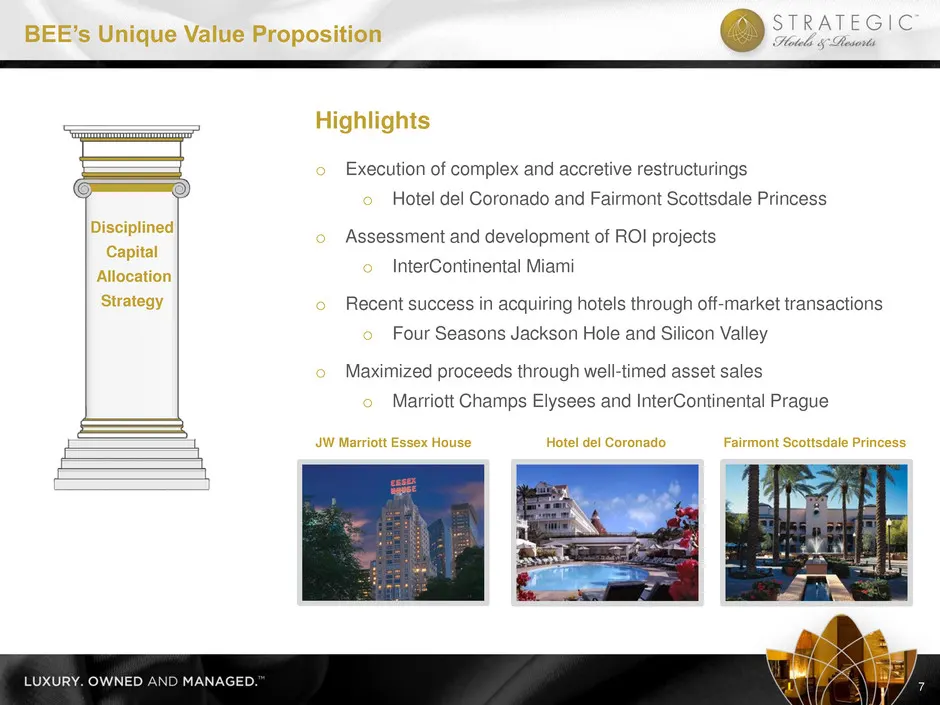
Highlights o Execution of complex and accretive restructurings o Hotel del Coronado and Fairmont Scottsdale Princess o Assessment and development of ROI projects o InterContinental Miami o Recent success in acquiring hotels through off-market transactions o Four Seasons Jackson Hole and Silicon Vall
Slide 9: Company Overview
I. BEE’s Unique Value Proposition II. Company Overview III. Industry Update IV. Operating Trends V. Financial Overview Company Overview 8
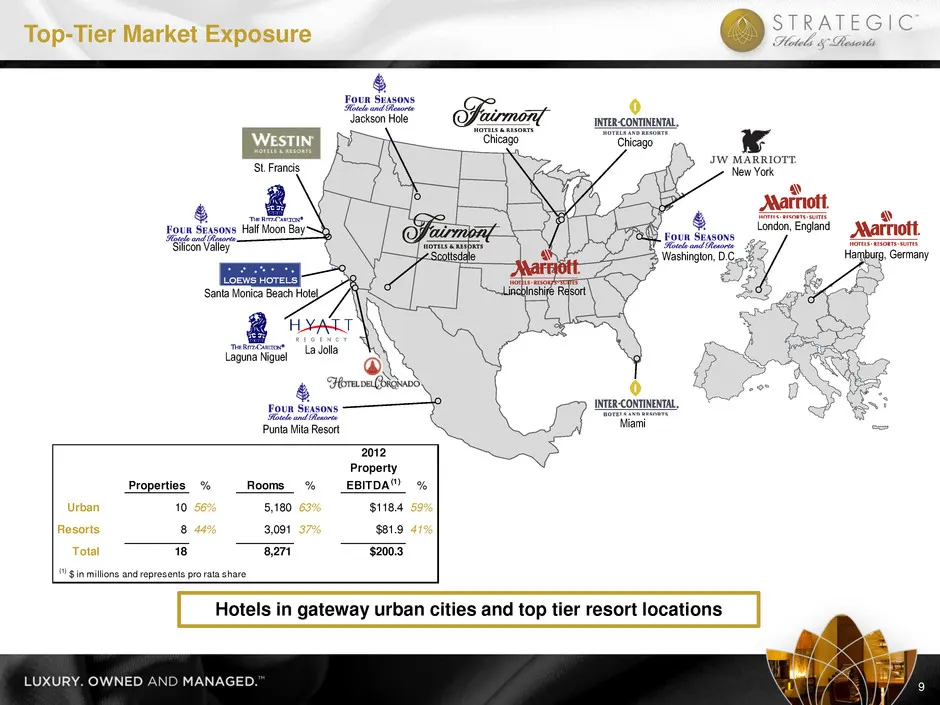
Slide 10: Top-Tier Market Exposure
Properties % Rooms % 2012 Property EBITDA (1) % Urban 10 56% 5,180 63% $118.4 59% Resorts 8 44% 3,091 37% $81.9 41% Total 18 8,271 $200.3 (1) $ in millions and represents pro rata share Top-Tier Market Exposure Hotels in gateway urban cities and top tier resort locations Hamburg, Germany Chicago Lin
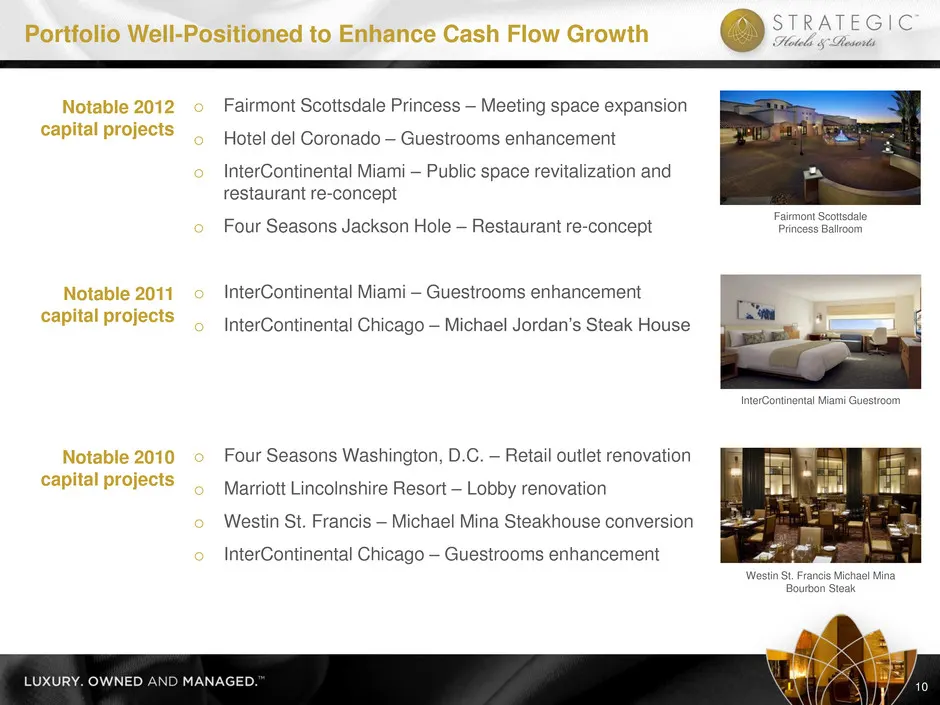
Slide 11: Portfolio Well-Positioned to Enhance Cash Flow Growth
o InterContinental Miami – Guestrooms enhancement o InterContinental Chicago – Michael Jordan’s Steak House o Four Seasons Washington, D.C. – Retail outlet renovation o Marriott Lincolnshire Resort – Lobby renovation o Westin St. Francis – Michael Mina Steakhouse conversion o InterContinental Chicag
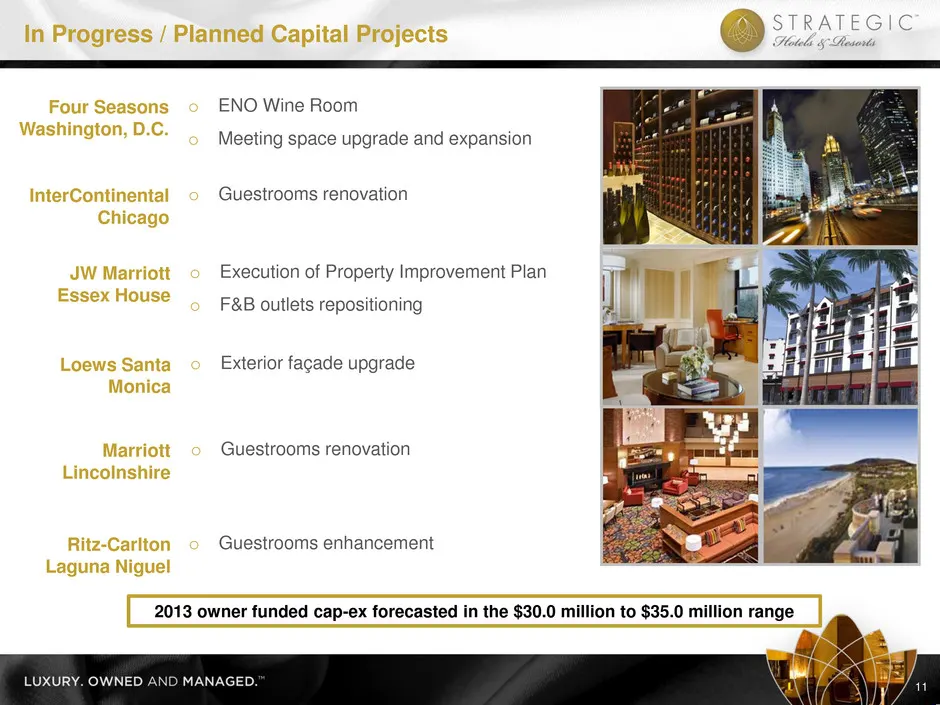
Slide 12: In Progress / Planned Capital Projects
o Guestrooms renovation InterContinental Chicago In Progress / Planned Capital Projects 11 o ENO Wine Room o Meeting space upgrade and expansion Four Seasons Washington, D.C. o Exterior façade upgrade Loews Santa Monica o Guestrooms enhancement Ritz-Carlton Laguna Niguel o Guestrooms renovation Marr
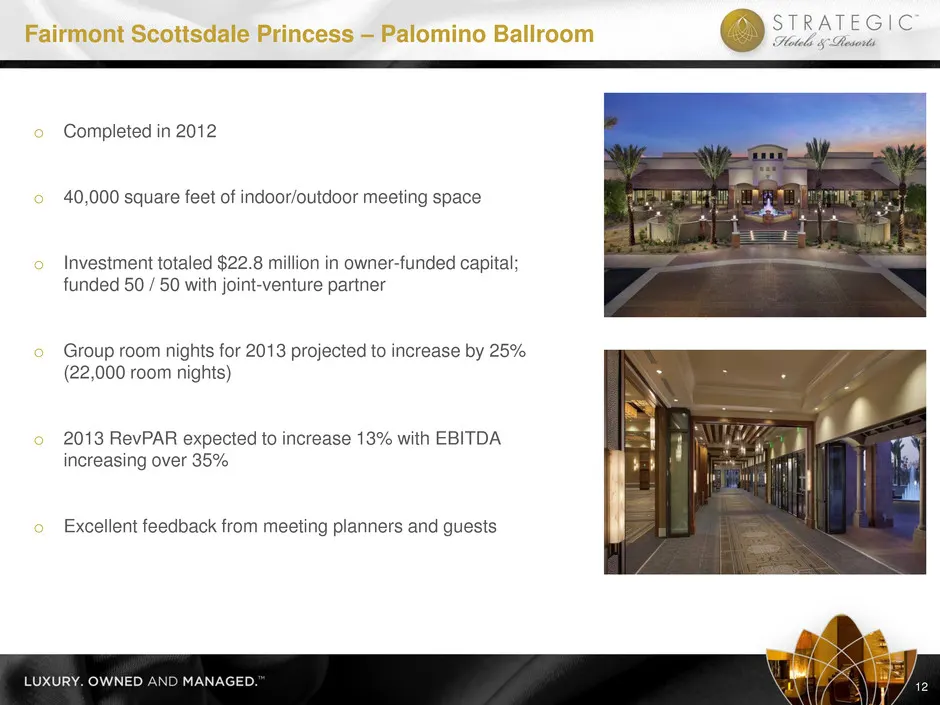
Slide 13: Fairmont Scottsdale Princess – Palomino Ballroom
Fairmont Scottsdale Princess – Palomino Ballroom o Completed in 2012 o 40,000 square feet of indoor/outdoor meeting space o Investment totaled $22.8 million in owner-funded capital; funded 50 / 50 with joint-venture partner o Group room nights for 2013 projected to increase by 25% (22,000 room night
Slide 14: InterContinental Miami – Innovative Repositioning
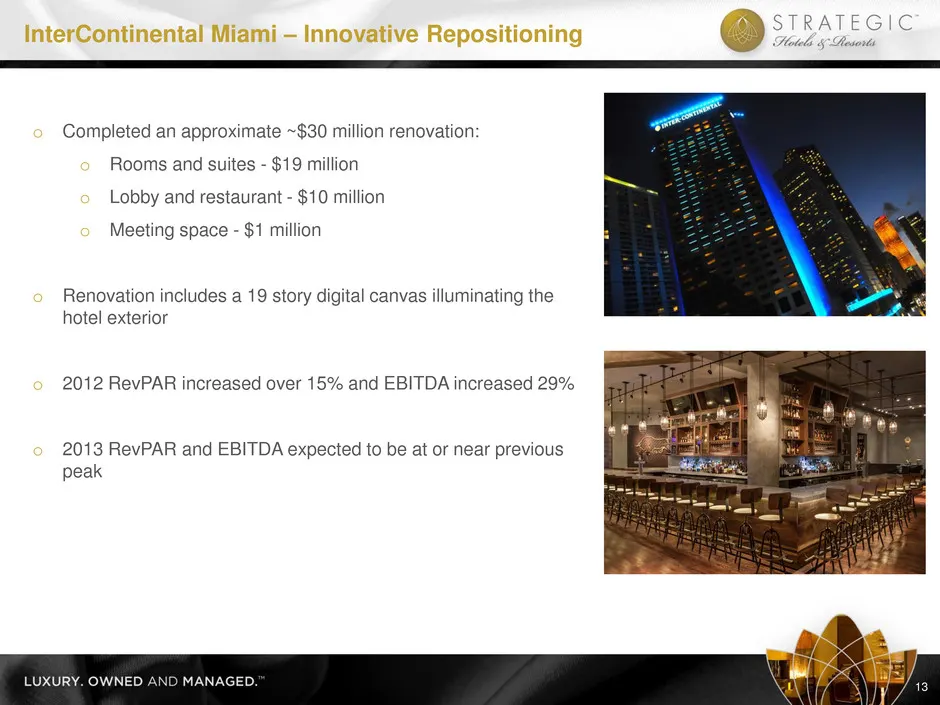
InterContinental Miami – Innovative Repositioning o Completed an approximate ~$30 million renovation: o Rooms and suites - $19 million o Lobby and restaurant - $10 million o Meeting space - $1 million o Renovation includes a 19 story digital canvas illuminating the hotel exterior o 2012 RevPAR incre

Slide 15: Industry Update
I. BEE’s Unique Value Proposition II. Company Overview III. Industry Update IV. Operating Trends V. Financial Overview Industry Update 14
Slide 16: Luxury Lodging Supply & Demand Dynamics
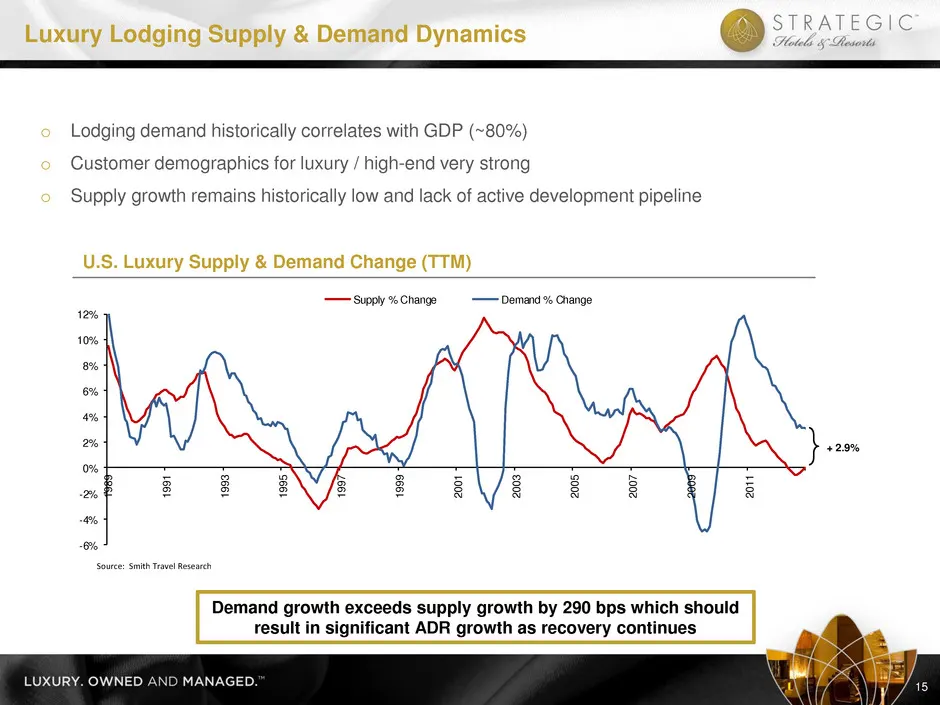
-6% -4% -2% 0% 2% 4% 6% 8% 10% 12% 198 9 199 1 199 3 199 5 199 7 199 9 200 1 200 3 200 5 200 7 200 9 201 1 Supply % Change Demand % Change o Lodging demand historically correlates with GDP (~80%) o Customer demographics for luxury / high-end very strong o Supply growth remains historically low and l
Slide 17: Luxury Hotels Outperform in a Recovery
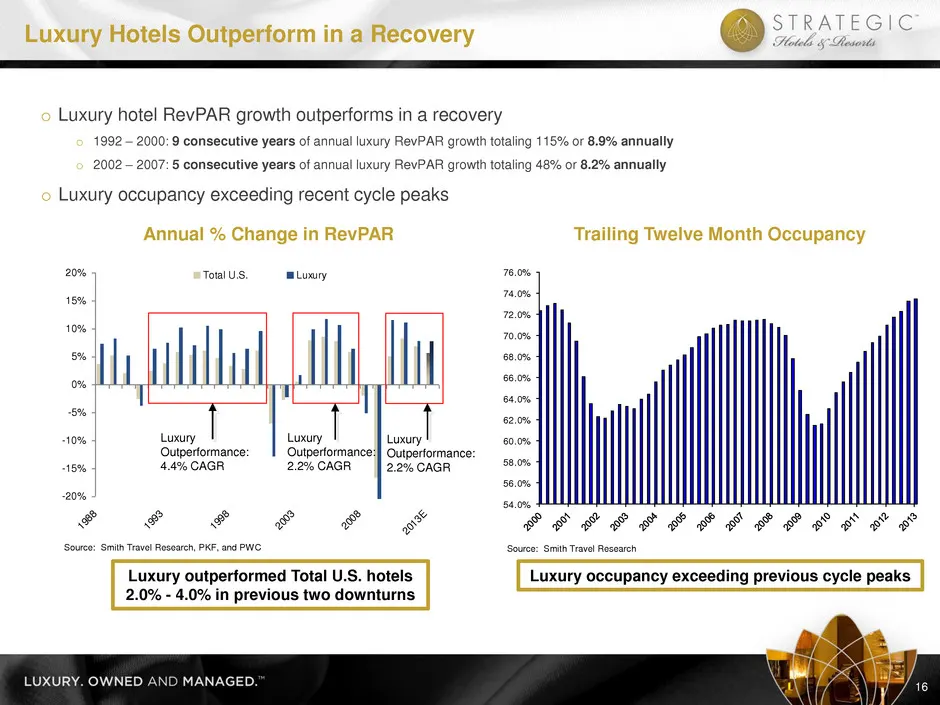
54.0% 56.0% 58.0% 60.0% 62.0% 64.0% 66.0% 68.0% 70.0% 72.0% 74.0% 76.0% 16 Source: Smith Travel Research, PKF, and PWC -20% -15% -10% -5% 0% 5% 10% 15% 20% 19 88 19 93 19 98 20 03 20 08 20 13 E Total U.S. Luxury Source: Smith Travel Research Luxury Outperformance: 4.4% CAGR Luxury Outperformance: 2.
Slide 18: BEE Outperforms Competitors
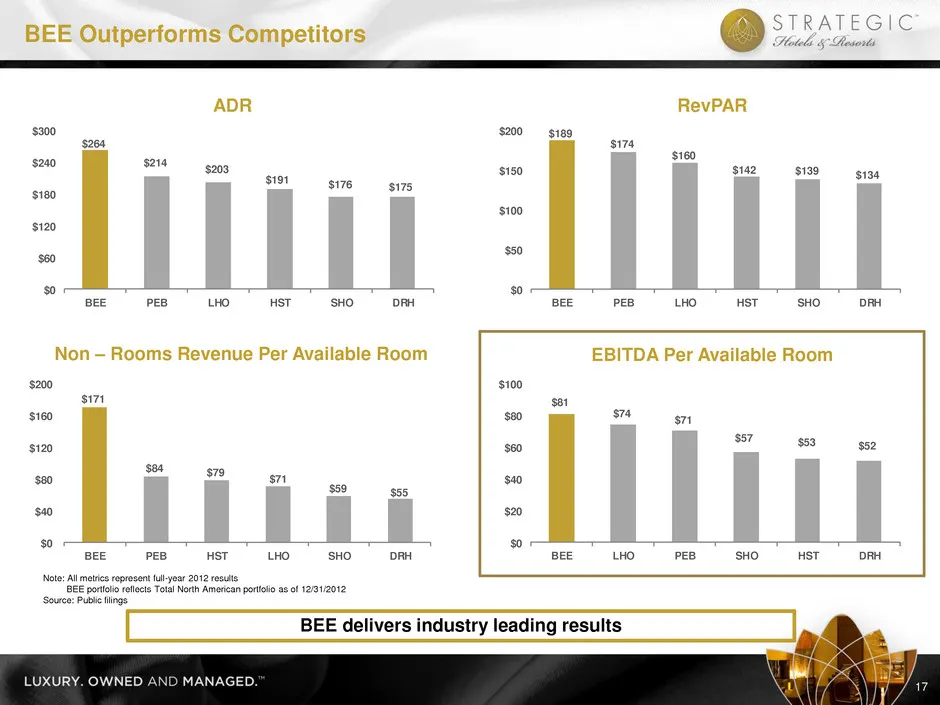
ADR RevPAR EBITDA Per Available Room Non – Rooms Revenue Per Available Room Note: All metrics represent full-year 2012 results BEE portfolio reflects Total North American portfolio as of 12/31/2012 Source: Public filings BEE delivers industry leading results BEE Outperforms Competitors 17 $189 $174
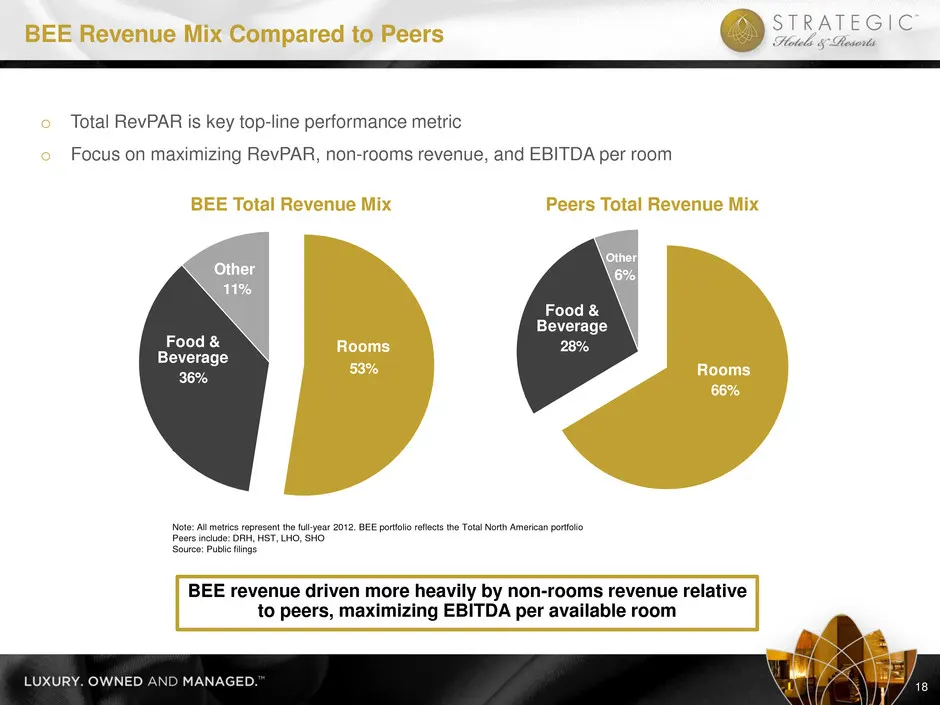
Slide 19: BEE Revenue Mix Compared to Peers
53% 36% 11% Rooms Other Food & Beverage 66% 28% 6% Food & Beverage Other Roomso Total RevPAR is key top-line performance metric o Focus on maximizing RevPAR, non-rooms revenue, and EBITDA per room BEE Total Revenue Mix Peers Total Revenue Mix Note: All metrics represent the full-year 2012. BEE portf
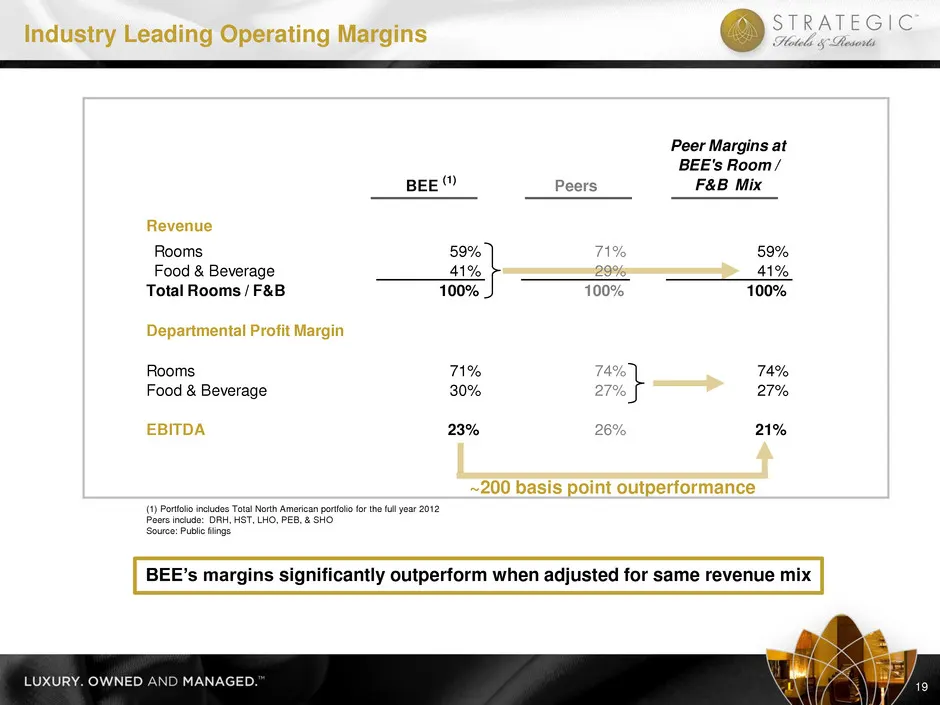
Slide 20: Industry Leading Operating Margins
~200 basis point outperformance (1) Portfolio includes Total North American portfolio for the full year 2012 Peers include: DRH, HST, LHO, PEB, & SHO Source: Public filings BEE’s margins significantly outperform when adjusted for same revenue mix Industry Leading Operating Margins 19 BEE (1) Peers P
Slide 21: Operating Trends
I. BEE’s Unique Value Proposition II. Company Overview III. Industry Update IV. Operating Trends V. Financial Overview Operating Trends 20
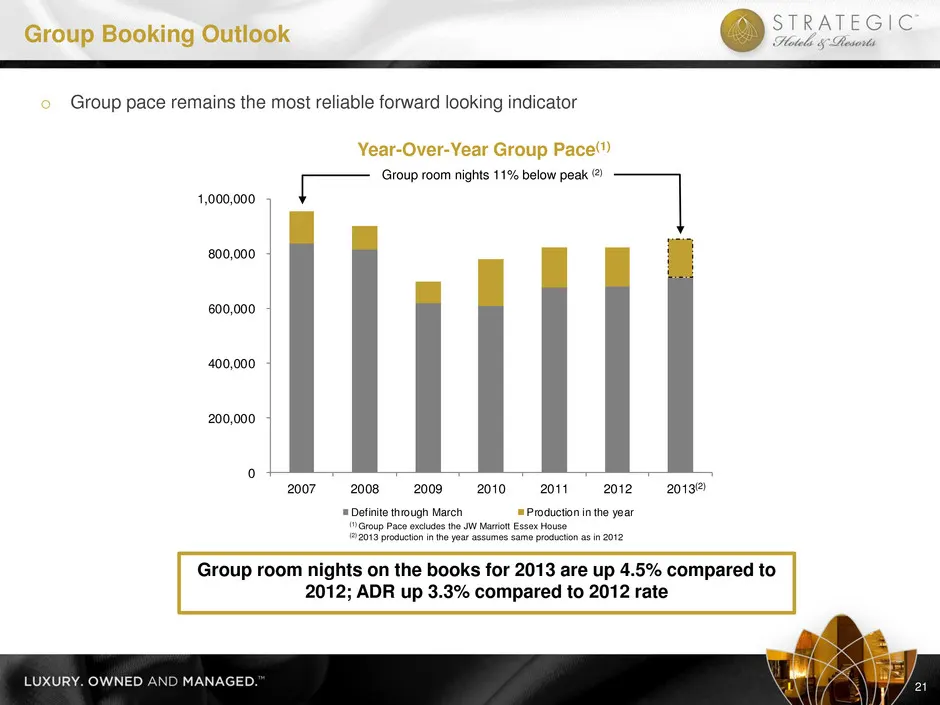
Slide 22: Group Booking Outlook
0 200,000 400,000 600,000 800,000 1,000,000 2007 2008 2009 2010 2011 2012 2013 Definite through March Production in the year o Group pace remains the most reliable forward looking indicator Year-Over-Year Group Pace(1) Group room nights 11% below peak (2) (1) Group Pace excludes the JW Marriott Esse
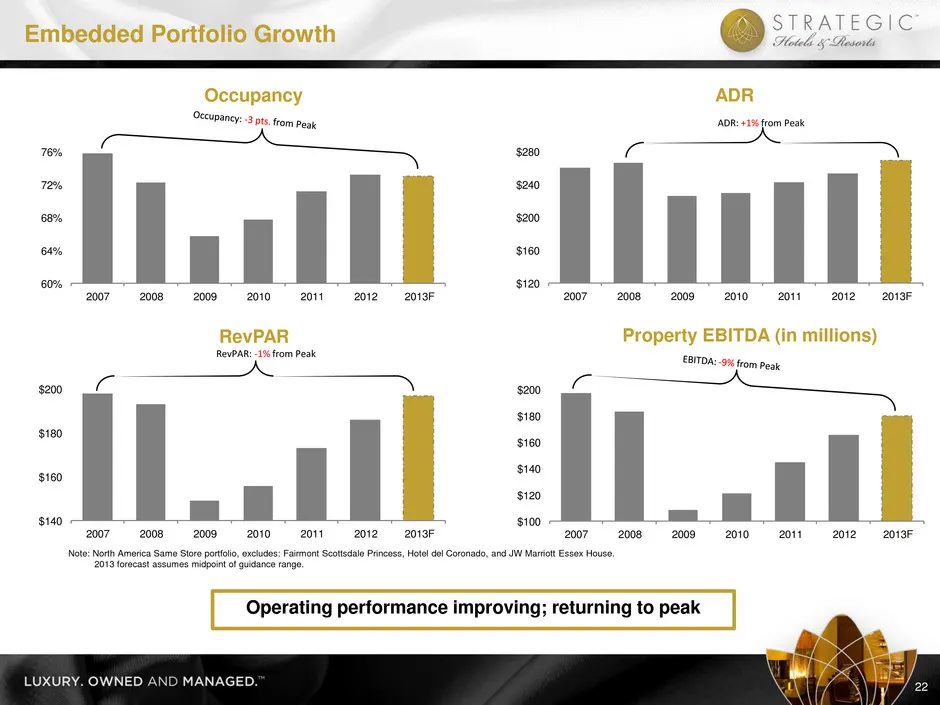
Slide 23: Embedded Portfolio Growth
60% 64% 68% 72% 76% 2007 2008 2009 2010 2011 2012 2013F $140 $160 $180 $200 2007 2008 2009 2010 2011 2012 2013F $100 $120 $140 $160 $180 $200 2007 2008 2009 2010 2011 2012 2013F $120 $160 $200 $240 $280 7 08 09 0 2011 2012 2013F ADR: +1% from Peak RevPAR: -1% from Peak Occupancy ADR RevPAR Property
Slide 24: Financial Overview
I. BEE’s Unique Value Proposition II. Company Overview III. Industry Update IV. Operating Trends V. Financial Overview Financial Overview 23
Slide 25: Accomplishments Since January 1st, 2010
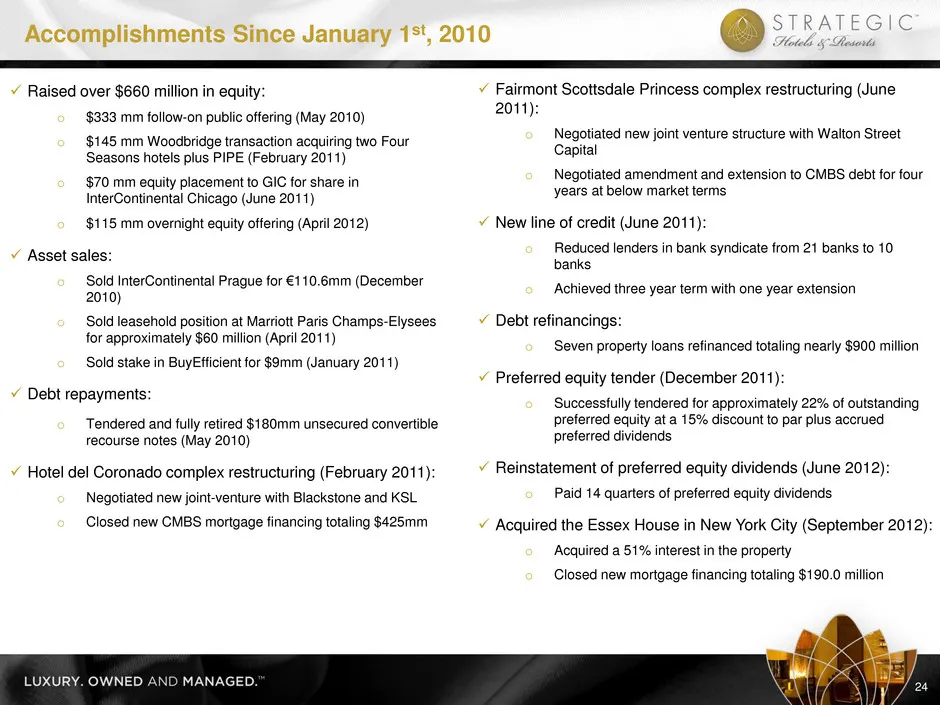
Raised over $660 million in equity: o $333 mm follow-on public offering (May 2010) o $145 mm Woodbridge transaction acquiring two Four Seasons hotels plus PIPE (February 2011) o $70 mm equity placement to GIC for share in InterContinental Chicago (June 2011) o $115 mm overnight equity offering (Ap
Slide 26: 1st Quarter 2013 Results
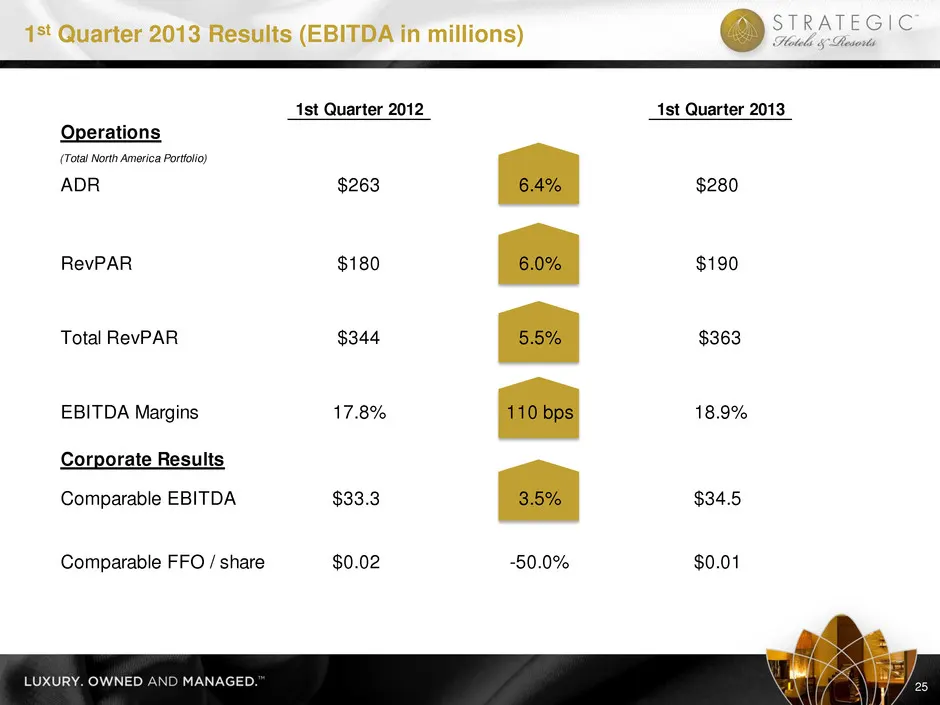
1st Quarter 2013 Results (EBITDA in millions) 25 1st Quarter 2012 1st Quarter 2013 Operations (Total North America Portfolio) ADR $263 6.4% $280 RevPAR $180 6.0% $190 Total RevPAR $344 5.5% $363 EBITDA Margins 17.8% 110 bps 18.9% Corporate Results Comparable EBITDA $33.3 3.5% $34.5 Comparable FFO /
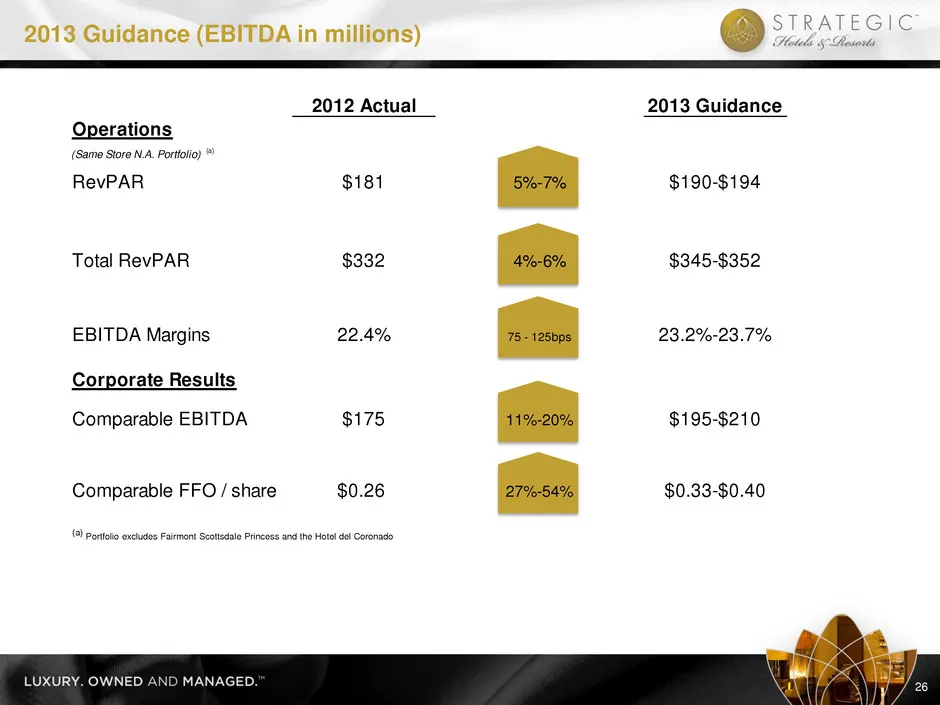
Slide 27: 2013 Guidance
(a) Portfolio excludes Fairmont Scottsdale Princess and the Hotel del Coronado 2013 Guidance (EBITDA in millions) 26 2012 Actual 2013 Guidance Operations (Same Store N.A. Portfolio) (a) RevPAR $181 5%-7% $190-$194 Total RevPAR $332 4%-6% $345-$352 EBITDA Margins 22.4% 75 - 125bps 23.2%-23.7% Corpora
Slide 28: The best investment proposition in the lodging space
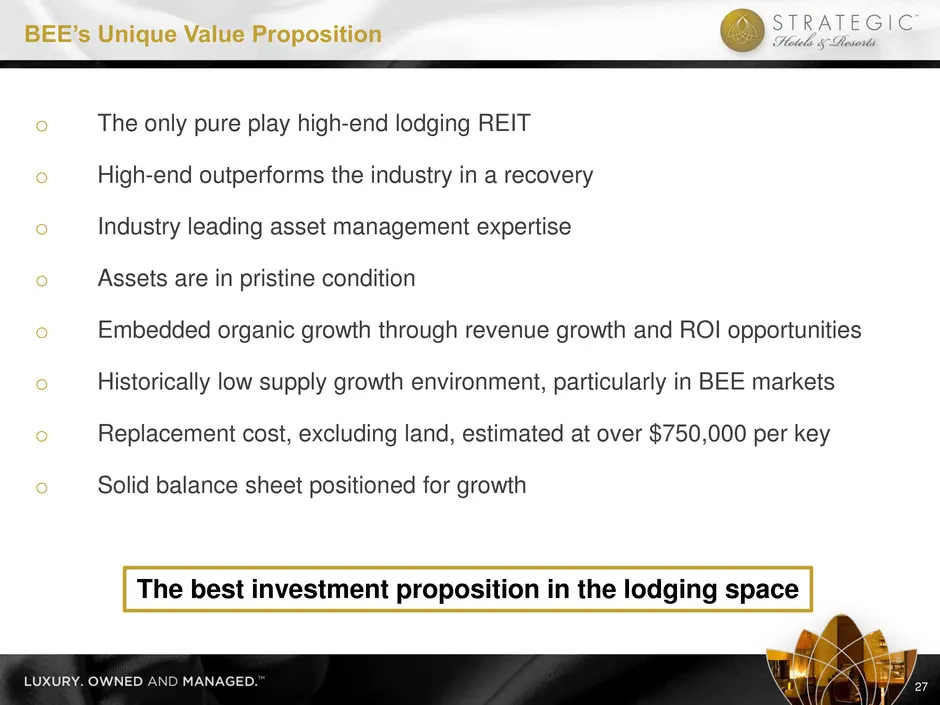
o The only pure play high-end lodging REIT o High-end outperforms the industry in a recovery o Industry leading asset management expertise o Assets are in pristine condition o Embedded organic growth through revenue growth and ROI opportunities o Historically low supply growth environment, particula
Slide 29: Forward-looking statements
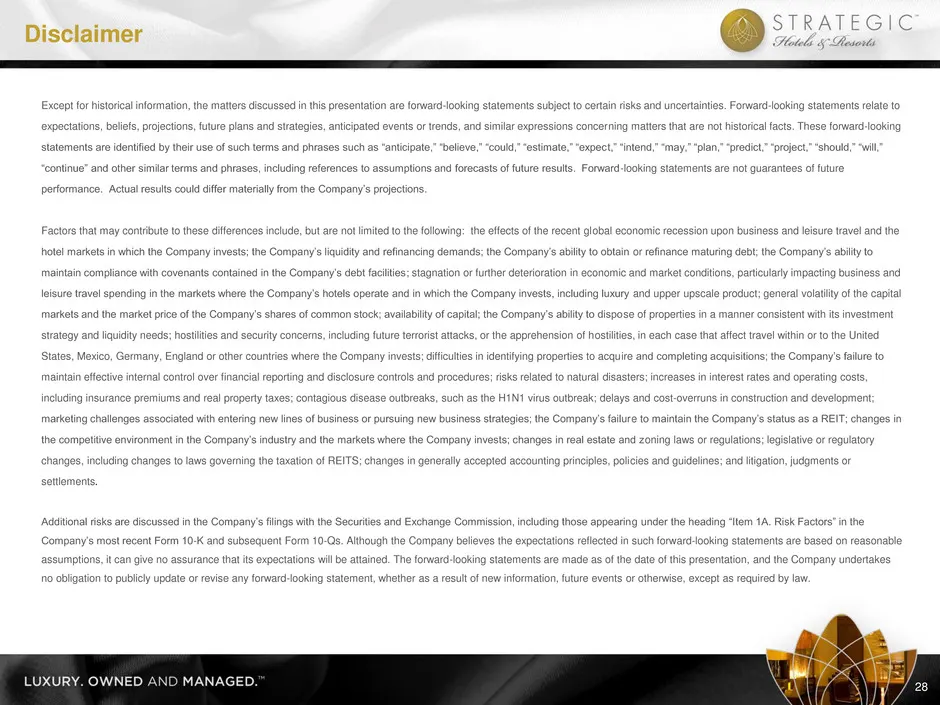
Except for historical information, the matters discussed in this presentation are forward-looking statements subject to certain risks and uncertainties. Forward-looking statements relate to expectations, beliefs, projections, future plans and strategies, anticipated events or trends, and similar exp
Slide 30: Non-GAAP to GAAP Reconciliations
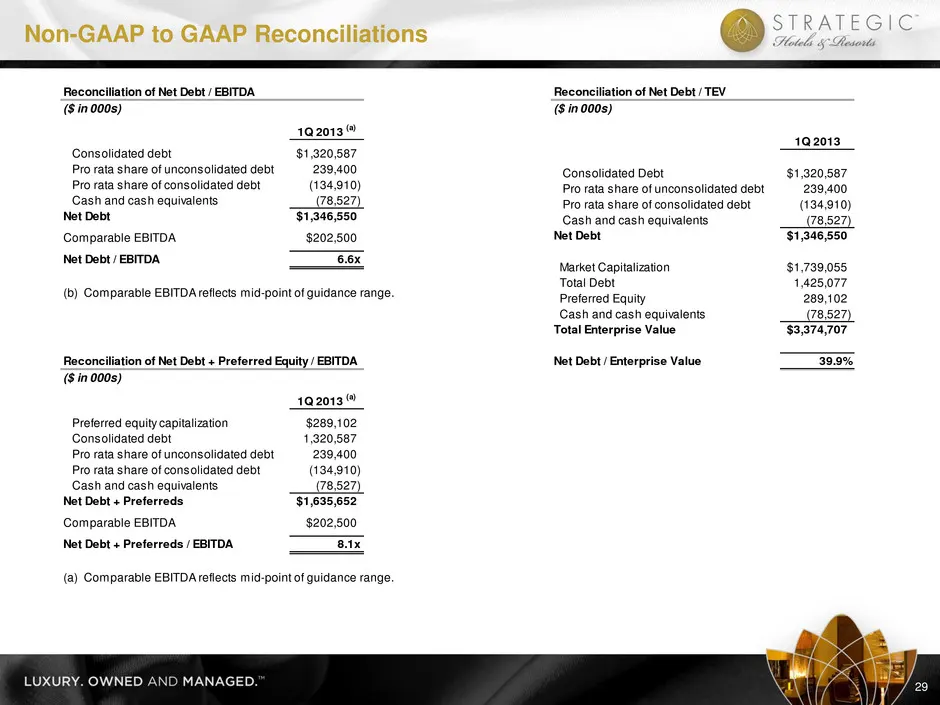
Non-GAAP to GAAP Reconciliations 29 Reconciliation of Net Debt / TEV ($ in 000s) 1Q 2013 Consolidated Debt $1,320,587 Pro rata share of unconsolidated debt 239,400 Pro rata share of consolidated debt (134,910) Cash and cash equivalents (78,527) Net Debt $1,346,550 Market Capitalization $1,739,055 To
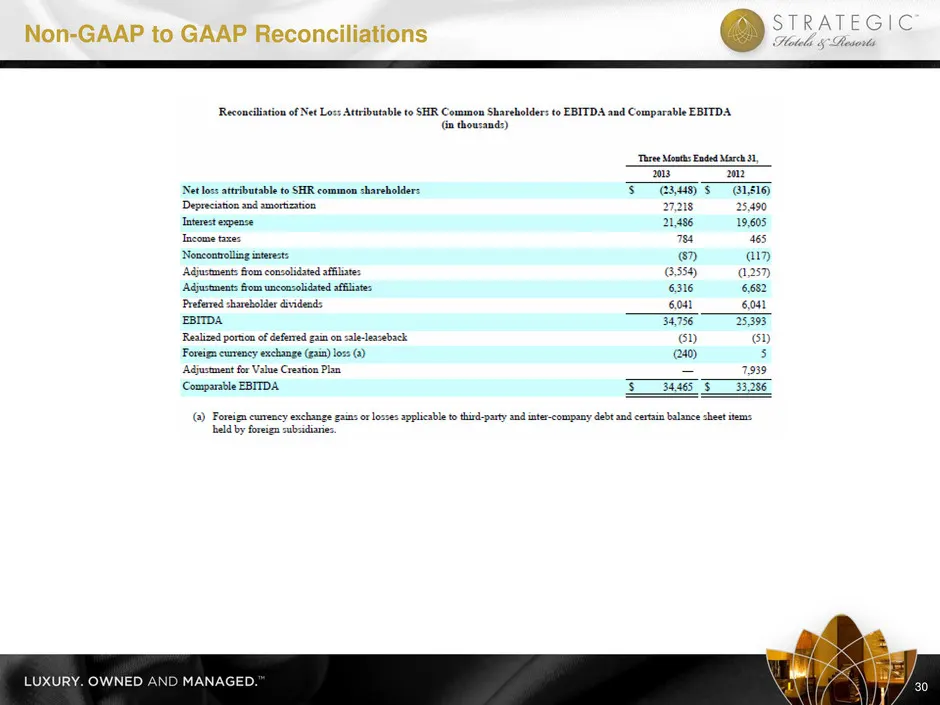
Slide 31: Non-GAAP to GAAP Reconciliations
Non-GAAP to GAAP Reconciliations 30
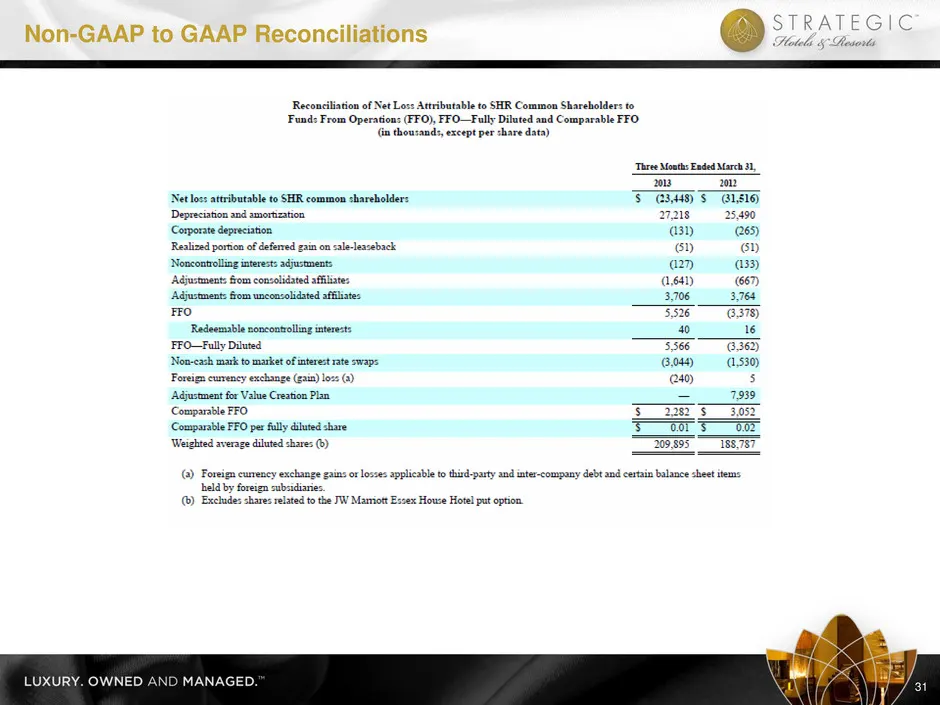
Slide 32: Non-GAAP to GAAP Reconciliations
Non-GAAP to GAAP Reconciliations 31
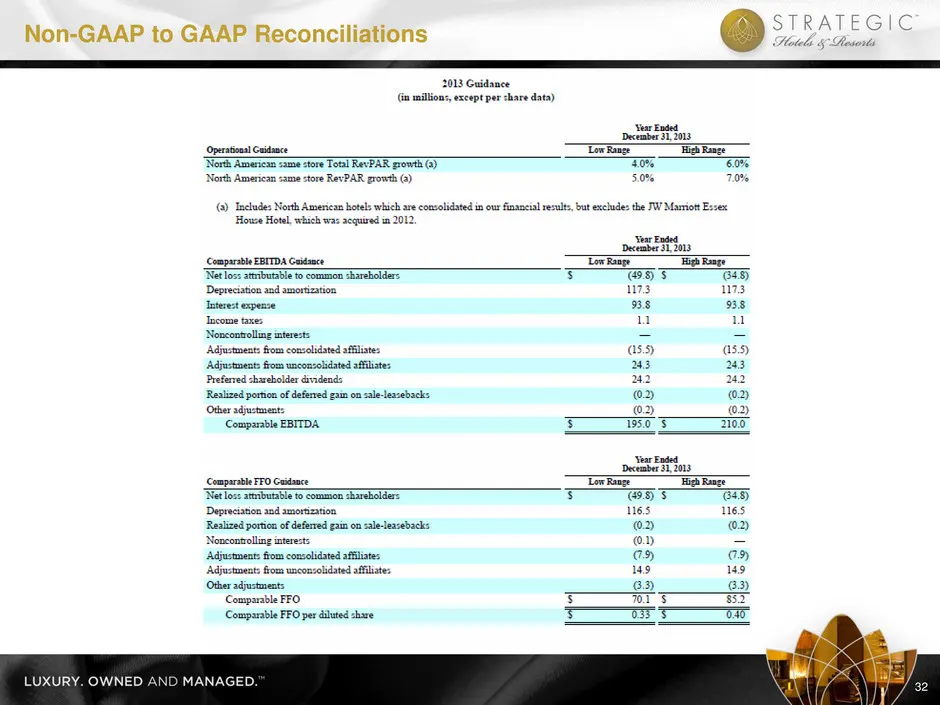
Slide 33: Non-GAAP to GAAP Reconciliations
Non-GAAP to GAAP Reconciliations 32

Slide 34: Thank You
33 Thank You
Source: SEC EDGAR · 8-K filed May 14, 2013
More decks from Strategic Hotels and Resorts Inc
 Investor Presentation (June 2015)43 slides · Jun 1, 2015
 Investor Presentation (February 2015)43 slides · Feb 24, 2015
 Investor Presentation (January 2015)44 slides · Jan 26, 2015
 Investor Presentation (November 2014)50 slides · Nov 5, 2014
 Investor Presentation (October 2014)50 slides · Oct 3, 2014
 Investor Day (September 2014)67 slides · Sep 22, 2014