Strategic Hotels and Resorts Inc
Strategic Hotels and Resorts — Investor Day (September 2014)
67 slides from Strategic Hotels and Resorts's investor day presentation, Sep 22, 2014

Slide 1: Investor Day September 22nd, 2014
Investor Day September 22nd, 2014
Slide 2: Forward-looking statements
Except for historical information, the matters discussed in this presentation are forward-looking statements subject to certain risks and uncertainties. Forward-looking statements relate to expectations, beliefs, projections, future plans and strategies, anticipated events or trends, and similar exp
Slide 3: Today's Agenda
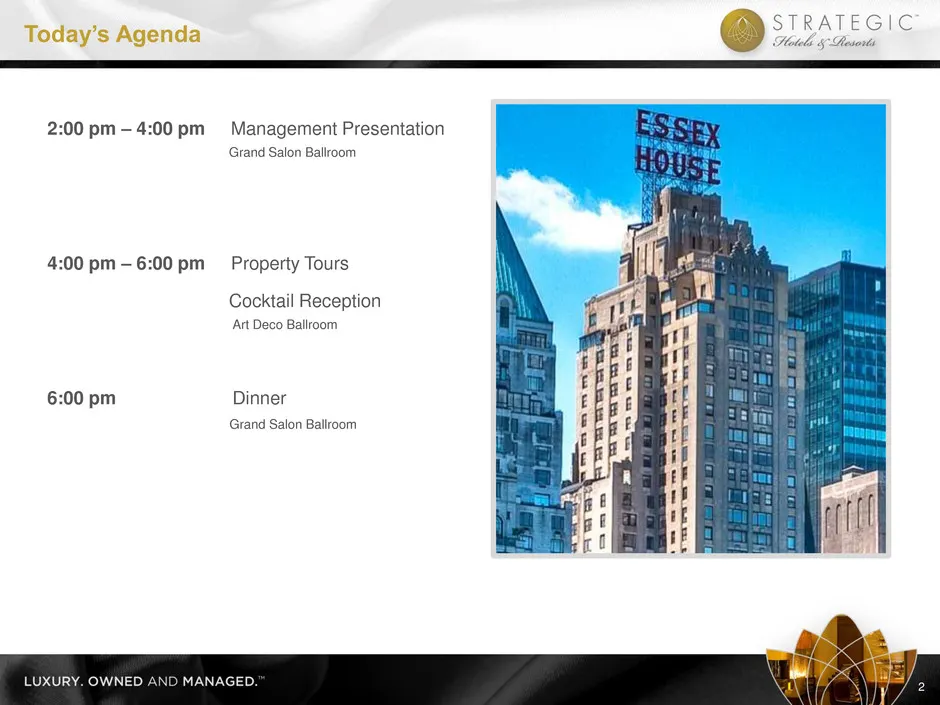
2:00 pm – 4:00 pm Management Presentation Grand Salon Ballroom 4:00 pm – 6:00 pm Property Tours Cocktail Reception Art Deco Ballroom 6:00 pm Dinner Grand Salon Ballroom Today’s Agenda 2
Slide 4: Company Overview
I. Company Overview II. World Class Portfolio III. Industry Update IV. Acquisition Strategy V. Financial Overview VI. Asset Management Expertise VII. Q&A VIII. JW Marriott Essex House Introduction Company Overview
Slide 5: BEE's Leadership Team
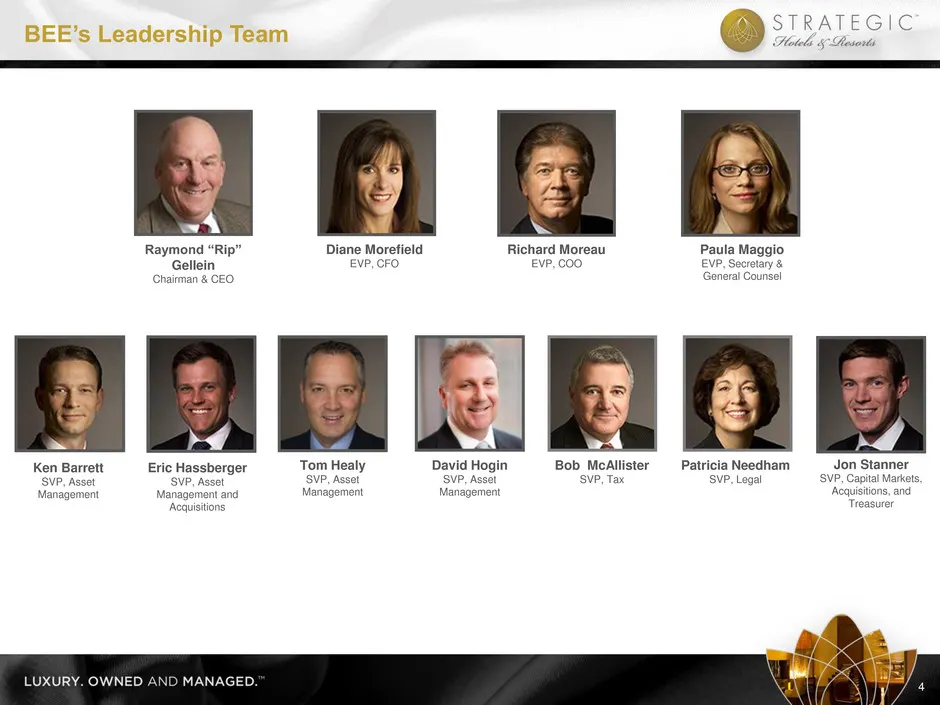
4 BEE’s Leadership Team Raymond “Rip” Gellein Chairman & CEO Diane Morefield EVP, CFO Richard Moreau EVP, COO Paula Maggio EVP, Secretary & General Counsel David Hogin SVP, Asset Management Tom Healy SVP, Asset Management Ken Barrett SVP, Asset Management Jon Stanner SVP, Capital Markets, Acquisitio
Slide 6: BEE's Strategy to Drive Shareholder Value
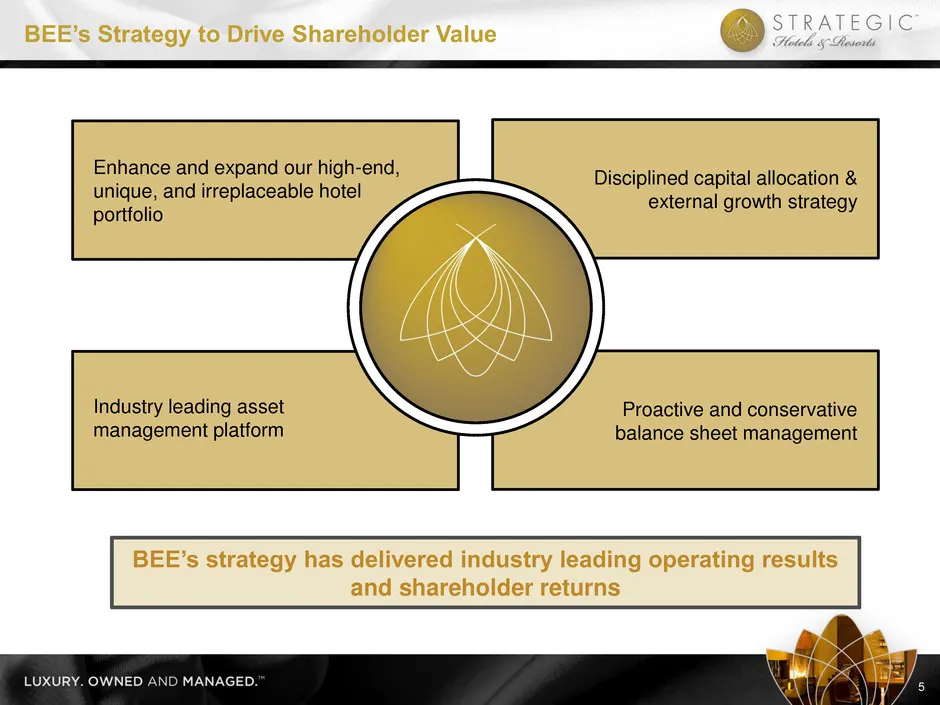
5 BEE’s Strategy to Drive Shareholder Value Disciplined capital allocation & external growth strategy Enhance and expand our high-end, unique, and irreplaceable hotel portfolio Proactive and conservative balance sheet management Industry leading asset management platform BEE’s strategy has delivered
Slide 7: World Class Portfolio
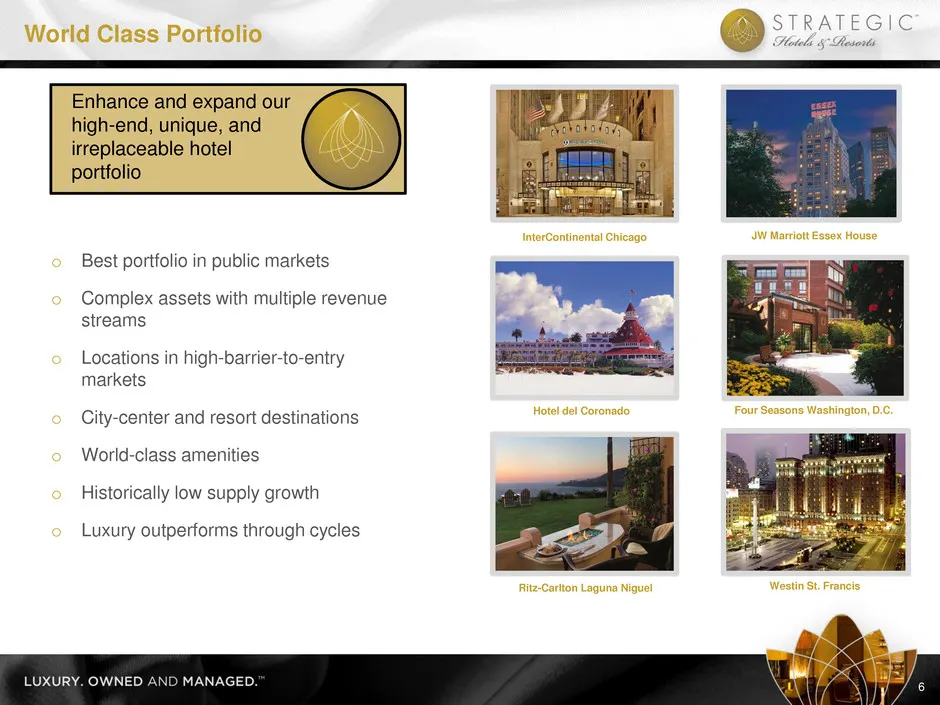
World Class Portfolio 6 Enhance and expand our high-end, unique, and irreplaceable hotel portfolio o Best portfolio in public markets o Complex assets with multiple revenue streams o Locations in high-barrier-to-entry markets o City-center and resort destinations o World-class amenities o Historical
Slide 8: Industry Leading Asset Management Platform
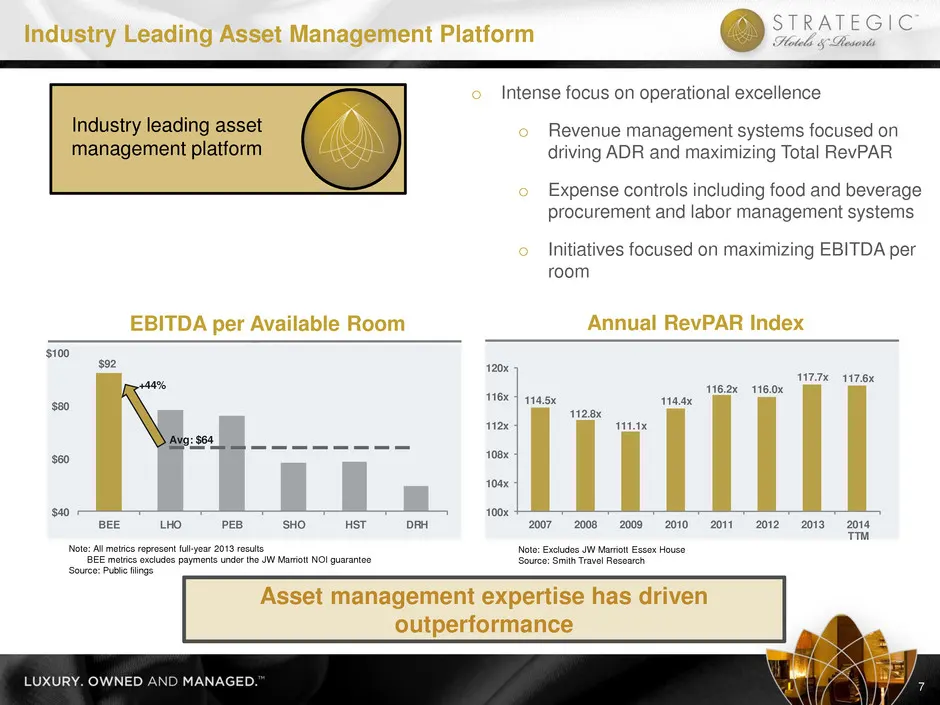
114.5x 112.8x 111.1x 114.4x 116.2x 116.0x 117.7x 117.6x 100x 104x 108x 112x 116x 120x 2007 2008 2009 2010 2011 2012 2013 2014 TTM $92 $40 $60 $80 $100 BEE LHO PEB SHO HST DRH +44% Avg: $64 o Intense focus on operational excellence o Revenue management systems focused on driving ADR and maximizing To
Slide 9: Disciplined Capital Allocation & Growth
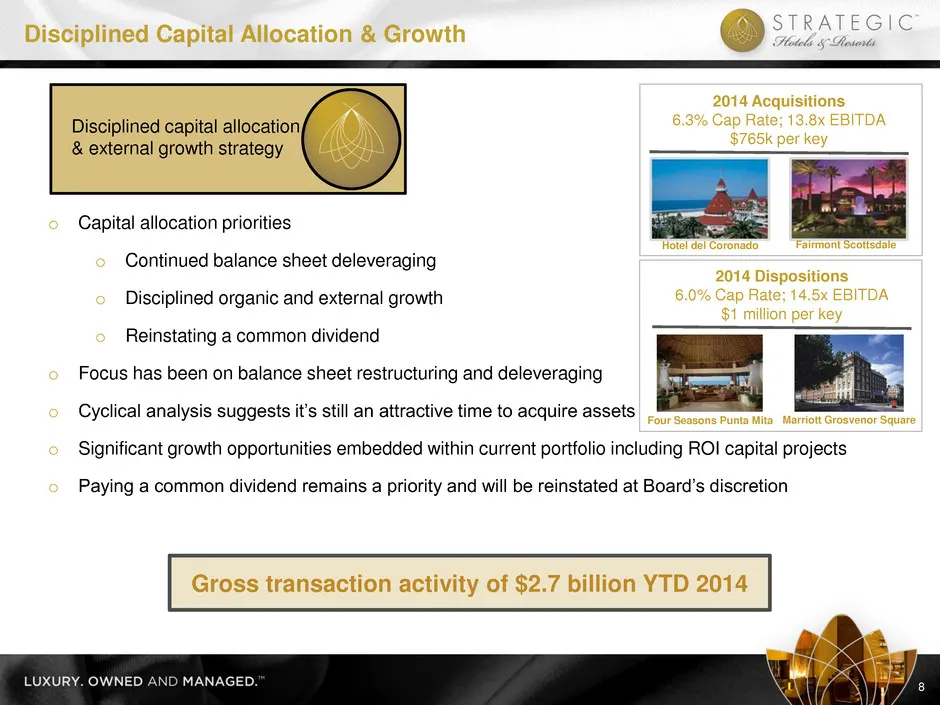
Disciplined Capital Allocation & Growth 8 Disciplined capital allocation & external growth strategy o Capital allocation priorities o Continued balance sheet deleveraging o Disciplined organic and external growth o Reinstating a common dividend o Focus has been on balance sheet restructuring and del
Slide 10: Balance Sheet Management
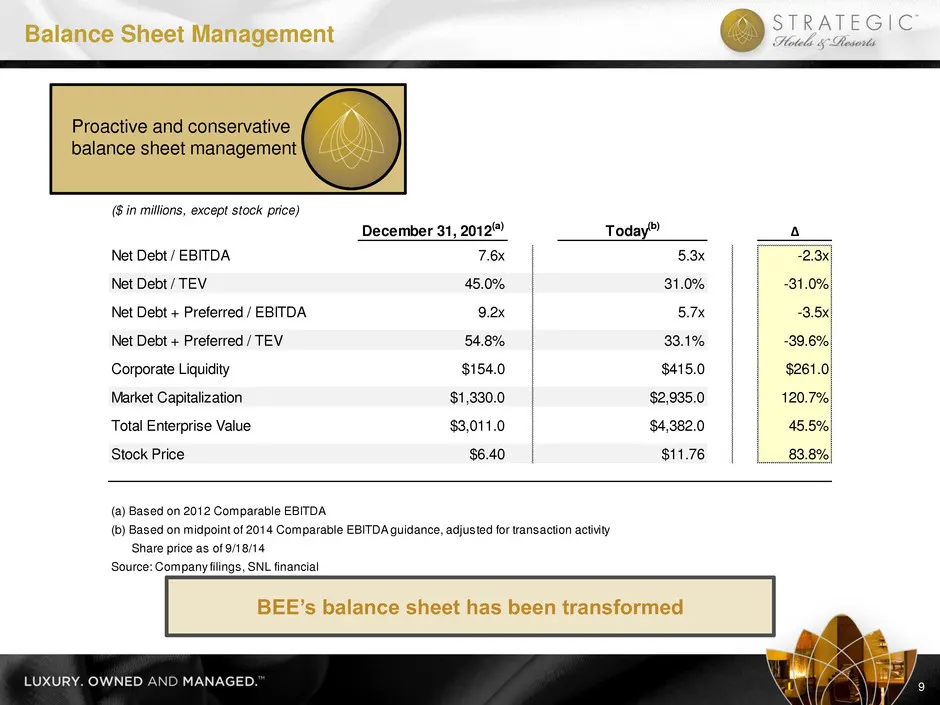
Balance Sheet Management 9 BEE’s balance sheet has been transformed Proactive and conservative balance sheet management ($ in millions, except stock price) December 31, 2012(a) Today(b) ∆ Net Debt / EBITDA 7.6x 5.3x -2.3x Net Debt / TEV 45.0% 31.0% -31.0% Net Debt + Preferred / EBITDA 9.2x 5.7x -3.5
Slide 11: BEE's Consistent Outperformance
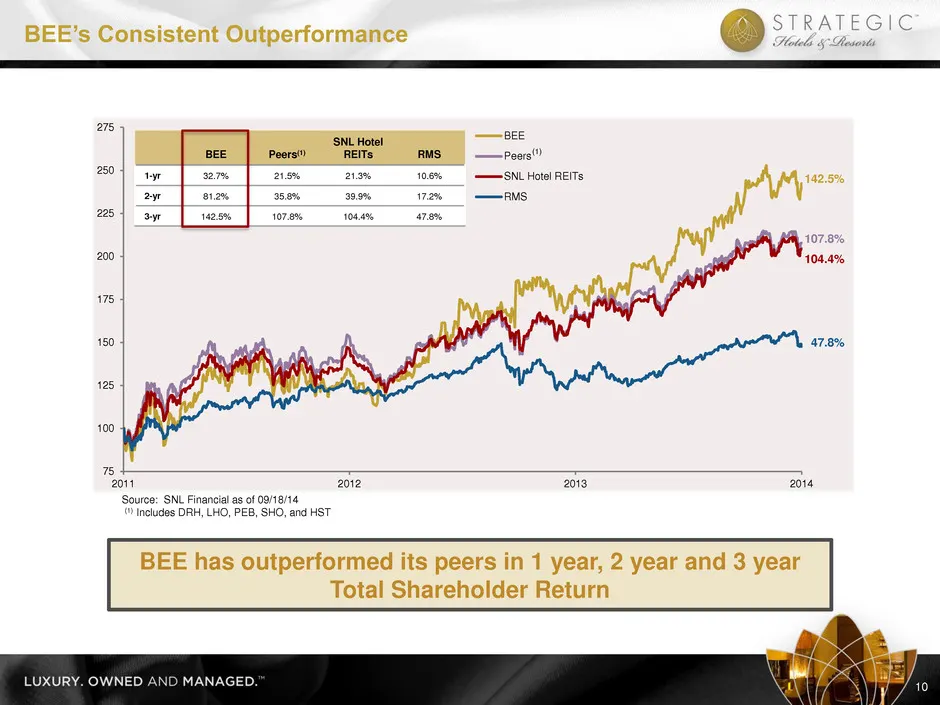
10 BEE’s Consistent Outperformance 75 100 125 150 175 200 225 250 275 2011 2012 2013 2014 BEE Peers SNL Hotel REITs RMS 142.5% 107.8% BEE Peers(1) SNL Hotel REITs RMS 1-yr 32.7% 21.5% 21.3% 10.6% 2-yr 81.2% 35.8% 39.9% 17.2% 3-yr 142.5% 107.8% 104.4% 47.8% Source: SNL Financial as of 09/18/14 (1) In

Slide 12: World Class Portfolio
I. Company Overview II. World Class Portfolio III. Industry Update IV. Acquisition Strategy V. Financial Overview VI. Asset Management Expertise VII. Q&A VIII. JW Marriott Essex House Introduction World Class Portfolio

Slide 13: High-End, Unique & Irreplaceable Portfolio
o Unique portfolio of luxury and upper upscale hotels in public markets o Locations in high-barrier-to-entry urban and resort markets with limited supply growth o Complex hotels with multiple revenue streams managed as mixed-use assets o World-class amenities managed by world-class operators High-En
Slide 14: Exceptional Portfolio of Urban Hotels
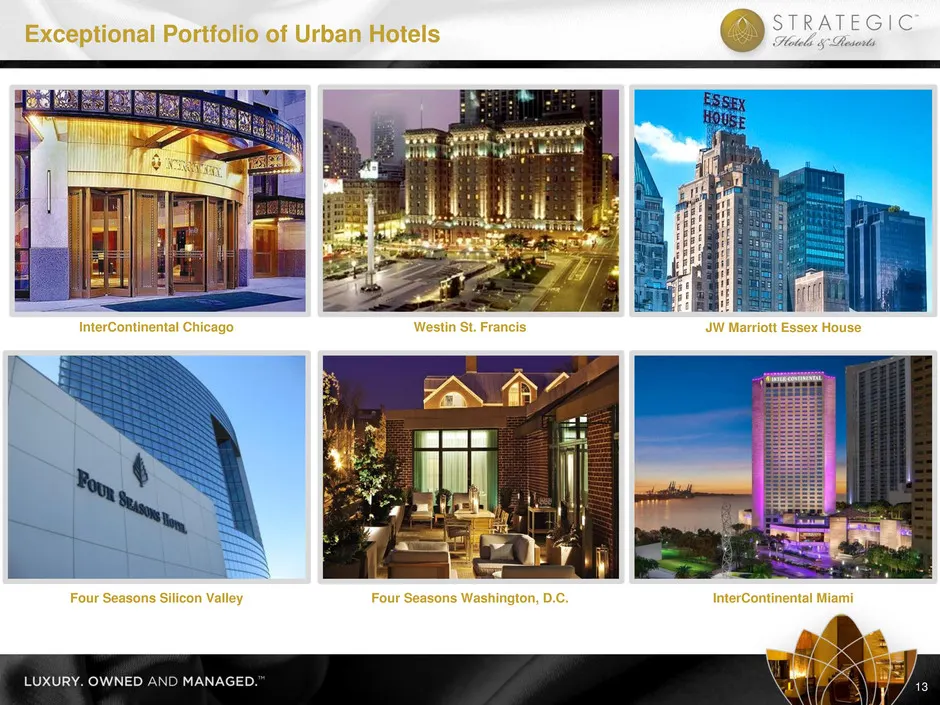
JW Marriott Essex House InterContinental Chicago Westin St. Francis Exceptional Portfolio of Urban Hotels 13 InterContinental Miami Four Seasons Silicon Valley Four Seasons Washington, D.C.
Slide 15: Exceptional Portfolio of Resort Destinations
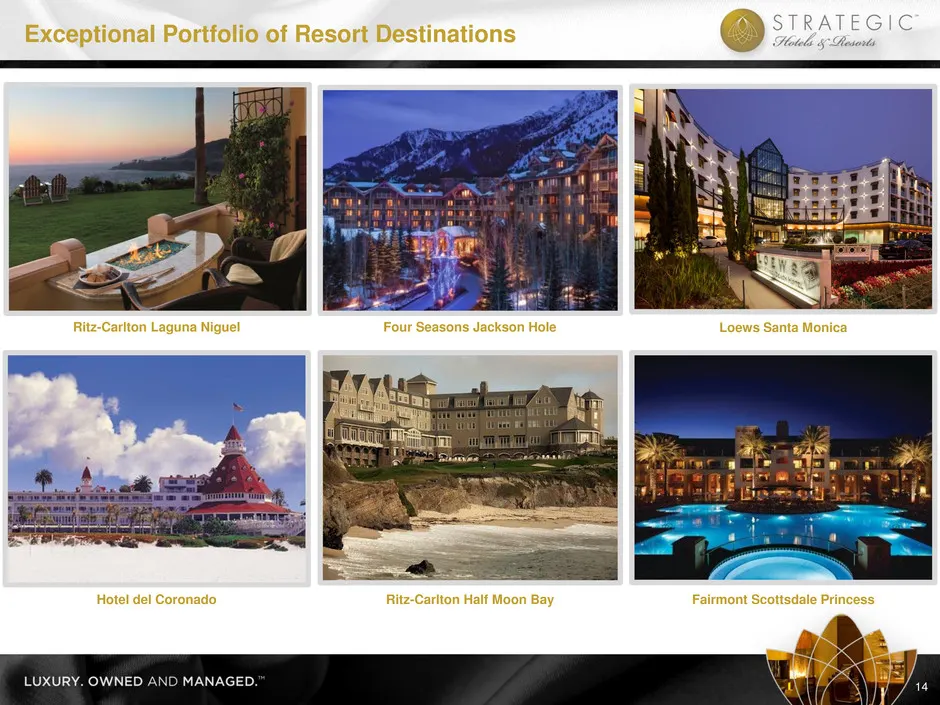
Loews Santa Monica Ritz-Carlton Laguna Niguel Four Seasons Jackson Hole Exceptional Portfolio of Resort Destinations 14 Fairmont Scottsdale Princess Hotel del Coronado Ritz-Carlton Half Moon Bay
Slide 16: Current Portfolio Overview
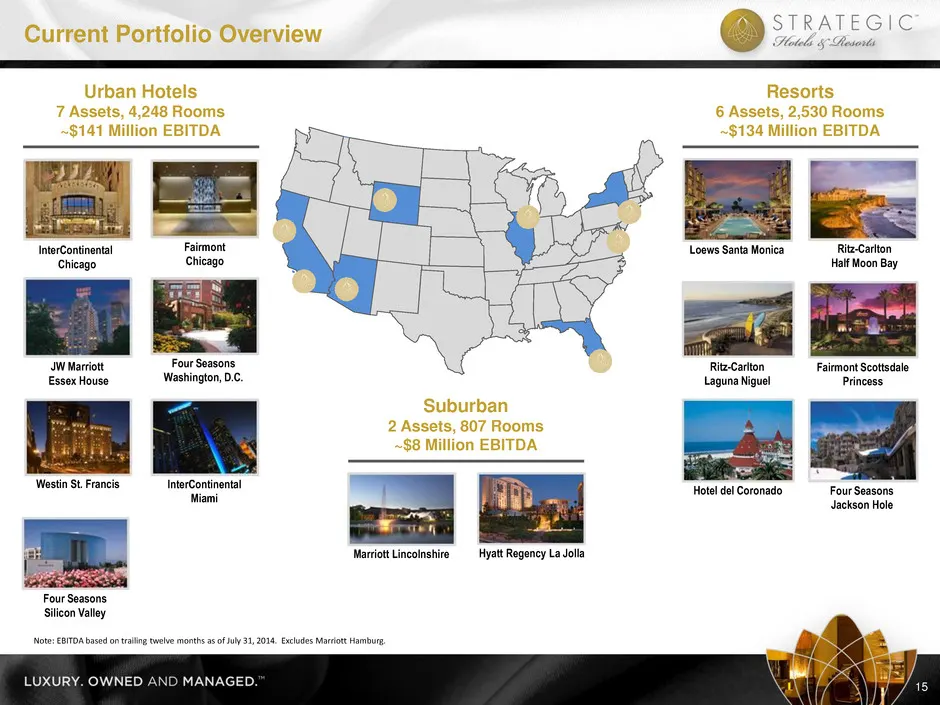
Current Portfolio Overview 15 Westin St. Francis Ritz-Carlton Half Moon Bay Four Seasons Silicon Valley Loews Santa Monica Ritz-Carlton Laguna Niguel Hyatt Regency La Jolla Hotel del Coronado InterContinental Chicago Fairmont Chicago Marriott Lincolnshire Four Seasons Jackson Hole JW Marriott Essex
Slide 17: World-Class Hotels Operated by World-Class Brands
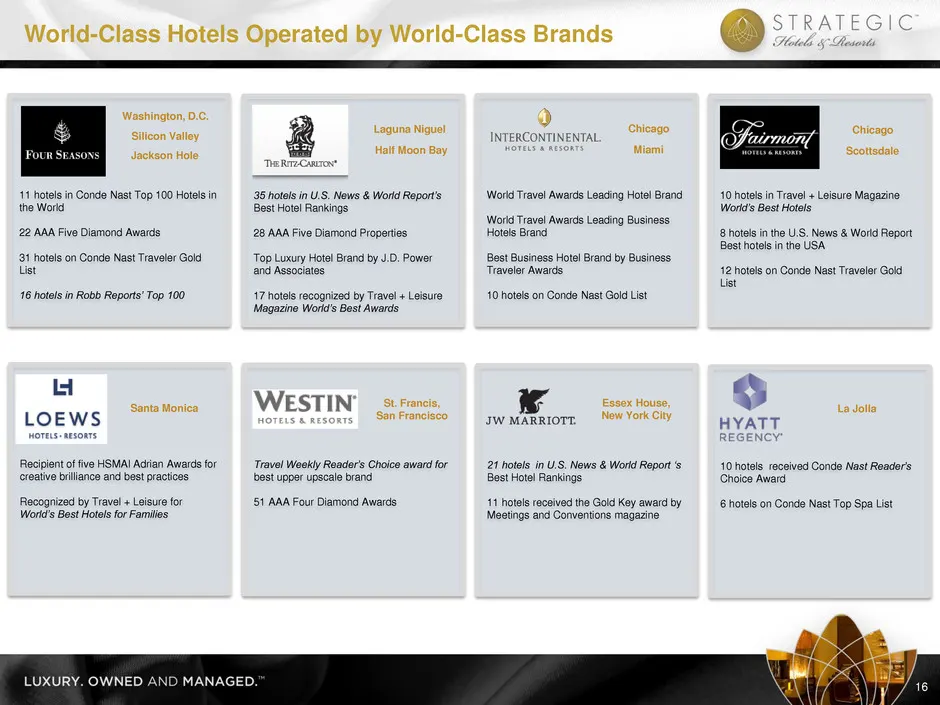
World-Class Hotels Operated by World-Class Brands 16 11 hotels in Conde Nast Top 100 Hotels in the World 22 AAA Five Diamond Awards 31 hotels on Conde Nast Traveler Gold List 16 hotels in Robb Reports’ Top 100 35 hotels in U.S. News & World Report’s Best Hotel Rankings 28 AAA Five Diamond Properties
Slide 18: BEE Revenue Mix Compared to Peers
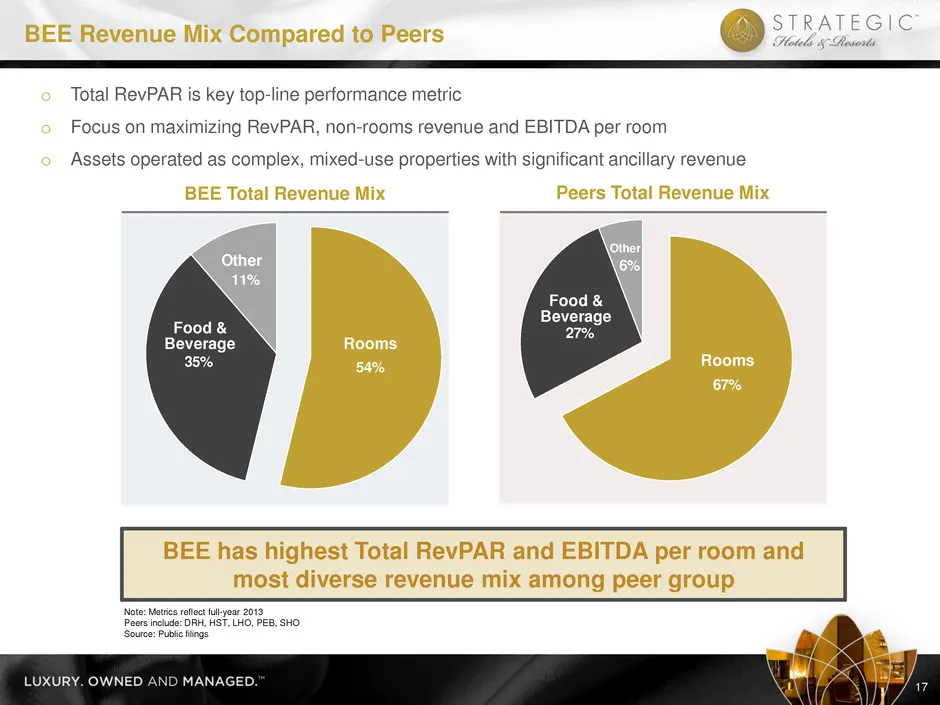
o Total RevPAR is key top-line performance metric o Focus on maximizing RevPAR, non-rooms revenue and EBITDA per room o Assets operated as complex, mixed-use properties with significant ancillary revenue BEE Total Revenue Mix Peers Total Revenue Mix Note: Metrics reflect full-year 2013 Peers include
Slide 19: Measuring Asset Quality
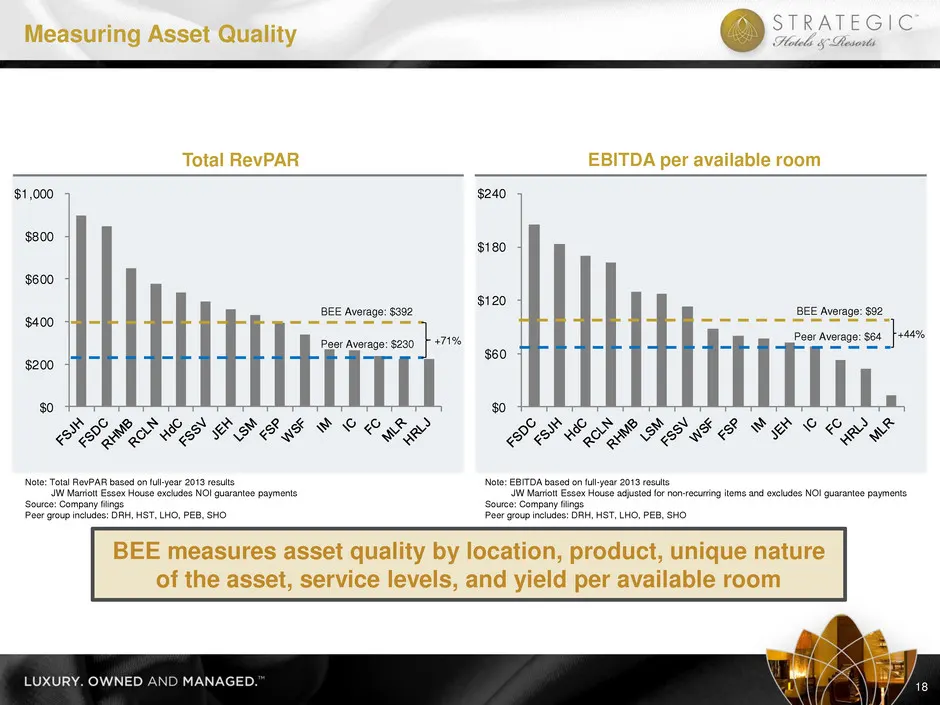
$0 $60 $120 $180 $240 $0 $200 $400 $600 $800 $1,000 EBITDA per available room Total RevPAR Note: Total RevPAR based on full-year 2013 results JW Marriott Essex House excludes NOI guarantee payments Source: Company filings Peer group includes: DRH, HST, LHO, PEB, SHO Measuring Asset Quality 18 BEE me

Slide 20: Industry Update
I. Company Overview II. World Class Portfolio III. Industry Update IV. Acquisition Strategy V. Financial Overview VI. Asset Management Expertise VII. Q&A VIII. JW Marriott Essex House Introduction Industry Update
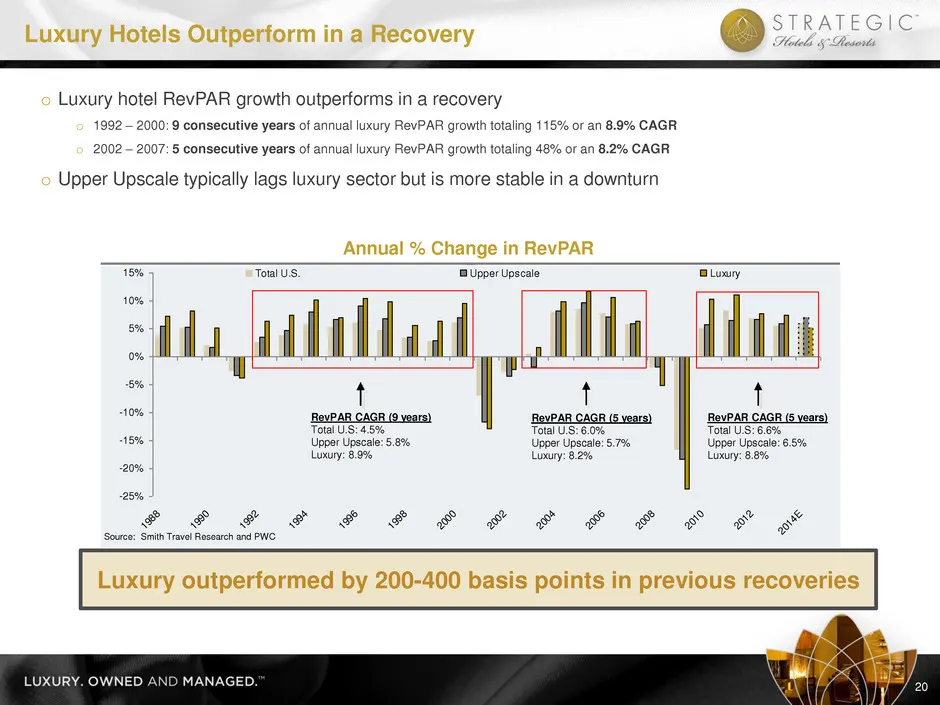
Slide 21: Luxury Hotels Outperform in a Recovery
-25% -20% -15% -10% -5% 0% 5% 10% 15% 198 8 199 0 199 2 199 4 199 6 199 8 200 0 200 2 200 4 200 6 200 8 201 0 201 2 201 4E Total U.S. Upper Upscale Luxury Source: Smith Travel Research and PWC Annual % Change in RevPAR o Luxury hotel RevPAR growth outperforms in a recovery o 1992 – 2000: 9 consecuti
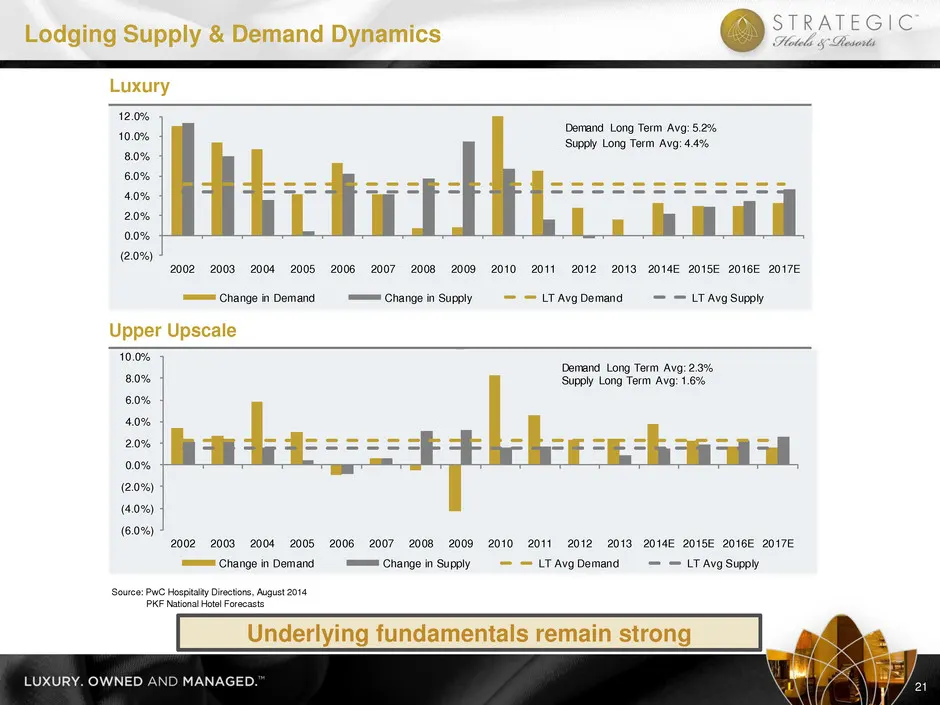
Slide 22: Lodging Supply & Demand Dynamics
Luxury 21 Underlying fundamentals remain strong Lodging Supply & Demand Dynamics Upper Upscale Source: PwC Hospitality Directions, August 2014 KF Nation l Hotel Forecasts (2.0%) 0.0% 2.0% 4.0% 6.0% 8.0% 10.0% 12.0% 2002 2003 2004 2005 2006 2007 2008 2009 2010 2011 2012 2013 2014E 2015E 2016E 2017E C
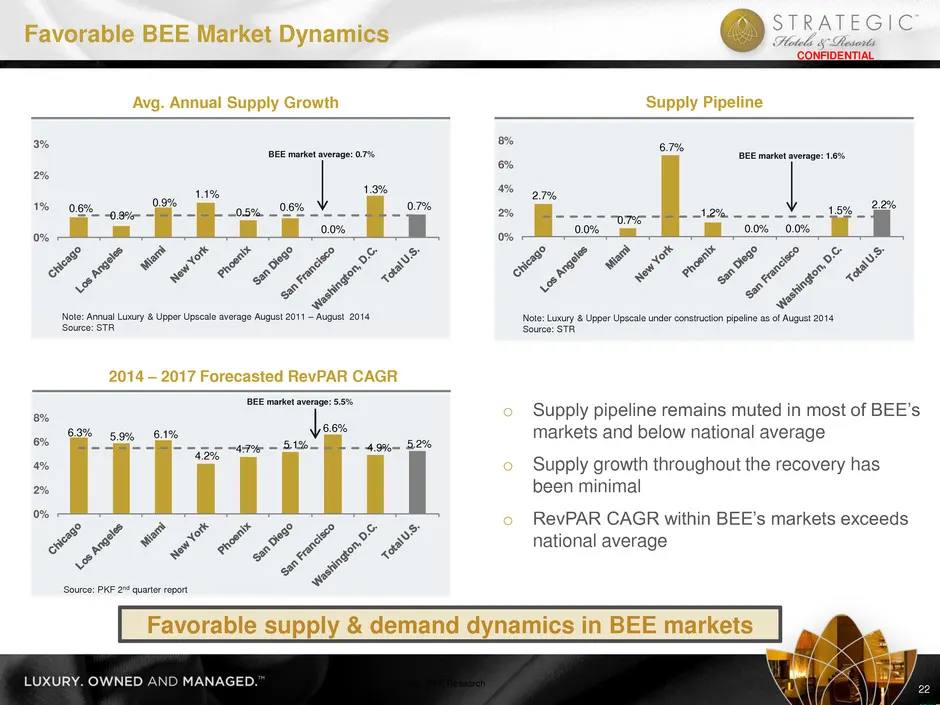
Slide 23: Favorable BEE Market Dynamics
Favorable BEE Market Dynamics CONFIDENTIAL 22 Favorable supply & demand dynamics in BEE markets 2014 – 2017 Forecasted RevPAR CAGR Avg. Annual Supply Growth Supply Pipeline Note: Annual Luxury & Upper Upscale average August 2011 – August 2014 Source: STR Note: Luxury & Upper Upscale under constructi
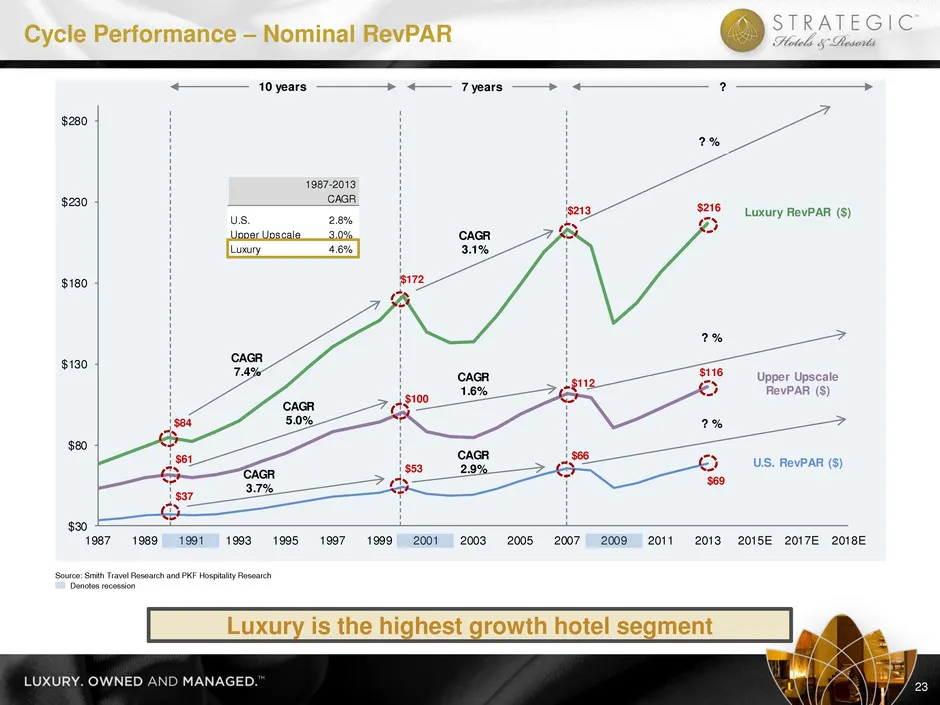
Slide 24: Cycle Performance – Nominal RevPAR
Cycle Performance – Nominal RevPAR 23 Luxury is the highest growth hotel segment Source: Smith Travel Research and PKF Hospitality Research Denotes recession $30 $80 $130 $180 $230 $280 1987 1989 1991 1993 1995 1997 1999 2001 2003 2005 2007 2009 2011 2013 2015E 2017E 2018E 10 years 7 years ? U.S. Re
Slide 25: Lodging Stocks Positioned for Further Growth
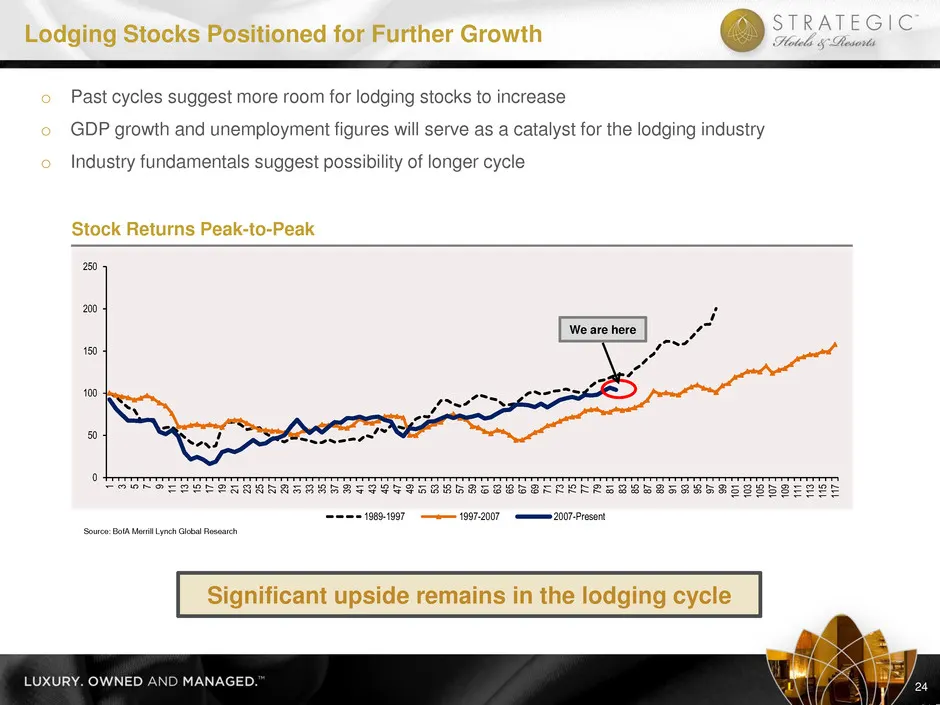
o Past cycles suggest more room for lodging stocks to increase o GDP growth and unemployment figures will serve as a catalyst for the lodging industry o Industry fundamentals suggest possibility of longer cycle Stock Returns Peak-to-Peak Lodging Stocks Positioned for Further Growth 24 Significant up
Slide 26: Commercial Property Pricing Continues to Strengthen
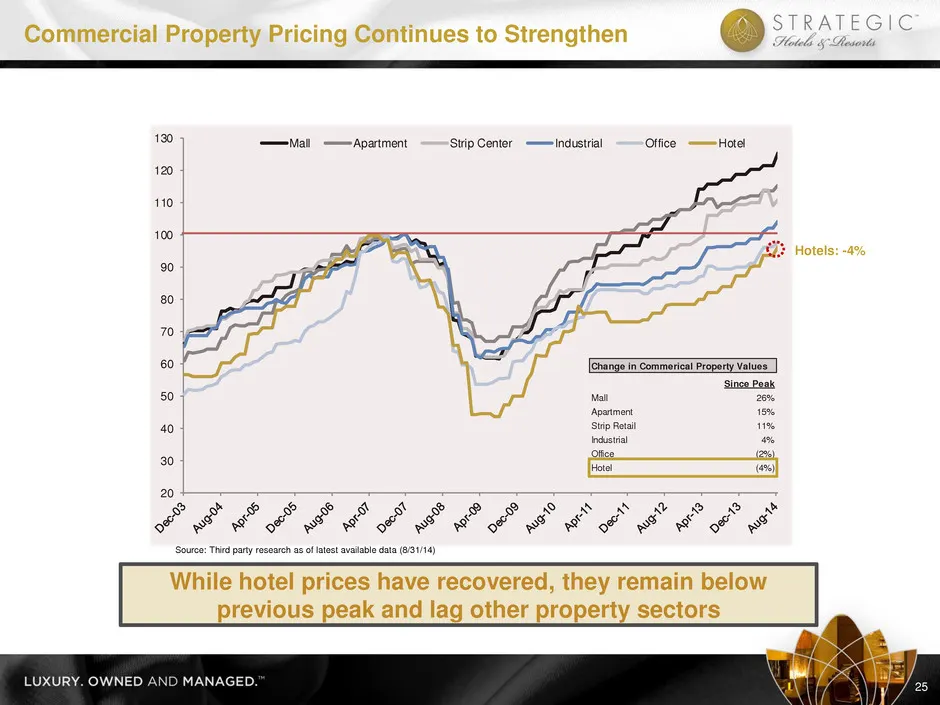
20 30 40 50 60 70 80 90 100 110 120 130 Mall Apartment Strip Center Industrial Office Hotel Commercial Property Pricing Continues to Strengthen 25 Change in Commerical Property Values Since Peak Mall 26% Apartment 15% Strip Retail 11% Industrial 4% Office (2%) Hotel (4%) While hotel prices have reco
Slide 27: Acquisition Strategy
I. Company Overview II. World Class Portfolio III. Industry Update IV. Acquisition Strategy V. Financial Overview VI. Asset Management Expertise VII. Q&A VIII. JW Marriott Essex House Introduction Acquisition Strategy
Slide 28: Acquisition Strategy
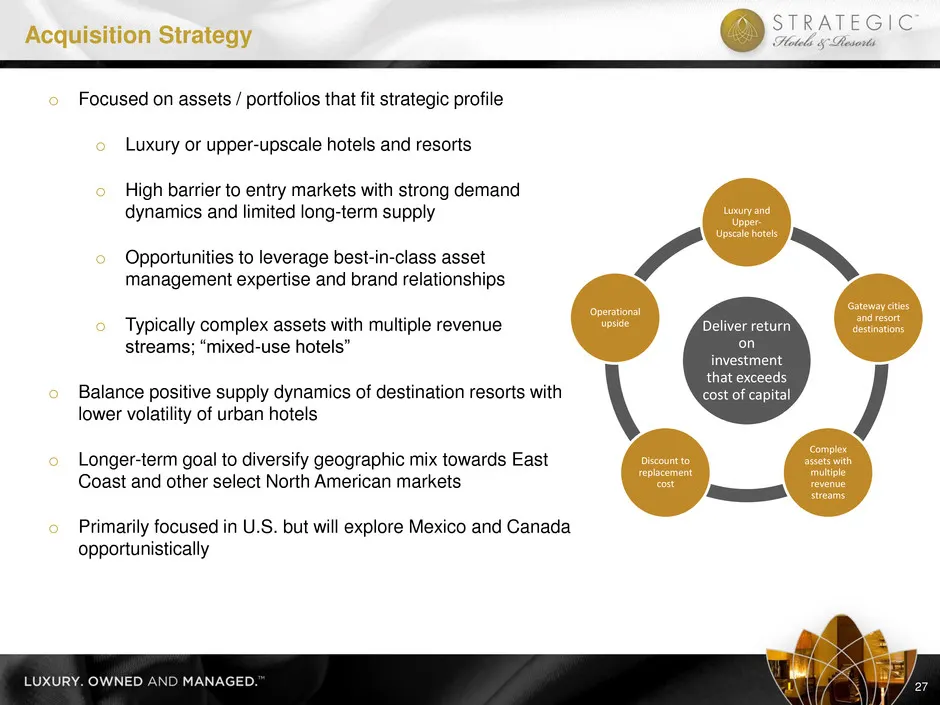
o Focused on assets / portfolios that fit strategic profile o Luxury or upper-upscale hotels and resorts o High barrier to entry markets with strong demand dynamics and limited long-term supply o Opportunities to leverage best-in-class asset management expertise and brand relationships o Typically c
Slide 29: U.S. Urban Hotel Market Priority List
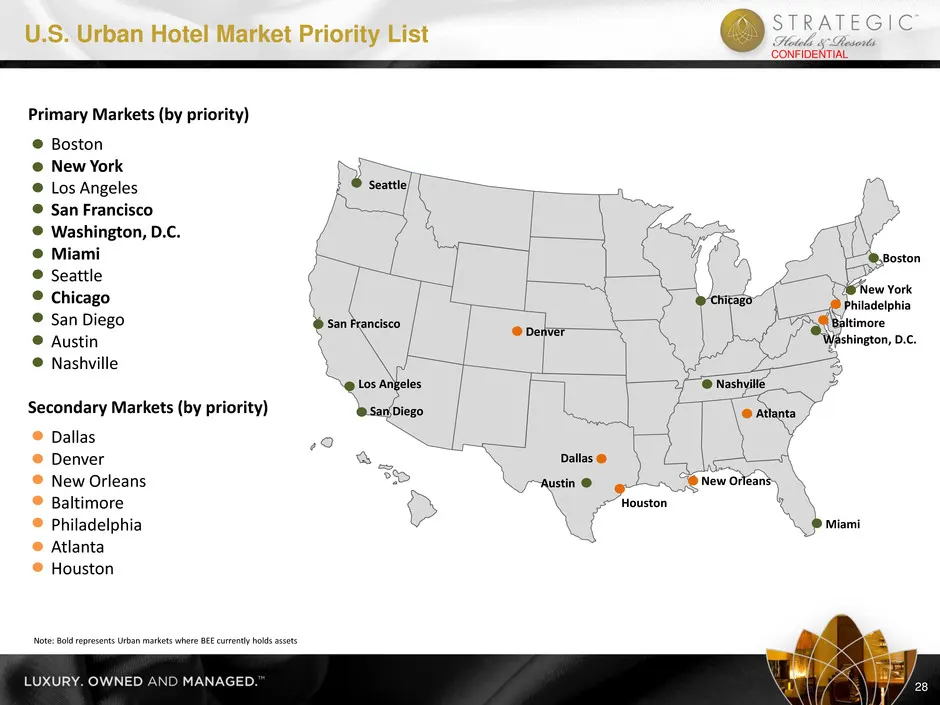
Primary Markets (by priority) Boston New York Los Angeles San Francisco Washington, D.C. Miami Seattle Chicago San Diego Austin Nashville Secondary Markets (by priority) Dallas Denver New Orleans Baltimore Philadelphia Atlanta Houston U.S. Urban Hotel Market Priority List Seattle San Francisco Los A
Slide 30: U.S. Resort Market Priority List
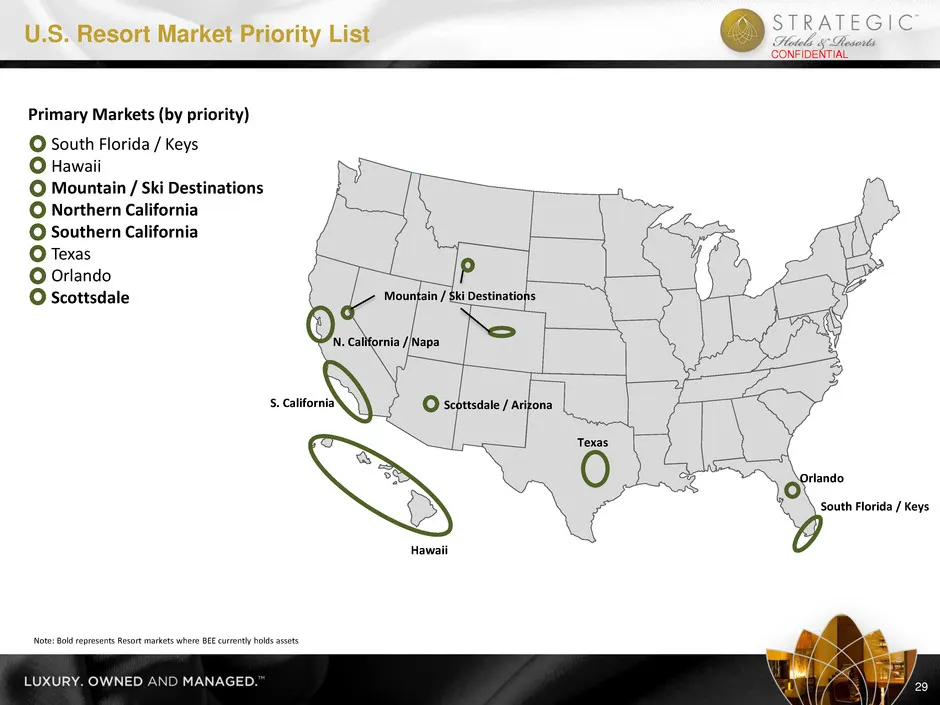
Primary Markets (by priority) South Florida / Keys Hawaii Mountain / Ski Destinations Northern California Southern California Texas Orlando Scottsdale U.S. Resort Market Priority List Scottsdale / Arizona S. California N. California / Napa South Florida / Keys Orlando Mountain / Ski Destinations Tex
Slide 31: Financial Overview
I. Company Overview II. World Class Portfolio III. Industry Update IV. Acquisition Strategy V. Financial Overview VI. Asset Management Expertise VII. Q&A VIII. JW Marriott Essex House Introduction Financial Overview
Slide 32: Successful Balance Sheet Restructuring
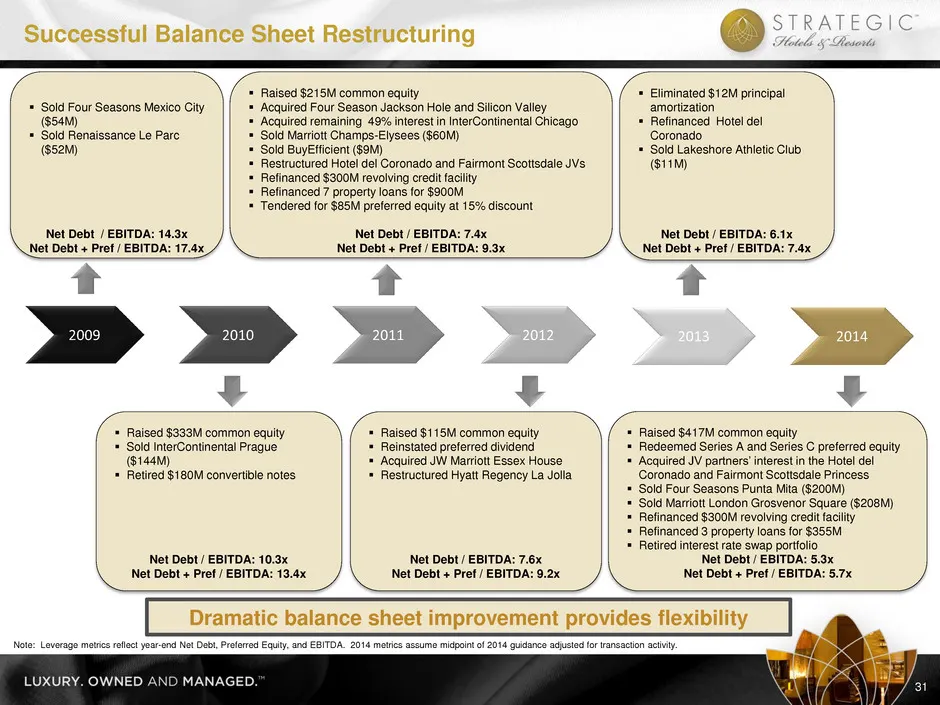
Successful Balance Sheet Restructuring 31 2009 2010 2011 2012 2013 Sold Four Seasons Mexico City ($54M) Sold Renaissance Le Parc ($52M) Net Debt / EBITDA: 14.3x Net Debt + Pref / EBITDA: 17.4x Raised $215M common equity Acquired Four Season Jackson Hole and Silicon Valley Acquired remainin
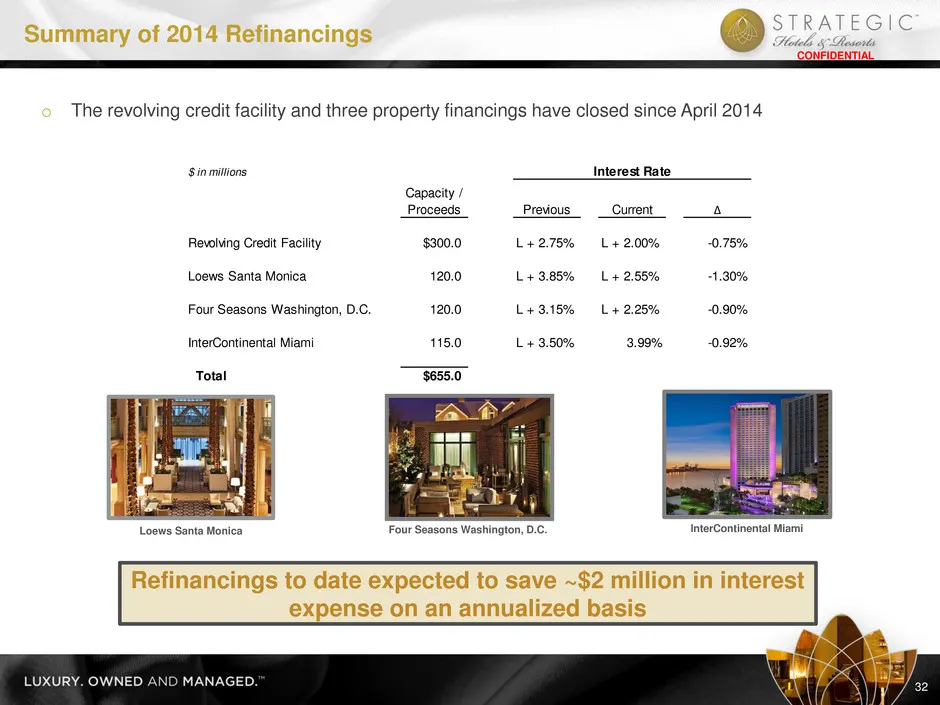
Slide 33: Summary of 2014 Refinancings
Summary of 2014 Refinancings CONFIDENTIAL o The revolving credit facility and three property financings have closed since April 2014 Loews Santa Monica Four Seasons Washington, D.C. InterContinental Miami Refinancings to date expected to save ~$2 million in interest expense on an annualized basis 32
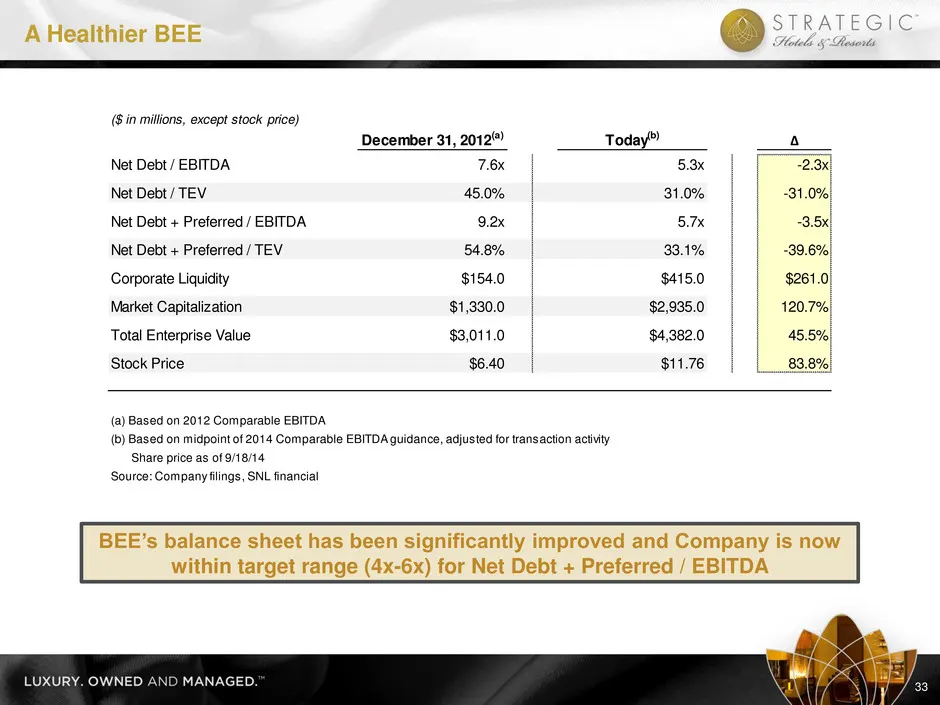
Slide 34: A Healthier BEE
A Healthier BEE 33 BEE’s balance sheet has been significantly improved and Company is now within target range (4x-6x) for Net Debt + Preferred / EBITDA ($ in millions, except stock price) December 31, 2012(a) Today(b) ∆ Net Debt / EBITDA 7.6x 5.3x -2.3x Net Debt / TEV 45.0% 31.0% -31.0% Net Debt + P
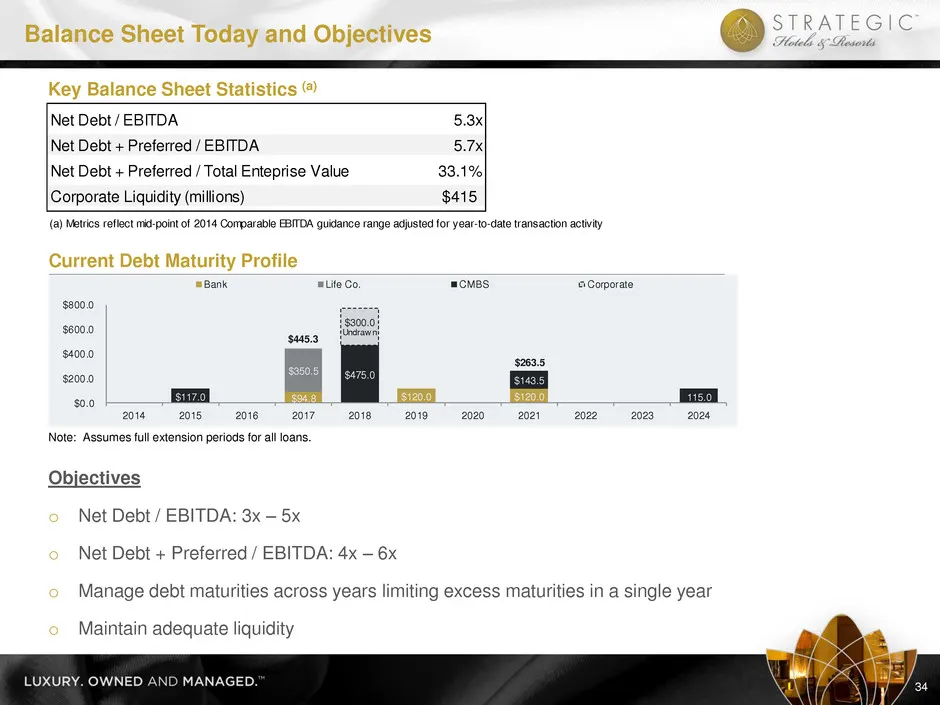
Slide 35: Balance Sheet Today and Objectives
$163.0 Undrawn $137.0 Outstanding $94.8 $120.0 $120.0 $350.5 $117.0 $475.0 $143.5 115.0 $300.0 Undraw n $0.0 $200.0 $400.0 $600.0 $800.0 2014 2015 2016 2017 2018 2019 2020 2021 2022 2023 2024 Bank Life Co. CMBS Corporate $445.3 $263.5 Net Debt / EBITDA 5.3x Net Debt + Preferred / EBITDA 5.7x Net Deb
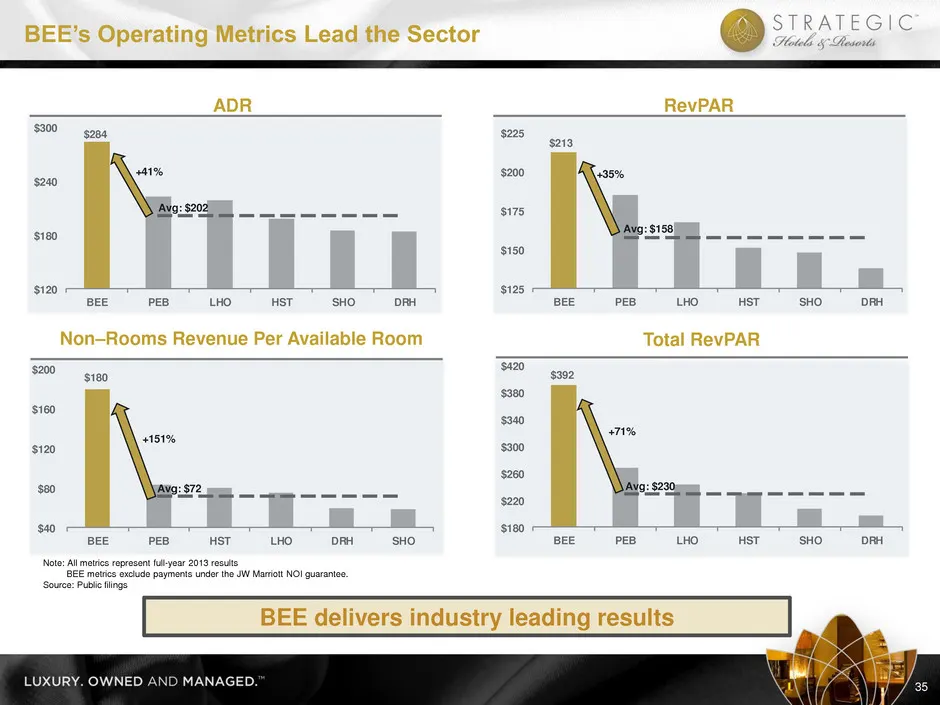
Slide 36: BEE's Operating Metrics Lead the Sector
$392 $180 $220 $260 $300 $340 $380 $420 BEE PEB LHO HST SHO DRH Avg: $230 +71% $180 $40 $80 $120 $160 $200 BEE PEB HST LHO DRH SHO Avg: $72 +151% $213 $125 $150 $175 $200 $225 BEE PEB LHO HST SHO DRH Avg: $158 +35% $284 2 $180 $240 $300 BEE PEB LHO HST SHO DRH Avg: $202 +41% ADR RevPAR Total RevPAR
Slide 37: Significant Outperformance Throughout the Recovery
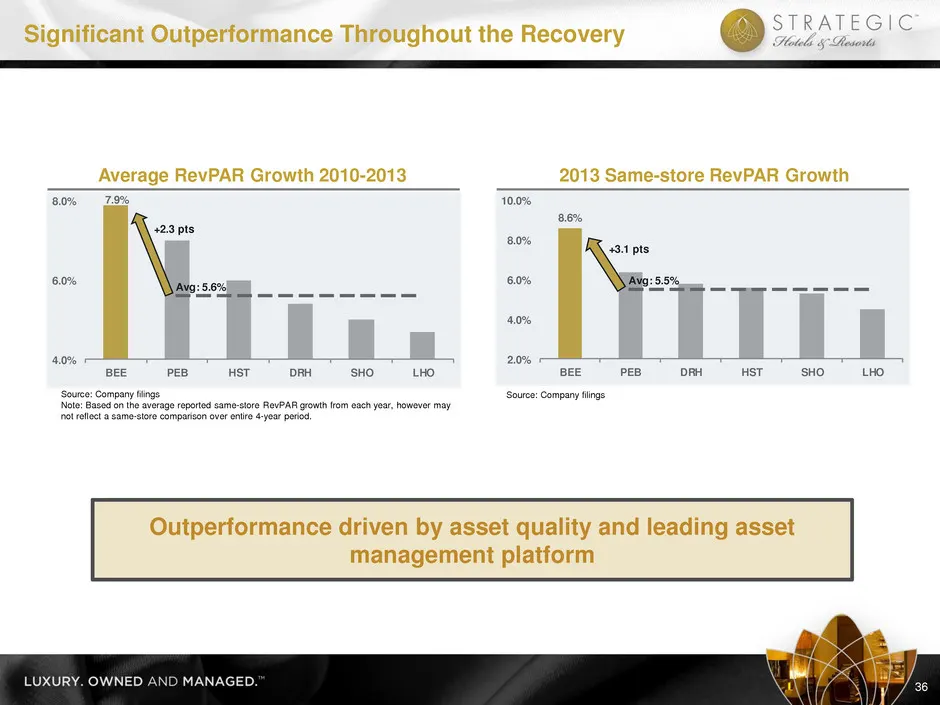
7.9% 4.0% 6.0% 8.0% BEE PEB HST DRH SHO LHO Avg: 5.6% +2.3 pts 8.6% 2.0% 4.0% 6.0% 8.0% 10.0% BEE PEB DRH HST SHO LHO Avg: 5.5% +3.1 pts 36 Significant Outperformance Throughout the Recovery Source: Company filings Note: Based on the average reported same-store RevPAR growth from each year, however
Slide 38: Year-To-Date Results
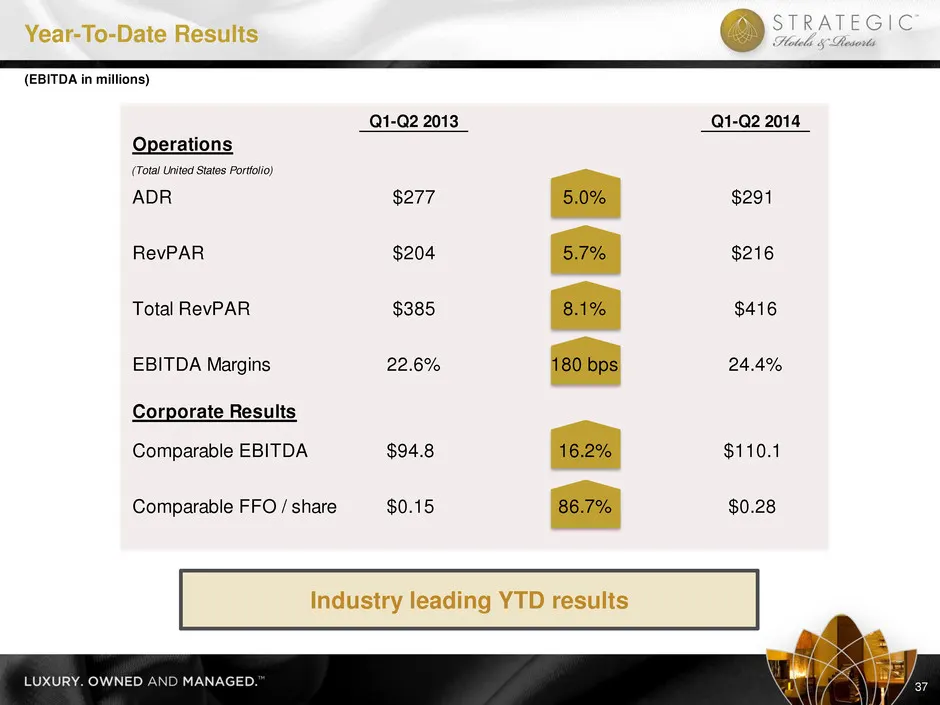
Year-To-Date Results 37 Industry leading YTD results Q1-Q2 2013 Q1-Q2 2014 Operations (Total United States Portfolio) ADR $277 5.0% $291 RevPAR $204 5.7% $216 Total RevPAR $385 8.1% $416 EBITDA Margins 22.6% 180 bps 24.4% Corporate Results Comparable EBITDA $94.8 16.2% $110.1 Comparable FFO / share
Slide 39: 2014 Guidance
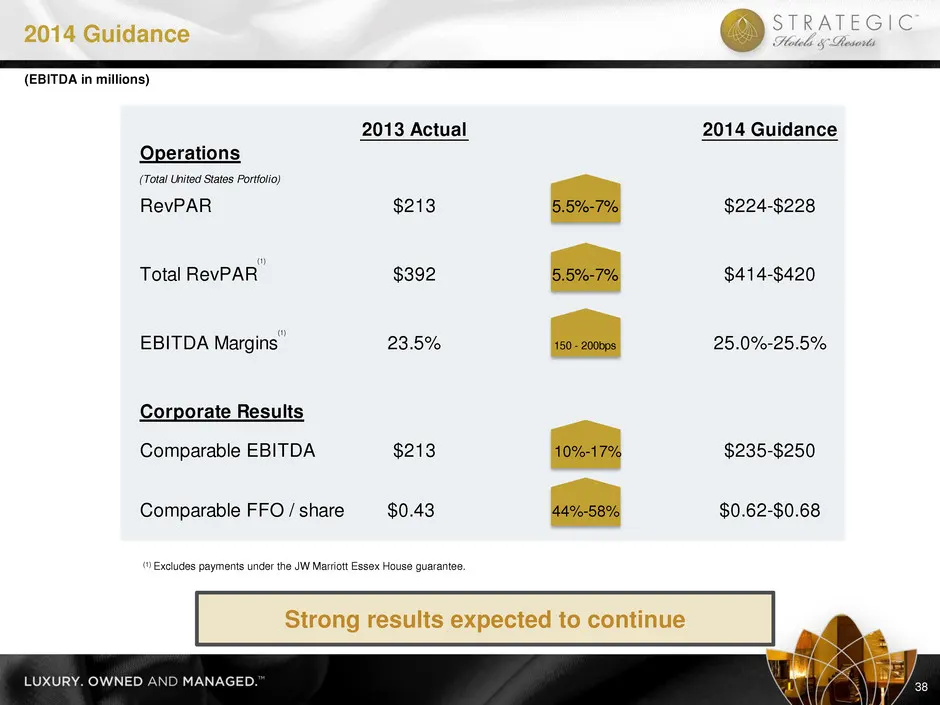
(1) Excludes payments under the JW Marriott Essex House guarantee. 2014 Guidance 38 Strong results expected to continue (1) (1) 2013 Actual 2014 Guidance Operations (Total United States Portfolio) RevPAR $213 5.5%-7% $224-$228 Total RevPAR $392 5.5%-7% $414-$420 EBITDA Margins 23.5% 150 - 200bps 25.

Slide 40: Asset Management Expertise
I. Company Overview II. World Class Portfolio III. Industry Update IV. Acquisition Strategy V. Financial Overview VI. Asset Management Expertise VII. Q&A VIII. JW Marriott Essex House Introduction Asset Management Expertise
Slide 41: Intense Focus on Three Key Principles
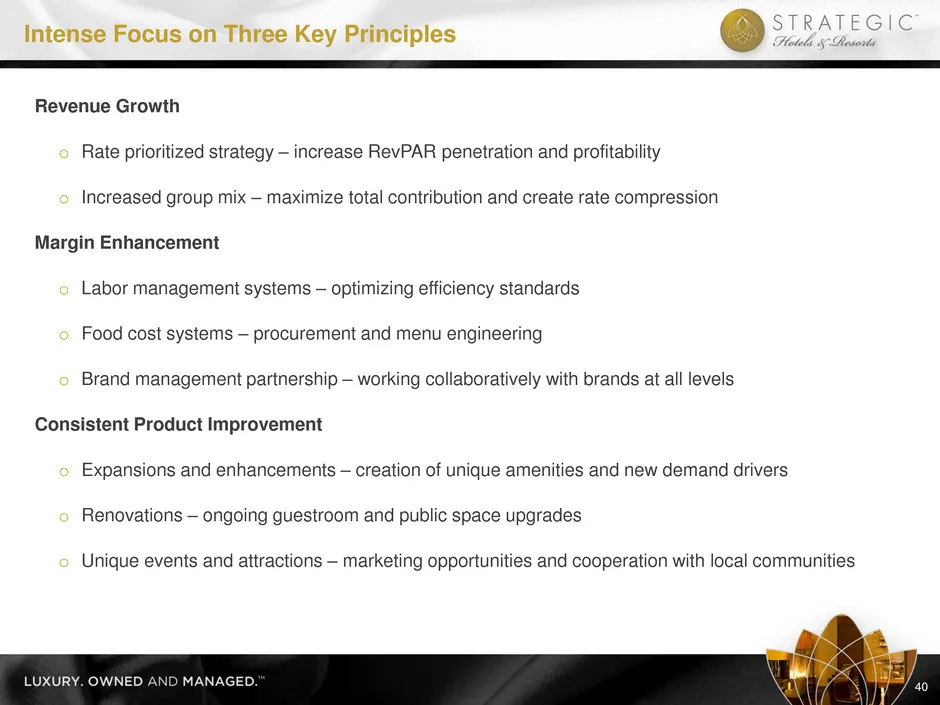
Revenue Growth o Rate prioritized strategy – increase RevPAR penetration and profitability o Increased group mix – maximize total contribution and create rate compression Margin Enhancement o Labor management systems – optimizing efficiency standards o Food cost systems – procurement and menu engine
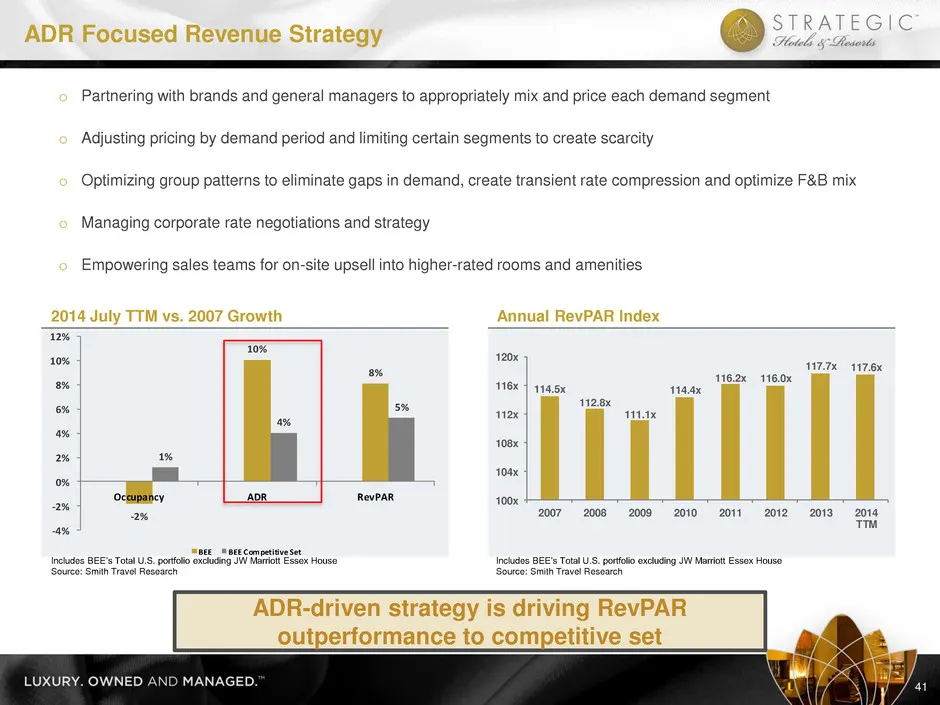
Slide 42: ADR Focused Revenue Strategy
o Partnering with brands and general managers to appropriately mix and price each demand segment o Adjusting pricing by demand period and limiting certain segments to create scarcity o Optimizing group patterns to eliminate gaps in demand, create transient rate compression and optimize F&B mix o Man
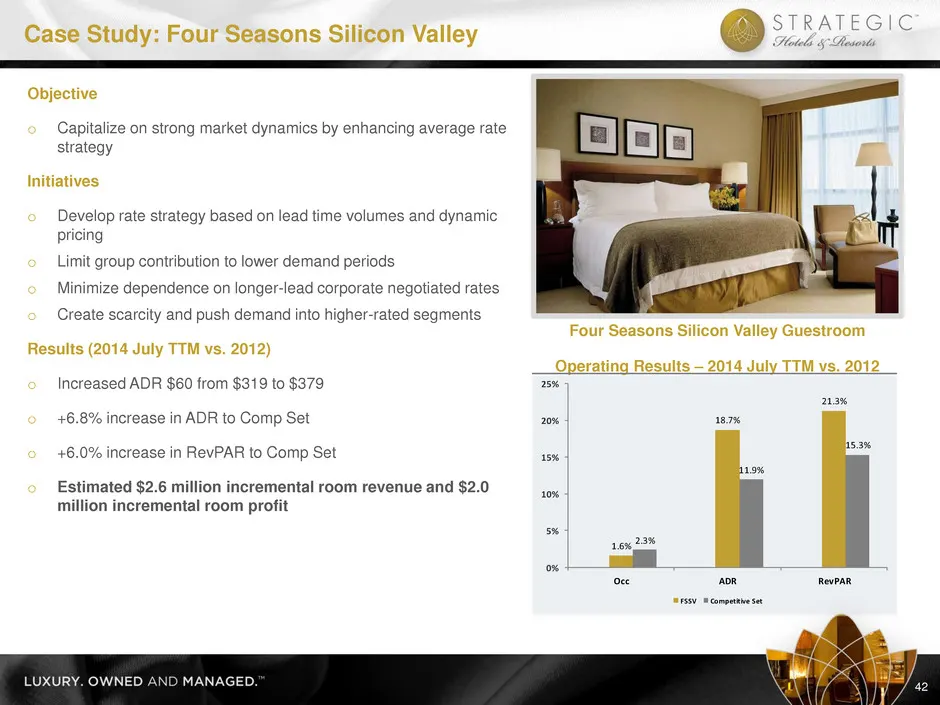
Slide 43: Case Study: Four Seasons Silicon Valley
Case Study: Four Seasons Silicon Valley 42 Objective o Capitalize on strong market dynamics by enhancing average rate strategy Initiatives o Develop rate strategy based on lead time volumes and dynamic pricing o Limit group contribution to lower demand periods o Minimize dependence on longer-lead co
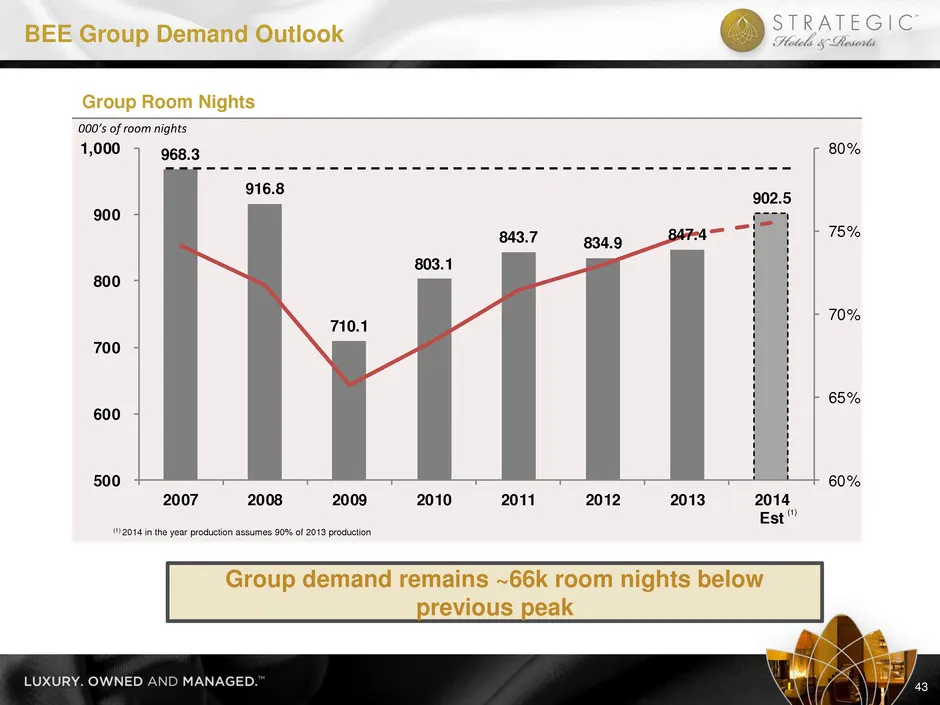
Slide 44: BEE Group Demand Outlook
968.3 916.8 710.1 803.1 843.7 834.9 847.4 902.5 60% 65% 70% 75% 80% 500 600 700 800 900 1,000 2007 2008 2009 2010 2011 2012 2013 2014 Est (1) 2014 in the year production assumes 90% of 2013 production BEE Group Demand Outlook 43 (1) Group demand remains ~66k room nights below previous peak 000’s of
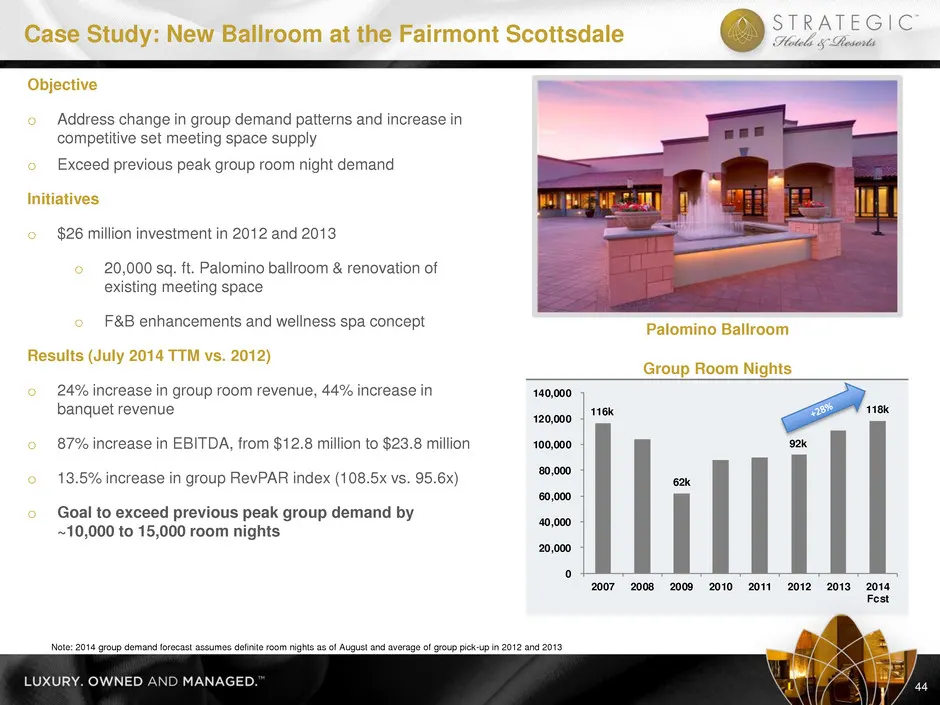
Slide 45: Case Study: New Ballroom at the Fairmont Scottsdale
0 20,000 40,000 60,000 80,000 100,000 120,000 140,000 2007 2008 2009 2010 2011 2012 2013 2014 Fcst Case Study: New Ballroom at the Fairmont Scottsdale 44 Objective o Address change in group demand patterns and increase in competitive set meeting space supply o Exceed previous peak group room night d
Slide 46: Maximizing Out-of-Room Spend
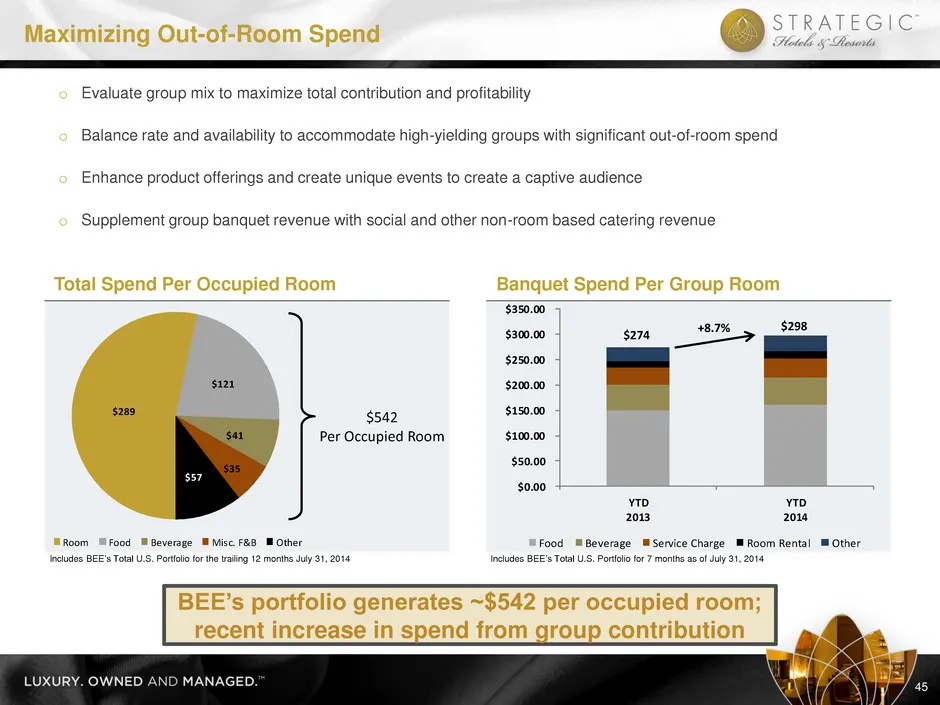
$0.00 $50.00 $100.00 $150.00 $200.00 $250.00 $300.00 $350.00 YTD 2013 YTD 2014 Food Beverage Service Charge Room Rental Other $289 $121 $41 $35 $57 Room Food Beverage Misc. F&B Oth r Maximizing Out-of-Room Spend 45 o Evaluate group mix to maximize total contribution and profitability o Balance rate
Slide 47: Labor Management Systems
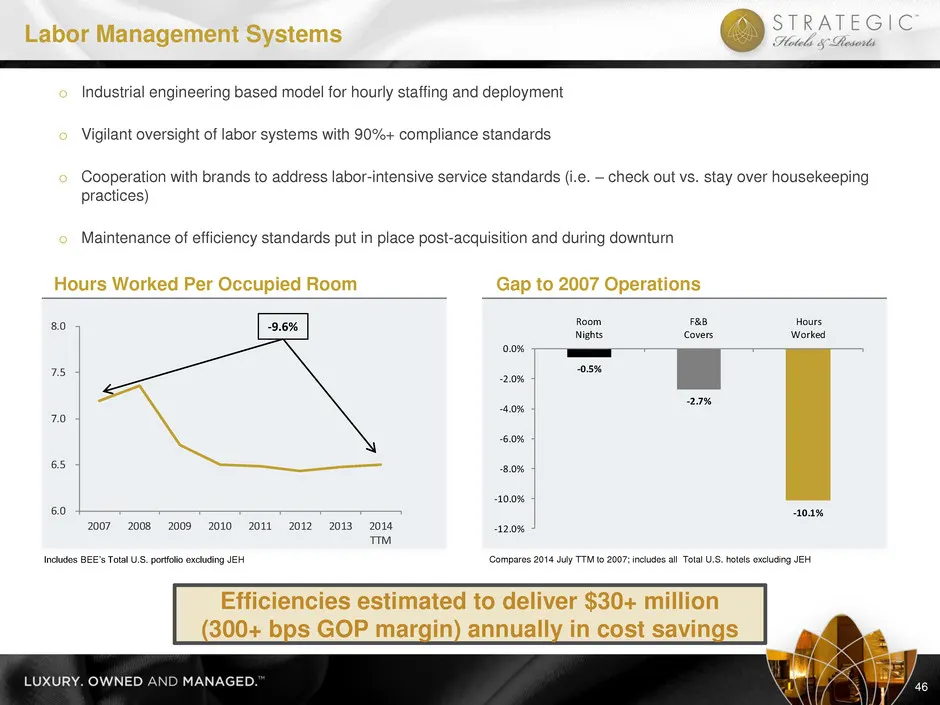
o Industrial engineering based model for hourly staffing and deployment o Vigilant oversight of labor systems with 90%+ compliance standards o Cooperation with brands to address labor-intensive service standards (i.e. – check out vs. stay over housekeeping practices) o Maintenance of efficiency stan
Slide 48: Case Study: Fairmont Scottsdale Princess
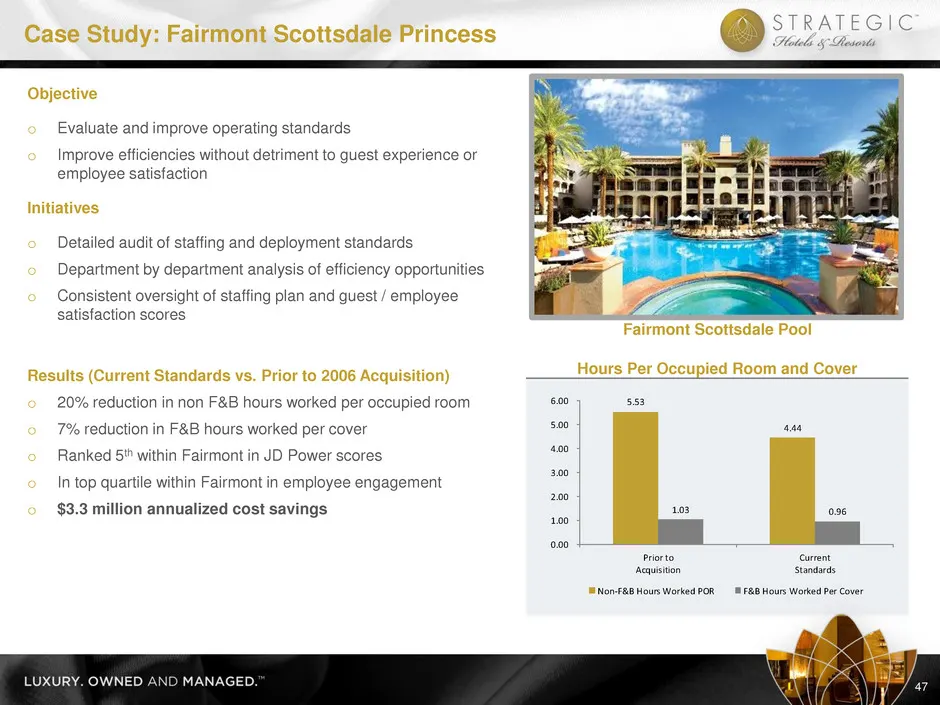
Fairmont Scottsdale Pool Hours Per Occupied Room and Cover 5.53 4.44 1.03 0.96 0.00 1.00 2.00 3.00 4.00 5.00 6.00 Prior to Acquisition Current Standards Non-F&B Hours Worked POR F&B Hours Worked Per Cover Case Study: Fairmont Scottsdale Princess Objective o Evaluate and improve operating standards o
Slide 49: Food Procurement and Menu Engineering Systems
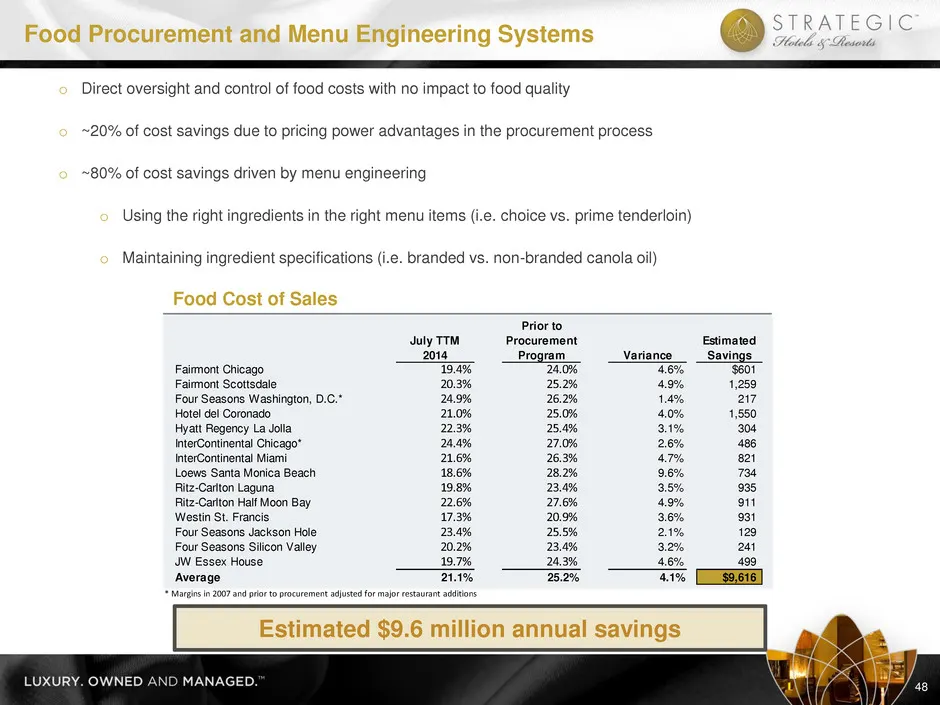
July TTM 2014 Prior to Procurement Program Variance Estimated Savings Fairmont Chicago 19.4% 24.0% 4.6% $601 Fairmont Scottsdale 20.3% 25.2% 4.9% 1,259 Four Seasons Washington, D.C.* 24.9% 26.2% 1.4% 217 Hotel del Coronado 21.0% 25.0% 4.0% 1,550 Hyatt Regency La Jolla 22.3% 25.4% 3.1% 304 InterConti
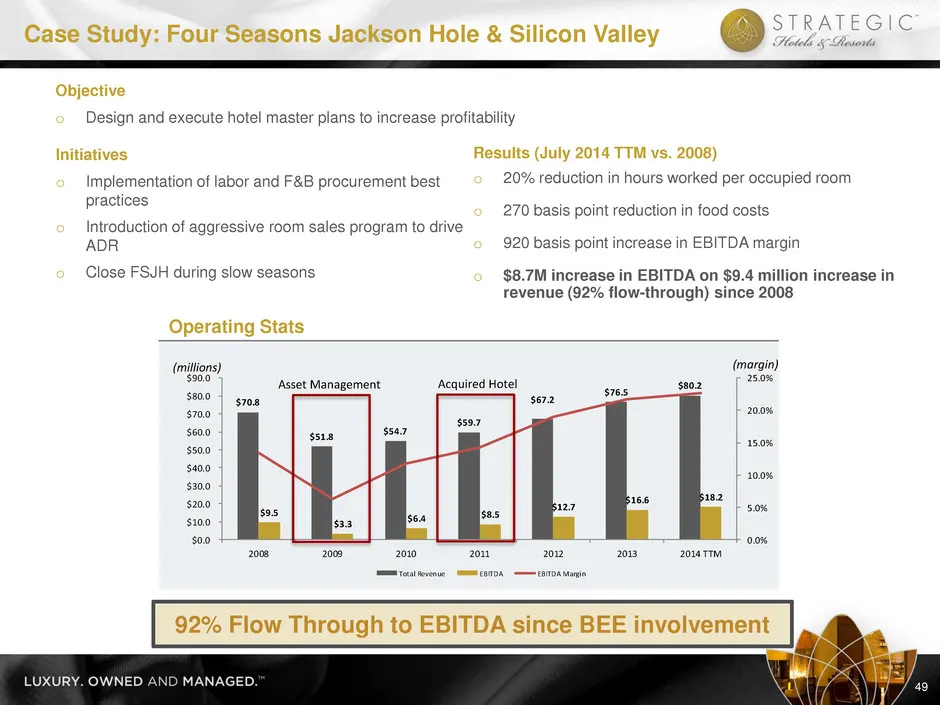
Slide 50: Case Study: Four Seasons Jackson Hole & Silicon Valley
$70.8 $51.8 $54.7 $59.7 $67.2 $76.5 $80.2 $9.5 $3.3 $6.4 $8.5 $12.7 $16.6 $18.2 0.0% 5.0% 10.0% 15.0% 20.0% 25.0% $0.0 $10.0 $20.0 $30.0 $40.0 $50.0 $60.0 $70.0 $80.0 $90.0 2008 2009 2010 2011 2012 2013 2014 TTM Total Revenue EBITDA EBITDA Margin Case Study: Four Seasons Jackson Hole & Silicon Valle
Slide 51: Brand Management Partnership and Oversight
o Leverage relationships with senior brand representatives and on-site executive teams o Develop long-standing relationships at the General Manager level o Directly influence marketing, sales, and rate strategies o Implement asset management systems and directly influence brands’ best practices o On
Slide 52: Case Study: JW Marriott New York Essex House
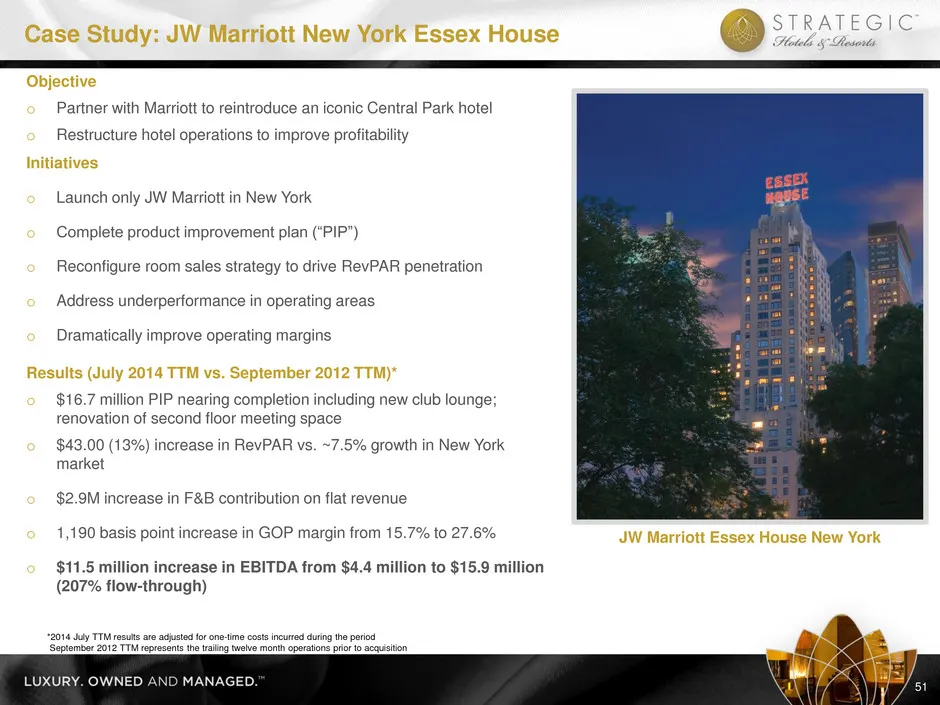
Case Study: JW Marriott New York Essex House Objective o Partner with Marriott to reintroduce an iconic Central Park hotel o Restructure hotel operations to improve profitability Initiatives o Launch only JW Marriott in New York o Complete product improvement plan (“PIP”) o Reconfigure room sales st
Slide 53: Consistent Product Improvement
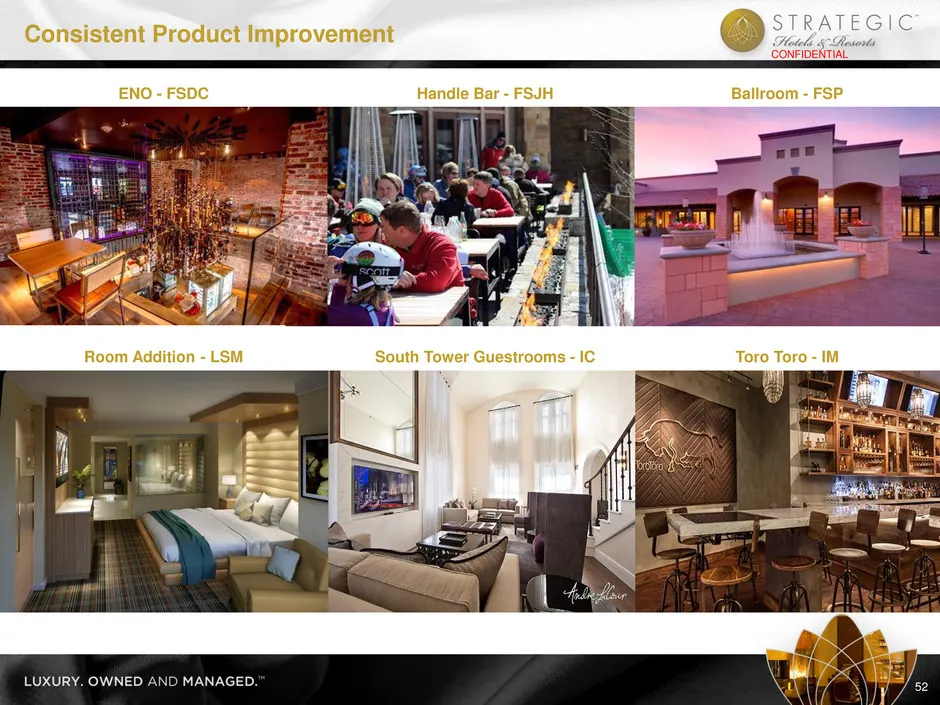
52 Consistent Product Improvement CONFIDENTIAL ENO - FSDC Room Addition - LSM Handle Bar - FSJH South Tower Guestrooms - IC Ballroom - FSP Toro Toro - IM
Slide 54: Case Study: InterContinental Miami
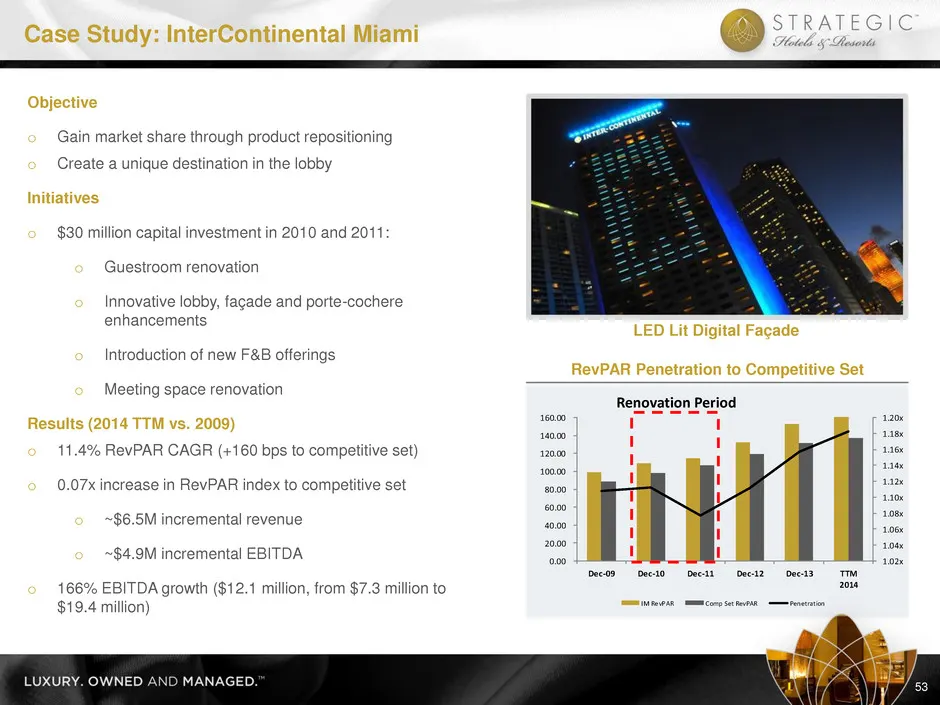
1.02x 1.04x 1.06x 1.08x 1.10x 1.12x 1.14x 1.16x 1.18x 1.20x 0.00 20.00 40.00 60.00 80.00 100.00 120.00 140.00 160.00 Dec-09 Dec-10 Dec-11 Dec-12 Dec-13 TTM 2014 IM RevPAR Comp Set RevPAR Penetration Case Study: InterContinental Miami 53 Objective o Gain market share through product repositioning o C
Slide 55: Case Study: Four Seasons Washington, D.C.
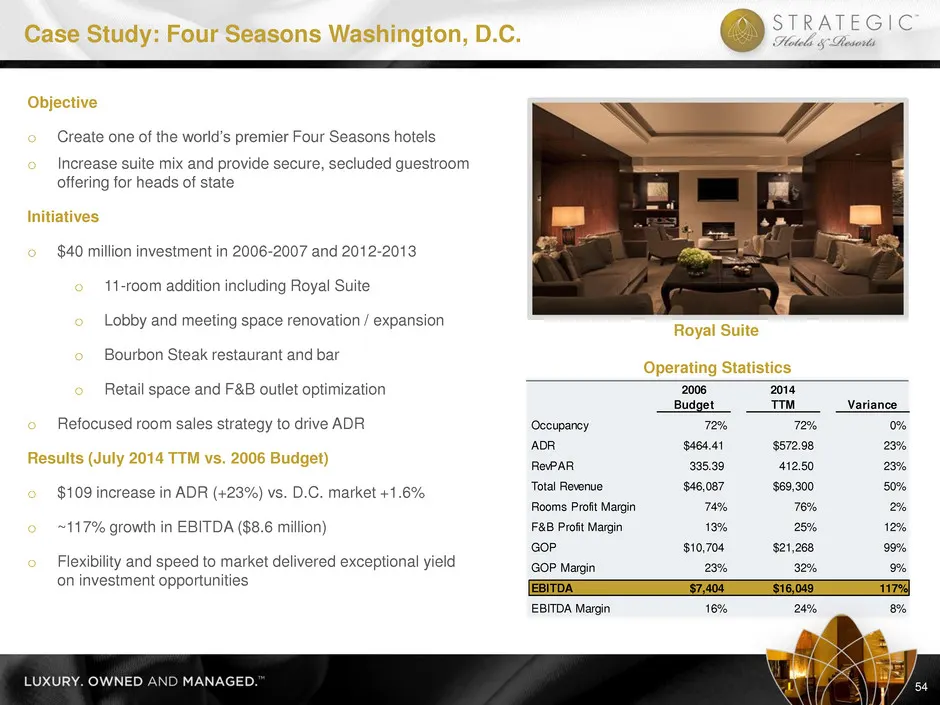
2006 Budget 2014 TTM Variance Occupancy 72% 72% 0% ADR $464.41 $572.98 23% RevPAR 335.39 412.50 23% Total Revenue $46,087 $69,300 50% Rooms Profit Margin 74% 76% 2% F&B Profit Margin 13% 25% 12% GOP $10,704 $21,268 99% GOP Margin 23% 32% 9% EBITDA $7,404 $16,049 117% EBITDA Margin 16% 24% 8% Case St
Slide 56: Creating Unique Events and Attractions
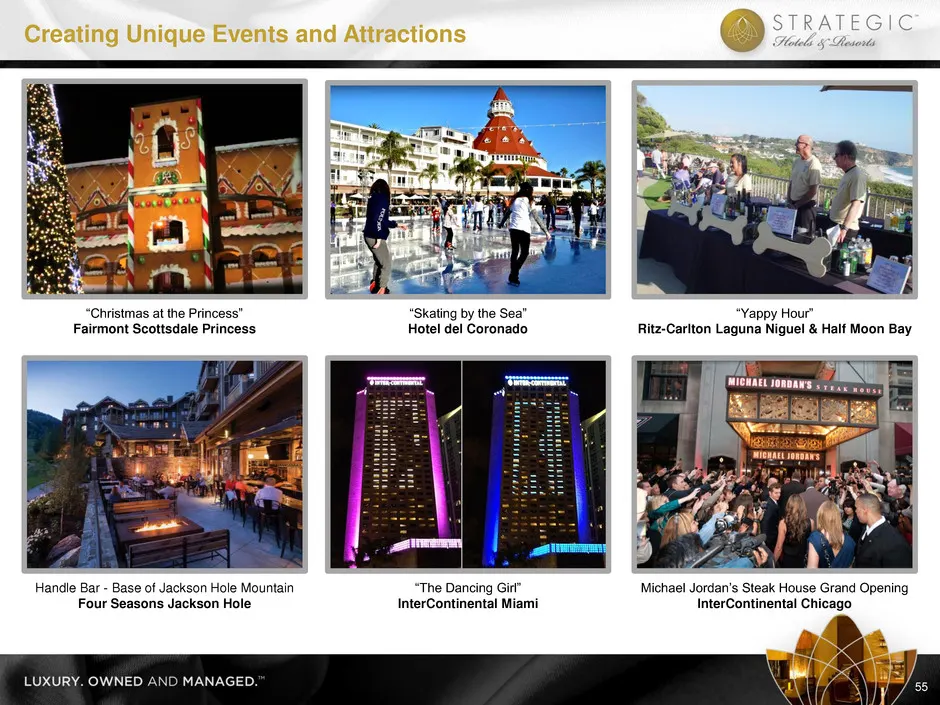
Creating Unique Events and Attractions 55 “Christmas at the Princess” Fairmont Scottsdale Princess “Skating by the Sea” Hotel del Coronado “Yappy Hour” Ritz-Carlton Laguna Niguel & Half Moon Bay Handle Bar - Base of Jackson Hole Mountain Four Seasons Jackson Hole “The Dancing Girl” InterContinental
Slide 57: Thank You letter from Four Seasons Punta Mita
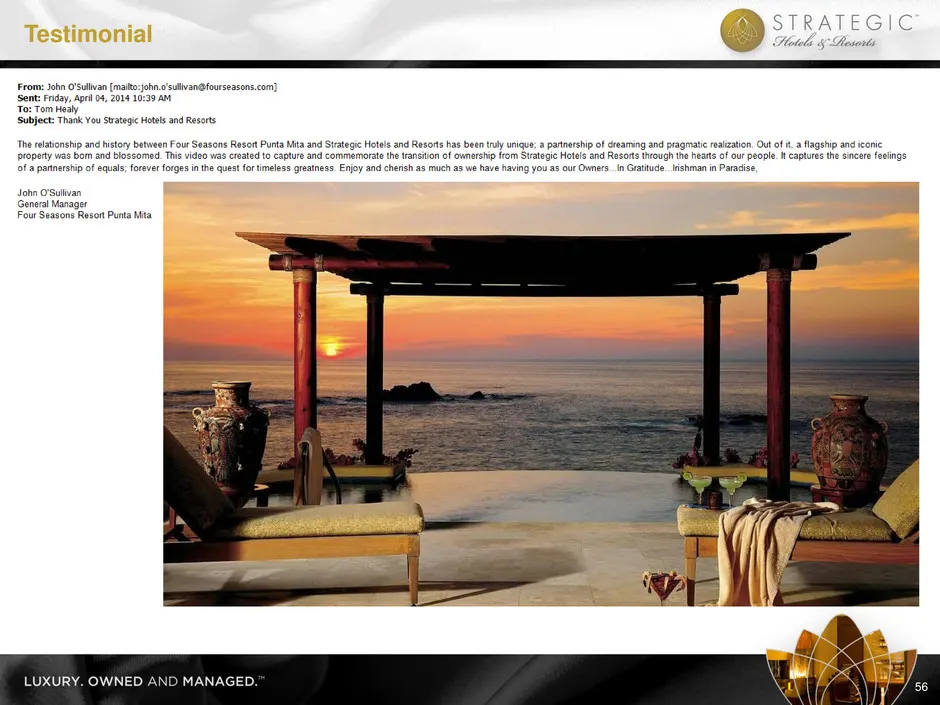
om: Jahn OSulivan [maltoohn sullen fourseasons.com Sem Fay apo, 20181029 08 For Tom Hesy Subject: Thank You Strategic Hotels and Resorts Out oft a flagship and teonie Weaptures thes a In Gratitude. lishman in Parise, Joba OSulhan ‘General Manager Four Seasons Resont Punta Mita LUXURY. OWNED AND MANA

Slide 58: Q&A
I. Company Overview II. World Class Portfolio III. Industry Update IV. Acquisition Strategy V. Financial Overview VI. Asset Management Expertise VII. Q&A VIII. JW Marriott Essex House Introduction Q&A
Slide 59: JW Marriott Essex House Introduction
I. Company Overview II. World Class Portfolio III. Industry Update IV. Acquisition Strategy V. Financial Overview VI. Asset Management Expertise VII. Q&A VIII. JW Marriott Essex House Introduction JW Marriott Essex House Introduction
Slide 60: JW Marriott Essex House
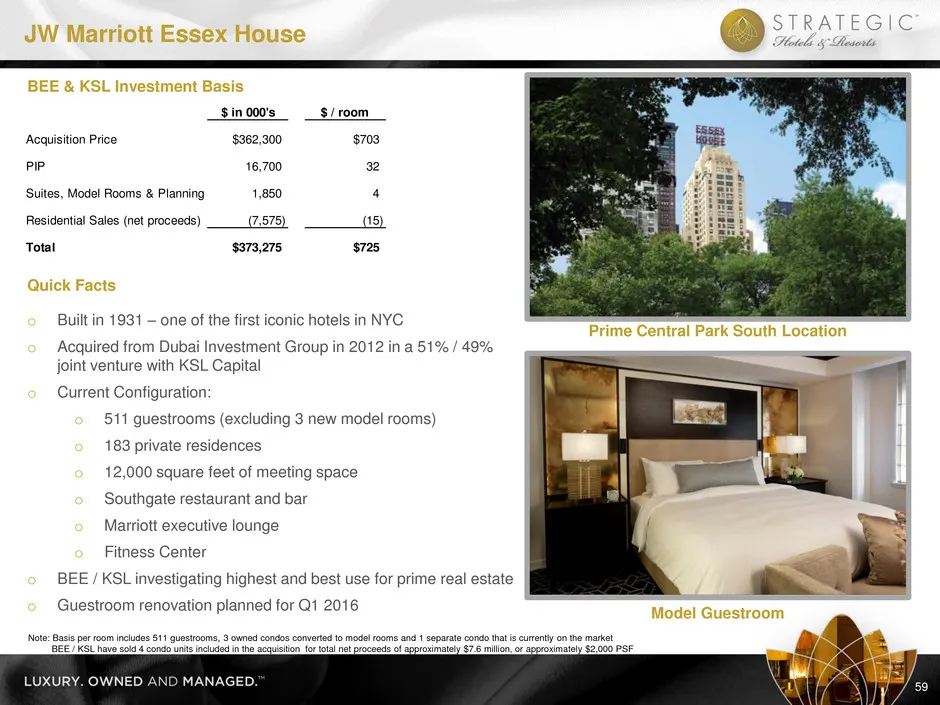
BEE & KSL Investment Basis Quick Facts o Built in 1931 – one of the first iconic hotels in NYC o Acquired from Dubai Investment Group in 2012 in a 51% / 49% joint venture with KSL Capital o Current Configuration: o 511 guestrooms (excluding 3 new model rooms) o 183 private residences o 12,000 square

Slide 61: Non-GAAP to GAAP Reconciliations
Non-GAAP to GAAP Reconciliations 60 Update when Guidance ranges available
Slide 62: Reconciliation of Net Debt / EBITDA
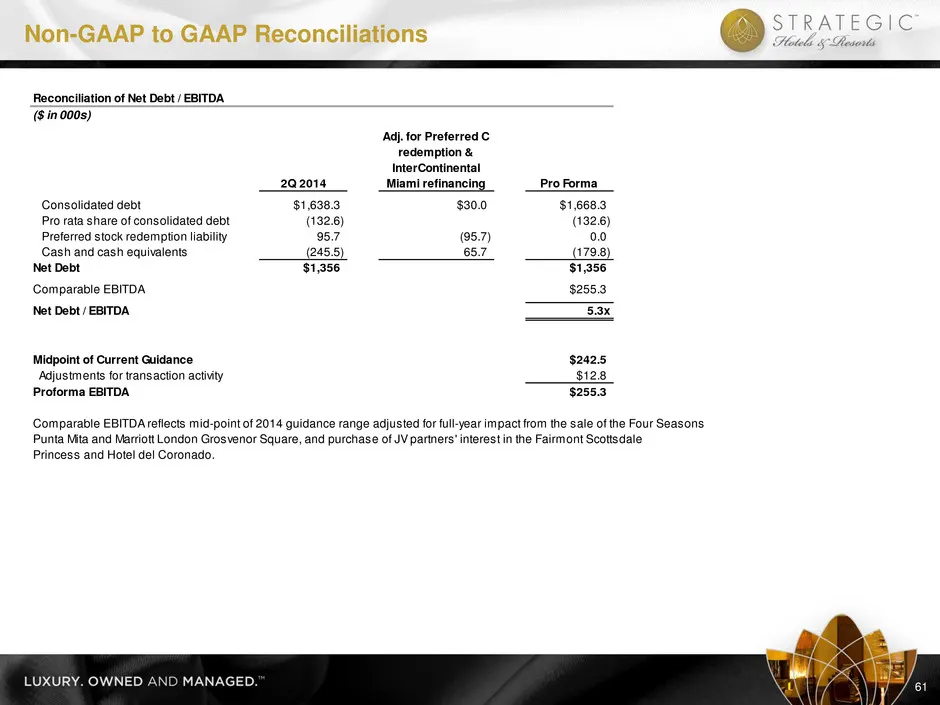
Non-GAAP to GAAP Reconciliations 61 Reconciliation of Net Debt / EBITDA ($ in 000s) 2Q 2014 Adj. for Preferred C redemption & InterContinental Miami refinancing Pro Forma Consolidated debt $1,638.3 $30.0 $1,668.3 Pro rata share of consolidated debt (132.6) (132.6) Preferred stock redemption liabilit
Slide 63: Reconciliation of Net Debt + Preferred Equity / EBITDA
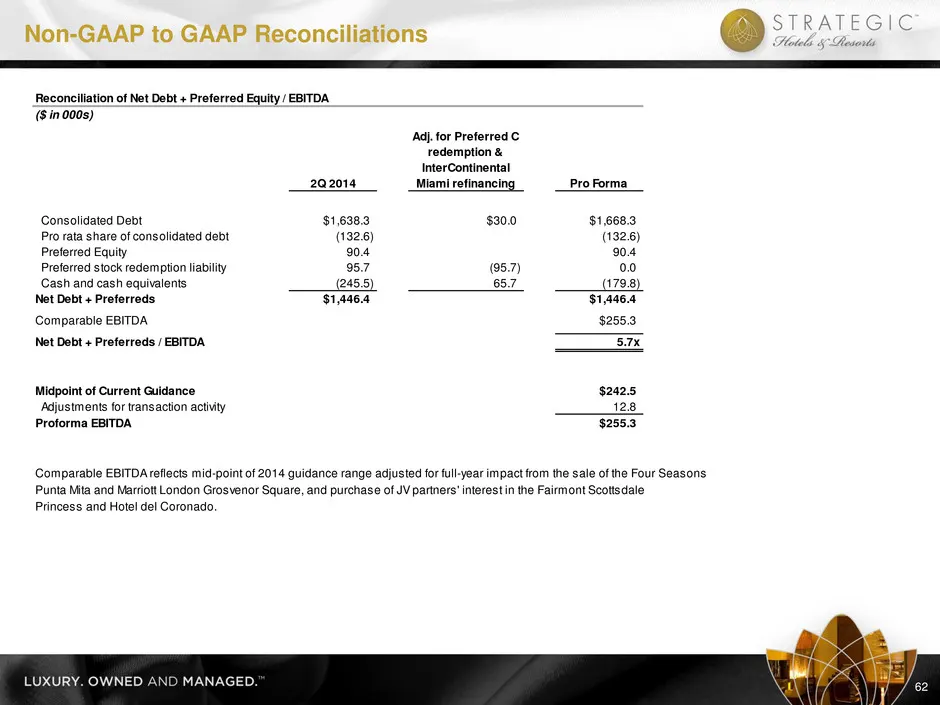
Non-GAAP to GAAP Reconciliations 62 Reconciliation of Net Debt + Preferred Equity / EBITDA ($ in 000s) 2Q 2014 Adj. for Preferred C redemption & InterContinental Miami refinancing Pro Forma Consolidated Debt $1,638.3 $30.0 $1,668.3 Pro rata share of consolidated debt (132.6) (132.6) Preferred Equity
Slide 64: Reconciliation of Net Debt / TEV
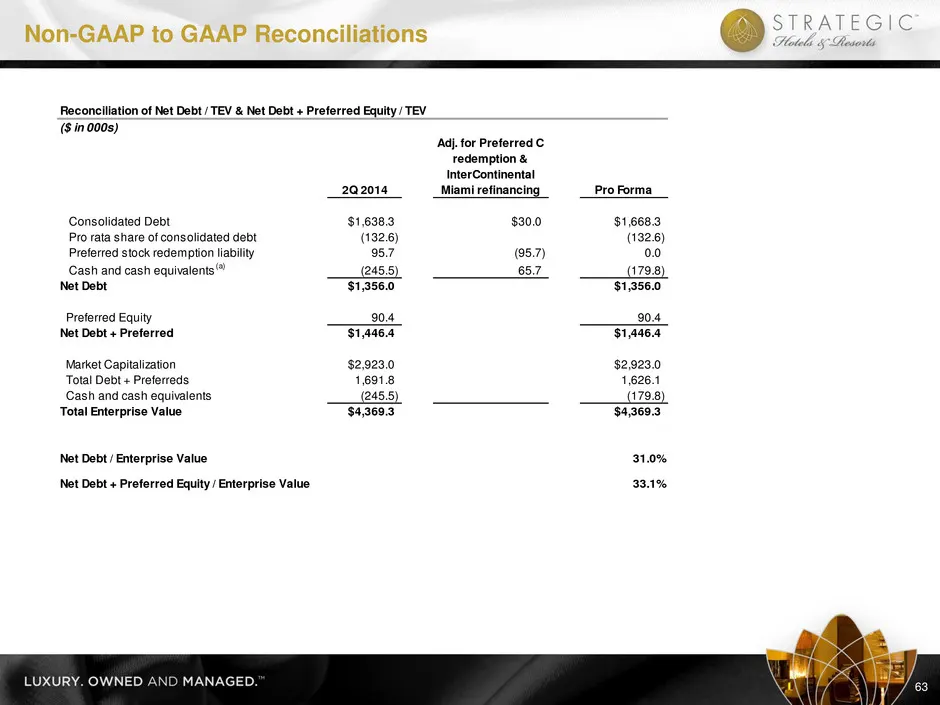
Non-GAAP to GAAP Reconciliations 63 Reconciliation of Net Debt / TEV & Net Debt + Preferred Equity / TEV ($ in 000s) 2Q 2014 Adj. for Preferred C redemption & InterContinental Miami refinancing Pro Forma Consolidated Debt $1,638.3 $30.0 $1,668.3 Pro rata share of consolidated debt (132.6) (132.6) Pr
Slide 65: Non-GAAP to GAAP Reconciliations
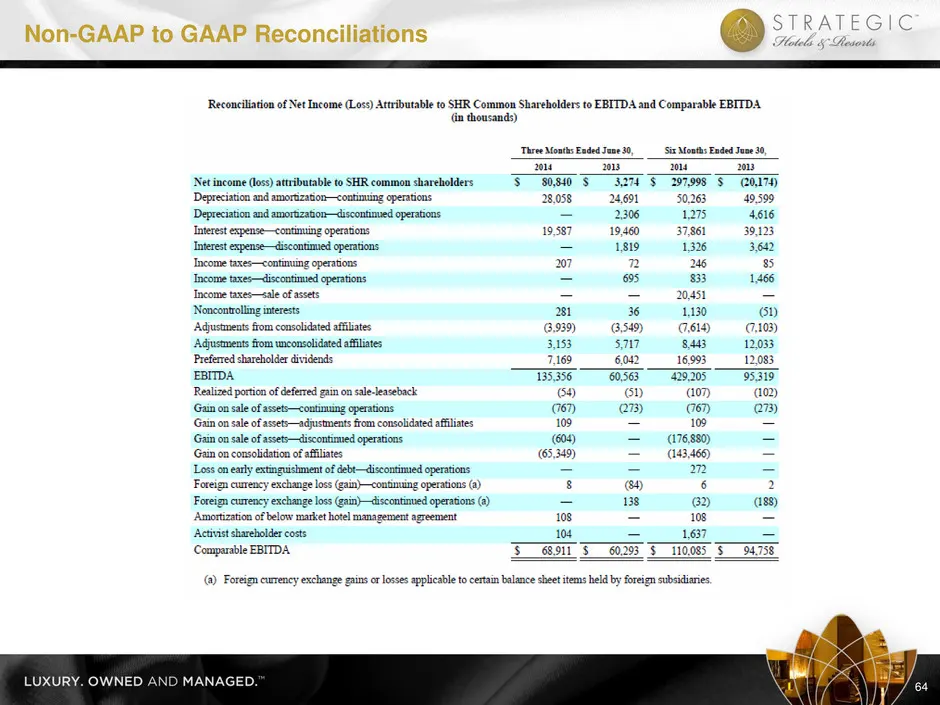
Non-GAAP to GAAP Reconciliations 64
Slide 66: Non-GAAP to GAAP Reconciliations
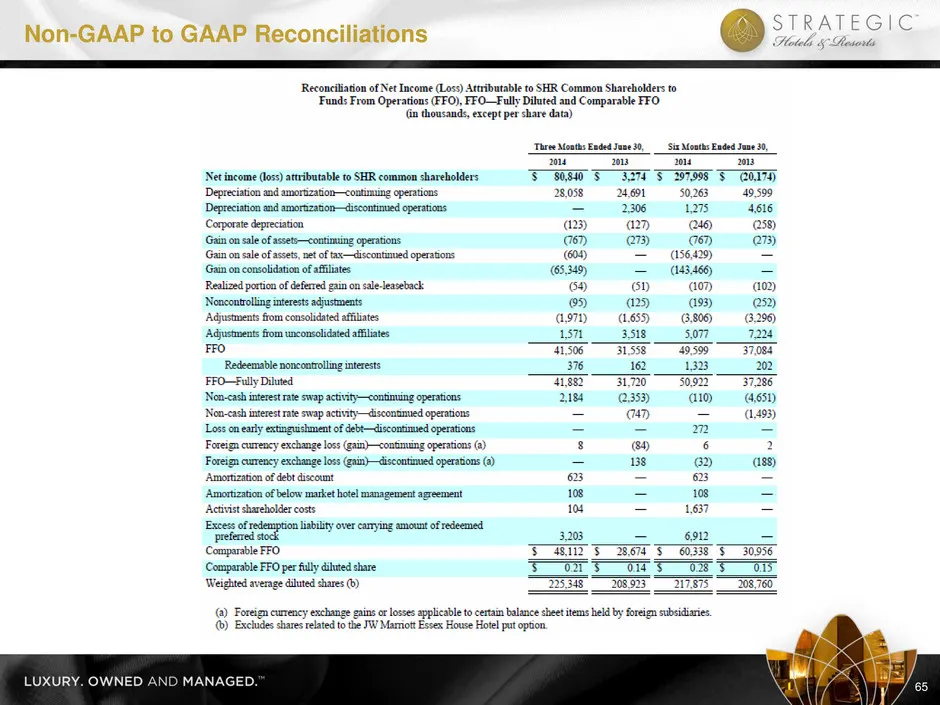
Non-GAAP to GAAP Reconciliations 65
Slide 67: Non-GAAP to GAAP Reconciliations
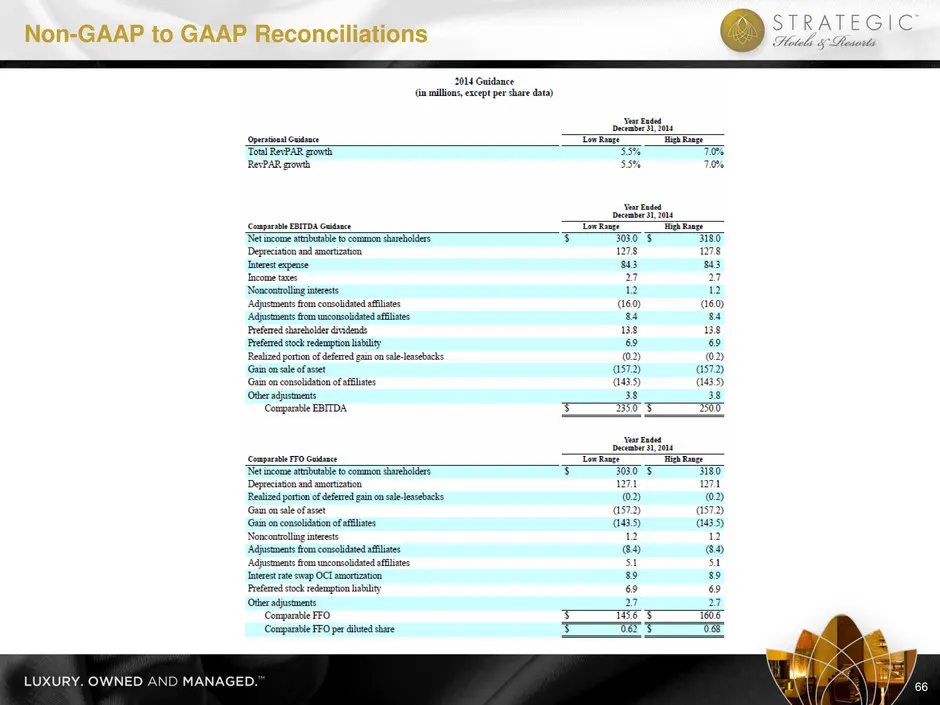
Non-GAAP to GAAP Reconciliations 66
Source: SEC EDGAR · 8-K filed Sep 22, 2014
More decks from Strategic Hotels and Resorts Inc
 Investor Presentation (June 2015)43 slides · Jun 1, 2015
 Investor Presentation (February 2015)43 slides · Feb 24, 2015
 Investor Presentation (January 2015)44 slides · Jan 26, 2015
 Investor Presentation (November 2014)50 slides · Nov 5, 2014
 Investor Presentation (October 2014)50 slides · Oct 3, 2014
 Investor Presentation (August 2014)50 slides · Aug 25, 2014