Bankunited Financial — Q2 FY2008 Earnings Presentation
25 slides from Bankunited Financial's earnings presentation, May 12, 2008

Slide 1: Second Fiscal Quarter 2008 Financial Results
BankUnited Financial Corporation Exhibit 99.2 Second Fiscal Quarter 2008 Financial Results May 12, 2008

Slide 2: Forward-Looking Information
Forward-Looking Information This presentation may contain certain forward-looking statements, which are based on management's expectations regarding factors that may impact the company's earnings and performance in future periods. Words and phrases such as: "will," "will likely result," "expect," "w

Slide 3: Second-Quarter Review
Second-Quarter Review Loss of $65.8 million, or $1.88 per share Recorded a provision for loan losses of $98.0 million reflecting the nationwide deterioration in the housing market and the rising level of delinquencies Other-than-temporary impairments of $25.5 million, pre-tax on preferred securities

Slide 4: Strengthening Capital Structure
Strengthening Capital Structure Maintaining capital levels in excess of the regulatory well-capitalized level BankUnited, FSB Tier 1 capital of 7.8% at March 31, 2008, minimum ratio for well- capitalized requirement is 5% BankUnited, FSB risk-based capital ratio of 14.6% at March 31, 2008, minimum r

Slide 5: Retail Commercial Bank
Retail Commercial Bank Retail commercial bank is performing well Total deposits of $6.9 billion at March 31, 2008, a 1% increase from March 31, 2007 Core deposits of $5.1 billion at March 31, 2008, a 3% increase from March 31, 2007 Total deposits of $7.6 billion at April 30, 2008

Slide 6: Retail Commercial Bank
Retail Commercial Bank We continue to build strong relationships with our customers Neighborhood Banking at March 31, 2008 – 98,000 households – Average household deposits of ~ $69,000 – 2.058 services per household – Attrition rate for multi-service households was 6.9% Building relationships throug

Slide 7: South Florida Business Climate
South Florida Business Climate Florida’s unemployment rate was 4.9% in March 2008, compared to a national rate of 5.1%* (1) Miami-Dade county unemployment rate was 3.9% in March 2008, up from 3.5% in March 2007* Exporting – increasing trends towards marketing overseas Products and services Retail, i

Slide 8: Second-Quarter 2008 Credit Summary
Second-Quarter 2008 Credit Summary Provision for loan loss of $98 million; net charge- offs of $13.3 million Residential and consumer residential net charge-offs of $13.1 million; including $6.0 million in estimated recoveries from mortgage insurance Consumer net charge-offs of $128,000 Commercial a

Slide 9: Second-Quarter 2008 Credit Summary
Second-Quarter 2008 Credit Summary March 31, 2008 Dec. 31, 2007 Non-performing assets to total assets 4.75% 2.99% Non-performing loans to total loans 4.86% 3.05% 1.61% 0.93% 33.25% 30.61% 0.42% 0.17% 0.42% 0.19% Net residential annualized q-t-d charge-offs as a % of avg total loan portfolio Allowanc

Slide 10: «aBankUnited
—== «aBankUnited

Slide 11: Residential Lending Credit Standards
Residential Lending Credit Standards Strong underwriting standards No subprime lending No piggybacking Loans originated with an LTV over 80% require mortgage insurance Weighted average FICO at inception of 709 Weighted average LTV at inception was 75.2%* as of March 31, 2008 * Includes the adjustmen

Slide 12: Residential Lending Credit Standards
Residential Lending Credit Standards Loans underwritten at the fully indexed rate Underwriters regionally based and knowledgeable of their markets Strong appraisal review process using regionally based appraisers Levels for loan amount, LTV and geography should trigger an in-house appraisal review L

Slide 13: Residential Lending Credit Standards
Residential Lending Credit Standards FICO Score Criteria 24 months of active credit history required – Minimum of four credit lines required – May not be one-time score Credit history for primary borrower, not an authorized user Debt-to-income calculated on all obligations including credit cards, au
Slide 14: Residential Loan Portfolio - Documentation
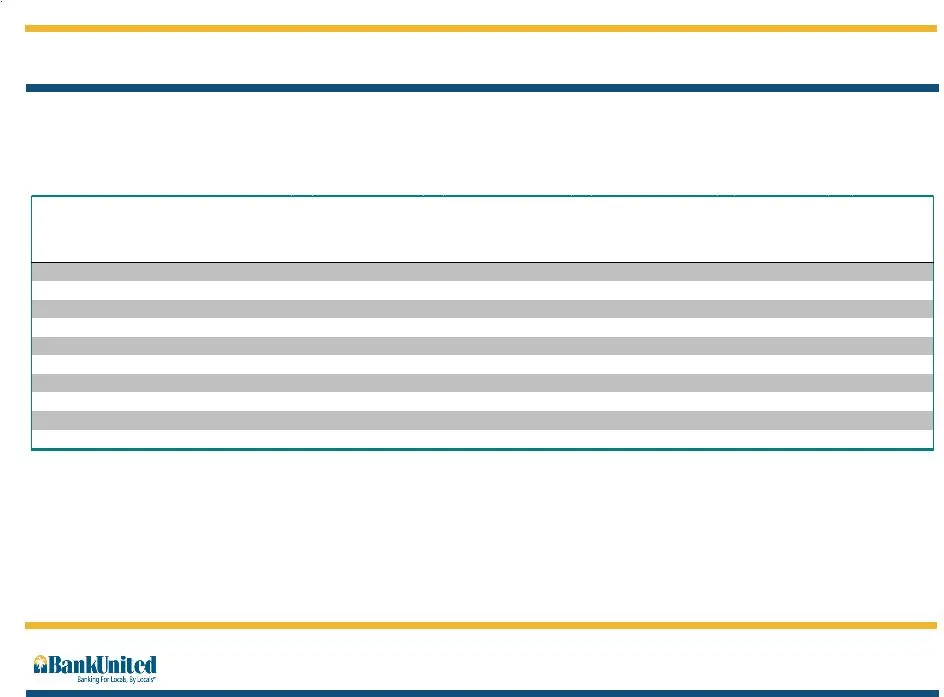
Residential Loan Portfolio - Documentation Period ended March 31, 2008 Attribute FULL DOC EMPLOYMENT VERIFIED (a) STATED INCOME / VERIFIED ASSETS EMPLOYMENT VERIFIED(a) REDUCED DOC PRIMARY RESIDENCE NO DOC** Totals Residential Portfolio* (000's) millions $1,696,877 $4,222,552 $2,966,108 $884,828 $9,

Slide 15: «aBankUnited
= «aBankUnited

Slide 16: «aBankUnited
[ad «aBankUnited

Slide 17: «aBankUnited
«aBankUnited

Slide 18: «aBankUnited
te «aBankUnited

Slide 19: Rar
Rar «aBankUnited
Slide 20: «aBankUnited
«aBankUnited

Slide 21: Option ARM Resets: Actuals and Projections by Reason and Time
Option ARM Resets: Actuals and Projections by Reason and Time Period $ 1,984,770 5714 $ 384,438 1277 $ 2,369,208 6991 Fiscal Year 2010 $ 754,211 2059 $ 131,908 $ 886,119 2486 Fiscal Year 2009 $ 88,754 $ 2,559 $ 91,313 Fiscal Q3 & Q4 2008 Amount ($, thousands) Number of Loans Amount ($, thousands) Nu

Slide 22: Strategic Plans
Strategic Plans Primary goal of plan is to transition to retail commercial bank More balanced contributions by all lines of business Improved deposit mix – Higher core deposit accounts Higher non-interest income Lower reliance on borrowed funds Ongoing Actions Reduce assets Expense reduction program

Slide 23: Strategic Plan Actions
Strategic Plan Actions Reduce asset size Reduce residential loan balances Curtail wholesale loan production – January 2008 Closed four regional lending offices Consolidated nine operations centers to three – Virtually all loan production is saleable product for FNMA, FHLMC, and FHA/VA – No originati

Slide 24: Strategic Plan Actions
Strategic Plan Actions Reduce expenses significantly Realignment of staffing needs – Wholesale Residential Lending staff reduced by 45% – Maturity of the branch network should allow for greater efficiency – Reviewing opportunities for further consolidations

Slide 25: Strategic Plan Actions
Strategic Plan Actions Grow other income FY07 non-interest income was approximately 11% of net-interest income Project other income to increase materially – Growth expected from loan servicing fees and deposit service fees – Increase in investment and management fees from Wealth Management – Focus o
Source: SEC EDGAR · 8-K filed May 12, 2008
More decks from Bankunited Financial Corp
 Q3 2008 Earnings Presentation16 slides · Aug 11, 2008
 Investor Presentation (June 2008)27 slides · Jun 4, 2008
 Q1 FY2008 Earnings Presentation22 slides · Jan 24, 2008
 Investor Day (February 2007)88 slides · Feb 26, 2007
 Investor Presentation (November 2006)38 slides · Nov 2, 2006
 Investor Presentation (September 2006)40 slides · Sep 8, 2006