Bankunited Financial — Investor Presentation (September 2006)
40 slides from Bankunited Financial's investor presentation, Sep 8, 2006
Slide 1: BankUnited Financial Corporation Investor Presentation
BankUnited Financial Corporation Investor Presentation September 2006
Slide 2: Forward Looking Information
Forward Looking Information This presentation contains certain forward looking statements, which are based on management’s expectations regarding factors that may impact the Company’s strategic initiatives, and economic outlook. Such forward-looking statements are based on current plans and expectat
Slide 3: BankUnited's Strategy
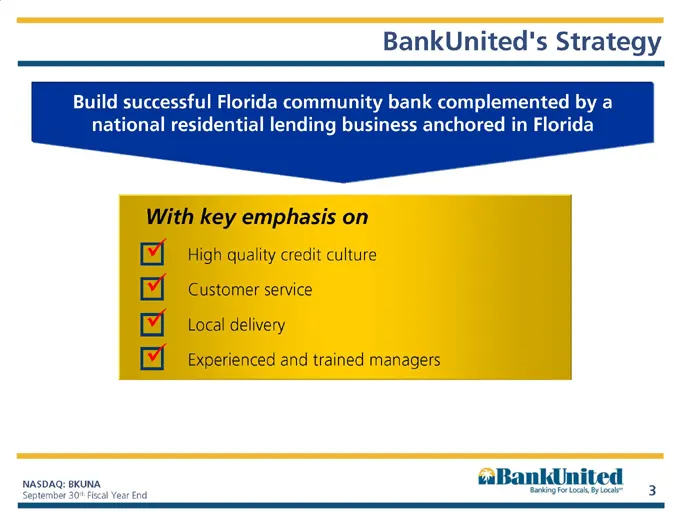
BankUnited’s Strategy With key emphasis on High quality credit culture Customer service Local delivery Experienced and trained managers Build successful Florida community bank complemented by a national residential lending business anchored in Florida
Slide 4: Loan & Deposit Portfolio
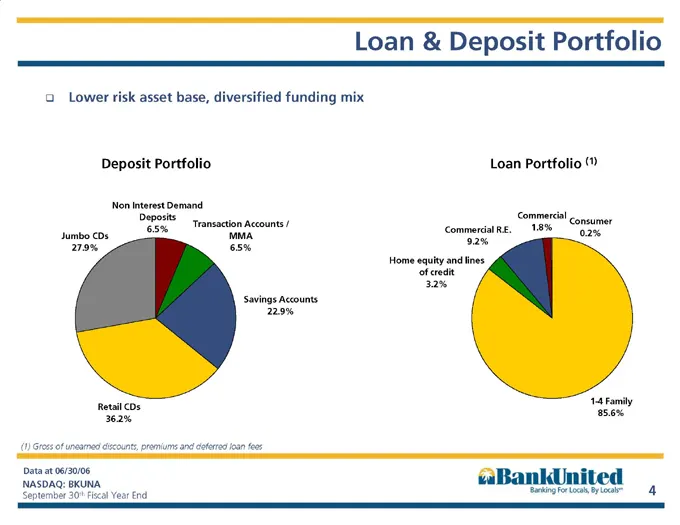
September 30th Fiscal Year End 4 Retail CDs 36.2% Non Interest Demand Deposits 6.5% Savings Accounts 22.9% Jumbo CDs 27.9% Transaction Accounts / MMA 6.5% Deposit Portfolio Loan & Deposit Portfolio 1-4 Family 85.6% Commercial 1.8% Commercial R.E. 9.2% Consumer 0.2% Home equity and lines of credit 3.
Slide 5: Deep and Experienced Management Team
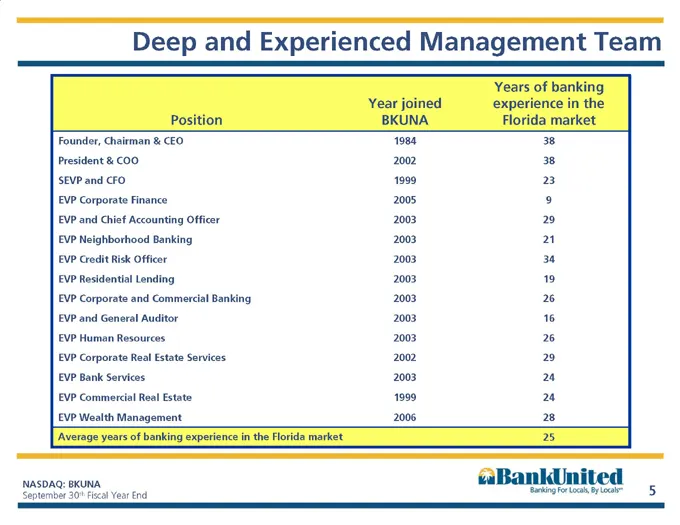
Deep and Experienced Management Team 28 2006 EVP Wealth Management 25 Average years of banking experience in the Florida market 24 1999 EVP Commercial Real Estate 24 2003 EVP Bank Services 29 2002 EVP Corporate Real Estate Services 26 2003 EVP Human Resources 16 2003 EVP and General Auditor 26 2003

Slide 6: A Local Florida Bank
A Local Florida Bank a «@BankUnited poh td
Slide 7: The Florida Market: Population Growth
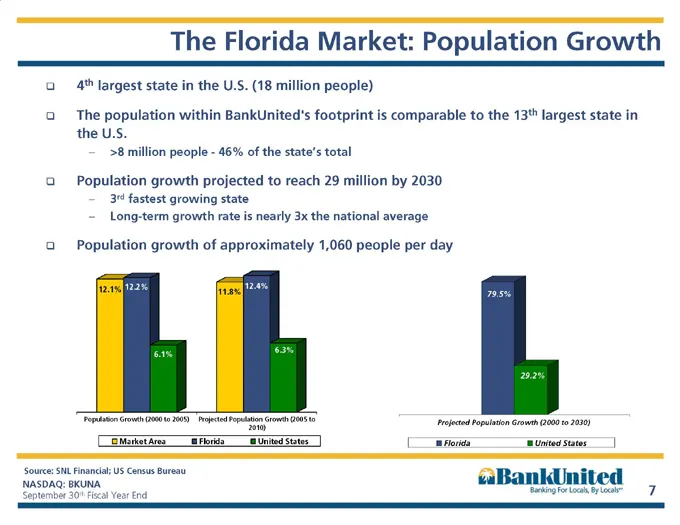
The Florida Market: Population Growth 4th largest state in the U.S. (18 million people) The population within BankUnited’s footprint is comparable to the 13th largest state in the U.S. 8 million people—46% of the state’s total Population growth projected to reach 29 million by 2030 3rd fastest growi
Slide 8: The Florida Market: Large & Growing Deposit Base
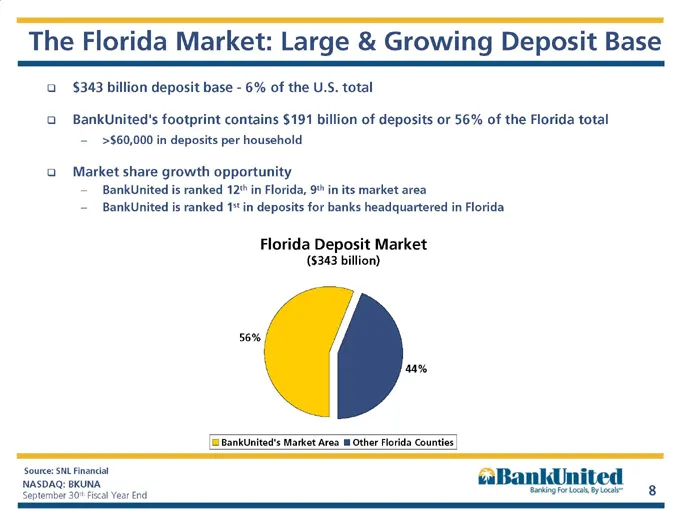
The Florida Market: Large & Growing Deposit Base $343 billion deposit base—6% of the U.S. total BankUnited’s footprint contains $191 billion of deposits or 56% of the Florida total $60,000 in deposits per household Market share growth opportunity BankUnited is ranked 12th in Florida, 9th in its mark
Slide 9: The Florida Market: #1 in Job Creation
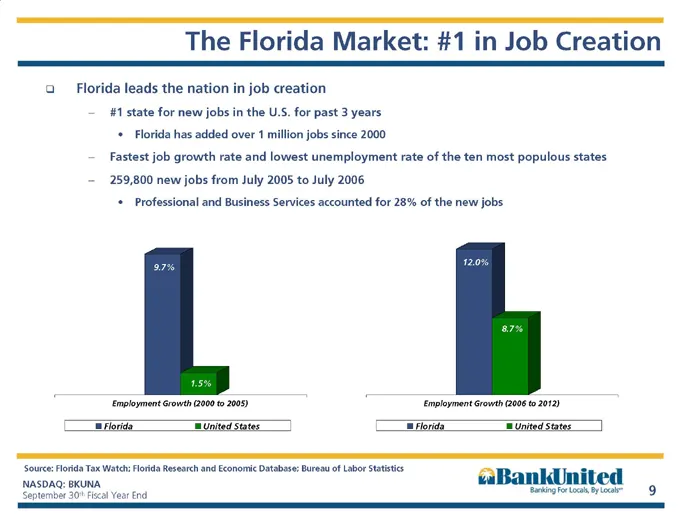
The Florida Market: #1 in Job Creation Florida leads the nation in job creation #1 state for new jobs in the U.S. for past 3 years Florida has added over 1 million jobs since 2000 Fastest job growth rate and lowest unemployment rate of the ten most populous states 259,800 new jobs from July 2005 to
Slide 10: Branches in Florida
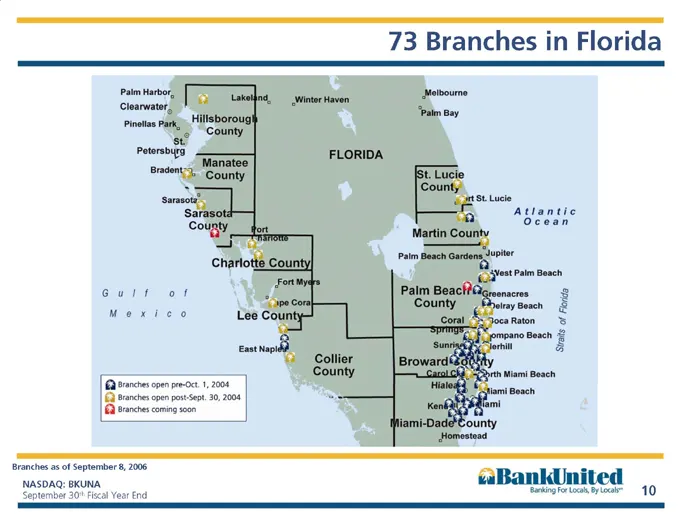
73 Branches in Florida Branches as of September 8, 2006
Slide 11: Micro-market Retail Strategy
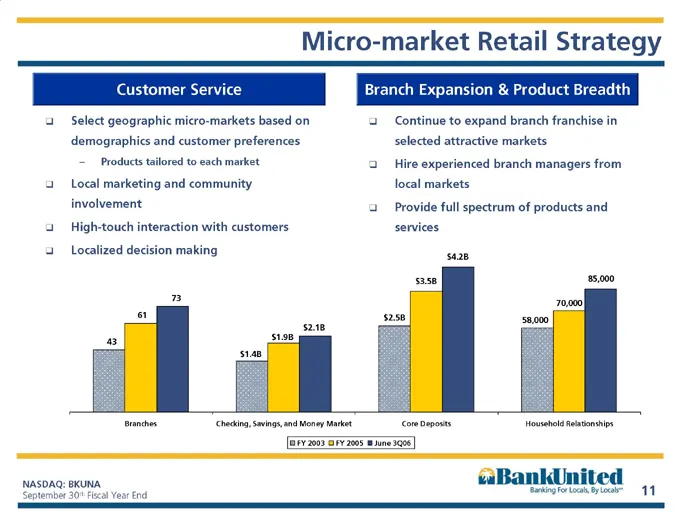
Micro-market Retail Strategy Select geographic micro-markets based on demographics and customer preferences Products tailored to each market Local marketing and community involvement High-touch interaction with customers Localized decision making Customer Service Continue to expand branch franchise
Slide 12: Branch Expansion and Core Deposit Growth
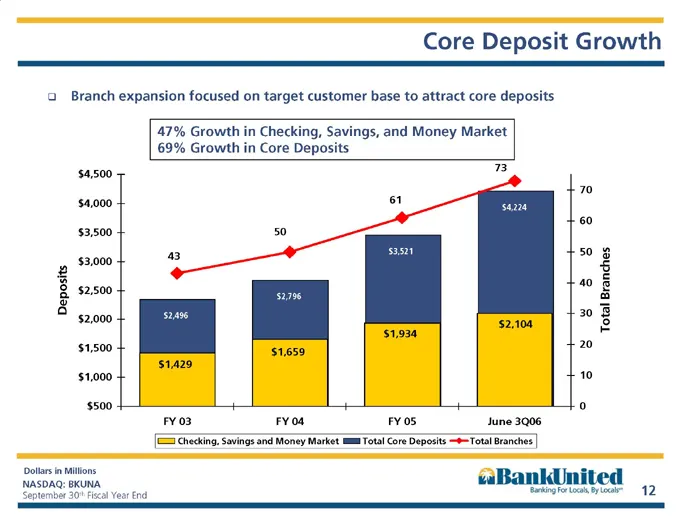
September 30th Fiscal Year End 12 $4,224 $2,496 $2,796 $3,521 $2,104 $1,429 $1,659 $1,934 73 43 50 61 $500 $1,000 $1,500 $2,000 $2,500 $3,000 $3,500 $4,000 $4,500 FY 03 FY 04 FY 05 June 3Q06 Deposits Total Branches Core Deposit Growth Dollars in Millions Branch expansion focused on target customer b
Slide 13: Loan Production Mix
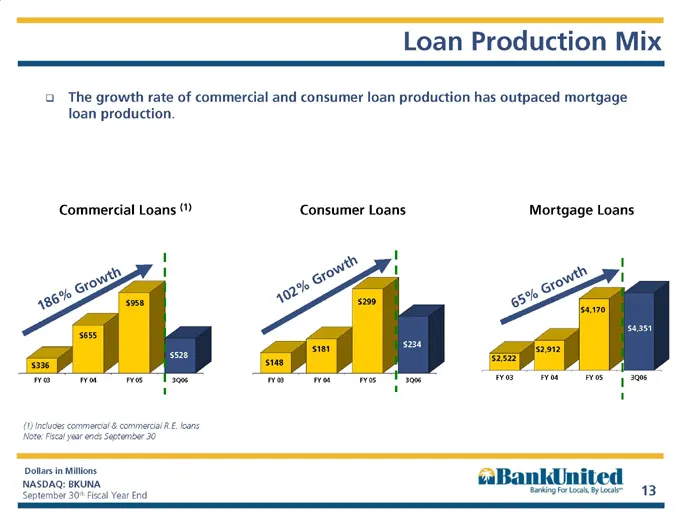
Loan Production Mix $2,522 $2,912 $4,170 $4,351 FY 03 FY 04 FY 05 3Q06 Dollars in Millions 65% Growth The growth rate of commercial and consumer loan production has outpaced mortgage loan production. $336 $655 $958 $528 FY 03 FY 04 FY 05 3Q06 186% Growth Mortgage Loans Commercial Loans (1) $148 $181
Slide 14: Commercial & Commercial Real Estate Strategy
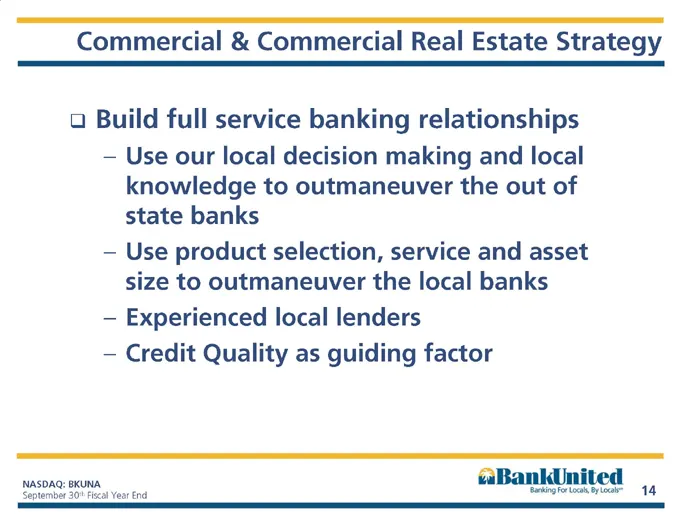
Commercial & Commercial Real Estate Strategy Build full service banking relationships Use our local decision making and local knowledge to outmaneuver the out of state banks Use product selection, service and asset size to outmaneuver the local banks Experienced local lenders Credit Quality as guidi
Slide 15: Commercial Banking Landscape
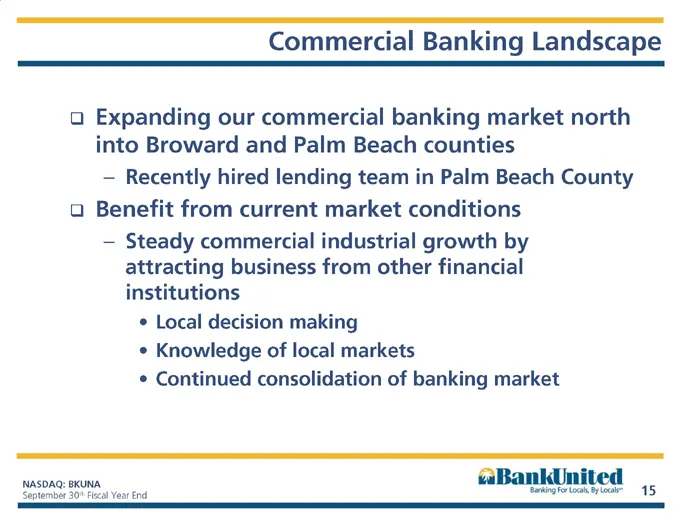
Commercial Banking Landscape Expanding our commercial banking market north into Broward and Palm Beach counties Recently hired lending team in Palm Beach County Benefit from current market conditions Steady commercial industrial growth by attracting business from other financial institutions Local d
Slide 16: Commercial Banking Relationships
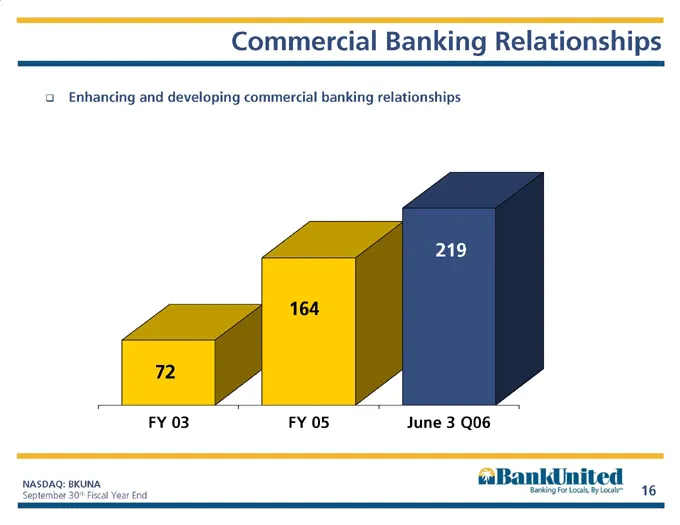
Commercial Banking Relationships FY 03 FY 05 June 3 Q06 Enhancing and developing commercial banking relationships
Slide 17: Commercial Banking Loan Balances
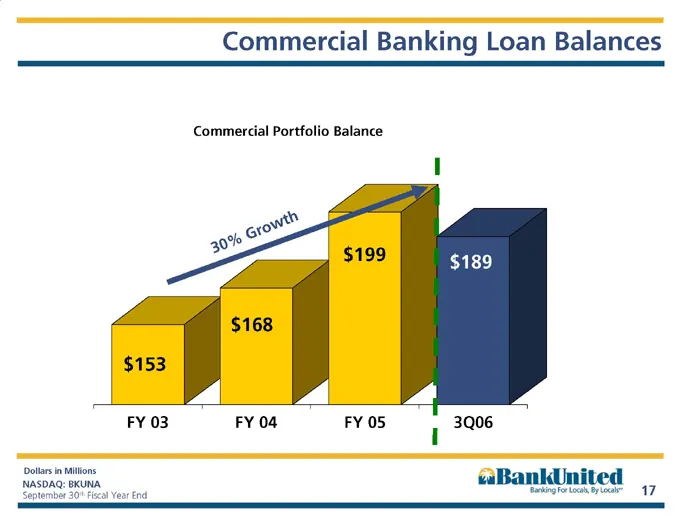
Commercial Banking Loan Balances Dollars in Millions $153 $168 $199 $189 FY 03 FY 04 FY 05 3Q06 30% Growth Commercial Portfolio Balance
Slide 18: Commercial Real Estate Landscape
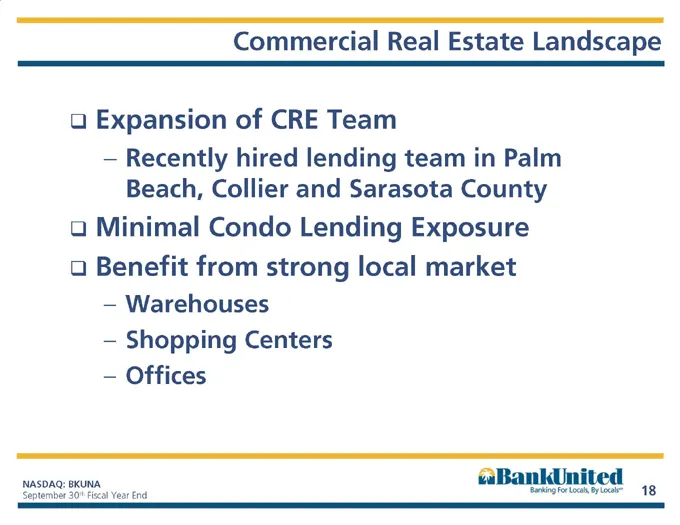
September 30th Fiscal Year End 18 Commercial Real Estate Landscape Expansion of CRE Team Recently hired lending team in Palm Beach, Collier and Sarasota County Minimal Condo Lending Exposure Benefit from strong local market Warehouses Shopping Centers Offices
Slide 19: Commercial Real Estate Loan Balances
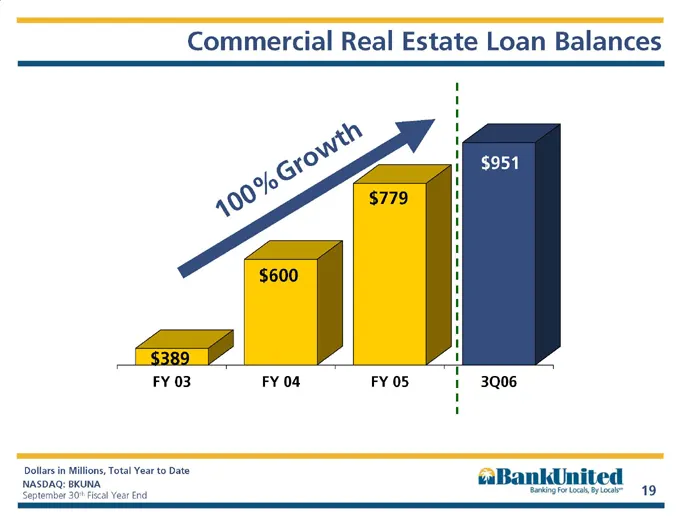
Commercial Real Estate Loan Balances $389 $600 $779 $951 FY 03 FY 04 FY 05 3Q06 Dollars in Millions, Total Year to Date 100%Growth
Slide 20: Non-residential Portfolio Asset Quality
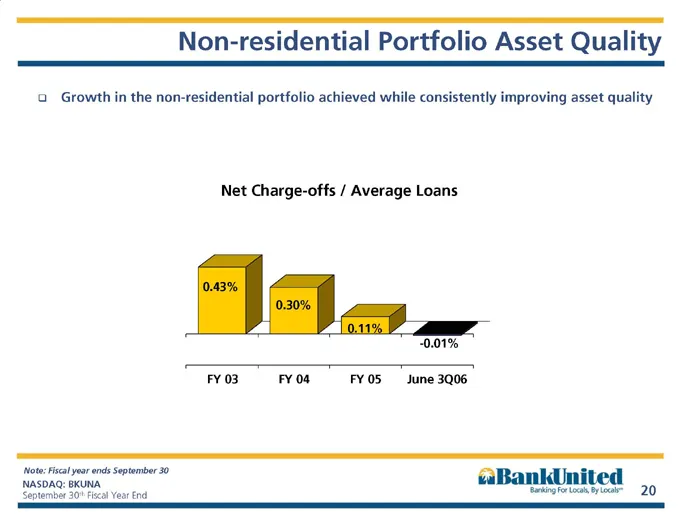
Non-residential Portfolio Asset Quality Growth in the non-residential portfolio achieved while consistently improving asset quality 0.43% 0.30% 0.11% -0.01% FY 03 FY 04 FY 05 June 3Q06 Net Charge-offs / Average Loans Note: Fiscal year ends September 30
Slide 21: Residential Lending
Residential Lending a «@BankUnited poh kt
Slide 22: Residential Loan Portfolio Mix
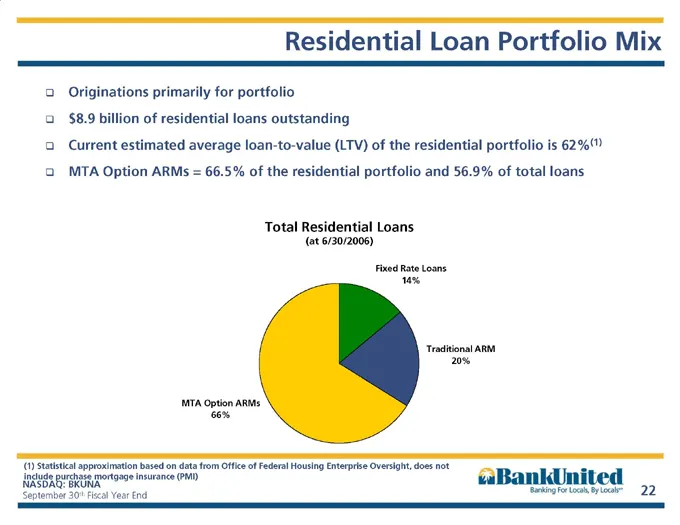
Residential Loan Portfolio Mix Fixed Rate Loans 14% Traditional ARM 20% MTA Option ARMs 66% Total Residential Loans (at 6/30/2006) Originations primarily for portfolio $8.9 billion of residential loans outstanding Current estimated average loan-to-value (LTV) of the residential portfolio is 62% (1)
Slide 23: MTA Option ARM Loan Balances
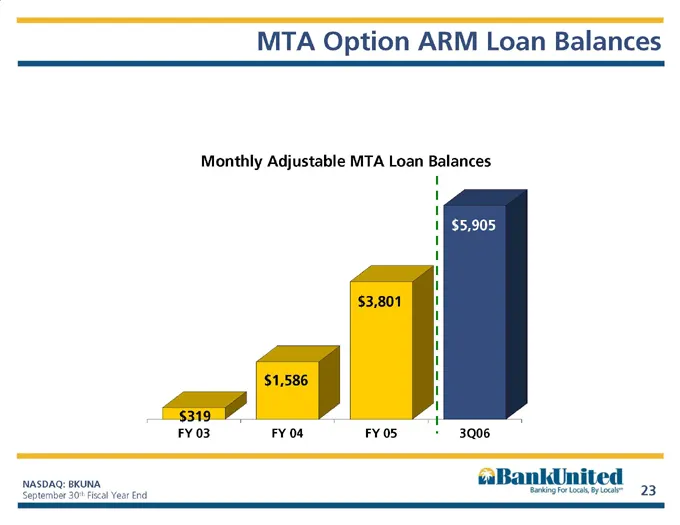
$319 $1,586 $3,801 $5,905 FY 03 FY 04 FY 05 3Q06 Monthly Adjustable MTA Loan Balances MTA Option ARM Loan Balances
Slide 24: MTA Option ARM Product Description
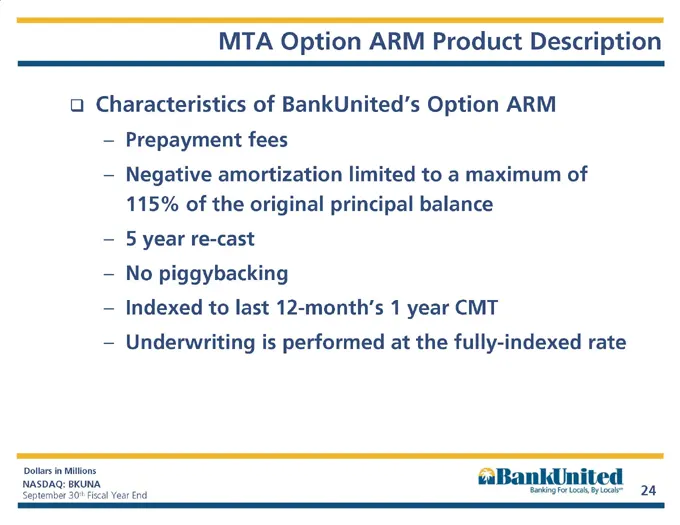
MTA Option ARM Product Description Characteristics of BankUnited’s Option ARM Prepayment fees Negative amortization limited to a maximum of 115% of the original principal balance 5 year re-cast No piggybacking Indexed to last 12-month’s 1 year CMT Underwriting is performed at the fully-indexed rate
Slide 25: Who is BankUnited's Option ARM Customer?
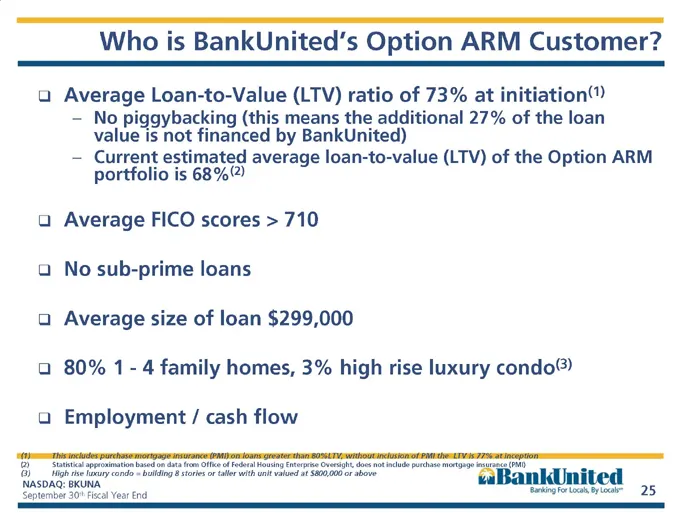
Who is BankUnited’s Option ARM Customer? Average Loan-to-Value (LTV) ratio of 73% at initiation(1) No piggybacking (this means the additional 27% of the loan value is not financed by BankUnited) Current estimated average loan-to-value (LTV) of the Option ARM portfolio is 68%(2) Average FICO scores >
Slide 26: Underwriting Process
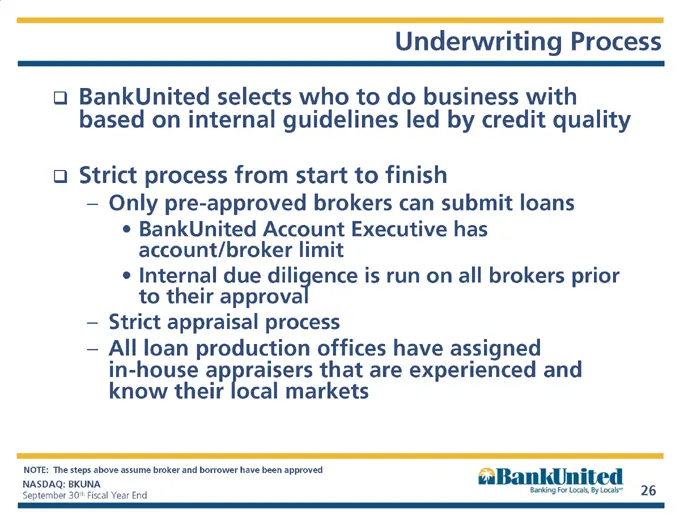
Underwriting Process BankUnited selects who to do business with based on internal guidelines led by credit quality Strict process from start to finish Only pre-approved brokers can submit loans BankUnited Account Executive has account/broker limit Internal due diligence is run on all brokers prior t
Slide 27: Underwriting Process (continued)
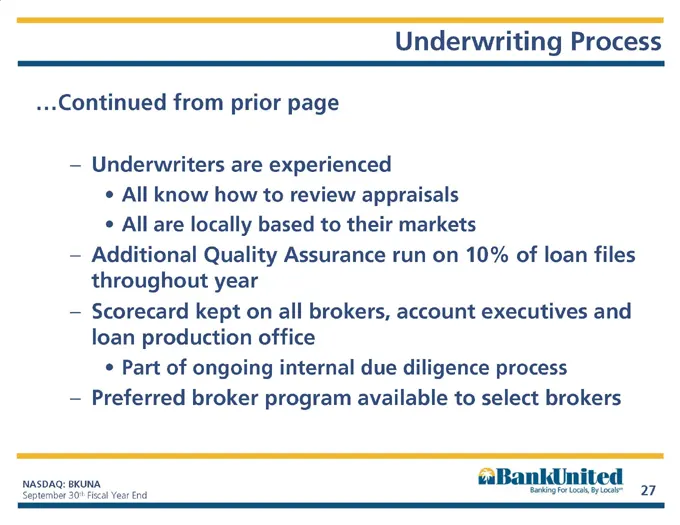
Underwriting Process Continued from prior page Underwriters are experienced All know how to review appraisals All are locally based to their markets Additional Quality Assurance run on 10% of loan files throughout year Scorecard kept on all brokers, account executives and loan production office Part
Slide 28: Asset Quality
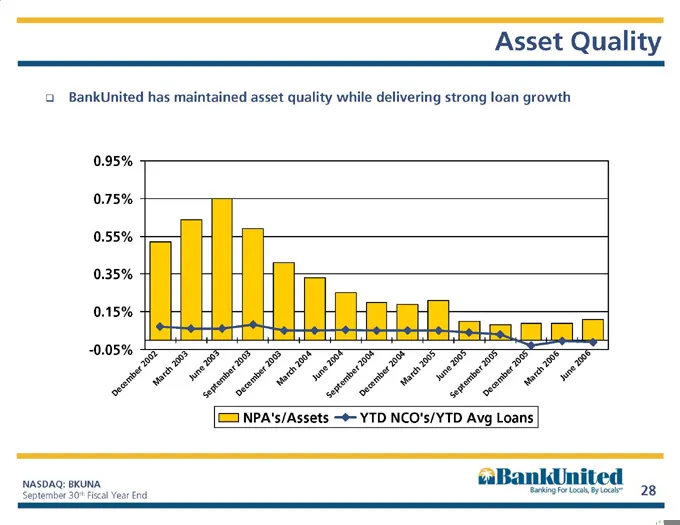
Asset Quality -0.05% 0.15% 0.35% 0.55% 0.75% 0.95% December 2002 March 2003 June 2003 September 2003 December 2003 March 2004 June 2004 September 2004 December 2004 March 2005 June 2005 September 2005 December 2005 March 2006 June 2006 NPA’s/Assets YTD NCO’s/YTD Avg Loans BankUnited has maintained a
Slide 29: MTA Option ARM – Positives for Borrower
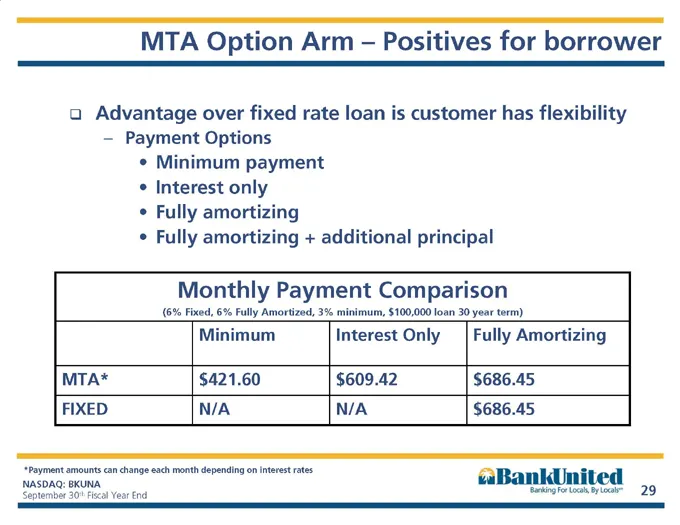
MTA Option Arm – Positives for borrower Advantage over fixed rate loan is customer has flexibility Payment Options Minimum payment Interest only Fully amortizing Fully amortizing + additional principal Fully Amortizing Interest Only Minimum $686.45 $686.45 N/A N/A FIXED $609.42 $421.60 MTA* Monthly
Slide 30: Negative Amortization
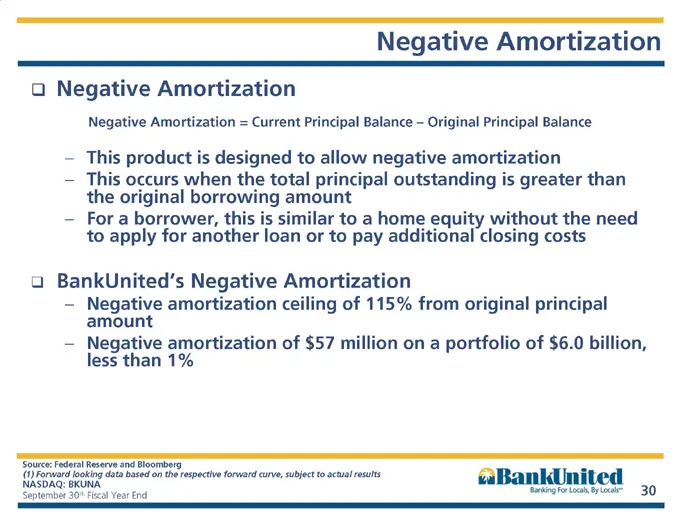
Negative Amortization Negative Amortization = Current Principal Balance – Original Principal Balance This product is designed to allow negative amortization This occurs when the total principal outstanding is greater than the original borrowing amount For a borrower, this is similar to a home equity
Slide 31: MTA Option ARM – Positives for Lender
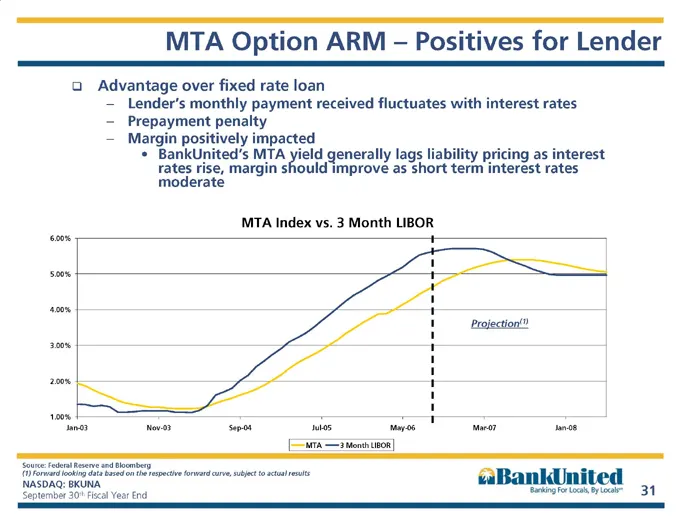
MTA Option ARM – Positives for Lender Advantage over fixed rate loan Lender’s monthly payment received fluctuates with interest rates Prepayment penalty Margin positively impacted • BankUnited’s MTA yield generally lags liability pricing as interest rates rise, margin should improve as short term in
Slide 32: Net Interest Margin Expansion
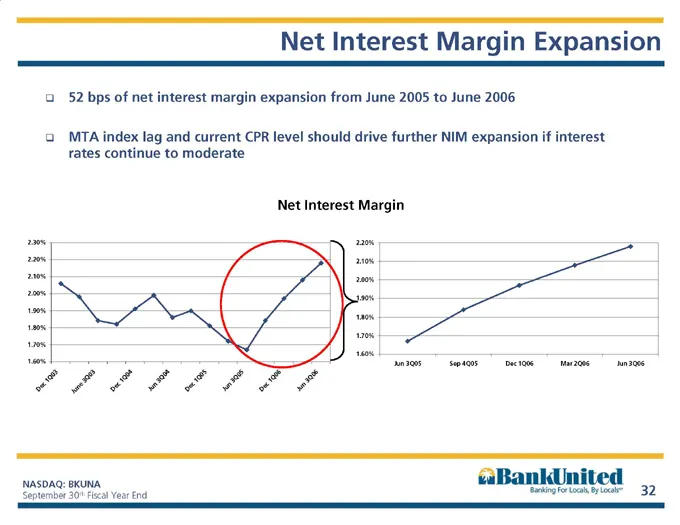
Net Interest Margin Expansion 52 bps of net interest margin expansion from June 2005 to June 2006 MTA index lag and current CPR level should drive further NIM expansion if interest rates continue to moderate 1.60% 1.70% 1.80% 1.90% 2.00% 2.10% 2.20% Jun 3Q05 Sep 4Q05 Dec 1Q06 Mar 2Q06 Jun 3Q06 Net I
Slide 33: Additional Financials
Additional Financials a «@BankUnited poh kt
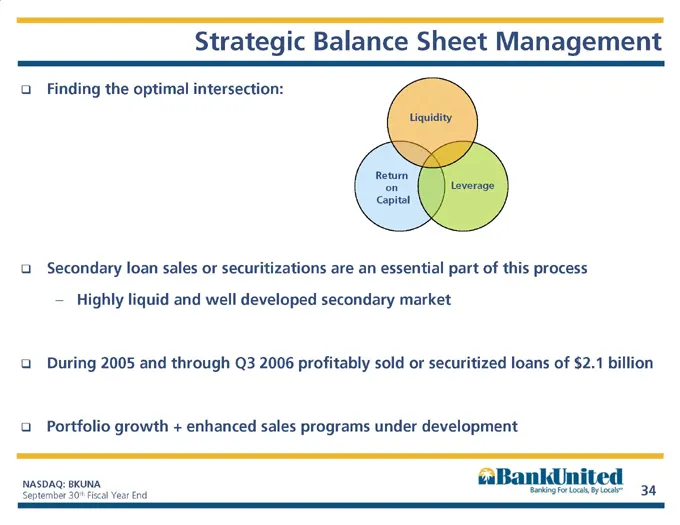
Slide 34: Strategic Balance Sheet Management
Strategic Balance Sheet Management Finding the optimal intersection: Secondary loan sales or securitizations are an essential part of this process Highly liquid and well developed secondary market During 2005 and through Q3 2006 profitably sold or securitized loans of $2.1 billion Portfolio growth +
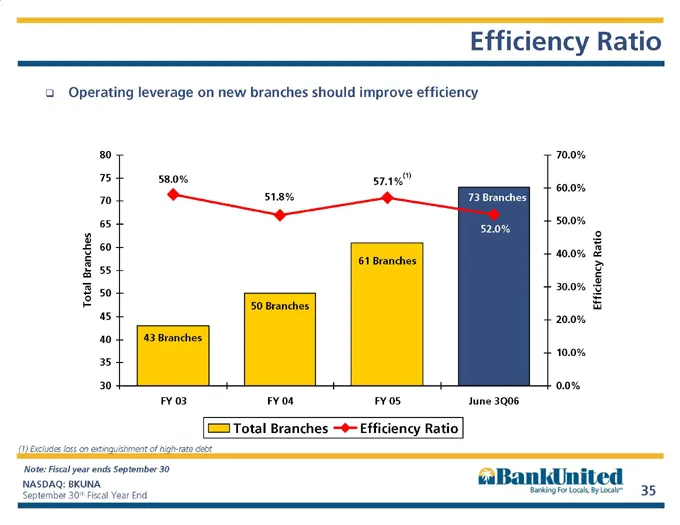
Slide 35: Branches and Efficiency Ratio
73 Branches 61 Branches 50 Branches 43 Branches 52.0% 57.1% (1) 51.8% 58.0% 30 35 40 45 50 55 60 65 70 75 80 FY 03 FY 04 FY 05 June 3Q06 Total Branches 0.0% 10.0% 20.0% 30.0% 40.0% 50.0% 60.0% 70.0% Efficiency Ratio Total Branches Efficiency Ratio Efficiency Ratio Operating leverage on new branches
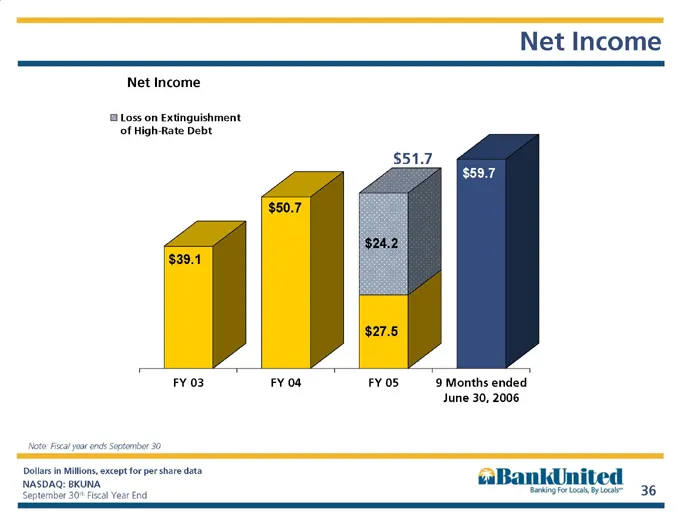
Slide 36: Net Income
September 30th Fiscal Year End 36 Net Income $39.1 $50.7 $27.5 $24.2 $59.7 FY 03 FY 04 FY 05 9 Months ended June 30, 2006 Loss on Extinguishment of High-Rate Debt $51.7 Dollars in Millions, except for per share data Net Income Note: Fiscal year ends September 30
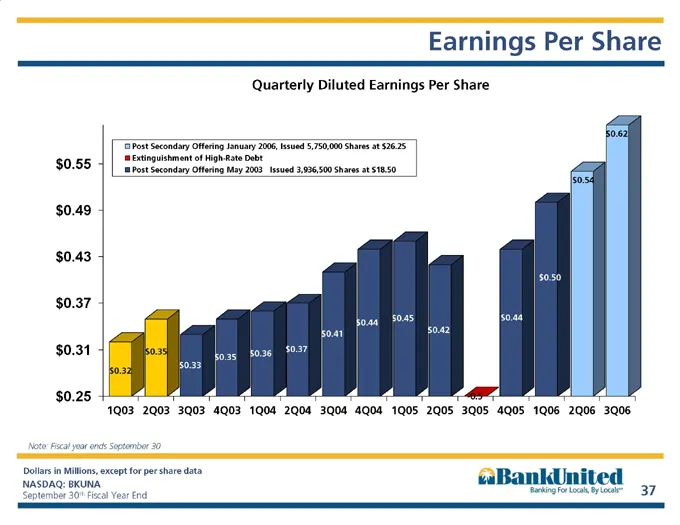
Slide 37: Earnings Per Share
September 30th Fiscal Year End 37 Earnings Per Share $0.32 $0.35 $0.33 $0.35 $0.36 $0.37 $0.41 $0.44 $0.45 $0.42 -0.5 $0.44 $0.50 $0.54 $0.62 $0.25 $0.31 $0.37 $0.43 $0.49 $0.55 1Q03 2Q03 3Q03 4Q03 1Q04 2Q04 3Q04 4Q04 1Q05 2Q05 3Q05 4Q05 1Q06 2Q06 3Q06 Post Secondary Offering January 2006, Issued 5,

Slide 38: Valuation
Valuation
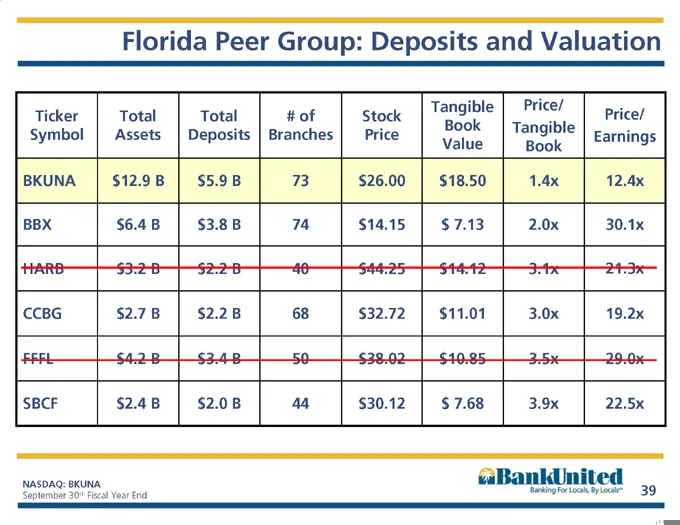
Slide 39: Florida Peer Group: Deposits and Valuation
Florida Peer Group: Deposits and Valuation 29.0x 3.5x $10.85 $38.02 50 $3.4 B $4.2 B FFFL 22.5x 3.9x $ 7.68 $30.12 44 $2.0 B $2.4 B SBCF 19.2x 21.3x 30.1x 12.4x Price/ Earnings 3.0x $11.01 $32.72 68 $2.2 B $2.7 B CCBG 3.1x $14.12 $44.25 40 $2.2 B $3.2 B HARB 2.0x $ 7.13 $14.15 74 $3.8 B $6.4 B BBX 1

Slide 40: BankUnited
«BankUnited
Source: SEC EDGAR · 8-K filed Sep 8, 2006
More decks from Bankunited Financial Corp
 Q3 2008 Earnings Presentation16 slides · Aug 11, 2008
 Investor Presentation (June 2008)27 slides · Jun 4, 2008
 Q2 FY2008 Earnings Presentation25 slides · May 12, 2008
 Q1 FY2008 Earnings Presentation22 slides · Jan 24, 2008
 Investor Day (February 2007)88 slides · Feb 26, 2007
 Investor Presentation (November 2006)38 slides · Nov 2, 2006