W. R. Grace & — Non-Deal Roadshow (February 2014)
20 slides from W. R. Grace &'s roadshow presentation, Feb 19, 2014
Slide 1: W. R. Grace & Co. Investor Meetings New York / Boston February 2014
W. R. Grace & Co. Investor Meetings New York / Boston February 2014 Hudson La Force Senior Vice President and Chief Financial Officer © 2014 W. R. Grace & Co.
Slide 2: Disclaimer: Safe Harbor Statement
2 © 2014 W. R. Grace & Co. Disclaimer Safe Harbor Statement under the Private Securities Litigation Reform Act of 1995 This presentation contains forward-looking statements, that is, information related to future, not past, events. Such statements generally include the words “believes,” “plans,” “in
Slide 3: Discussion Outline
3 © 2014 W. R. Grace & Co. Discussion Outline Overview • Fast Facts • Delivering Shareholder Value Segment Updates • Catalysts Technologies • Construction Products 2014 Outlook Strategy for Return of Capital Summary – Why Grace
Slide 4: Grace Fast Facts
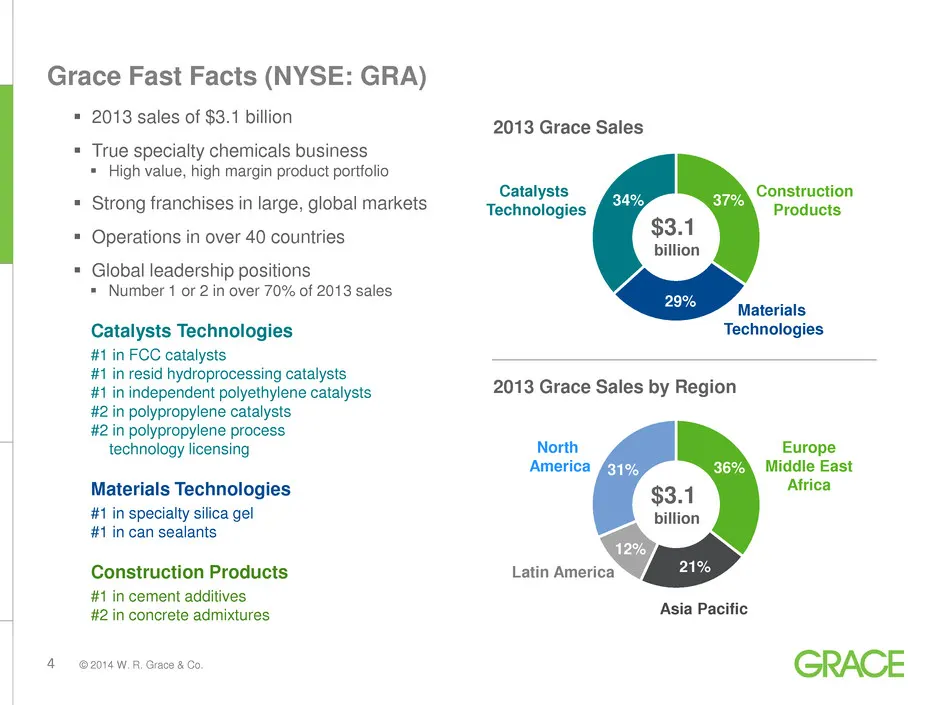
4 © 2014 W. R. Grace & Co. 36% 21% 12% 31% 37% 29% 34% Grace Fast Facts (NYSE: GRA) 2013 sales of $3.1 billion True specialty chemicals business High value, high margin product portfolio Strong franchises in large, global markets Operations in over 40 countries Global leadership position
Slide 5: Track Record of Increasing Profitability
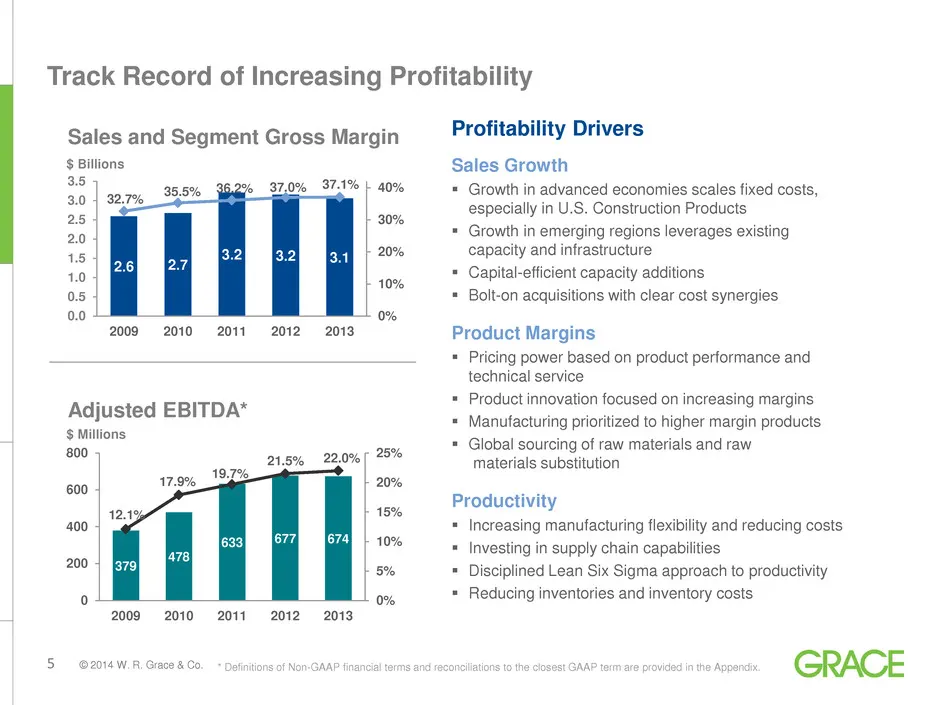
5 © 2014 W. R. Grace & Co. Track Record of Increasing Profitability * Definitions of Non-GAAP financial terms and reconciliations to the closest GAAP term are provided in the Appendix. 2.6 2.7 3.2 3.2 3.1 32.7% 35.5% 36.2% 37.0% 37.1% 0% 10% 20% 30% 40% 0.0 0.5 1.0 1.5 2.0 2.5 3.0 3.5 2009 2010 2011
Slide 6: We Deliver Shareholder Value Through Three Financial Levers
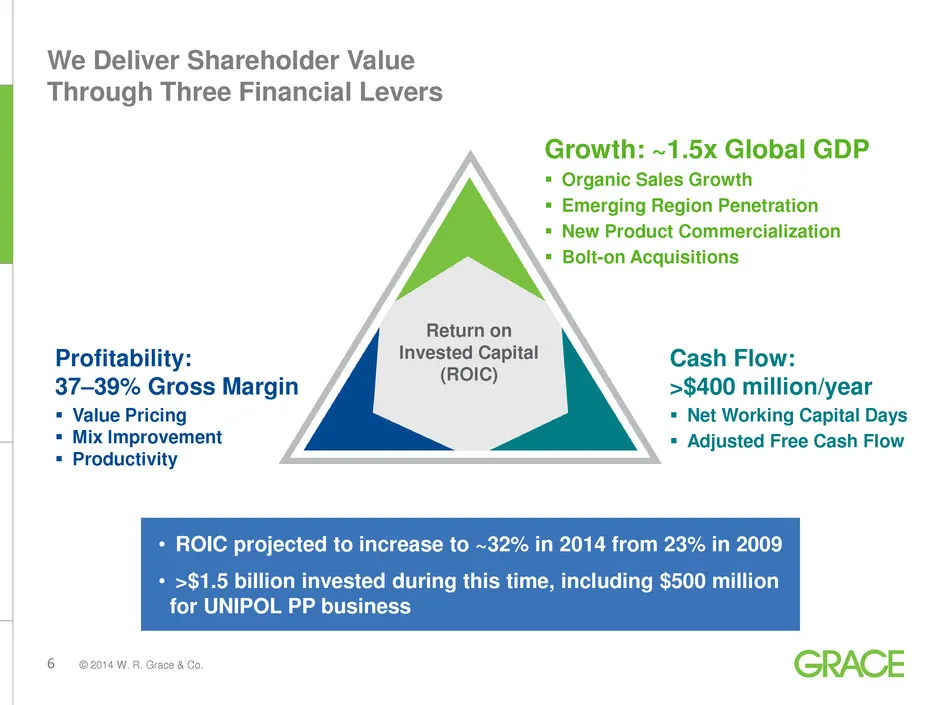
6 © 2014 W. R. Grace & Co. • ROIC projected to increase to ~32% in 2014 from 23% in 2009 • >$1.5 billion invested during this time, including $500 million for UNIPOL PP business We Deliver Shareholder Value Through Three Financial Levers Growth: ~1.5x Global GDP Organic Sales Growth Emerging Reg
Slide 7: Catalysts Technologies: Application
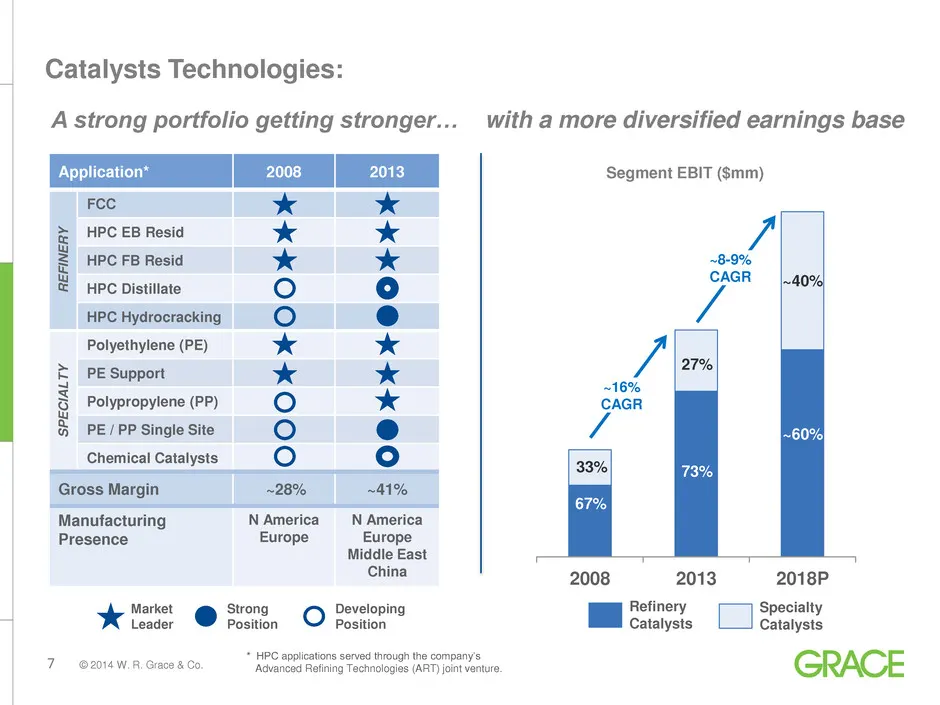
7 © 2014 W. R. Grace & Co. Catalysts Technologies: Application* 2008 2013 R E F IN E R Y FCC HPC EB Resid HPC FB Resid HPC Distillate HPC Hydrocracking S P E CIA L T Y Polyethylene (PE) PE Support Polypropylene (PP) PE / PP Single Site Chemical Catalysts Gross Margin ~28% ~41% Manufacturing Presence
Slide 8: Polyolefin catalyst franchise history and UNIPOL PP acquisition
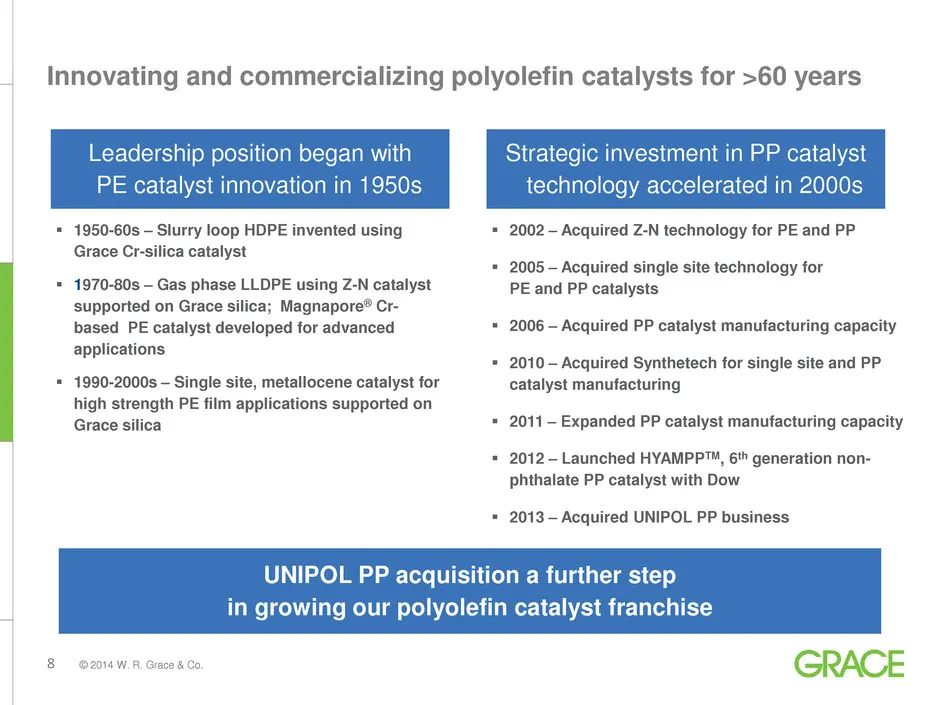
8 © 2014 W. R. Grace & Co. 1950-60s – Slurry loop HDPE invented using Grace Cr-silica catalyst 1970-80s – Gas phase LLDPE using Z-N catalyst supported on Grace silica; Magnapore® Cr- based PE catalyst developed for advanced applications 1990-2000s – Single site, metallocene catalyst for high s
Slide 9: Polypropylene Catalysts – Market and Technology Position
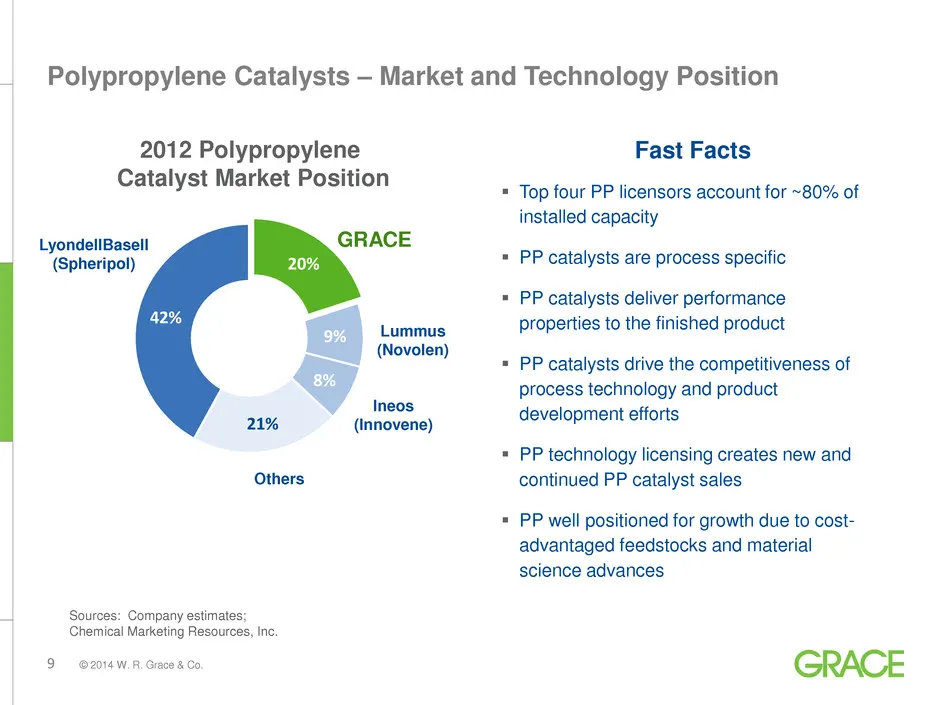
9 © 2014 W. R. Grace & Co. Polypropylene Catalysts – Market and Technology Position Fast Facts Top four PP licensors account for ~80% of installed capacity PP catalysts are process specific PP catalysts deliver performance properties to the finished product PP catalysts drive the competitive
Slide 10: Construction Products – Leveraging Secular Drivers for Improved Performance
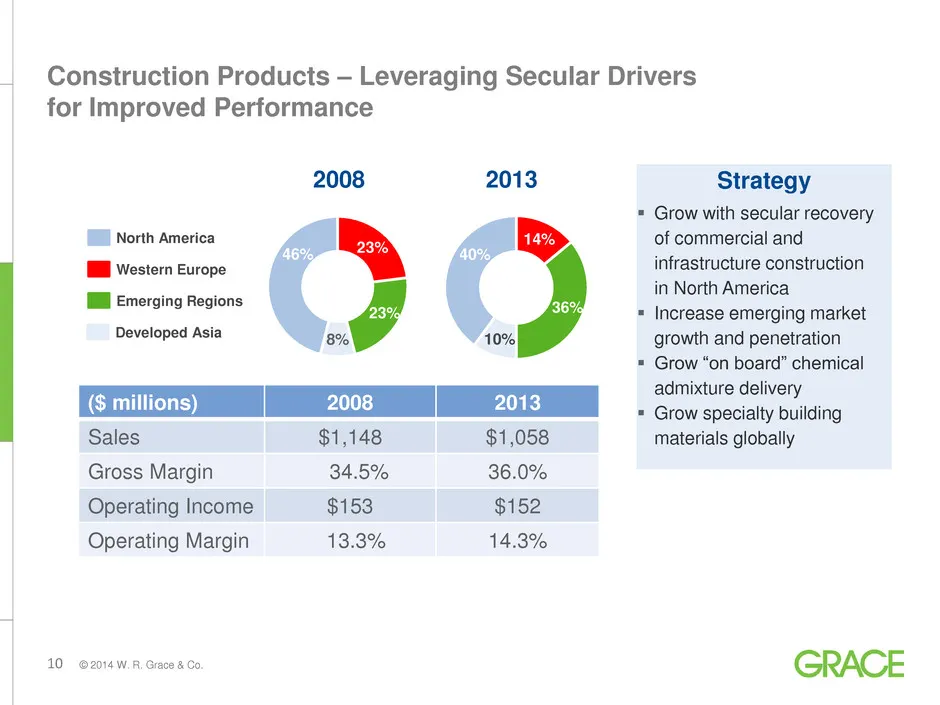
10 © 2014 W. R. Grace & Co. Strategy Grow with secular recovery of commercial and infrastructure construction in North America Increase emerging market growth and penetration Grow “on board” chemical admixture delivery Grow specialty building materials globally Construction Products – Levera
Slide 11: Construction Products earnings improvement driven by operating leverage
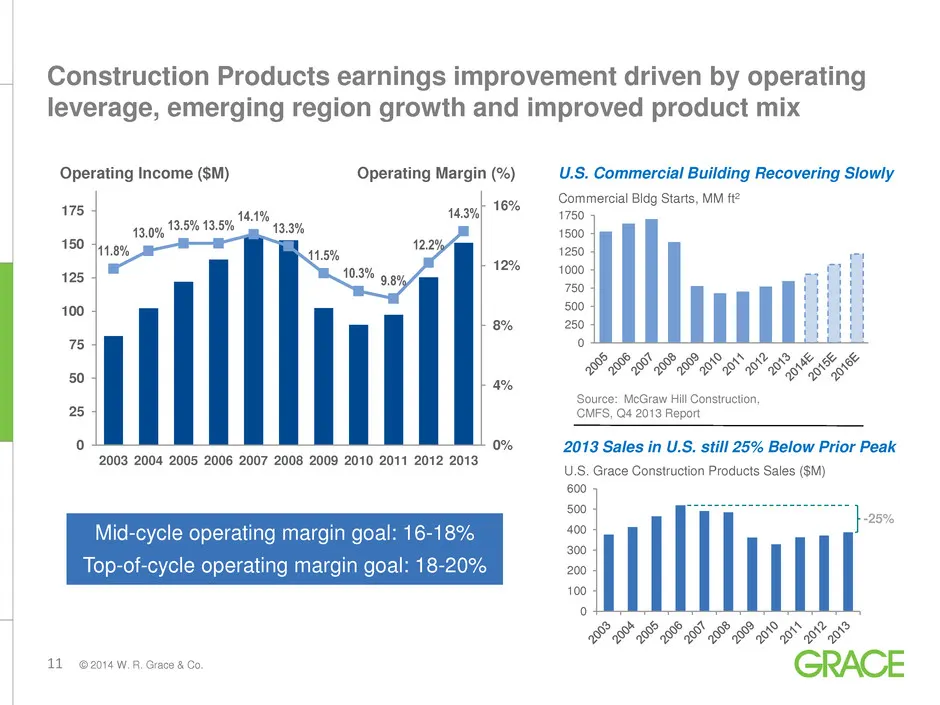
11 © 2014 W. R. Grace & Co. Construction Products earnings improvement driven by operating leverage, emerging region growth and improved product mix 11.8% 13.0% 13.5% 13.5% 14.1% 13.3% 11.5% 10.3% 9.8% 12.2% 14.3% 0% 4% 8% 12% 16% 0 25 50 75 100 125 150 175 2003 2004 2005 2006 2007 2008 2009 2010 20
Slide 12: 2014 Outlook
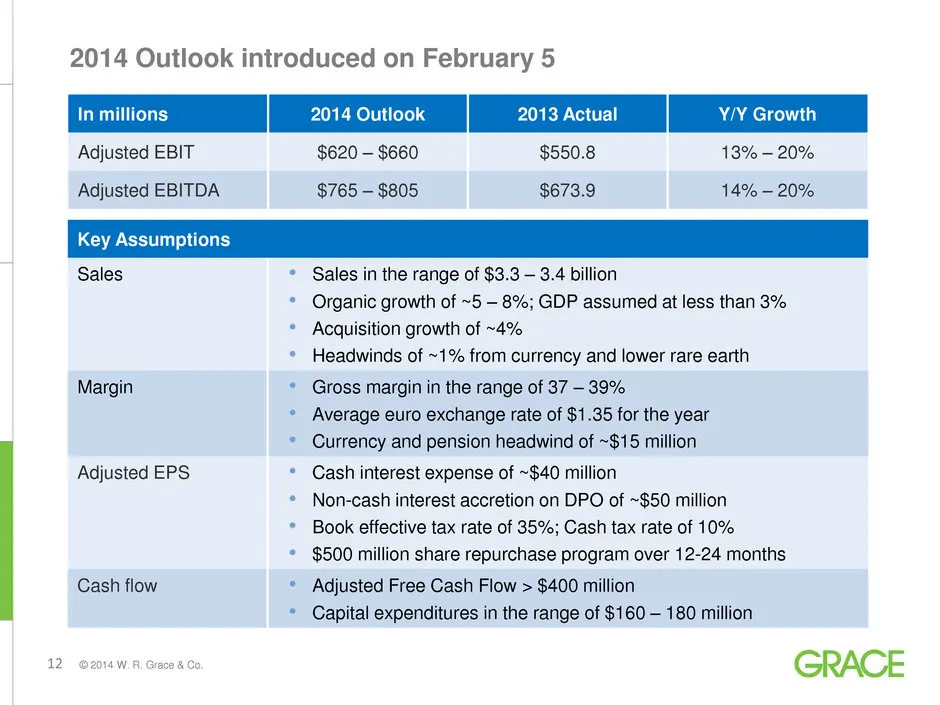
12 © 2014 W. R. Grace & Co. In millions 2014 Outlook 2013 Actual Y/Y Growth Adjusted EBIT $620 – $660 $550.8 13% – 20% Adjusted EBITDA $765 – $805 $673.9 14% – 20% 2014 Outlook introduced on February 5 Key Assumptions Sales • Sales in the range of $3.3 – 3.4 billion • Organic growth of ~5 – 8%; GDP
Slide 13: 2014 Adjusted EBIT Outlook
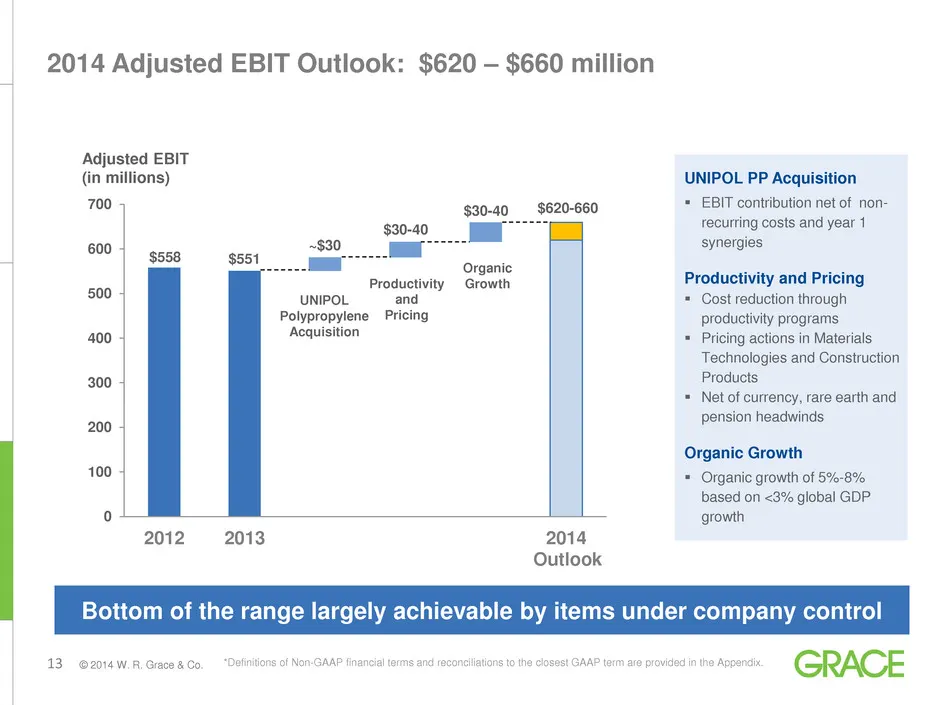
13 © 2014 W. R. Grace & Co. UNIPOL PP Acquisition EBIT contribution net of non- recurring costs and year 1 synergies Productivity and Pricing Cost reduction through productivity programs Pricing actions in Materials Technologies and Construction Products Net of currency, rare earth and pensi
Slide 14: Financial Strength to Grow Top Line and Increase Total Shareholder Return
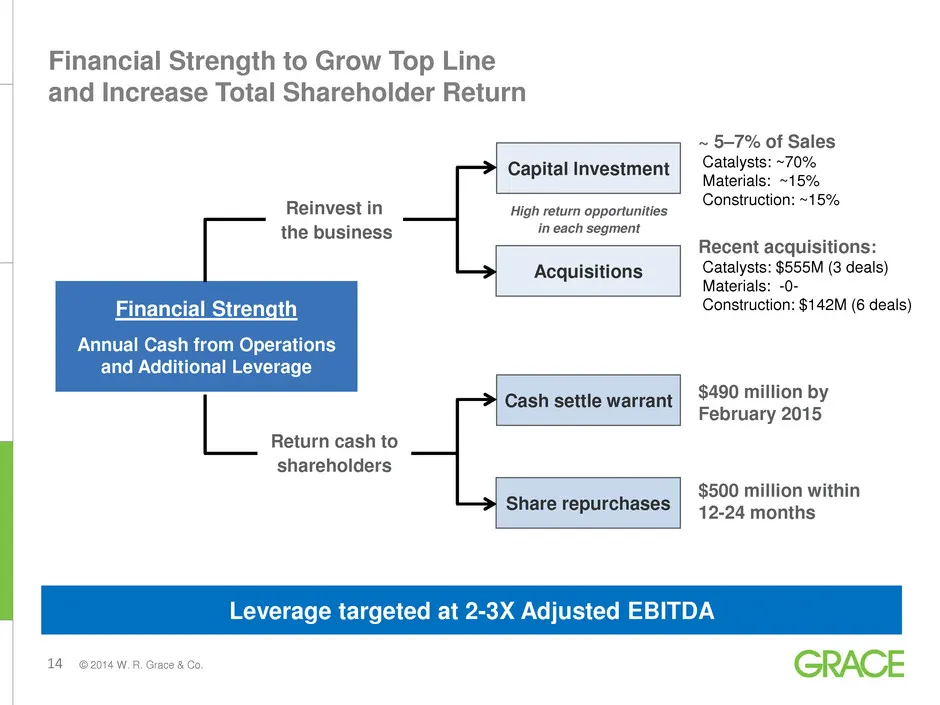
14 © 2014 W. R. Grace & Co. Capital Investment Acquisitions ~ 5–7% of Sales Catalysts: ~70% Materials: ~15% Construction: ~15% Recent acquisitions: Catalysts: $555M (3 deals) Materials: -0- Construction: $142M (6 deals) Financial Strength to Grow Top Line and Increase Total Shareholder Return $490 m
Slide 15: Adjusted EPS: Repurchase program and DPO impact
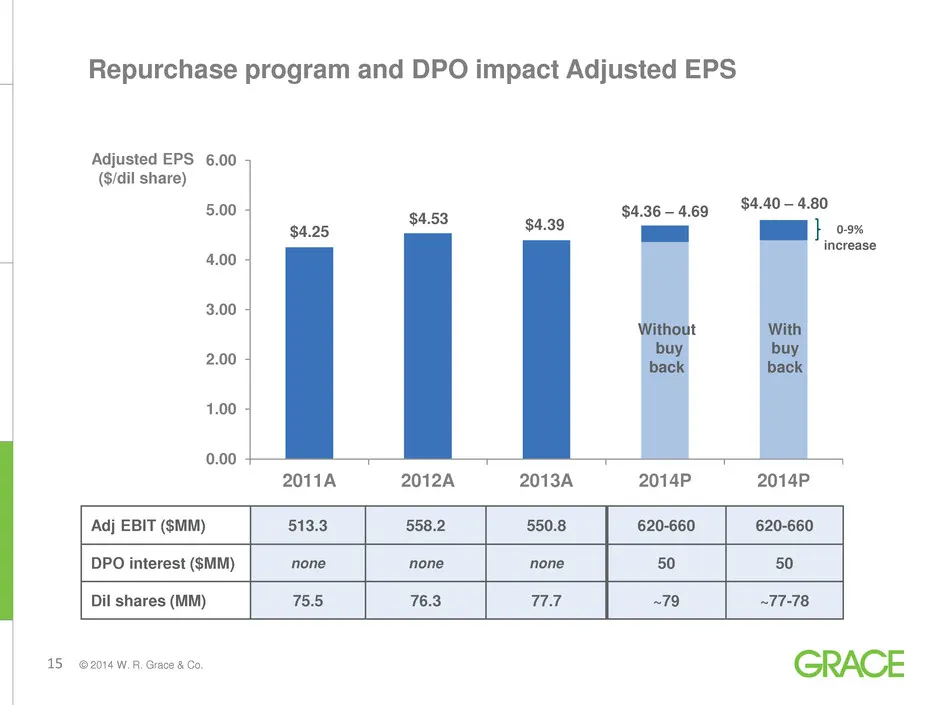
15 © 2014 W. R. Grace & Co. 0.00 1.00 2.00 3.00 4.00 5.00 6.00 2011A 2012A 2013A 2014P 2014P Adj EBIT ($MM) 513.3 558.2 550.8 620-660 620-660 DPO interest ($MM) none none none 50 50 Dil shares (MM) 75.5 76.3 77.7 ~79 ~77-78 $4.25 $4.53 $4.39 $4.36 – 4.69 $4.40 – 4.80 Repurchase program and DPO impac
Slide 16: Summary – Why Grace?
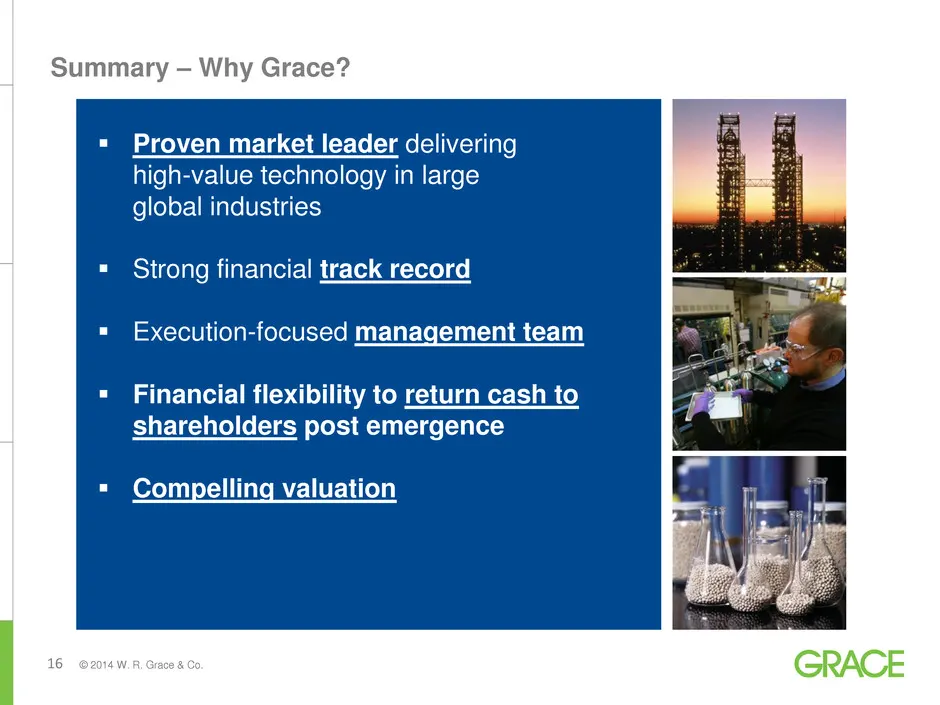
16 © 2014 W. R. Grace & Co. Summary – Why Grace? Proven market leader delivering high-value technology in large global industries Strong financial track record Execution-focused management team Financial flexibility to return cash to shareholders post emergence Compelling valuation

Slide 17: Contact information
17 © 2014 W. R. Grace & Co. For additional information, please visit www.grace.com or contact: J. Mark Sutherland Vice President, Investor Relations +1 410.531.4590 [email protected] David Joseph Finance Manager, Investor Relations +1 410.531.4590 [email protected]
Slide 18: Appendix I: Valuation Considerations After Emergence
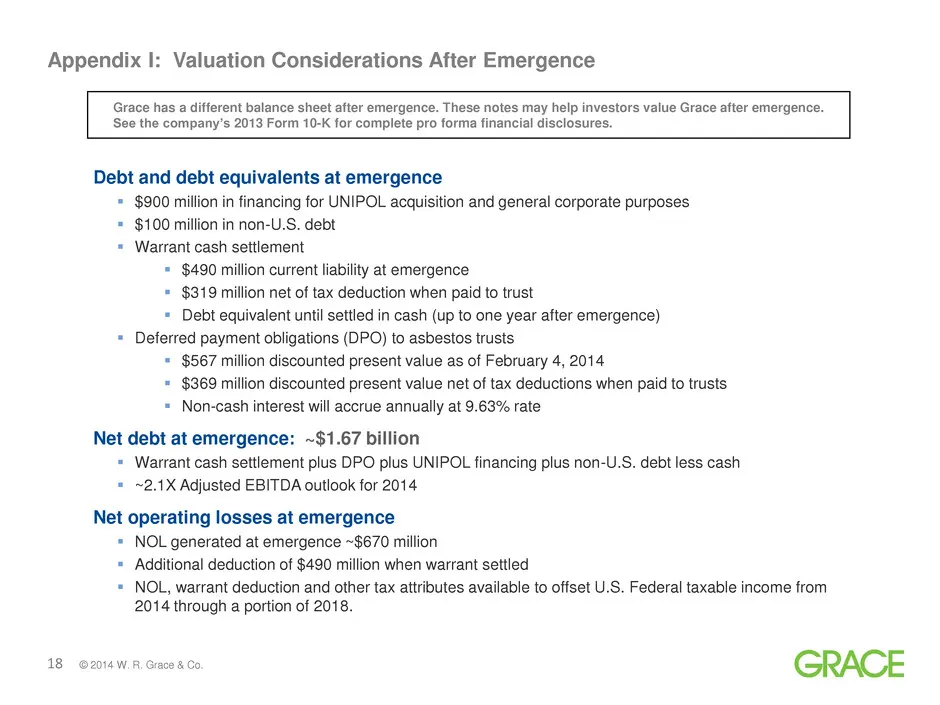
18 © 2014 W. R. Grace & Co. Appendix I: Valuation Considerations After Emergence Grace has a different balance sheet after emergence. These notes may help investors value Grace after emergence. See the company’s 2013 Form 10-K for complete pro forma financial disclosures. Debt and debt equivalents a
Slide 19: Appendix II: Definitions and Reconciliations of Non-GAAP Measures
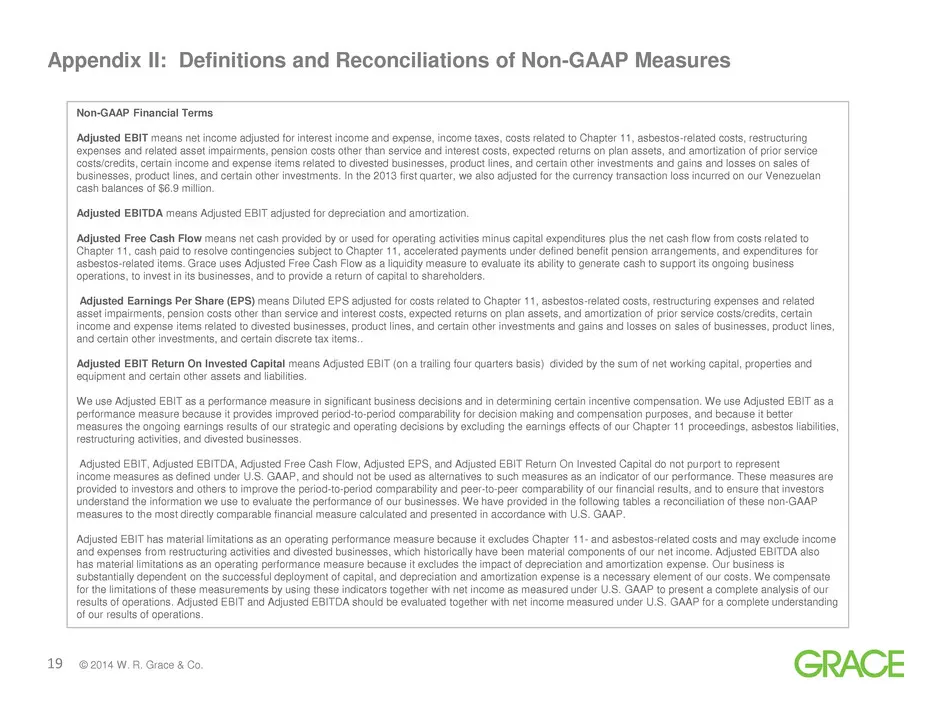
19 © 2014 W. R. Grace & Co. Appendix II: Definitions and Reconciliations of Non-GAAP Measures Non-GAAP Financial Terms Adjusted EBIT means net income adjusted for interest income and expense, income taxes, costs related to Chapter 11, asbestos-related costs, restructuring expenses and related asset
Slide 20: Appendix III: Reconciliation of Adjusted EBITDA to Net Income
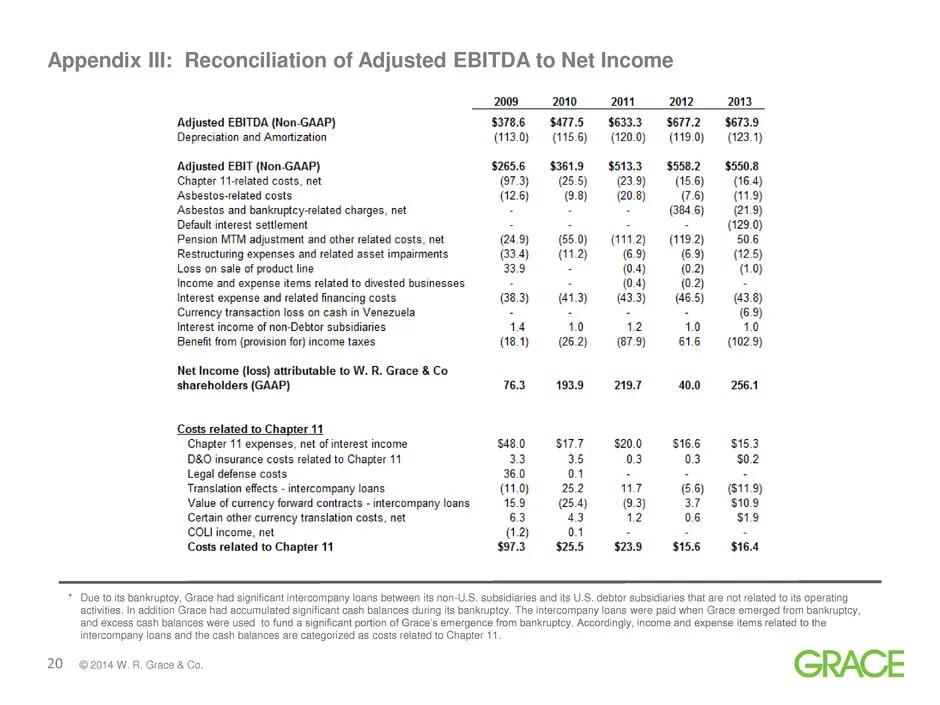
20 © 2014 W. R. Grace & Co. Appendix III: Reconciliation of Adjusted EBITDA to Net Income * Due to its bankruptcy, Grace had significant intercompany loans between its non-U.S. subsidiaries and its U.S. debtor subsidiaries that are not related to its operating activities. In addition Grace had accum
Source: SEC EDGAR · 8-K filed Feb 19, 2014
More decks from W. R. Grace & Co
 Merger or Acquisition (February 2021)11 slides · Feb 26, 2021
 Investor Presentation (September 2020)27 slides · Sep 17, 2020
 Investor Presentation (August 2020)25 slides · Aug 26, 2020
 Investor Presentation (February 2020)25 slides · Feb 11, 2020
 Credit Suisse Basic Materials Conference 201922 slides · Sep 10, 2019
 Deutsche Bank Annual Global Industrials & Materials Summit 201920 slides · Jun 6, 2019