W. R. Grace & — Investor Presentation (February 2020)
25 slides from W. R. Grace &'s investor presentation, Feb 11, 2020
Slide 1: Investor Presentation February 10, 2020
Investor Presentation February 10, 2020
Slide 2: Disclaimer Statement Regarding Safe Harbor For Forward-Looking Statements
Disclaimer Statement Regarding Safe Harbor For Forward-Looking Statements This announcement contains forward-looking statements, that is, information related to future, not past, events. Such statements generally include the words “believes,” “plans,” “intends,” “targets,” “will,” “expects,” “sugges

Slide 3: About Grace
About Grace GRACE Talent | Technology | Trust
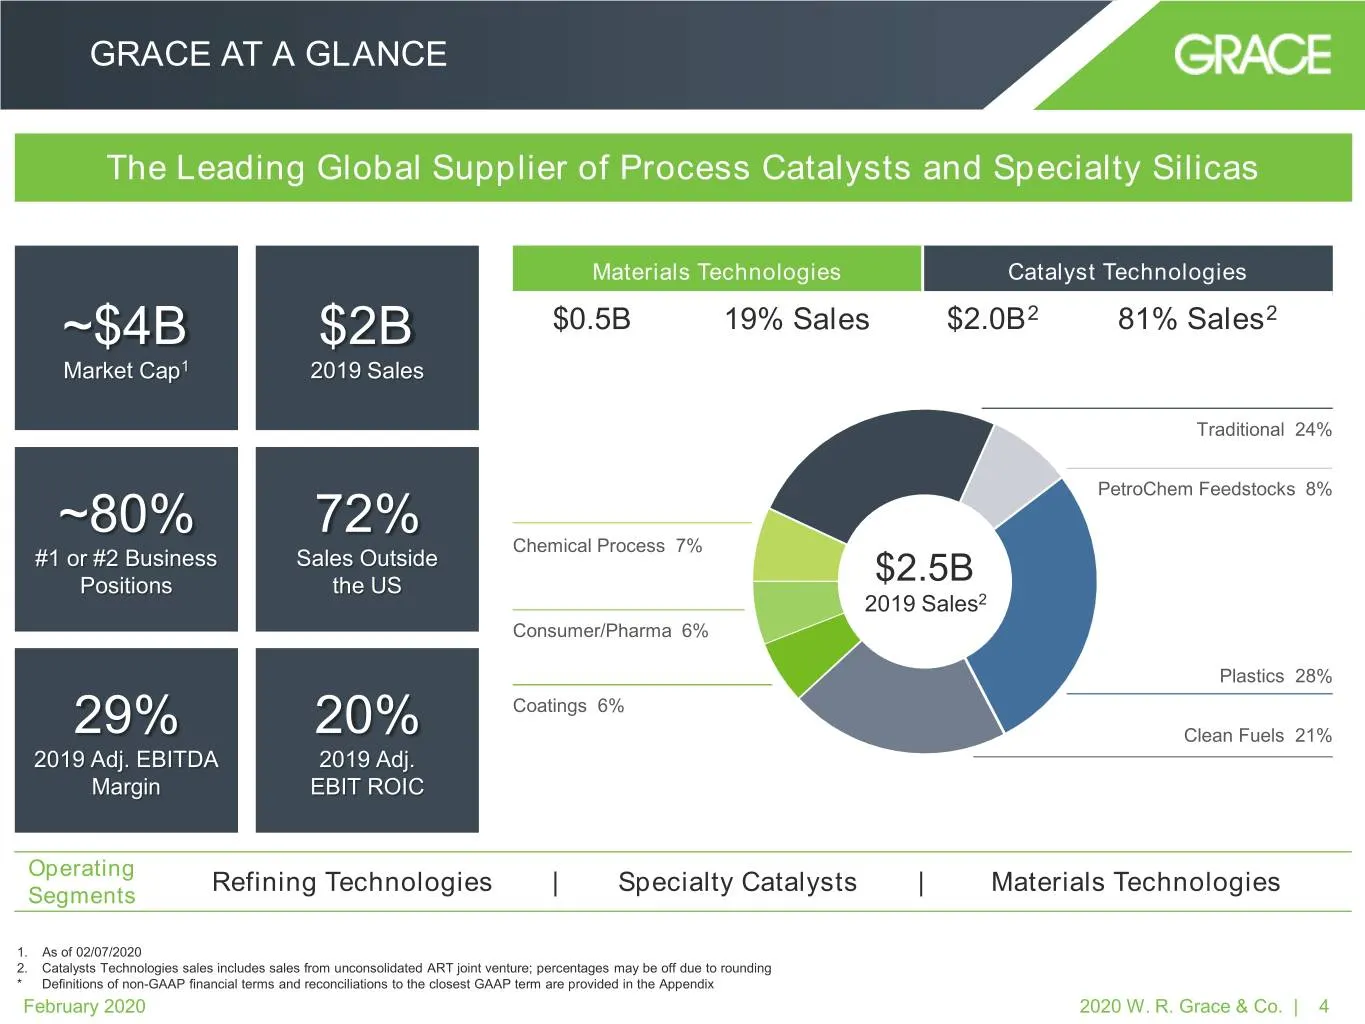
Slide 4: Grace at a Glance
GRACE AT A GLANCE The Leading Global Supplier of Process Catalysts and Specialty Silicas Materials Technologies Catalyst Technologies ~$4B $2B $0.5B 19% Sales $2.0B2 81% Sales2 Market Cap1 2019 Sales Traditional 24% PetroChem Feedstocks 8% ~80% 72% Chemical Process 7% #1 or #2 Business Sales Outside
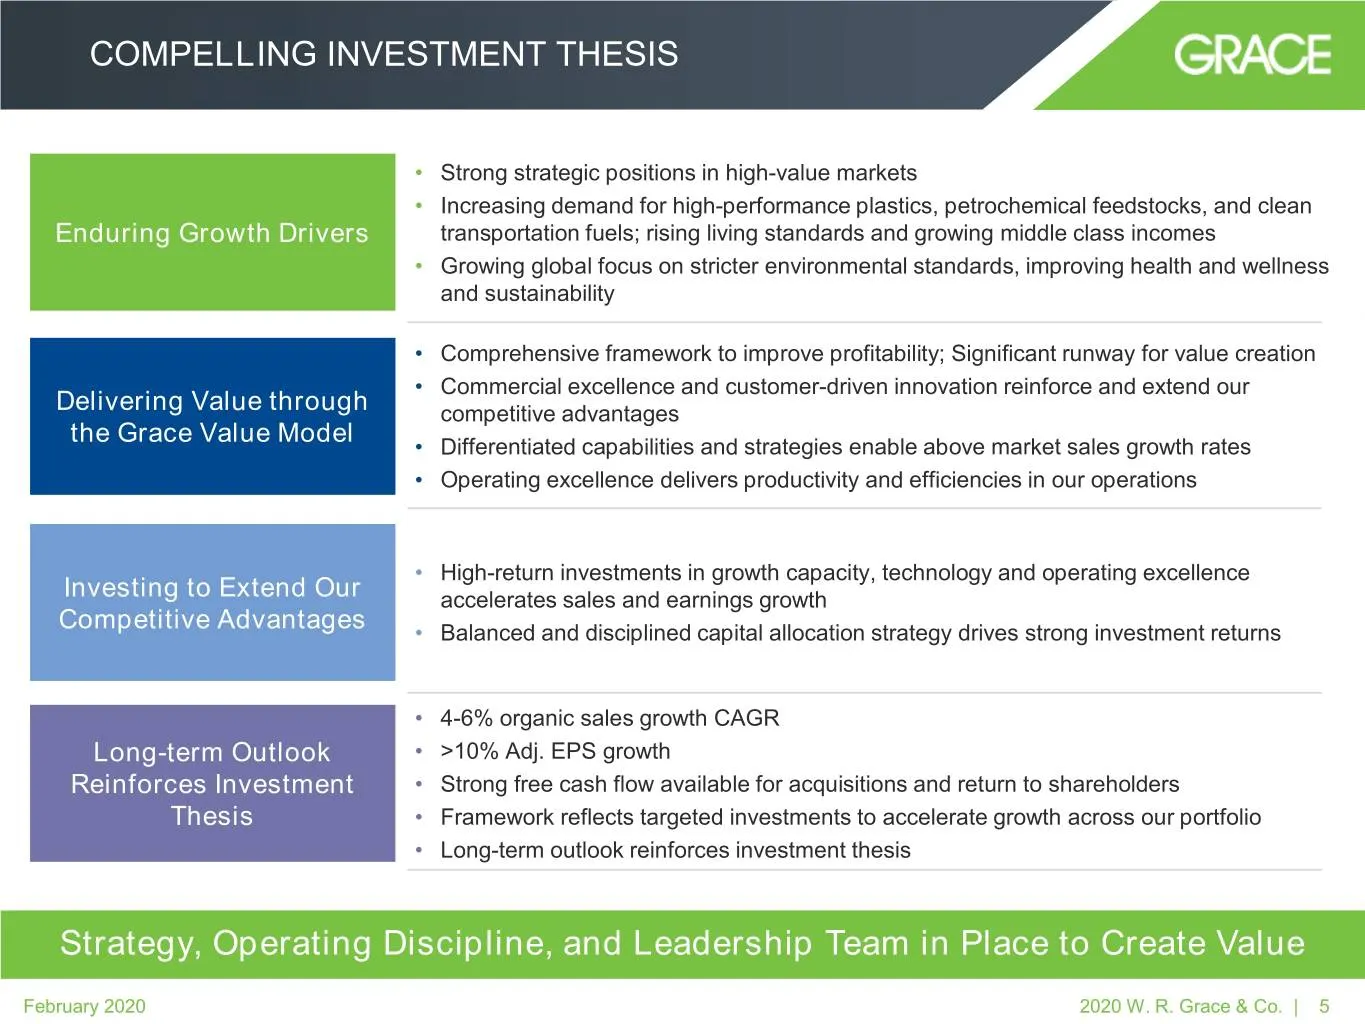
Slide 5: Compelling Investment Thesis
COMPELLING INVESTMENT THESIS • Strong strategic positions in high-value markets • Increasing demand for high-performance plastics, petrochemical feedstocks, and clean Enduring Growth Drivers transportation fuels; rising living standards and growing middle class incomes • Growing global focus on stri
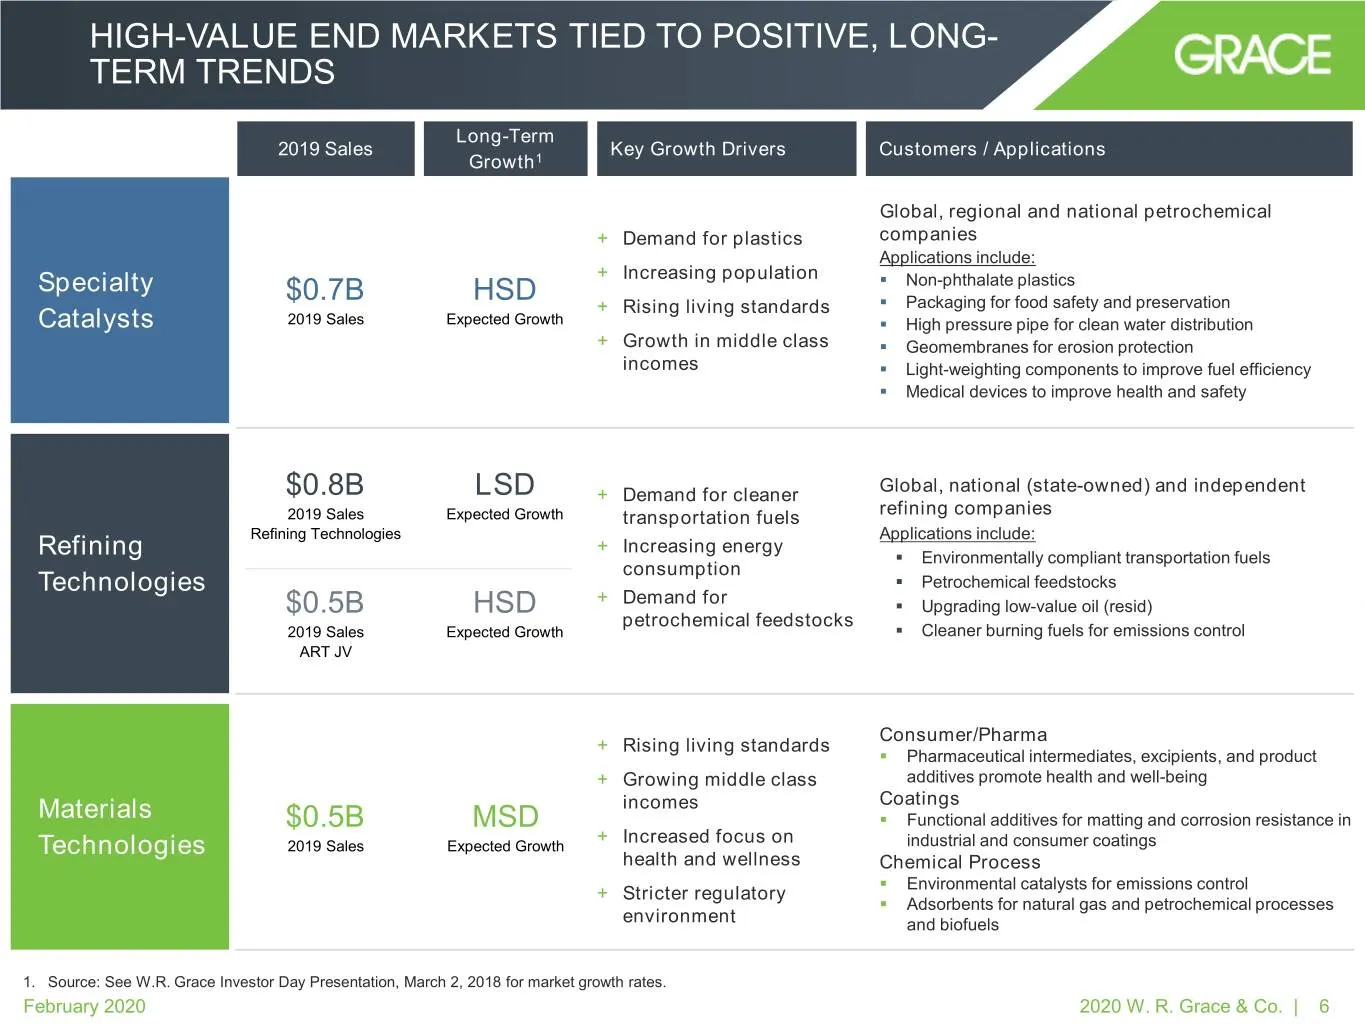
Slide 6: High-Value End Markets Tied to Positive, Long-Term Trends
HIGH-VALUE END MARKETS TIED TO POSITIVE, LONG- TERM TRENDS Long-Term 2019 Sales Key Growth Drivers Customers / Applications Growth1 Global, regional and national petrochemical + Demand for plastics companies Applications include: Specialty + Increasing population . Non-phthalate plastics $0.7B HSD +
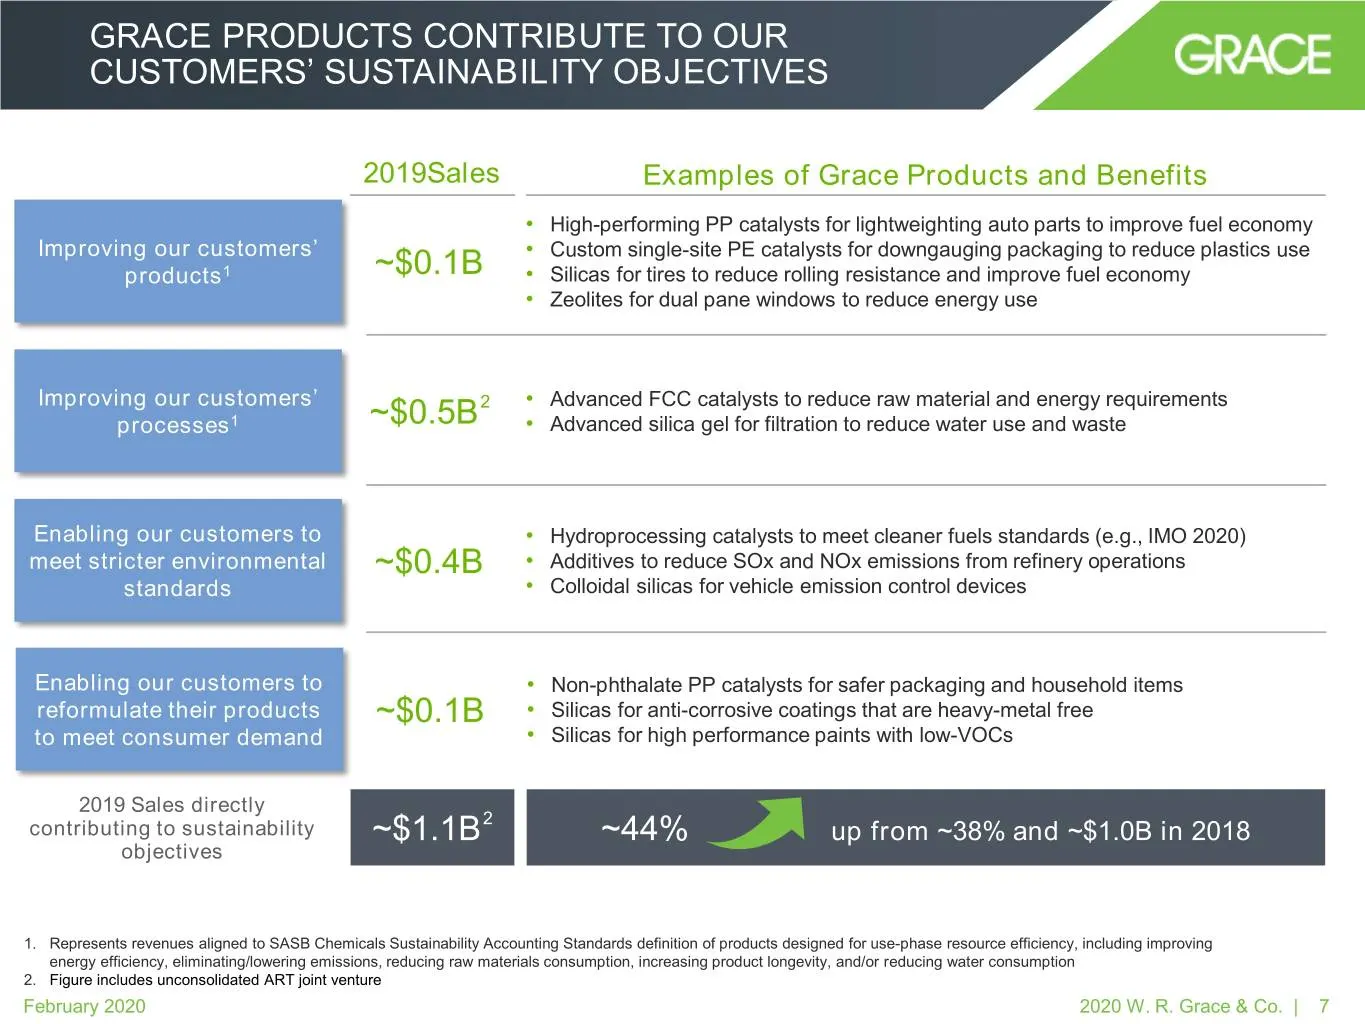
Slide 7: Grace Products Contribute to Our Customers' Sustainability Objectives
GRACE PRODUCTS CONTRIBUTE TO OUR CUSTOMERS’ SUSTAINABILITY OBJECTIVES 2019Sales Examples of Grace Products and Benefits • High-performing PP catalysts for lightweighting auto parts to improve fuel economy Improving our customers’ • Custom single-site PE catalysts for downgauging packaging to reduce
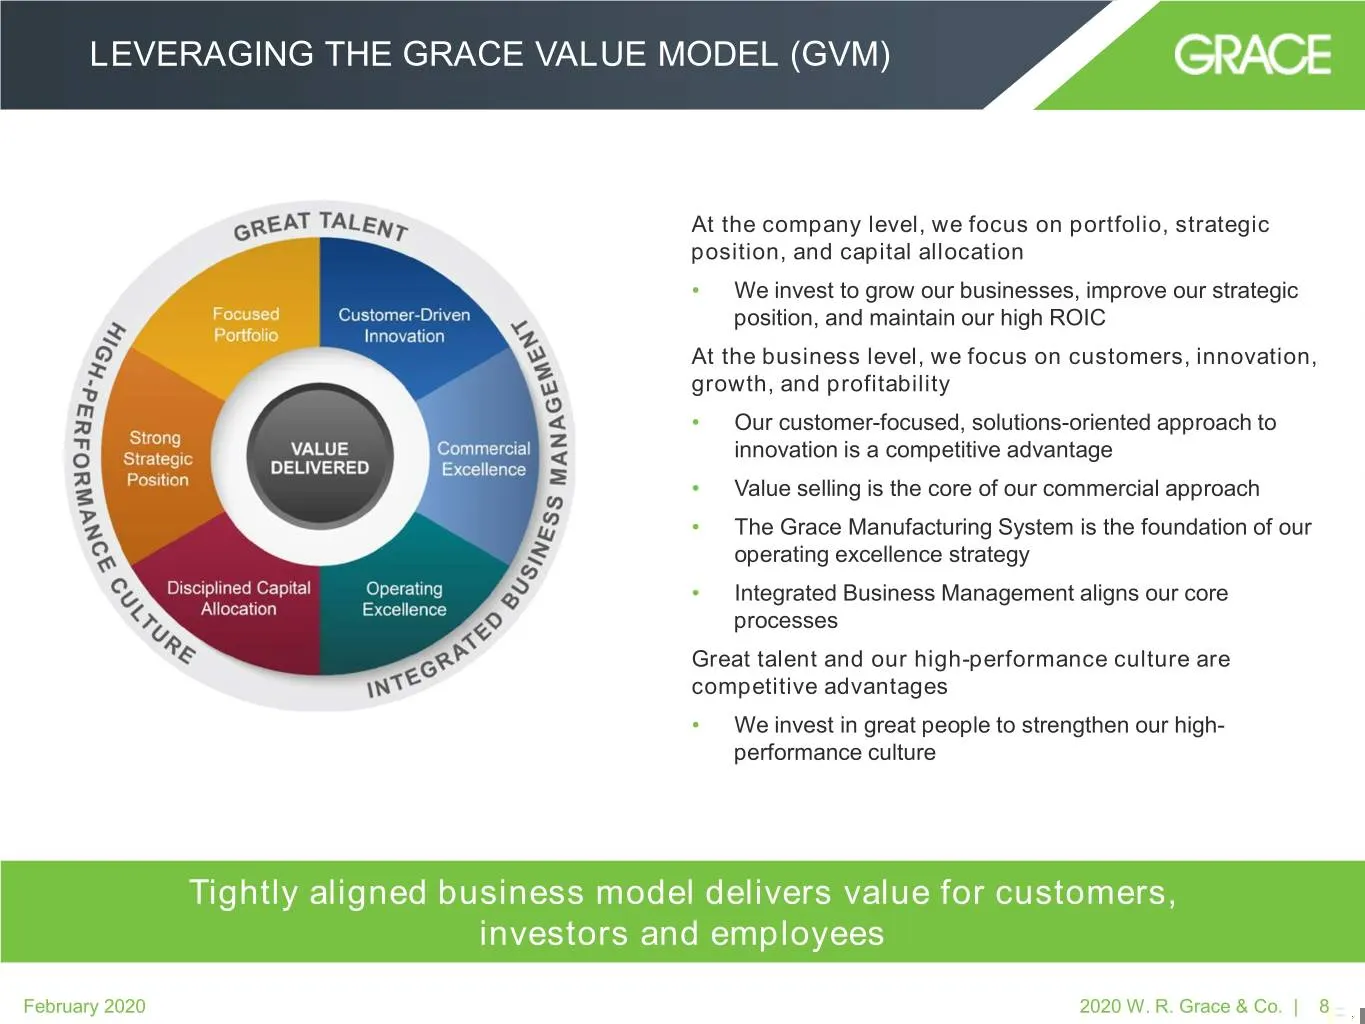
Slide 8: Leveraging the Grace Value Model (GVM)
LEVERAGING THE GRACE VALUE MODEL (GVM) At the company level, we focus on portfolio, strategic position, and capital allocation • We invest to grow our businesses, improve our strategic position, and maintain our high ROIC At the business level, we focus on customers, innovation, growth, and profitab
Slide 9: 2019 Financial Results & 2020 Outlook and Guidance Bridges
2019 Financial Results & 2020 Outlook and Guidance Bridges 9
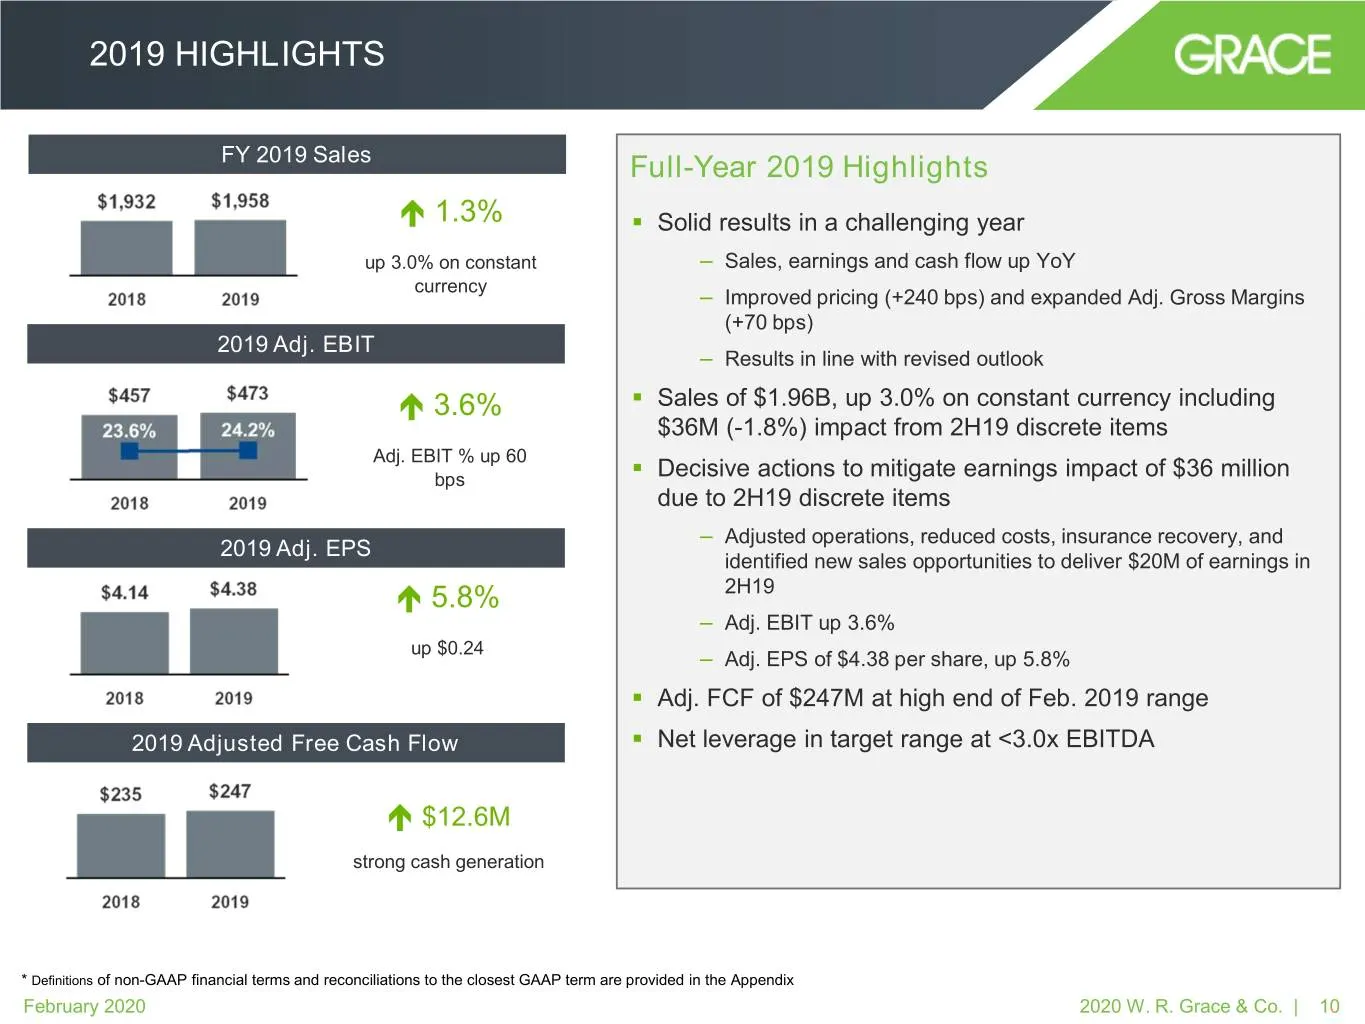
Slide 10: 2019 Highlights
2019 HIGHLIGHTS FY 2019 Sales Full-Year 2019 Highlights 1.3% . Solid results in a challenging year up 3.0% on constant – Sales, earnings and cash flow up YoY currency – Improved pricing (+240 bps) and expanded Adj. Gross Margins (+70 bps) 2019 Adj. EBIT – Results in line with revised outlook 3.6
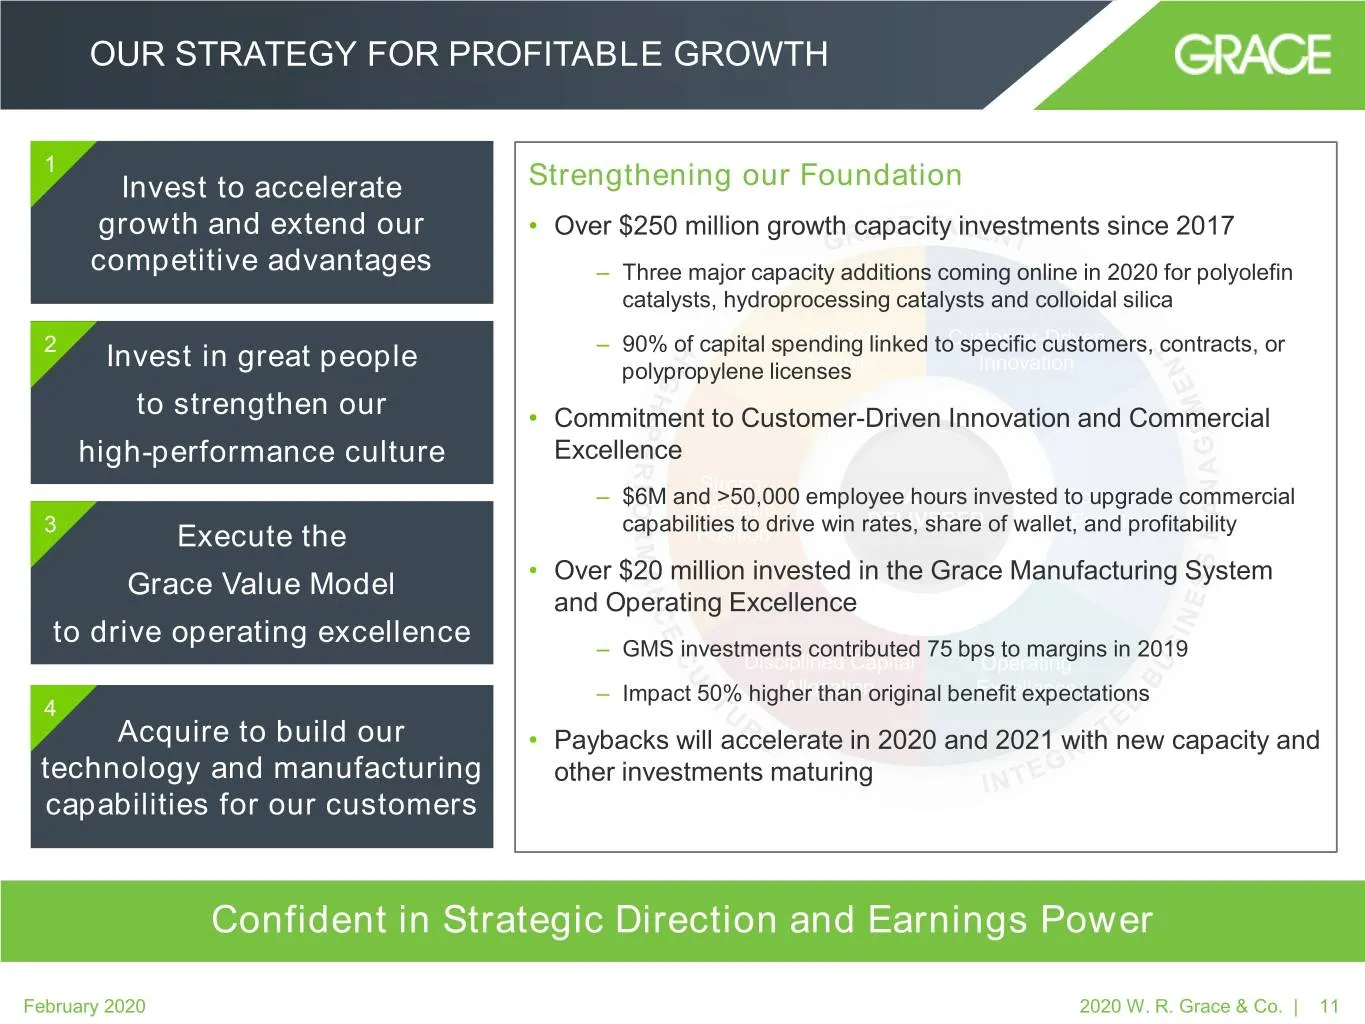
Slide 11: Our Strategy for Profitable Growth
OUR STRATEGY FOR PROFITABLE GROWTH 1 Invest to accelerate Strengthening our Foundation growth and extend our • Over $250 million growth capacity investments since 2017 competitive advantages – Three major capacity additions coming online in 2020 for polyolefin catalysts, hydroprocessing catalysts an
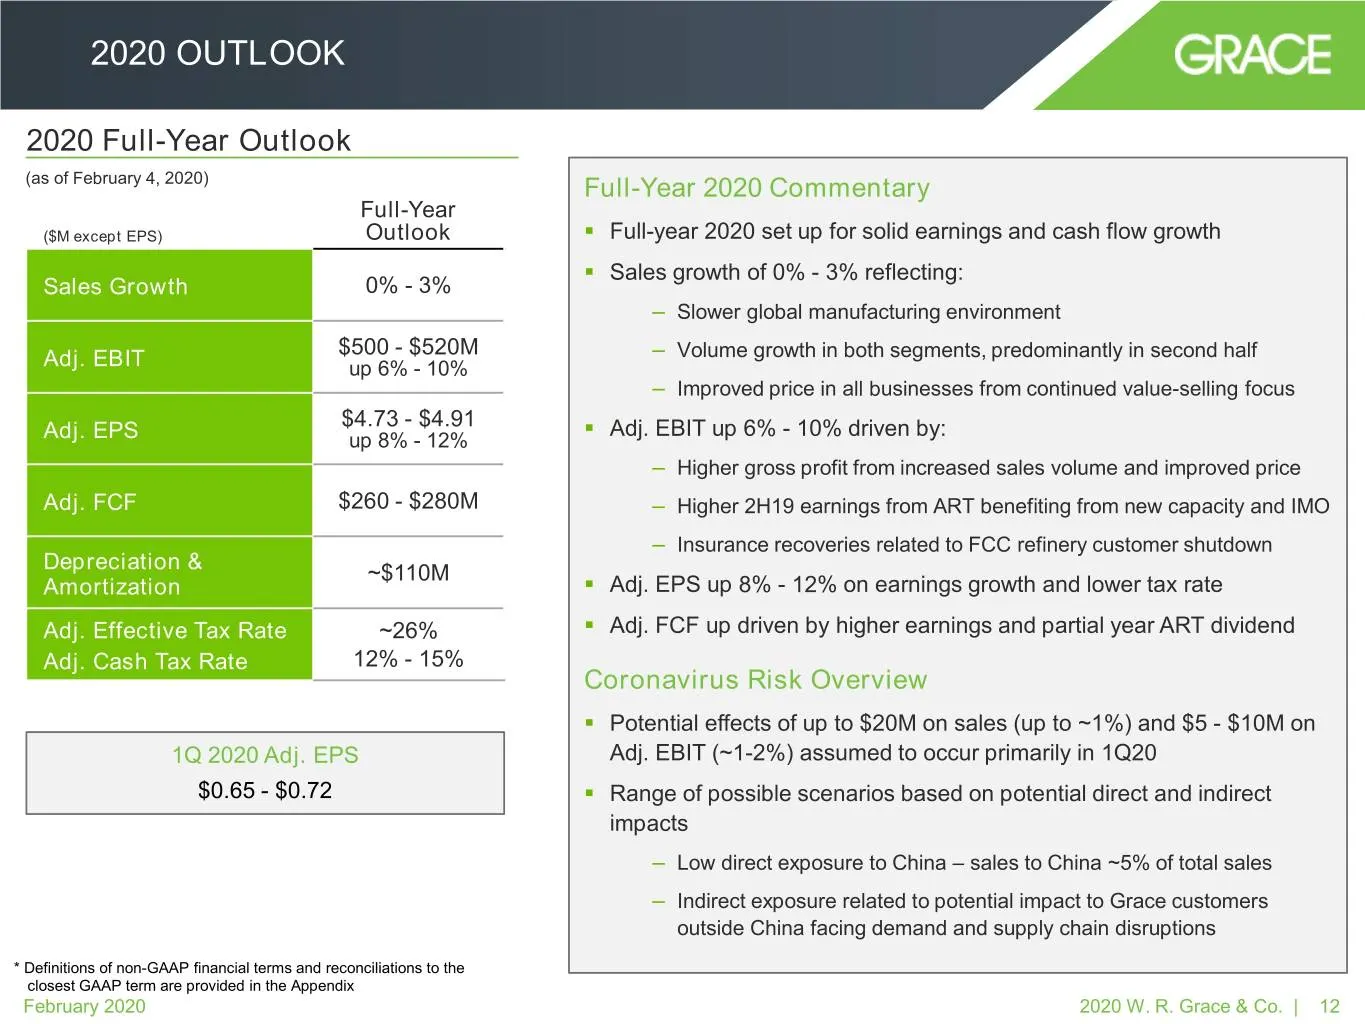
Slide 12: 2020 Outlook
2020 OUTLOOK 2020 Full-Year Outlook (as of February 4, 2020) Full-Year 2020 Commentary Full-Year ($M except EPS) Outlook . Full-year 2020 set up for solid earnings and cash flow growth . Sales growth of 0% - 3% reflecting: Sales Growth 0% - 3% – Slower global manufacturing environment $500 - $520M –
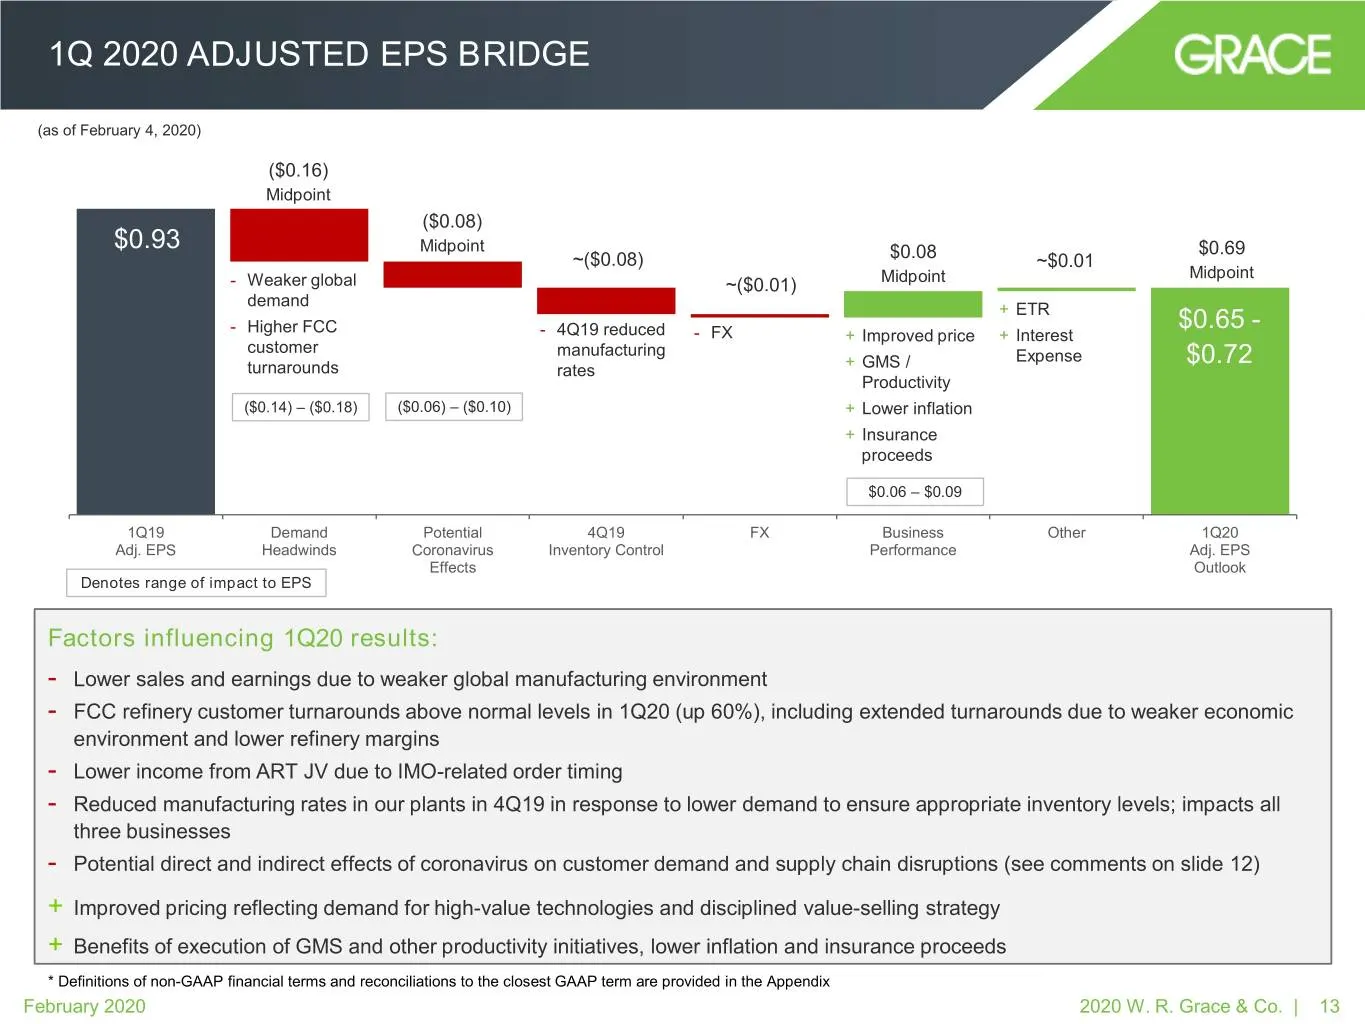
Slide 13: 1Q 2020 Adjusted EPS Bridge
1Q 2020 ADJUSTED EPS BRIDGE (as of February 4, 2020) ($0.16) Midpoint ($0.08) $0.93 Midpoint $0.69 ~($0.08) $0.08 ~$0.01 Midpoint Midpoint - Weaker global ~($0.01) demand + ETR - Higher FCC $0.65 - - 4Q19 reduced - FX + Improved price + Interest customer manufacturing + GMS / Expense $0.72 turnaroun
Slide 14: 2Q-4Q 2020 Adjusted EPS Bridge
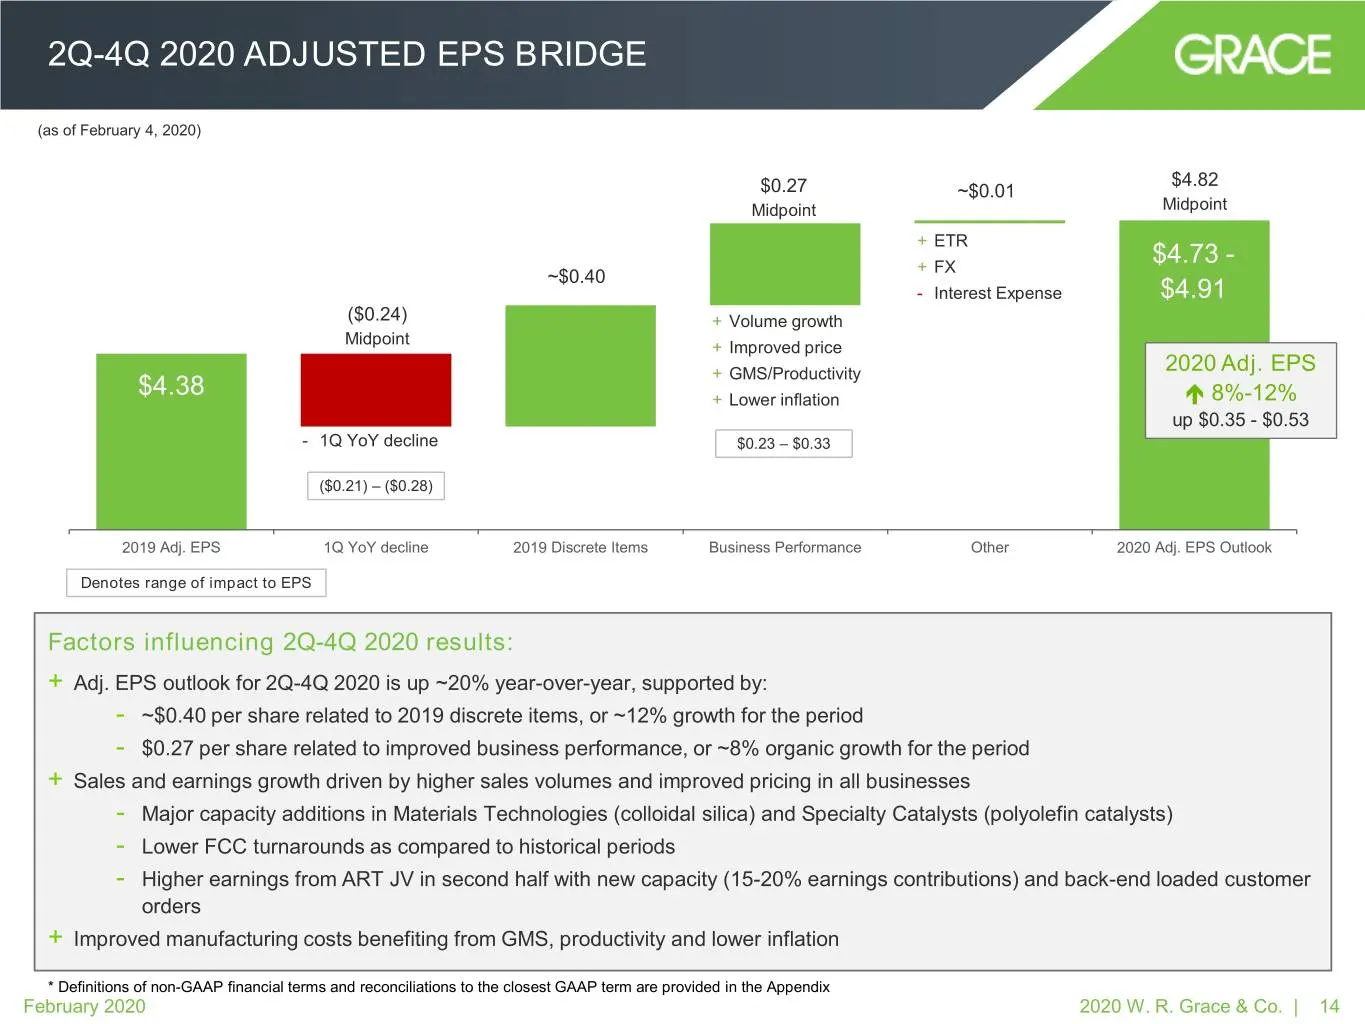
2Q-4Q 2020 ADJUSTED EPS BRIDGE (as of February 4, 2020) $4.82 $0.27 ~$0.01 Midpoint Midpoint + ETR + FX $4.73 - ~$0.40 - Interest Expense $4.91 ($0.24) + Volume growth Midpoint + Improved price + GMS/Productivity 2020 Adj. EPS $4.38 + Lower inflation 8%-12% up $0.35 - $0.53 - 1Q YoY decline $0.23
Slide 15: Capital Allocation Update
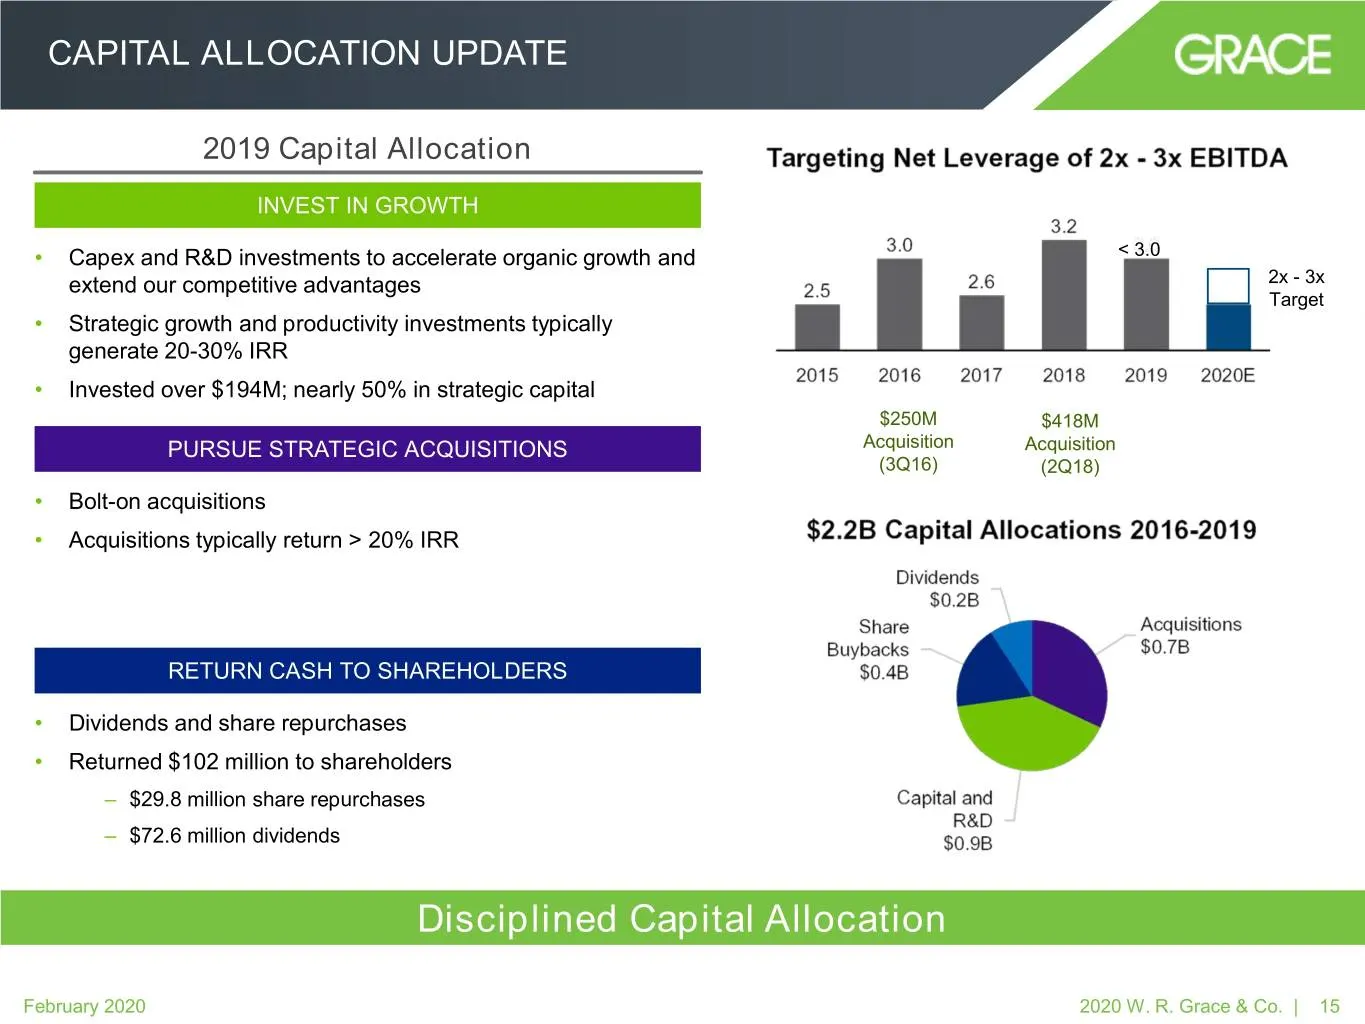
CAPITAL ALLOCATION UPDATE 2019 Capital Allocation INVEST IN GROWTH • Capex and R&D investments to accelerate organic growth and < 3.0 extend our competitive advantages 2x - 3x Target • Strategic growth and productivity investments typically generate 20-30% IRR • Invested over $194M; nearly 50% in st
Slide 16: Key Takeaways
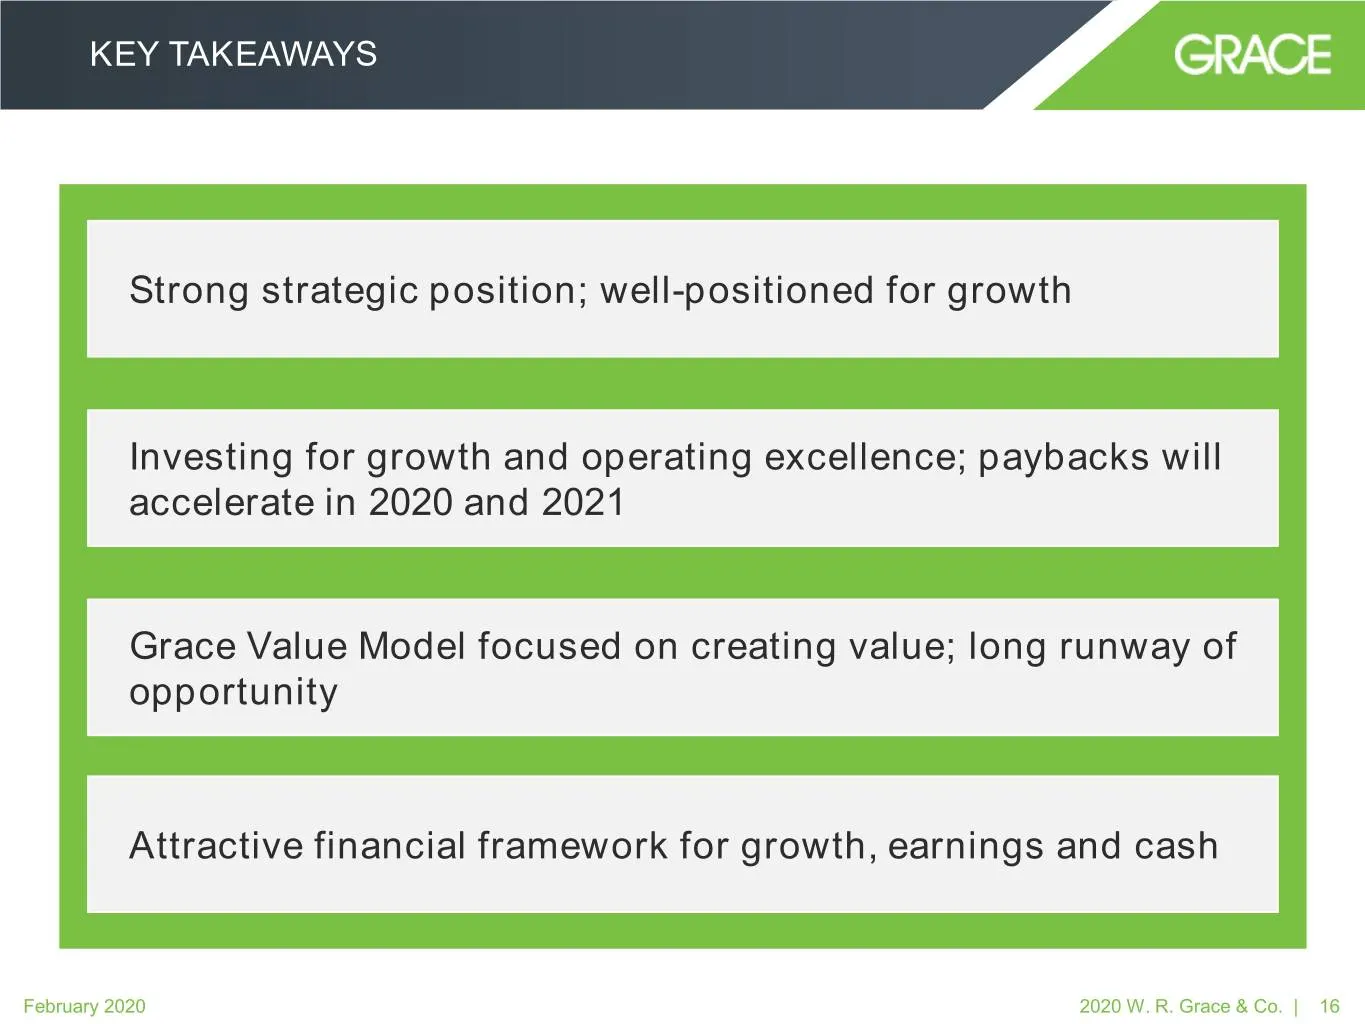
KEY TAKEAWAYS Strong strategic position; well-positioned for growth Investing for growth and operating excellence; paybacks will accelerate in 2020 and 2021 Grace Value Model focused on creating value; long runway of opportunity Attractive financial framework for growth, earnings and cash February 2
Slide 17: Supplemental Information
Supplemental Information 17
Slide 18: 2020 Financial Outlook
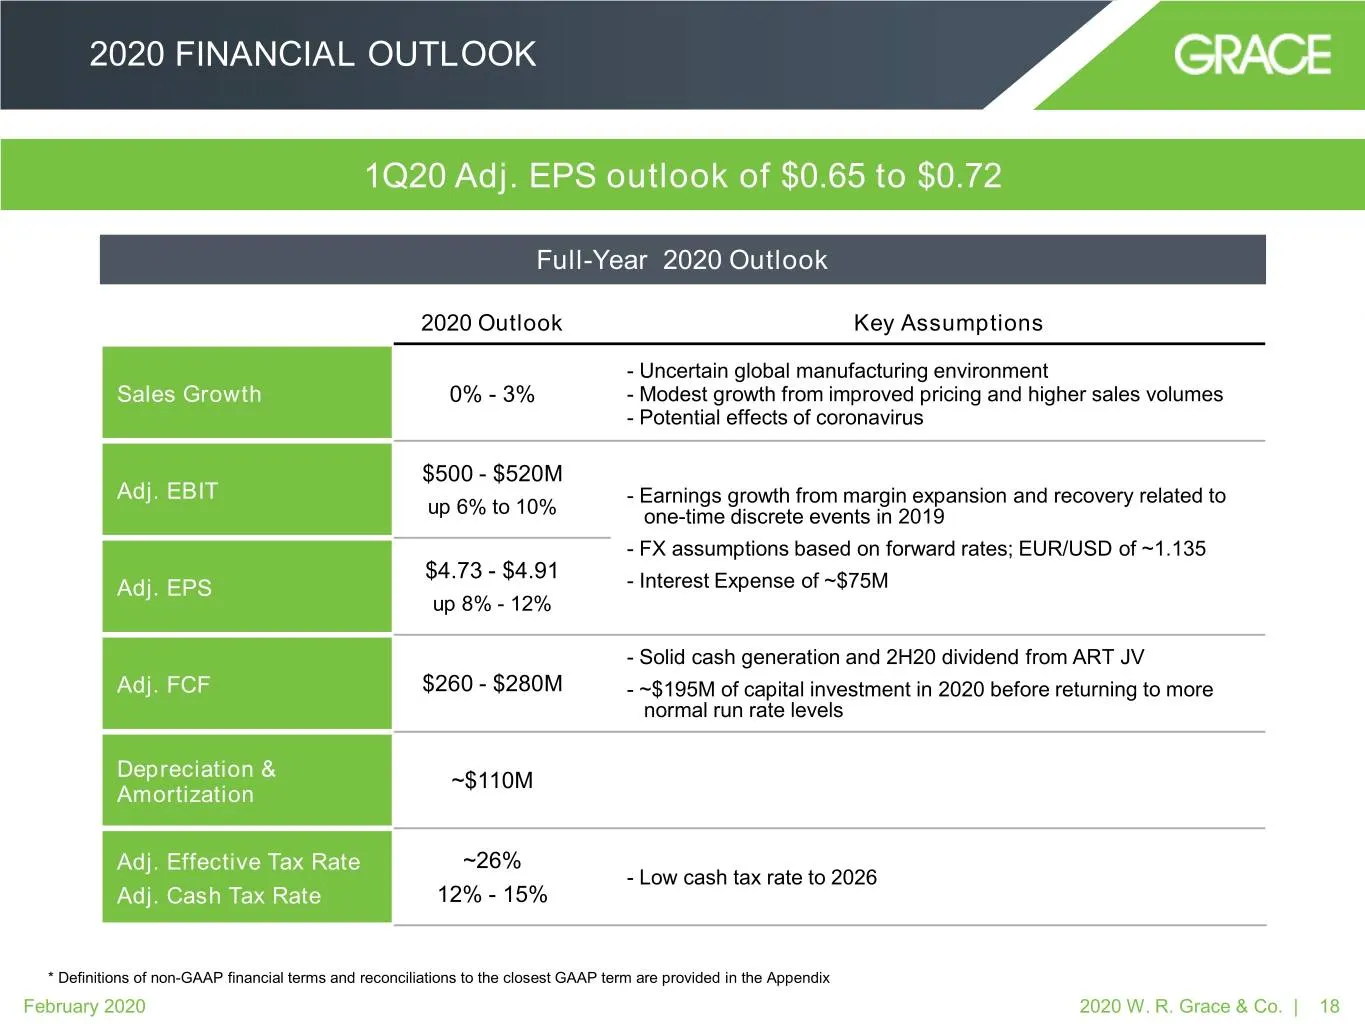
2020 FINANCIAL OUTLOOK 1Q20 Adj. EPS outlook of $0.65 to $0.72 Full-Year 2020 Outlook 2020 Outlook Key Assumptions - Uncertain global manufacturing environment Sales Growth 0% - 3% - Modest growth from improved pricing and higher sales volumes - Potential effects of coronavirus $500 - $520M Adj. EBI
Slide 19: 2016-2021 Financial Framework
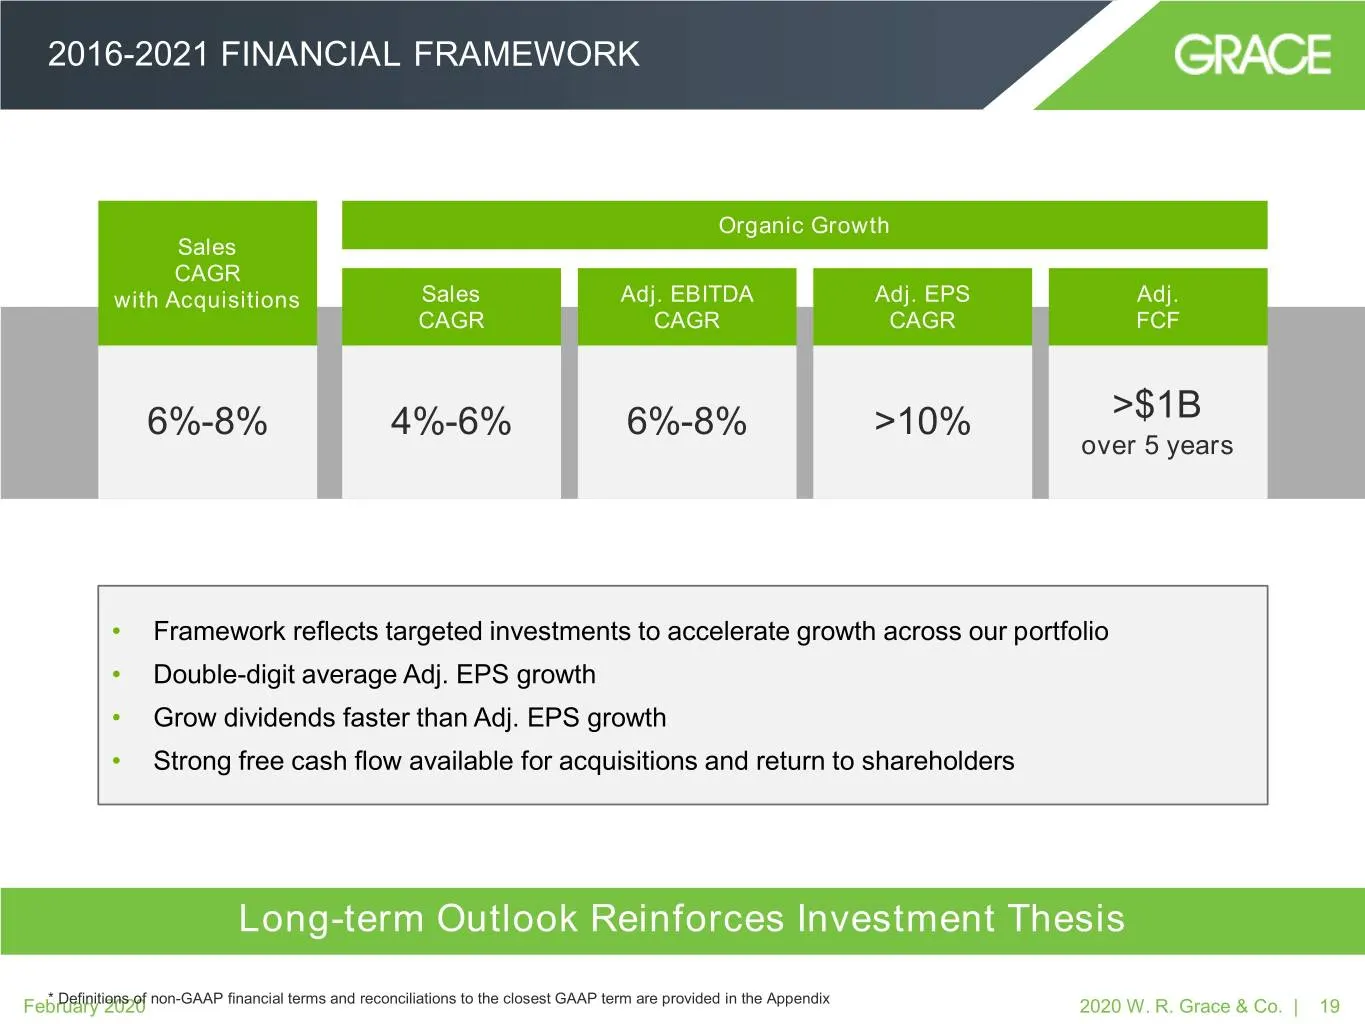
2016-2021 FINANCIAL FRAMEWORK Organic Growth Sales CAGR with Acquisitions Sales Adj. EBITDA Adj. EPS Adj. CAGR CAGR CAGR FCF 6%-8% 4%-6% 6%-8% >10% >$1B over 5 years • Framework reflects targeted investments to accelerate growth across our portfolio • Double-digit average Adj. EPS growth • Grow divi
Slide 20: Appendix: Definitions and Reconciliations of Non-GAAP Measures
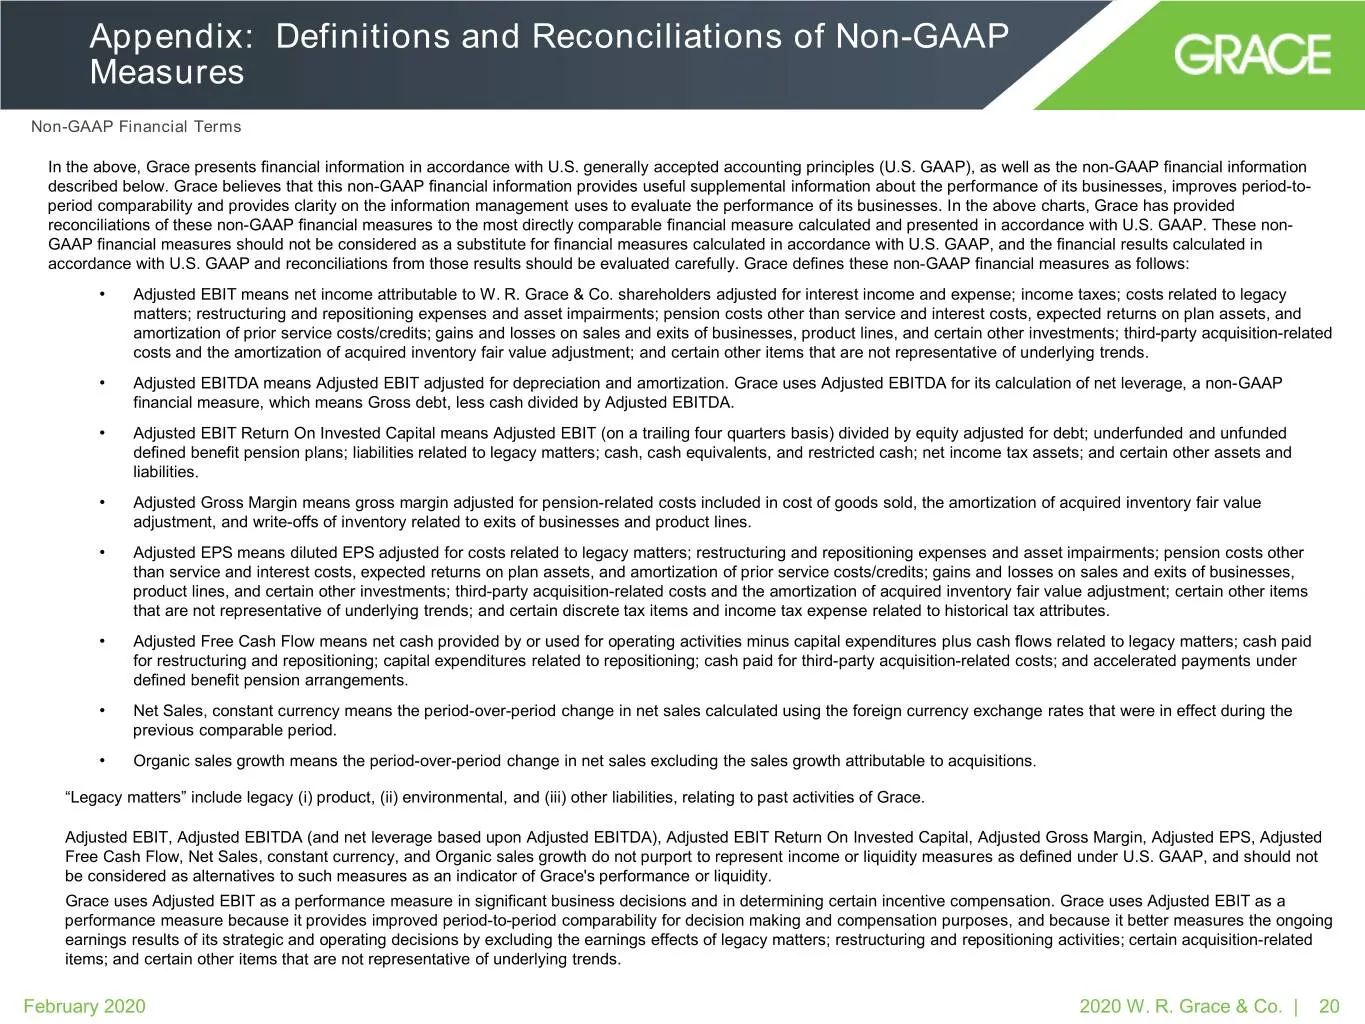
Appendix: Definitions and Reconciliations of Non-GAAP Measures Non-GAAP Financial Terms In the above, Grace presents financial information in accordance with U.S. generally accepted accounting principles (U.S. GAAP), as well as the non-GAAP financial information described below. Grace believes that
Slide 21: Appendix: Definitions and Reconciliations of Non-GAAP Measures (continued)
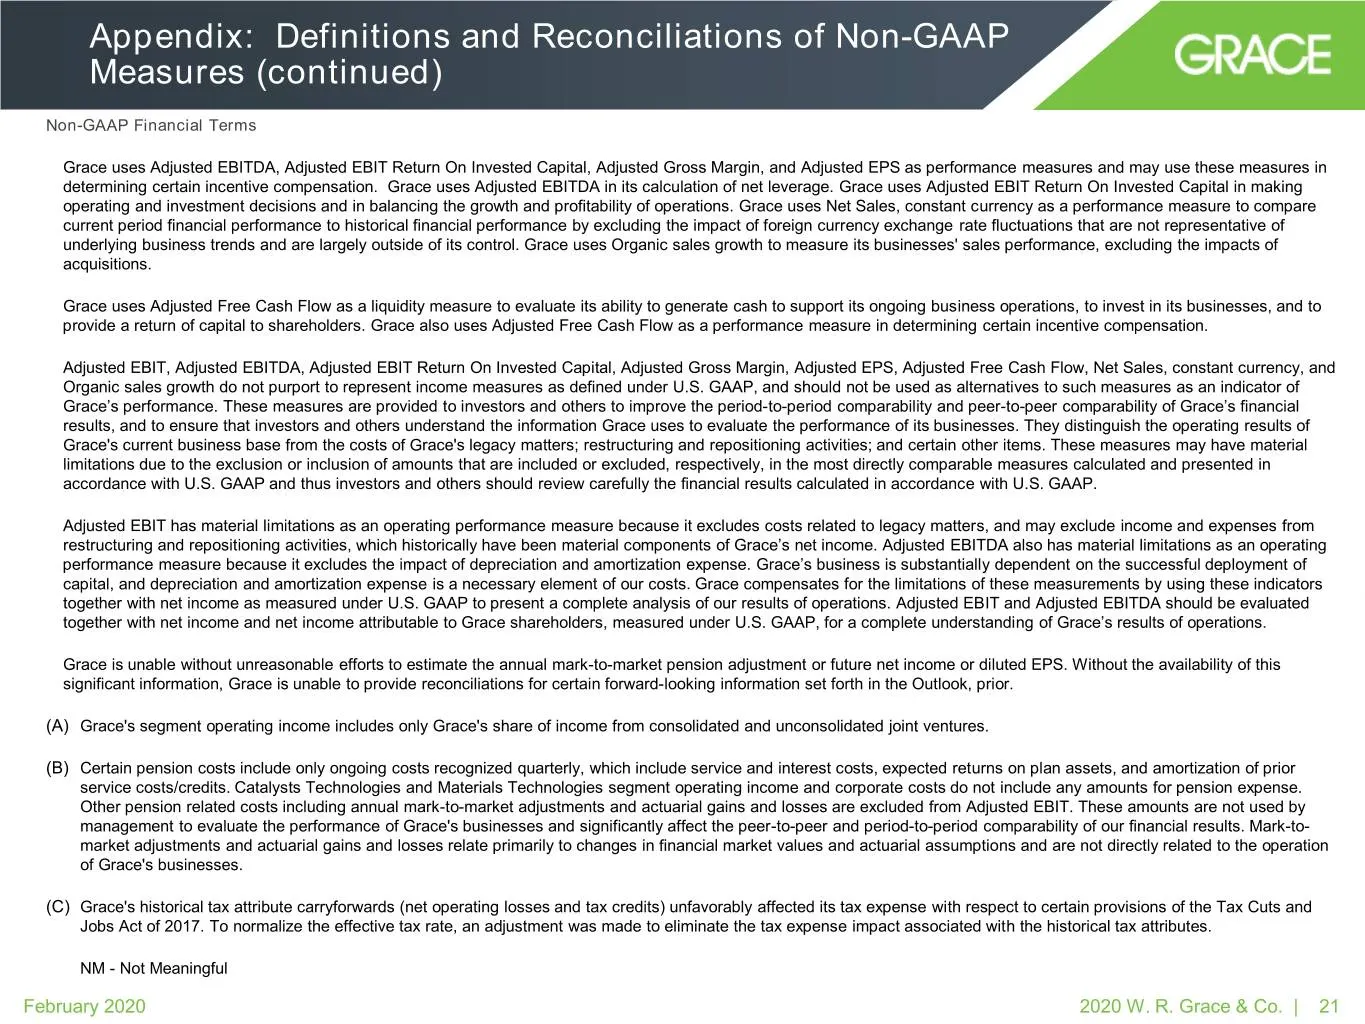
Appendix: Definitions and Reconciliations of Non-GAAP Measures (continued) Non-GAAP Financial Terms Grace uses Adjusted EBITDA, Adjusted EBIT Return On Invested Capital, Adjusted Gross Margin, and Adjusted EPS as performance measures and may use these measures in determining certain incentive compen
Slide 22: Appendix: Reconciliation of Non-GAAP Financial Measures (continued)
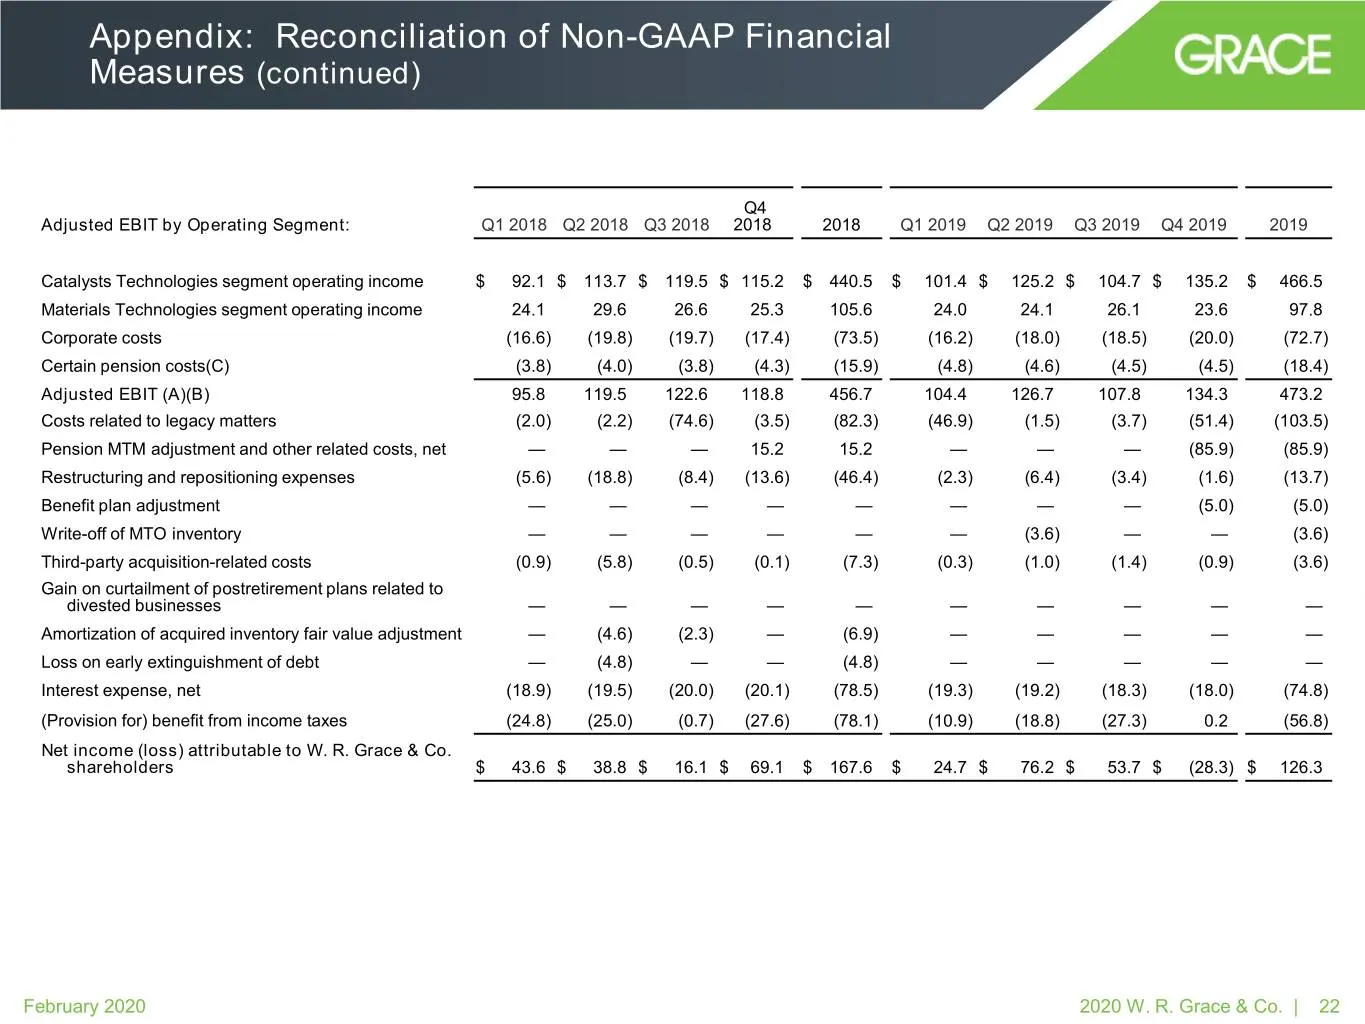
Appendix: Reconciliation of Non-GAAP Financial Measures (continued) Q4 Adjusted EBIT by Operating Segment: Q1 2018 Q2 2018 Q3 2018 2018 2018 Q1 2019 Q2 2019 Q3 2019 Q4 2019 2019 Catalysts Technologies segment operating income $ 92.1 $ 113.7 $ 119.5 $ 115.2 $ 440.5 $ 101.4 $ 125.2 $ 104.7 $ 135.2 $ 4
Slide 23: Appendix: Reconciliation of Non-GAAP Financial Measures (continued)
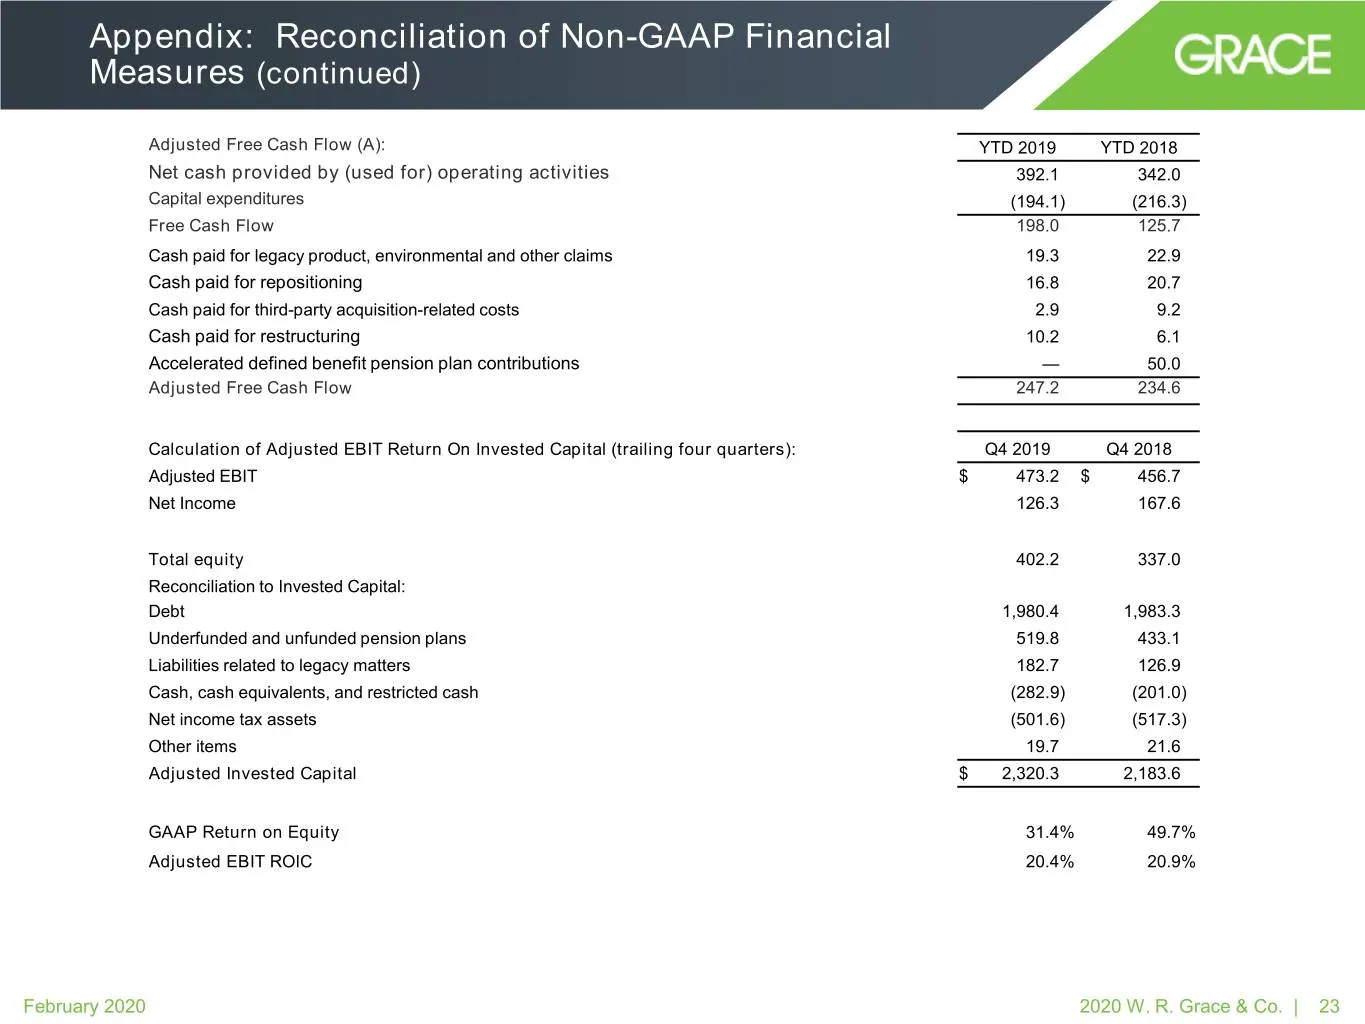
Appendix: Reconciliation of Non-GAAP Financial Measures (continued) Adjusted Free Cash Flow (A): YTD 2019 YTD 2018 Net cash provided by (used for) operating activities 392.1 342.0 Capital expenditures (194.1) (216.3) Free Cash Flow 198.0 125.7 Cash paid for legacy product, environmental and other cl
Slide 24: Appendix: Reconciliation of Non-GAAP Financial Measures (continued)
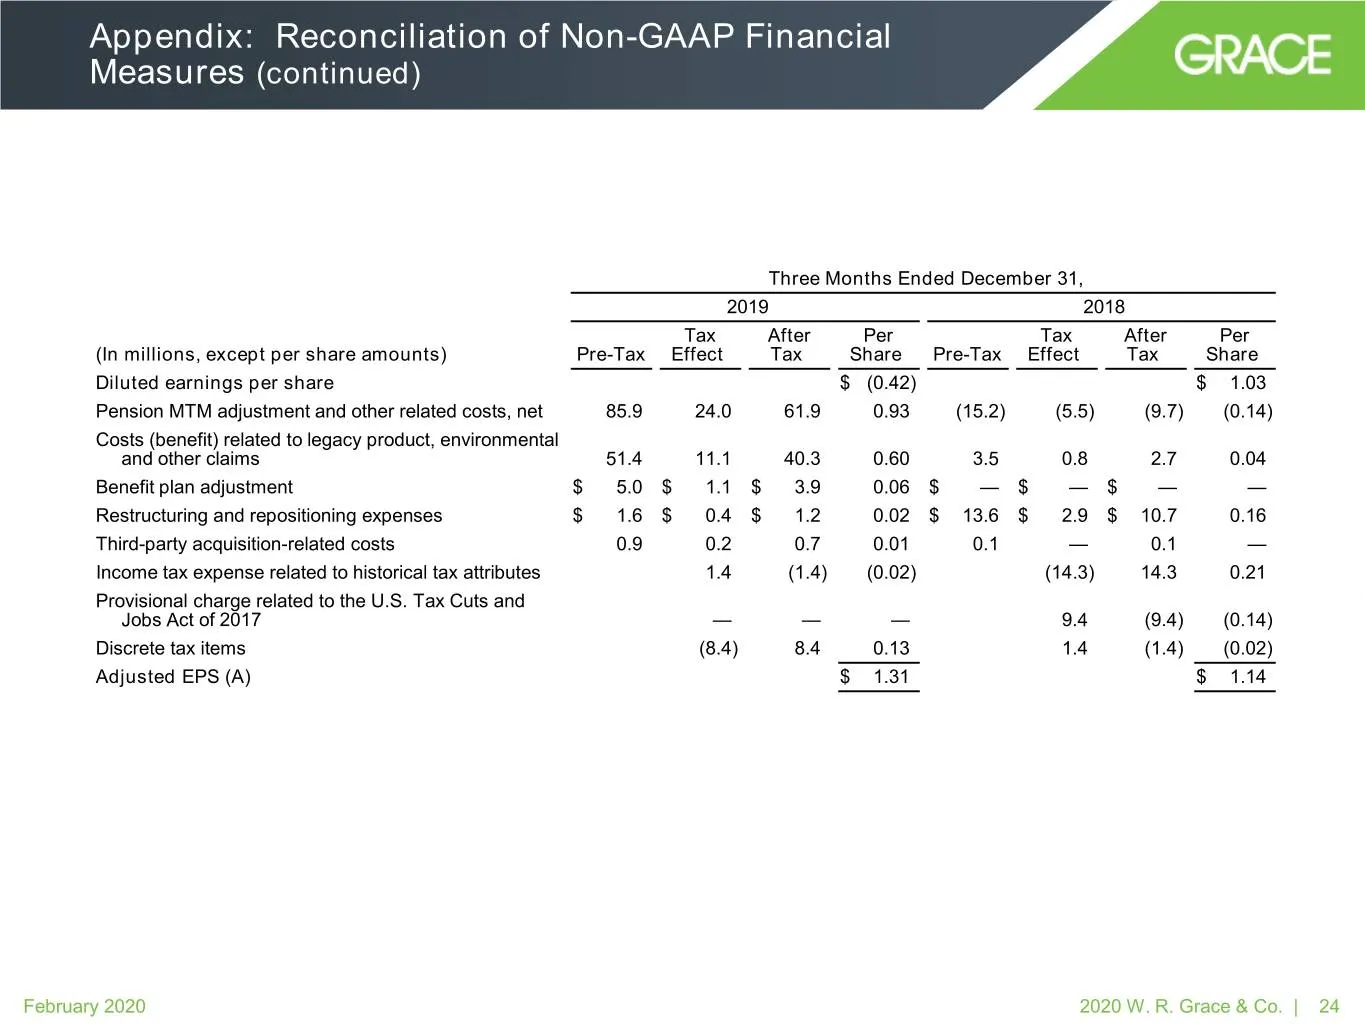
Appendix: Reconciliation of Non-GAAP Financial Measures (continued) Three Months Ended December 31, 2019 2018 Tax After Per Tax After Per (In millions, except per share amounts) Pre-Tax Effect Tax Share Pre-Tax Effect Tax Share Diluted earnings per share $ (0.42) $ 1.03 Pension MTM adjustment and ot
Slide 25: Appendix: Reconciliation of Non-GAAP Financial Measures (continued)
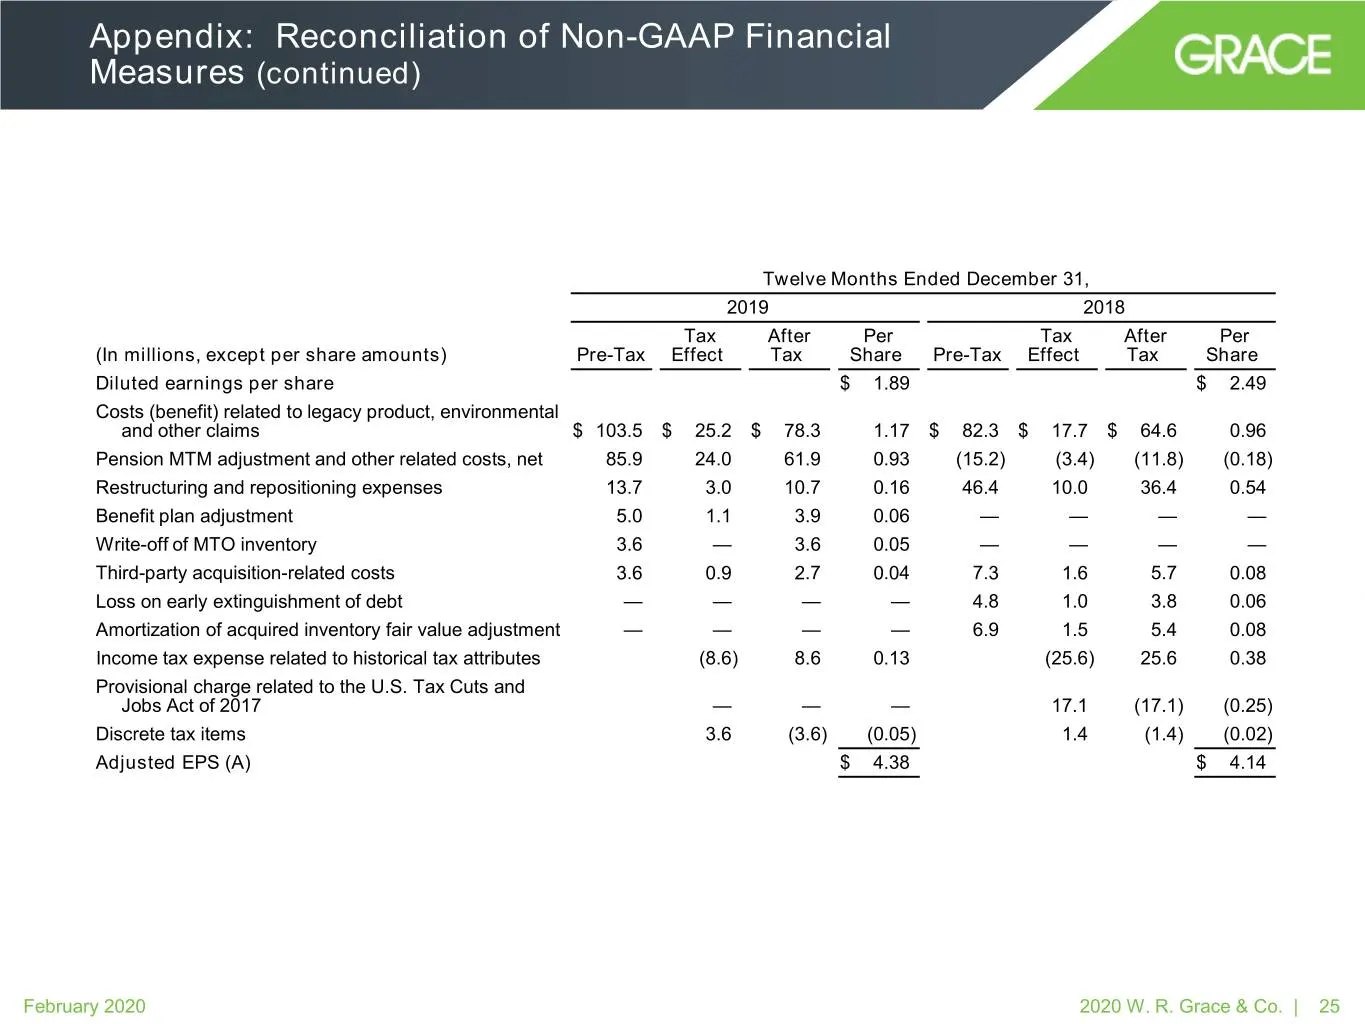
Appendix: Reconciliation of Non-GAAP Financial Measures (continued) Twelve Months Ended December 31, 2019 2018 Tax After Per Tax After Per (In millions, except per share amounts) Pre-Tax Effect Tax Share Pre-Tax Effect Tax Share Diluted earnings per share $ 1.89 $ 2.49 Costs (benefit) related to leg
Source: SEC EDGAR · 8-K filed Feb 11, 2020
More decks from W. R. Grace & Co
 Merger or Acquisition (February 2021)11 slides · Feb 26, 2021
 Investor Presentation (September 2020)27 slides · Sep 17, 2020
 Investor Presentation (August 2020)25 slides · Aug 26, 2020
 Credit Suisse Basic Materials Conference 201922 slides · Sep 10, 2019
 Deutsche Bank Annual Global Industrials & Materials Summit 201920 slides · Jun 6, 2019
 Goldman Sachs Basic Materials Conference 201827 slides · May 15, 2018