Montpelier Re — KBW Investor Conference 2010
18 slides from Montpelier Re's conference presentation, Sep 8, 2010

Slide 1: KBW Investor Conference: Growing Book Value Per Share
KBW INVESTOR CONFERENCE SEPTEMBER 8, 2010 GROWING BOOK VALUE PER SHARE A leading provider of property catastrophe and short-tail reinsurance
Slide 2: Forward Looking Statements & Safe Harbor
Forward Looking Statements & Safe Harbor Application of the Safe Harbor of the Private Securities Litigation Reform Act of 1995: This presentation contains, and Montpelier Re may from time to time make, written or oral “forward-looking” statements within the meaning of the United States federal secu
Slide 3: Background
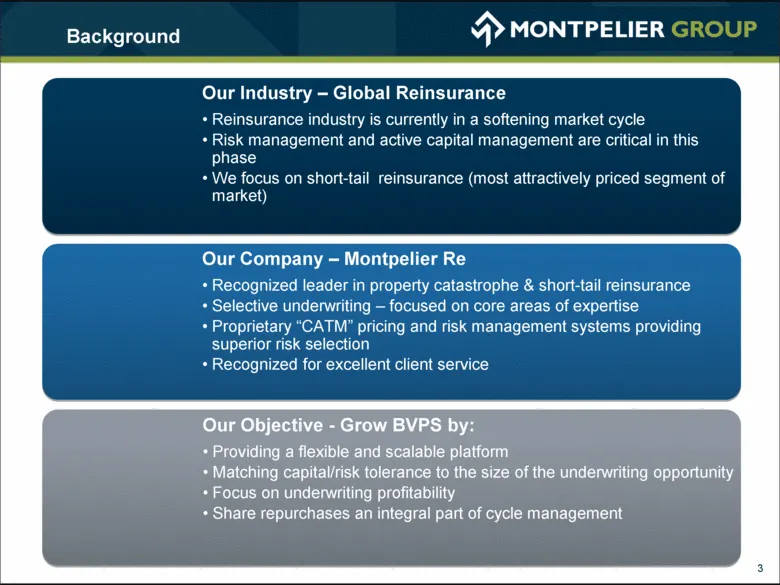
3 Background Our Industry – Global Reinsurance Reinsurance industry is currently in a softening market cycle Risk management and active capital management are critical in this phase We focus on short-tail reinsurance (most attractively priced segment of market) Our Company – Montpelier Re Recognized
Slide 4: Q2 2010: Montpelier at a Glance
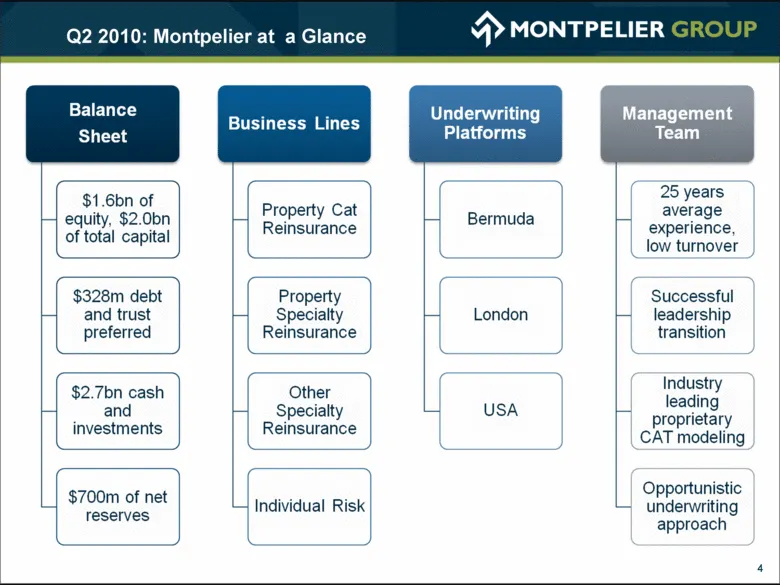
4 Q2 2010: Montpelier at a Glance Balance Sheet Business Lines Underwriting Platforms Management Team 25 years $1.6bn of equity, $2.0bn of total capital Property Cat Reinsurance Bermuda average experience, low turnover $328m debt and trust preferred Property Specialty Reinsurance London Successful l
Slide 5: Competitive Positioning
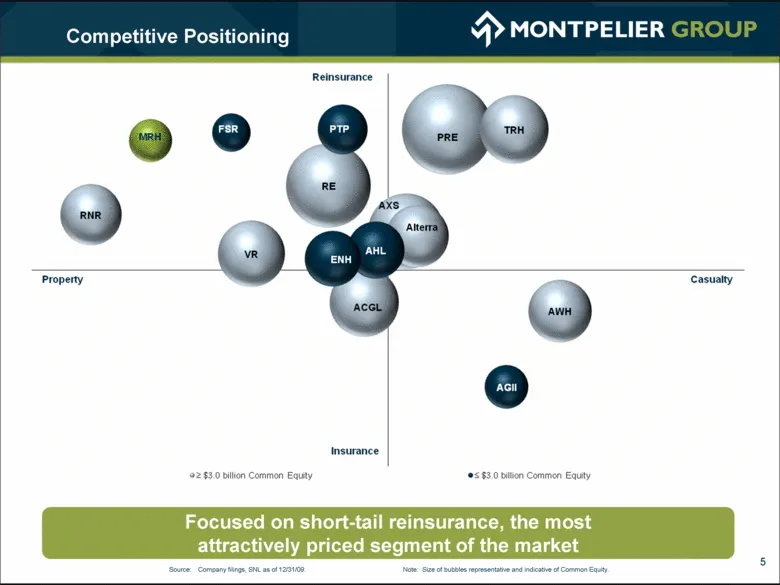
Competitive Positioning Focused on short-tail reinsurance, the most attractively priced segment of the market 5 Source: Company filings, SNL as of 12/31/09. Note: Size of bubbles representative and indicative of Common Equity.
Slide 6: Underwriting Platforms
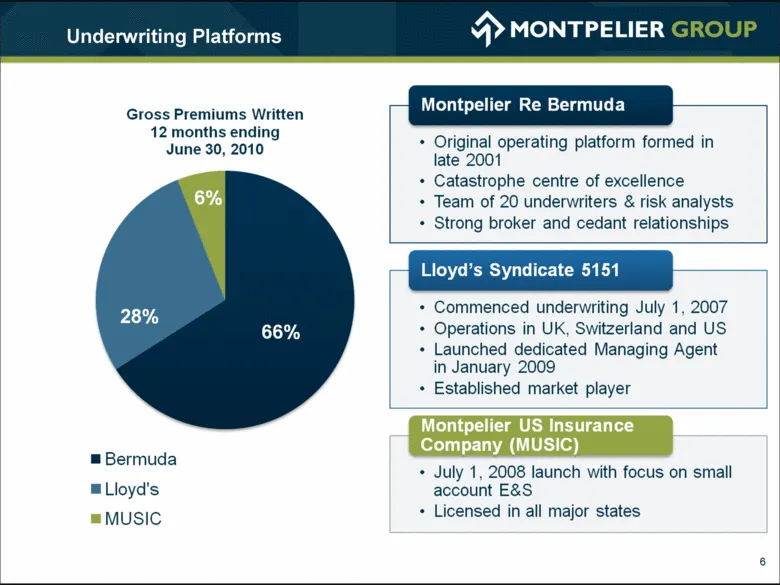
6 Underwriting Platforms Montpelier Re Bermuda Gross Premiums Written 12 months ending June 30, 2010 • Original operating platform formed in late 2001 • Catastrophe centre of excellence 6% • Team of 20 underwriters & risk analysts • Strong broker and cedant relationships Europe US 52% 14% Lloyd’s Sy
Slide 7: Business Lines
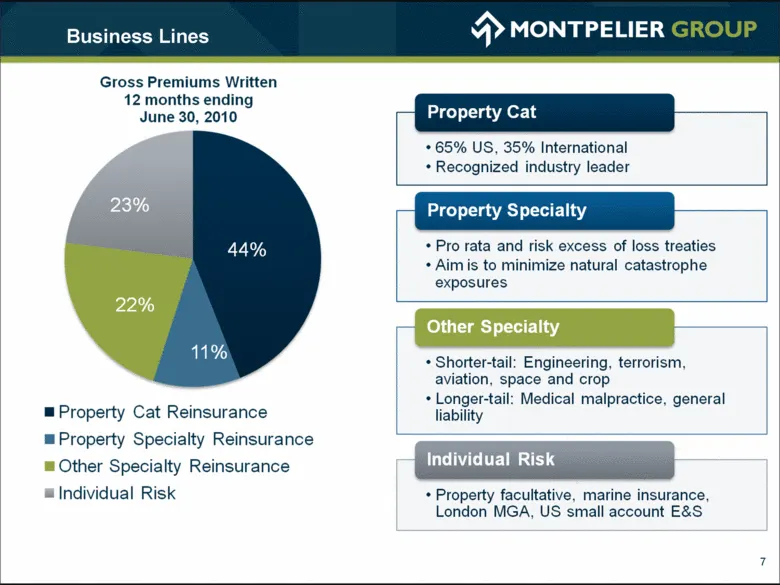
Business Lines Gross Premiums Written 12 months ending June 30, 2010 23% 44% 22% 11% Property Cat Reinsurance Property Specialty Reinsurance Other Specialty Reinsurance Individual Risk Property Cat • 65% US, 35% International • Recognized industry leader Property Specialty • Pro rata and risk excess
Slide 8: Creating Shareholder Value
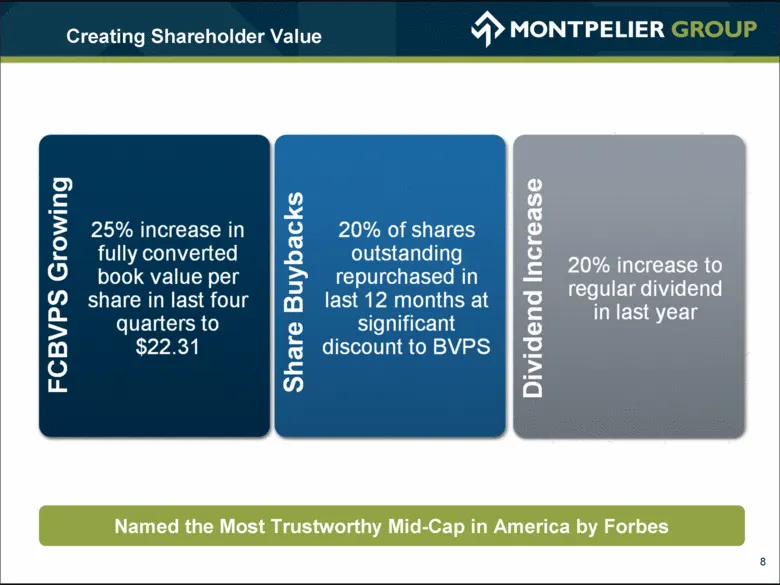
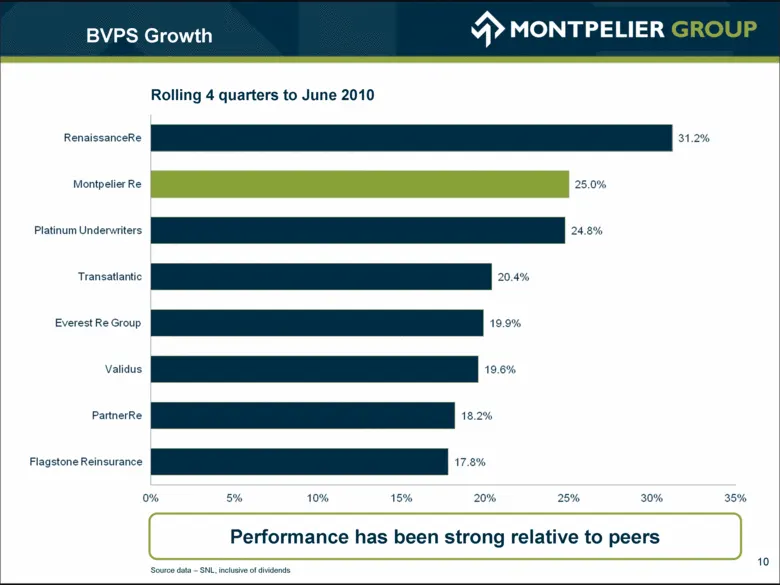
Creating Shareholder Value Named the Most Trustworthy Mid-Cap in America by Forbes FCBVPS Growing 25% increase in S fully converted o book value per share in last four quarters to $22.31 Share Buybacks 20% of shares outstanding repurchased in last 12 months at significant discount to BVPS Dividend I
Slide 9: Strong Financial Performance
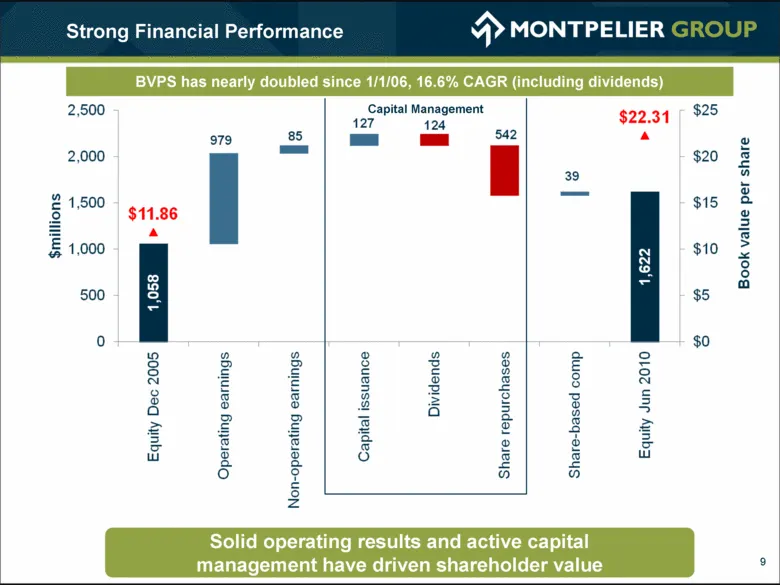
Strong Financial Performance 9 Solid operating results and active capital management have driven shareholder value BVPS has nearly doubled since 1/1/06, 16.6% CAGR (including dividends) Capital Management
Slide 10: BVPS Growth
BVPS Growth Source data – SNL, inclusive of dividends Rolling 4 quarters to June 2010 Performance has been strong relative to peers 10
Slide 11: Operating Performance 2006 to H1 2010
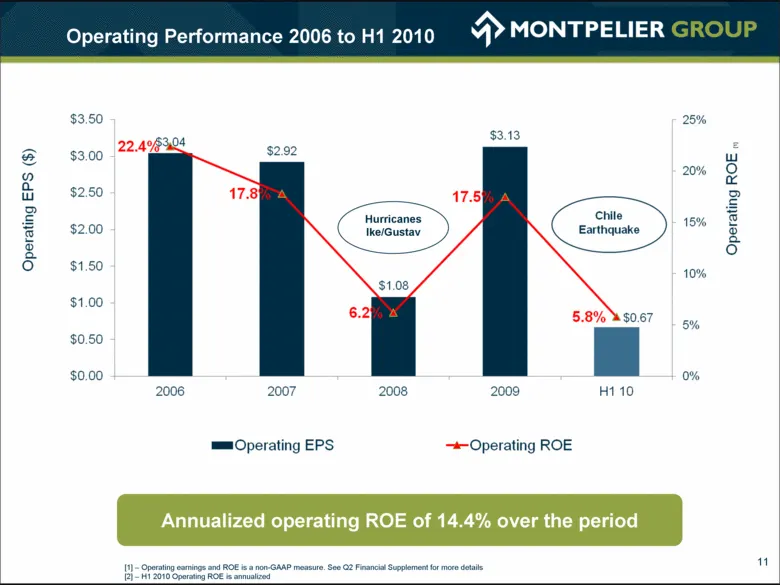
Operating Performance 2006 to H1 2010 Annualized operating ROE of 14.4% over the period [1] – Operating earnings and ROE is a non-GAAP measure. See Q2 Financial Supplement for more details [2] – H1 2010 Operating ROE is annualized 11 Hurricanes Ike/Gustav
Slide 12: Strong Transparent Balance Sheet
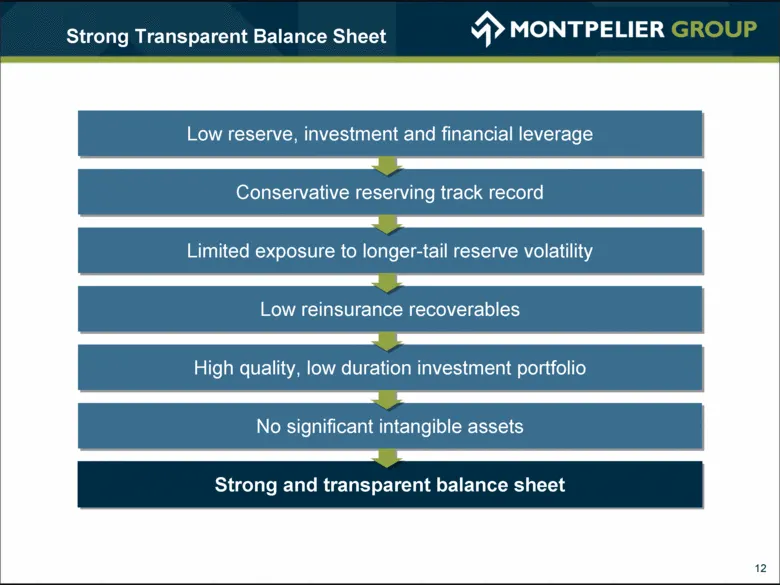
12 Strong Transparent Balance Sheet Low reserve, investment and financial leverage Conservative reserving track record Limited exposure to longer-tail reserve volatility Low reinsurance recoverables High quality, low duration investment portfolio No significant intangible assets Strong and transpare
Slide 13: Reserving Track Record
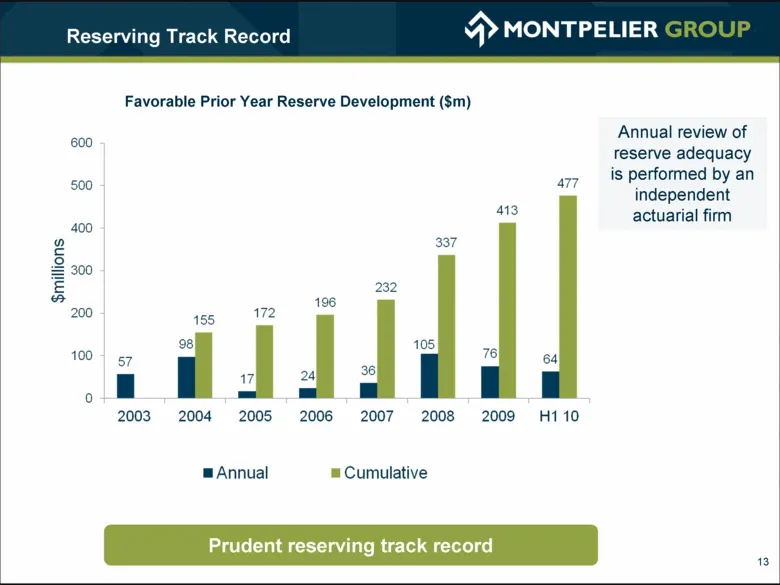
Reserving Track Record Favorable Prior Year Reserve Development ($m) Prudent reserving track record 13 Annual review of reserve adequacy is performed by an independent actuarial firm 57 155 98 172 17 196 24 232 36 337 105 413 76 477 64
Slide 14: Investment Portfolio at June 2010
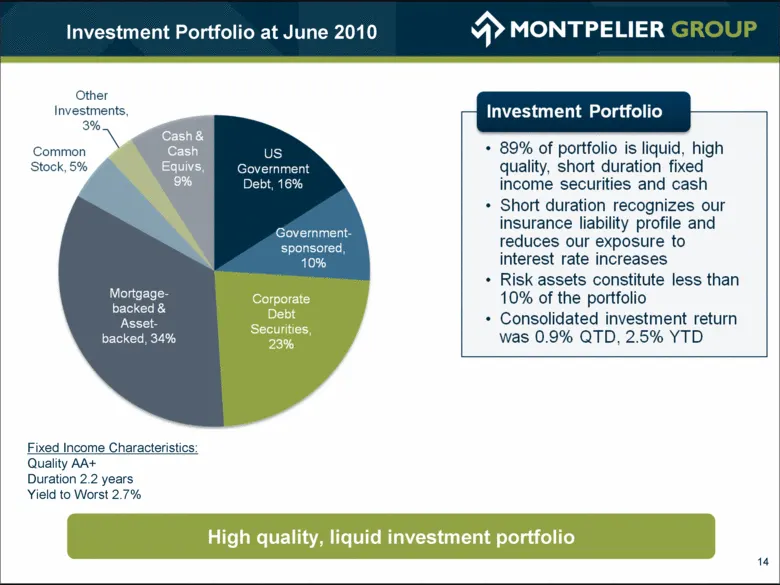
Investment Portfolio at June 2010 Investment Portfolio • 89% of portfolio is liquid, high quality, short duration fixed income securities and cash • Short duration recognizes our insurance liability profile and reduces our exposure to interest rate increases • Risk assets constitute less than 10% of
Slide 15: Single Event Exposure Management
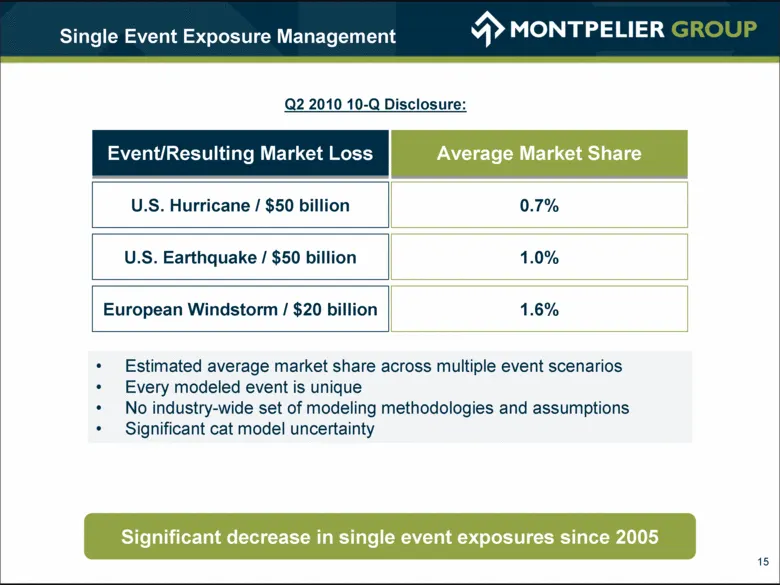
Single Event Exposure Management Q2 2010 10-Q Disclosure: Estimated average market share across multiple event scenarios Every modeled event is unique No industry-wide set of modeling methodologies and assumptions Significant cat model uncertainty 15 Significant decrease in single event exposures si
Slide 16: Ike/Gustav Losses as % of Shareholders' Equity
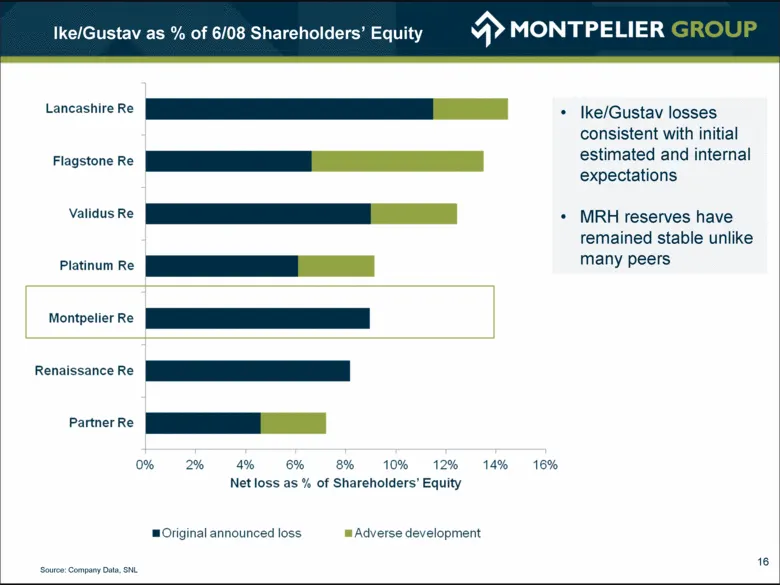
Ike/Gustav as % of 6/08 Shareholders’ Equity Source: Company Data, SNL 16 Ike/Gustav losses consistent with initial estimated and internal expectations MRH reserves have remained stable unlike many peers Net loss as % of Shareholders’ Equity
Slide 17: Looking Forward
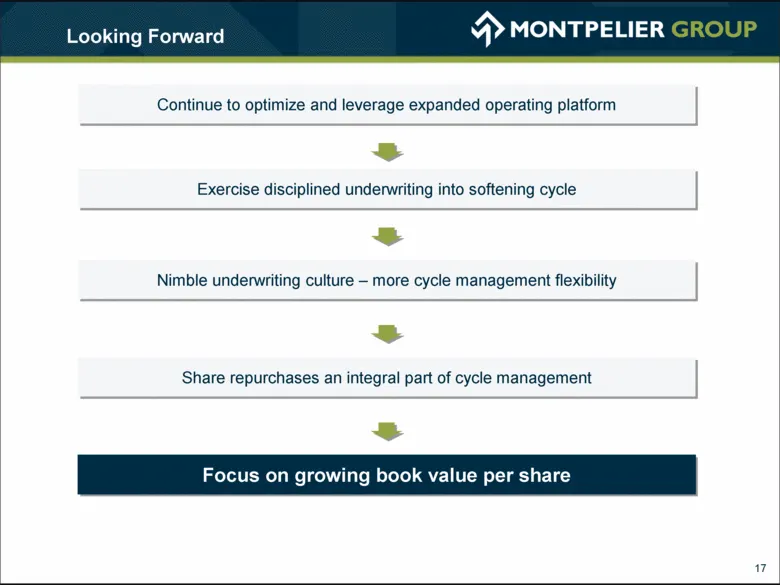
17 Looking Forward Continue to optimize and leverage expanded operating platform Exercise disciplined underwriting into softening cycle Nimble underwriting culture – more cycle management flexibility Share repurchases an integral part of cycle management Focus on growing book value per share

Slide 18: Website and Investor Contact Information
Please visit our websites for more information on our company, products and team members: www.montpelierre.bm www.mre.bm www.montpelier5151.co.uk www.montpelierus.com www.montpeliereuropa.ch Montpelier House, 94 Pitts Bay Road, Pembroke, Bermuda PO Box HM 2079, Hamilton, Bermuda, HMHX Investor Conta
Source: SEC EDGAR · 8-K filed Sep 8, 2010
More decks from Montpelier Re Holdings Ltd
 Merger or Acquisition (March 2015)11 slides · Mar 31, 2015
 Merger or Acquisition (March 2015)11 slides · Mar 31, 2015
 Q4 2011 Earnings Presentation26 slides · Mar 5, 2012
 Investor Presentation (September 2011)27 slides · Sep 7, 2011
 Investor Day (May 2009)47 slides · May 7, 2009
 Investor Presentation (December 2007)15 slides · Dec 4, 2007