Umpqua — DA Davidson Financial Institutions Conference 2018
18 slides from Umpqua's conference presentation, May 8, 2018

Slide 1: DA Davidson Financial Institutions Conference May 9, 2018
DA Davidson Financial Institutions Conference May 9, 2018
Slide 2: Forward Looking Statements
Forward Looking Statements This presentation includes forward-looking statements within the meaning of the “Safe-Harbor” provisions of the Private Securities Litigation Reform Act of 1995, which management believes are a benefit to shareholders. These statements are necessarily subject to risk and u
Slide 3: About Umpqua
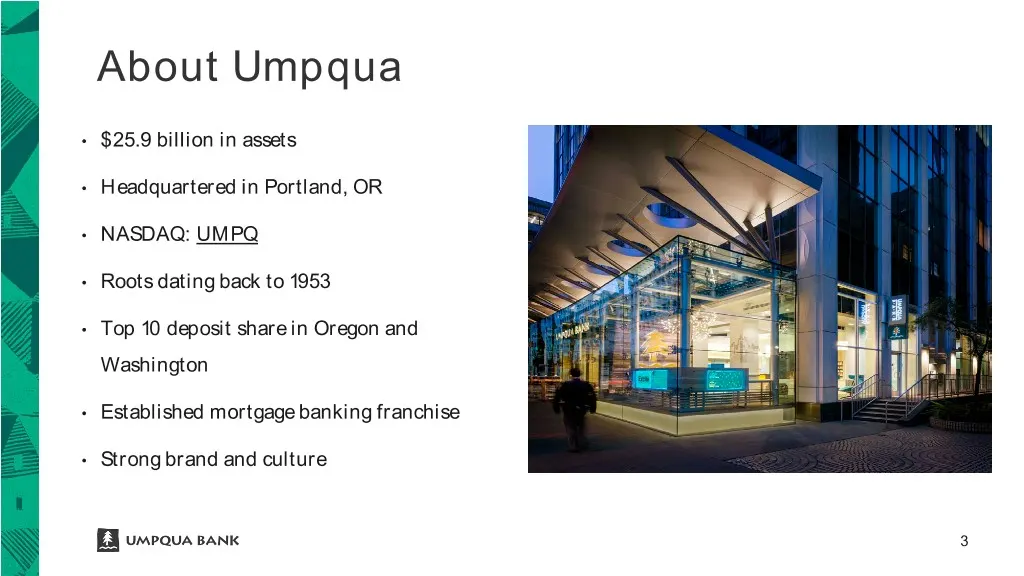
About Umpqua • $25.9 billion in assets • Headquartered in Portland, OR • NASDAQ: UMPQ • Roots dating back to 1953 • Top 10 deposit share in Oregon and Washington • Established mortgage banking franchise • Strong brand and culture 3
Slide 4: Uniquely Positioned Geographic Footprint
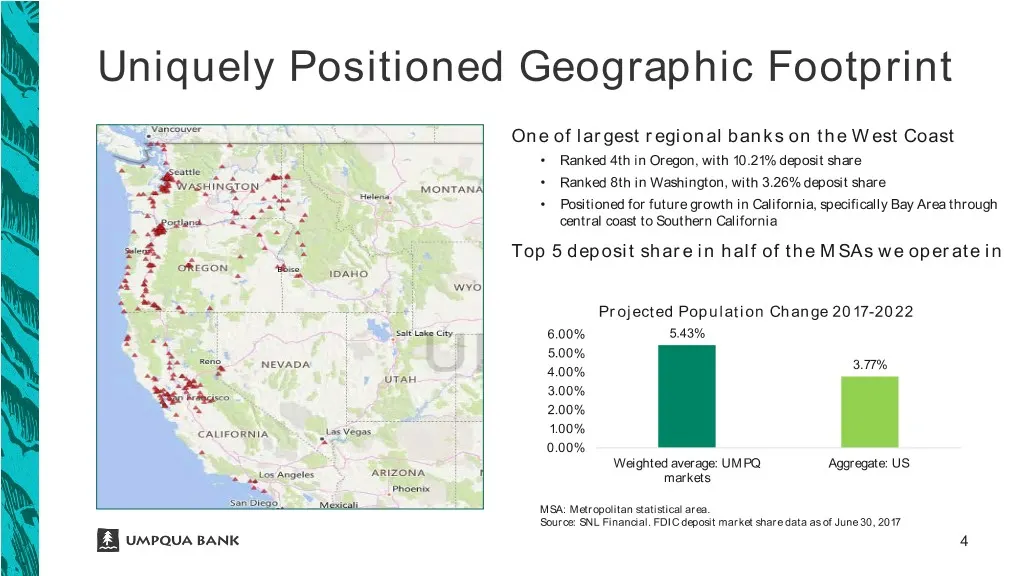
Uniquely Positioned Geographic Footprint One of largest regional banks on the West Coast • Ranked 4th in Oregon, with 10.21% deposit share • Ranked 8th in Washington, with 3.26% deposit share • Positioned for future growth in California, specifically Bay Area through central coast to Southern Califo
Slide 5: Stock Price Outperforming Peers
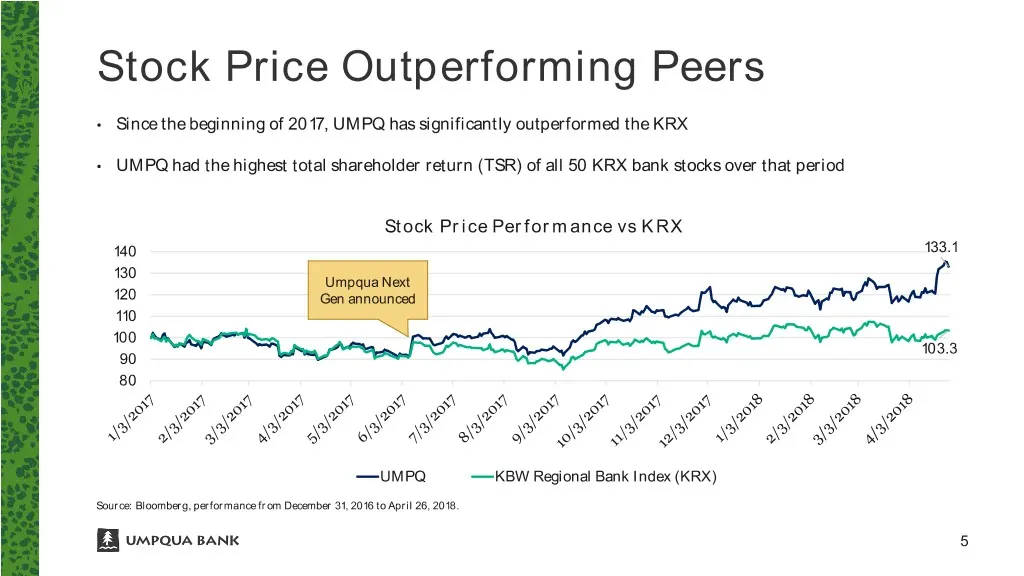
Stock Price Outperforming Peers • Since the beginning of 2017, UMPQ has significantly outperformed the KRX • UMPQ had the highest total shareholder return (TSR) of all 50 KRX bank stocks over that period Stock Price Performance vs KRX 140 133.1 130 Umpqua Next 120 Gen announced 110 100 103.3 90 80 U
Slide 6: Umpqua Next Gen
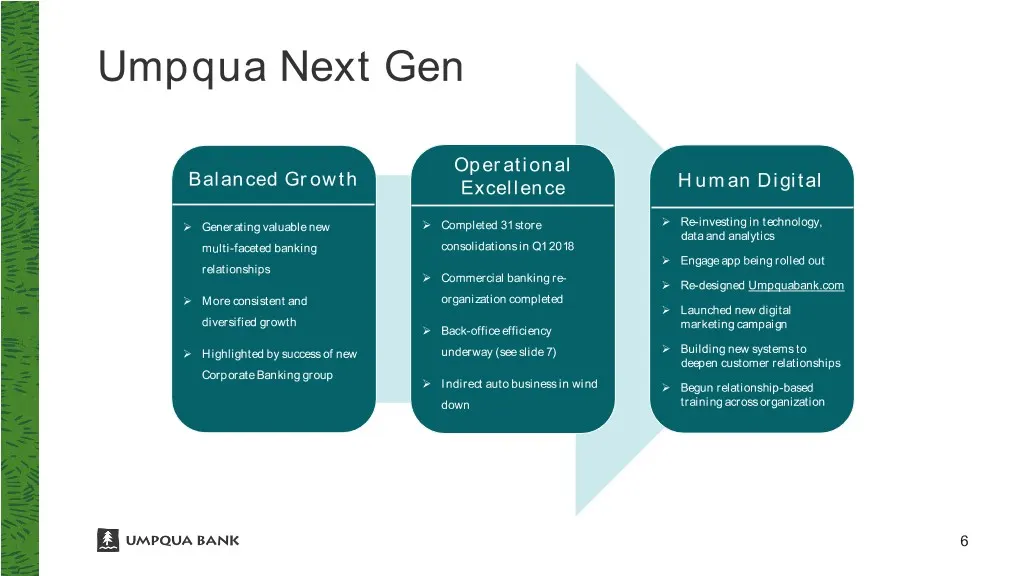
Umpqua Next Gen Operational Balanced Growth Excellence Human Digital Generating valuable new Completed 31 store Re-investing in technology, data and analytics multi-faceted banking consolidations in Q1 2018 Engage app being rolled out relationships Commercial banking re- Re-designed Umpq
Slide 7: Operational Excellence: Back Office
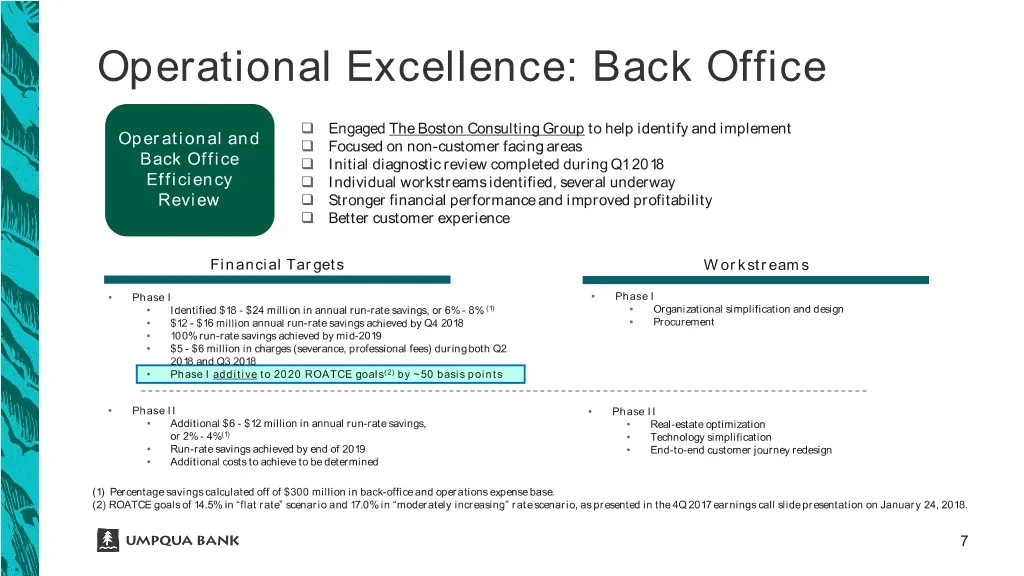
Operational Excellence: Back Office Engaged The Boston Consulting Group to help identify and implement Operational and Focused on non-customer facing areas Back Office Initial diagnostic review completed during Q1 2018 Efficiency Individual workstreams identified, several underway Review S
Slide 8: Q1 2018 Highlights
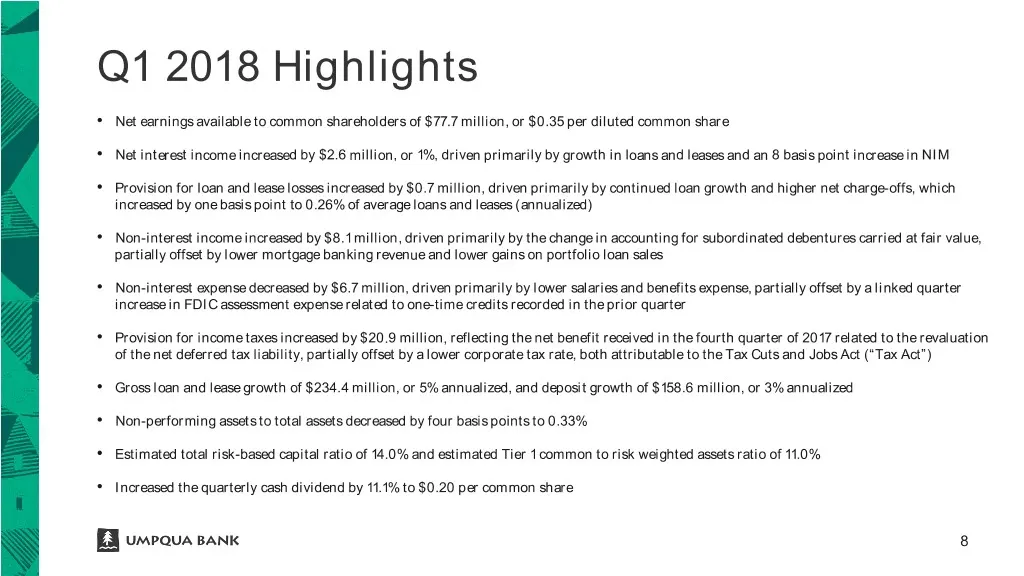
Q1 2018 Highlights • Net earnings available to common shareholders of $77.7 million, or $0.35 per diluted common share • Net interest income increased by $2.6 million, or 1%, driven primarily by growth in loans and leases and an 8 basis point increase in NIM • Provision for loan and lease losses inc
Slide 9: Net Interest Income and Margin
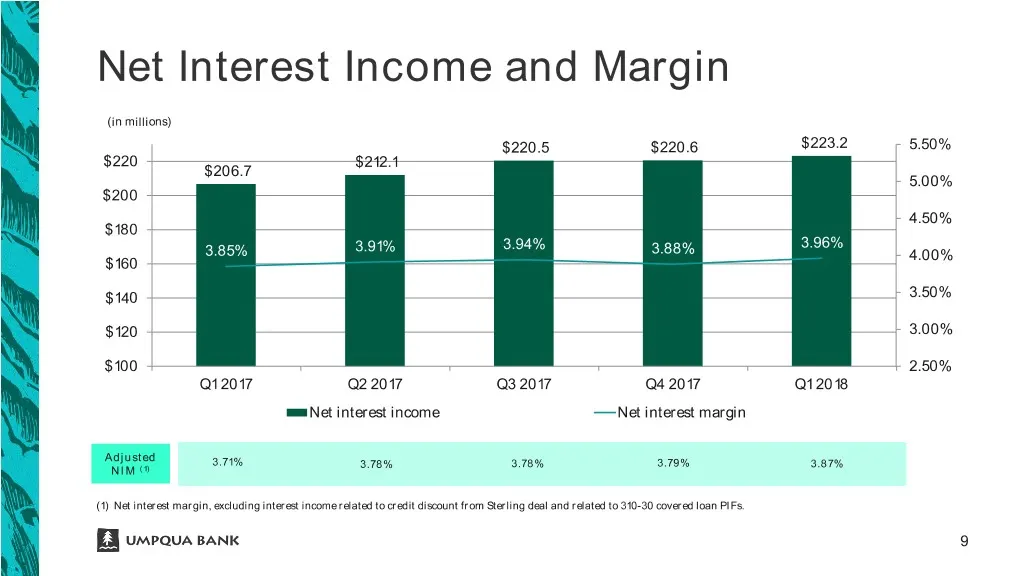
Net Interest Income and Margin (in millions) $220.5 $220.6 $223.2 5.50% $220 $212.1 $206.7 5.00% $200 4.50% $180 3.91% 3.94% 3.96% 3.85% 3.88% 4.00% $160 $140 3.50% $120 3.00% $100 2.50% Q1 2017 Q2 2017 Q3 2017 Q4 2017 Q1 2018 Net interest income Net interest margin Adjusted 3.71% 3.78% 3.78% 3.79%
Slide 10: Non-interest Income
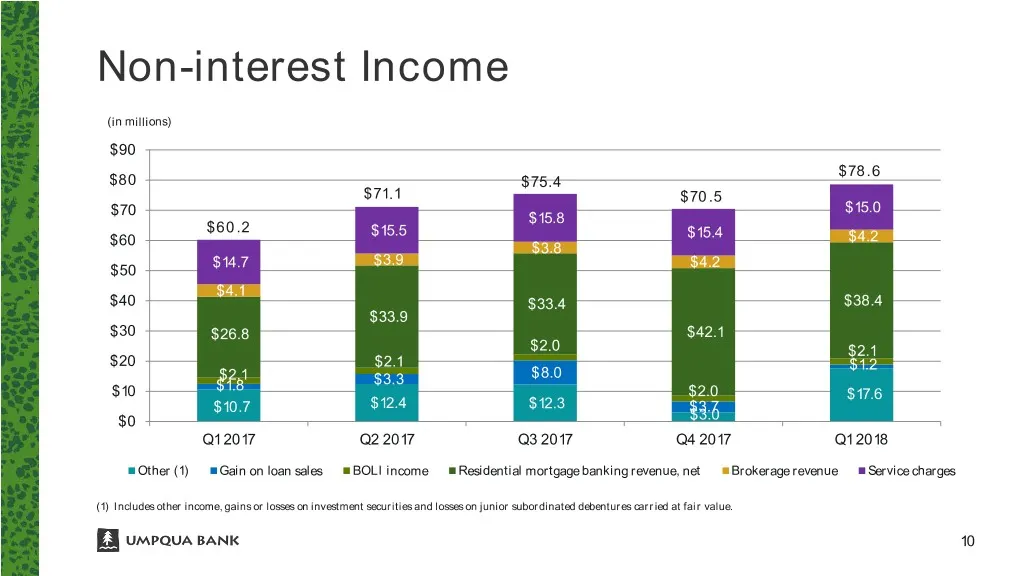
Non-interest Income (in millions) $90 $78.6 $80 $75.4 $71.1 $70.5 $70 $15.0 $15.8 $60.2 $15.5 $15.4 $60 $4.2 $3.8 $14.7 $3.9 $4.2 $50 $4.1 $40 $33.4 $38.4 $33.9 $30 $26.8 $42.1 $2.0 $2.1 $20 $2.1 $1.2 $2.1 $8.0 $1.8 $3.3 $10 $2.0 $17.6 $10.7 $12.4 $12.3 $3.7 $0 $3.0 Q1 2017 Q2 2017 Q3 2017 Q4 2017 Q
Slide 11: Mortgage Banking
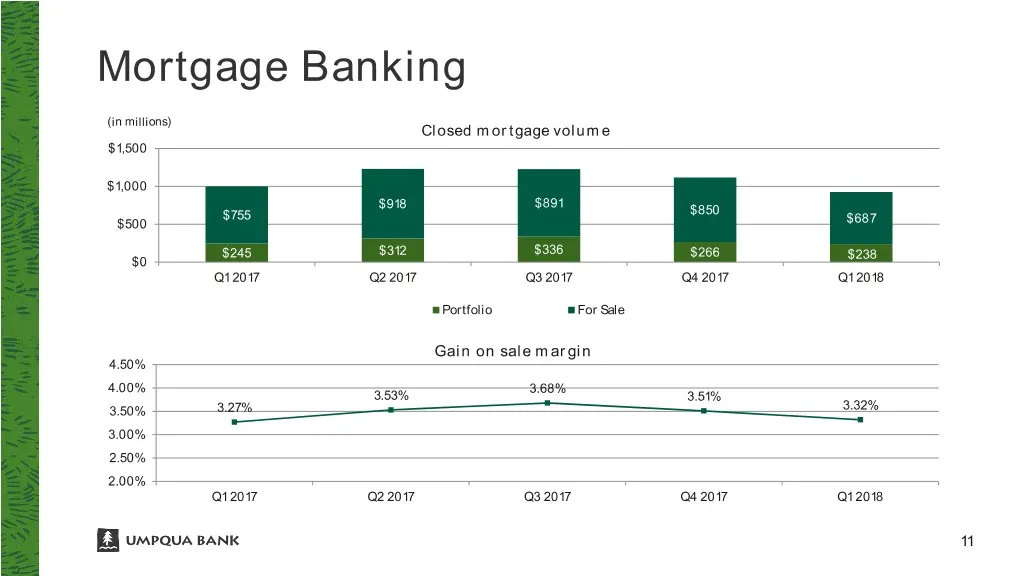
Mortgage Banking (in millions) Closed mortgage volume $1,500 $1,000 $918 $891 $755 $850 $500 $687 $245 $312 $336 $266 $238 $0 Q1 2017 Q2 2017 Q3 2017 Q4 2017 Q1 2018 Portfolio For Sale Gain on sale margin 4.50% 4.00% 3.68% 3.53% 3.51% 3.50% 3.27% 3.32% 3.00% 2.50% 2.00% Q1 2017 Q2 2017 Q3 2017 Q4 20
Slide 12: Mortgage Banking Outperforming Market
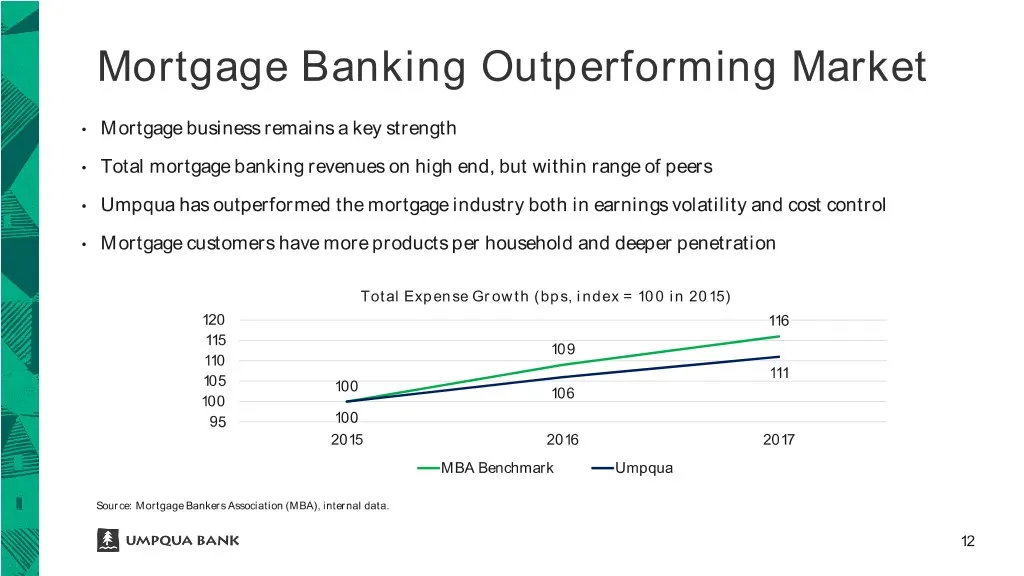
Mortgage Banking Outperforming Market • Mortgage business remains a key strength • Total mortgage banking revenues on high end, but within range of peers • Umpqua has outperformed the mortgage industry both in earnings volatility and cost control • Mortgage customers have more products per household
Slide 13: MSR Portfolio
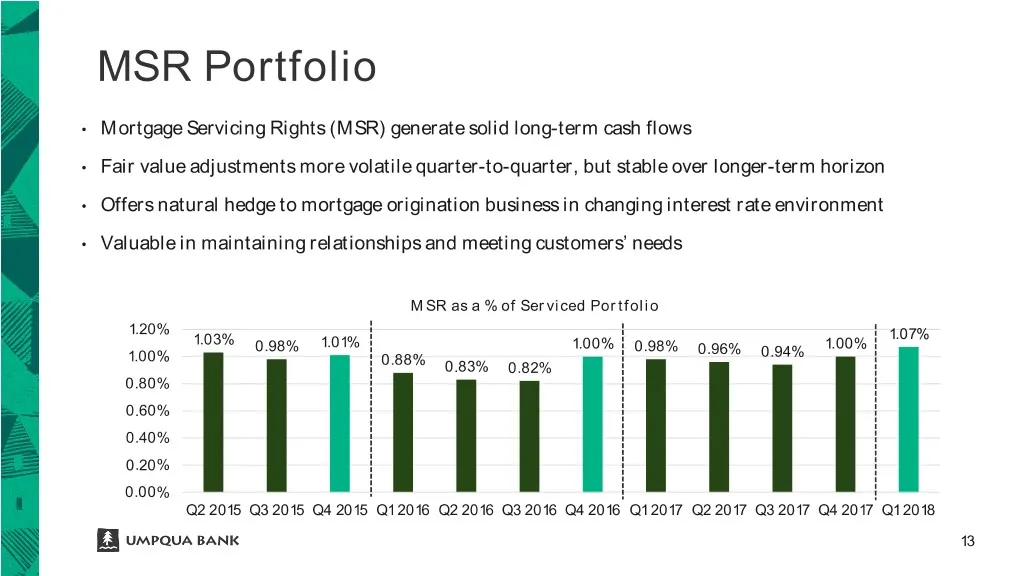
MSR Portfolio • Mortgage Servicing Rights (MSR) generate solid long-term cash flows • Fair value adjustments more volatile quarter-to-quarter, but stable over longer-term horizon • Offers natural hedge to mortgage origination business in changing interest rate environment • Valuable in maintaining r
Slide 14: Non-interest Expense
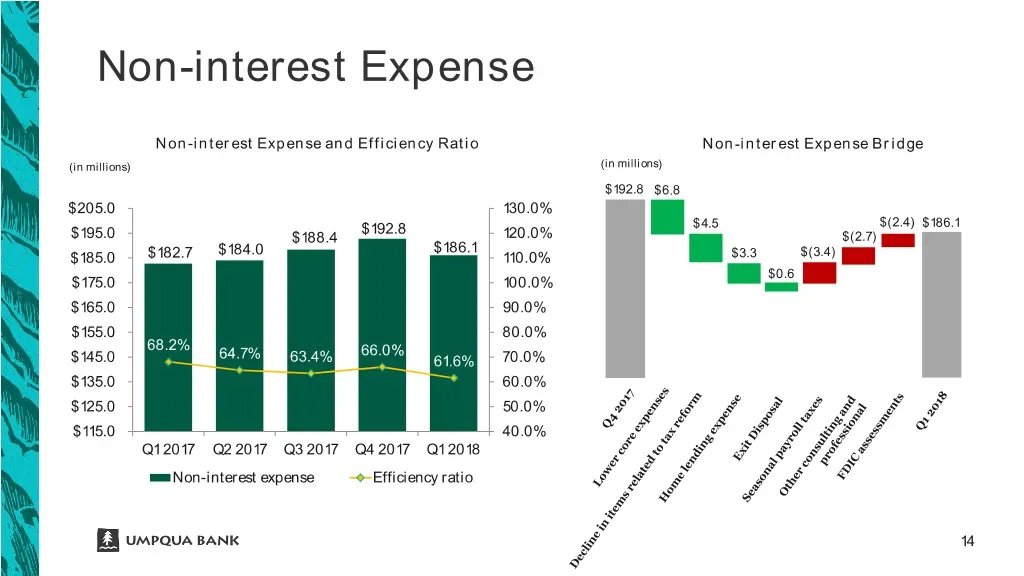
Non-interest Expense Non-interest Expense and Efficiency Ratio Non-interest Expense Bridge (in millions) (in millions) $192.8 $6.8 $205.0 130.0% $192.8 $4.5 $(2.4) $186.1 $195.0 $188.4 120.0% $(2.7) $184.0 $186.1 $185.0 $182.7 110.0% $3.3 $(3.4) $0.6 $175.0 100.0% $165.0 90.0% $155.0 80.0% 68.2% 64.
Slide 15: Loan and Deposit Growth
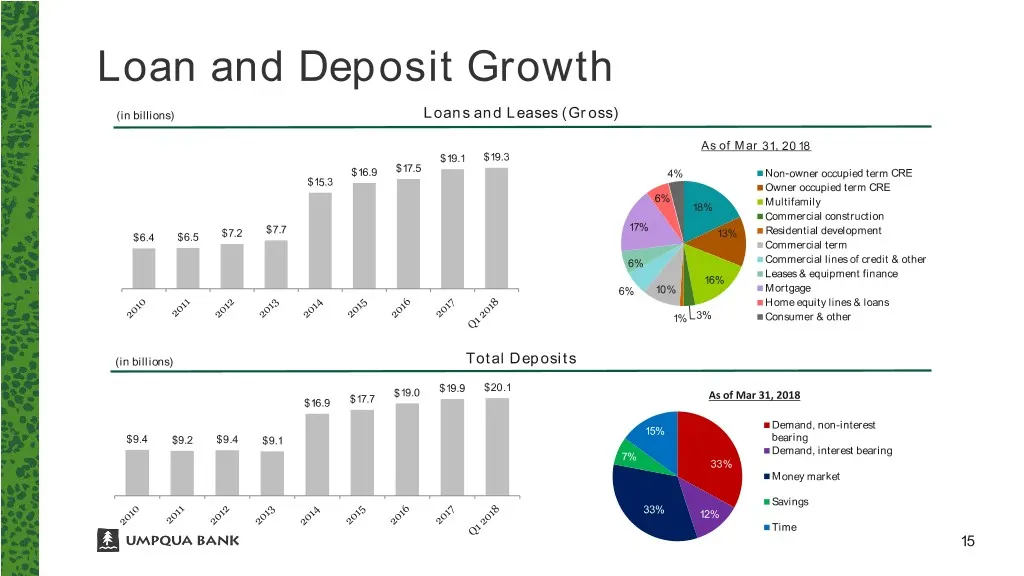
Loan and Deposit Growth (in billions) Loans and Leases (Gross) As of Mar 31, 2018 $19.1 $19.3 $17.5 $16.9 4% Non-owner occupied term CRE $15.3 Owner occupied term CRE 6% Multifamily 18% Commercial construction $7.7 17% Residential development $6.4 $6.5 $7.2 13% Commercial term 6% Commercial lines of
Slide 16: Credit Quality
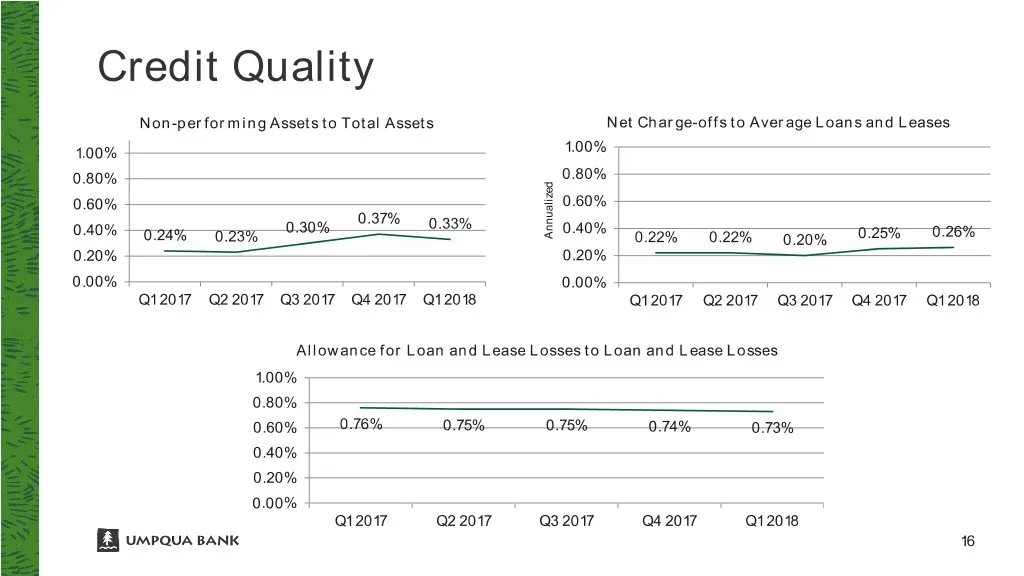
Credit Quality Non-performing Assets to Total Assets Net Charge-offs to Average Loans and Leases 1.00% 1.00% 0.80% 0.80% 0.60% 0.60% 0.37% 0.30% 0.33% 0.40% 0.40% Annualized 0.26% 0.24% 0.23% 0.22% 0.22% 0.20% 0.25% 0.20% 0.20% 0.00% 0.00% Q1 2017 Q2 2017 Q3 2017 Q4 2017 Q1 2018 Q1 2017 Q2 2017 Q3 2
Slide 17: Capital
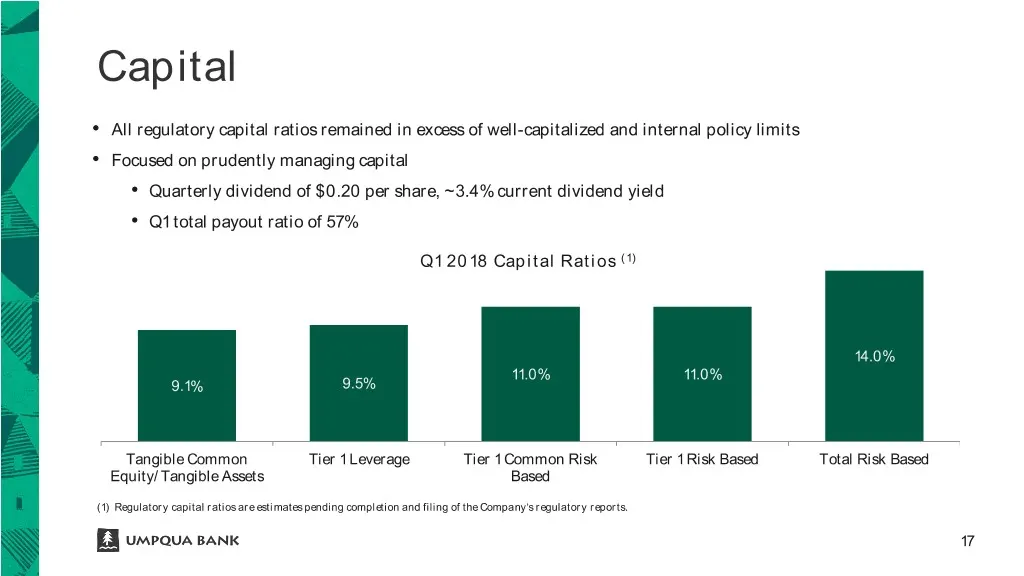
Capital • All regulatory capital ratios remained in excess of well-capitalized and internal policy limits • Focused on prudently managing capital • Quarterly dividend of $0.20 per share, ~3.4% current dividend yield • Q1 total payout ratio of 57% Q1 2018 Capital Ratios (1) 14.0% 11.0% 11.0% 9.1% 9.5

Slide 18: Questions?
Questions?
Source: SEC EDGAR · 8-K filed May 8, 2018
More decks from Umpqua Holdings Corporation
 Q4 2022 Earnings Presentation33 slides · Jan 24, 2023
 Q3 2022 Earnings Presentation35 slides · Oct 19, 2022
 Q2 2022 Earnings Presentation37 slides · Sep 2, 2022
 Q2 2022 Earnings Presentation37 slides · Jul 20, 2022
 Q1 2022 Earnings Presentation37 slides · May 26, 2022
 Q1 2022 Earnings Presentation36 slides · Apr 20, 2022