Triton International Ltd. · NYSE:TRTN/PA
Triton International — Investor Day (November 2021)
70 slides from Triton International's investor day presentation, Nov 17, 2021
Slide 1: Investor Day 2021
Investor Day 2021 November 17, 2021 1
Slide 2: Disclaimers
Disclaimers Forward-Looking Statements Certain statements in this presentation, other than statements of historical facts, including statements regarding our strategy, future operations, future financial position, future revenues, future costs, prospects, plans and objectives of management are "forw
Slide 3: Introduction
TRITON bik | Peete
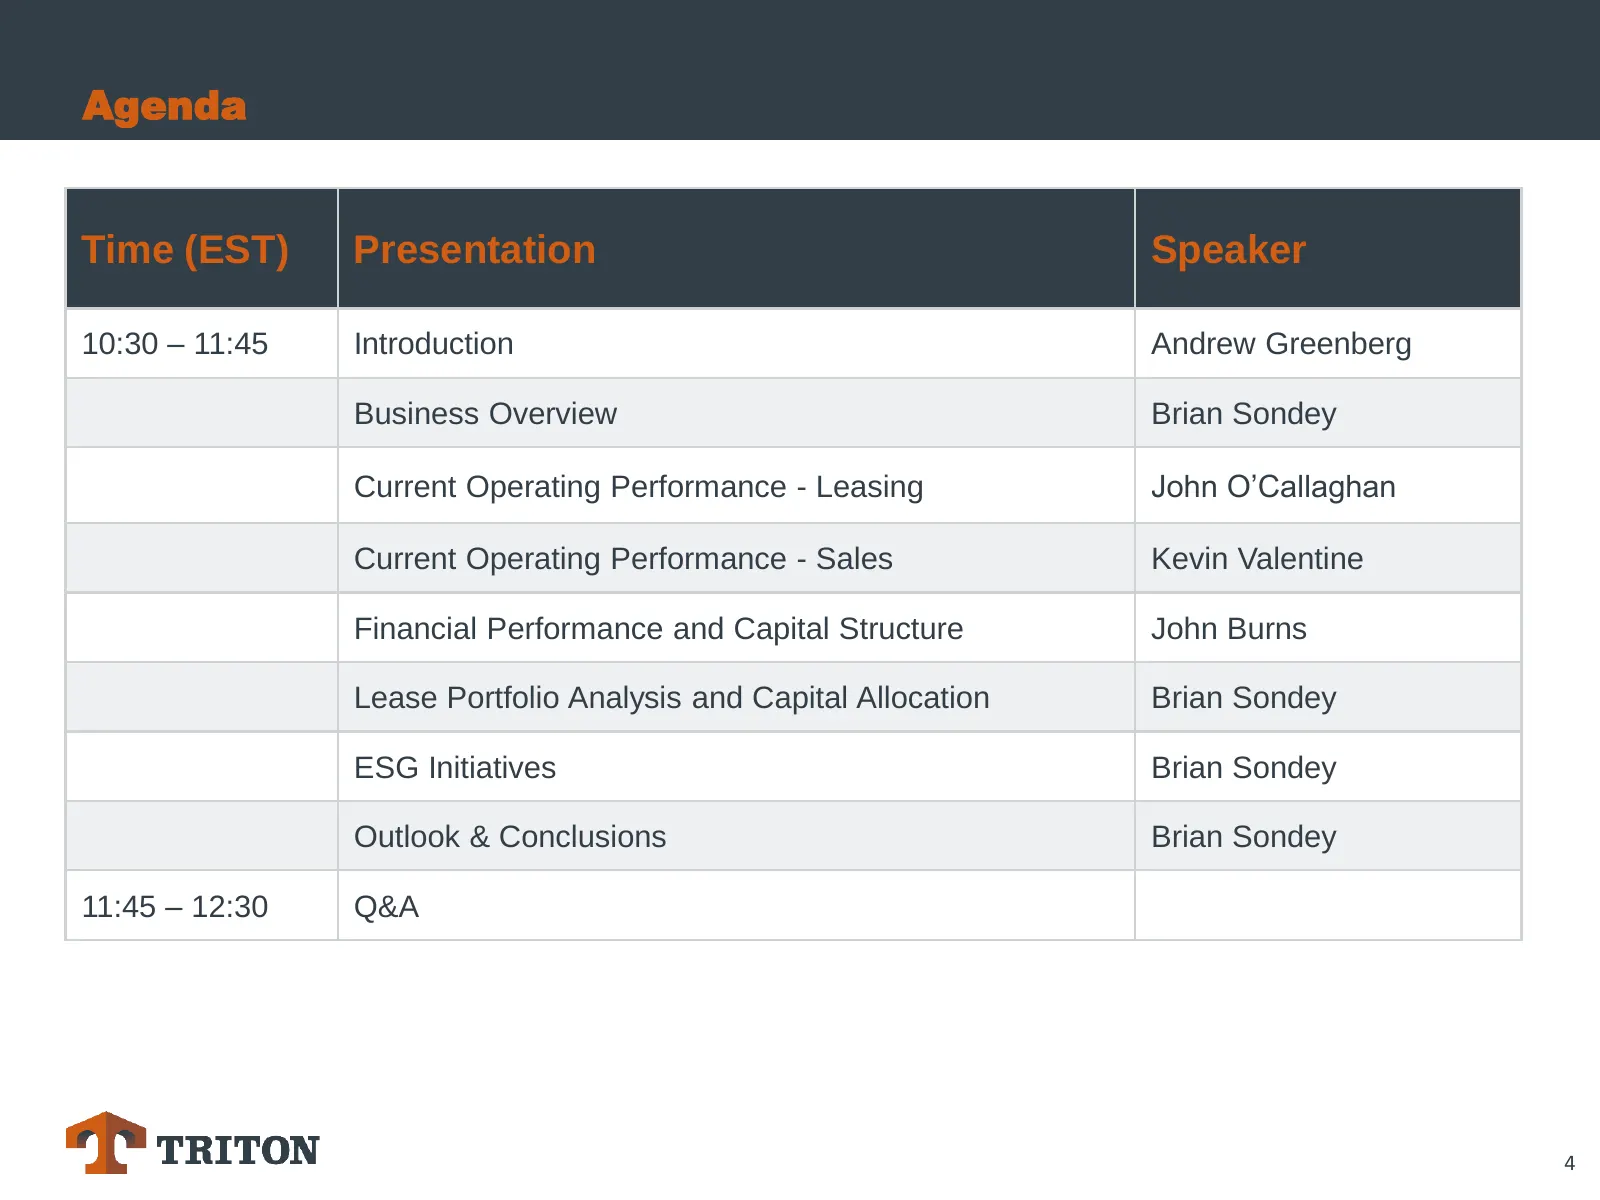
Slide 4: Agenda
Agenda Time (EST) Presentation Speaker 10:30 – 11:45 Introduction Andrew Greenberg Business Overview Brian Sondey Current Operating Performance - Leasing John O’Callaghan Current Operating Performance - Sales Kevin Valentine Financial Performance and Capital Structure John Burns Lease Portfolio Anal

Slide 5: Today's Speakers
Today’s Speakers Brian Sondey John Burns Chairman and Chief Executive Officer Chief Financial Officer • 25 years of industry experience • 25 years of industry experience • Chief Executive Officer since 1999 • Chief Financial Officer since 2009 John O’Callaghan Kevin Valentine EVP, Global Head of Fie
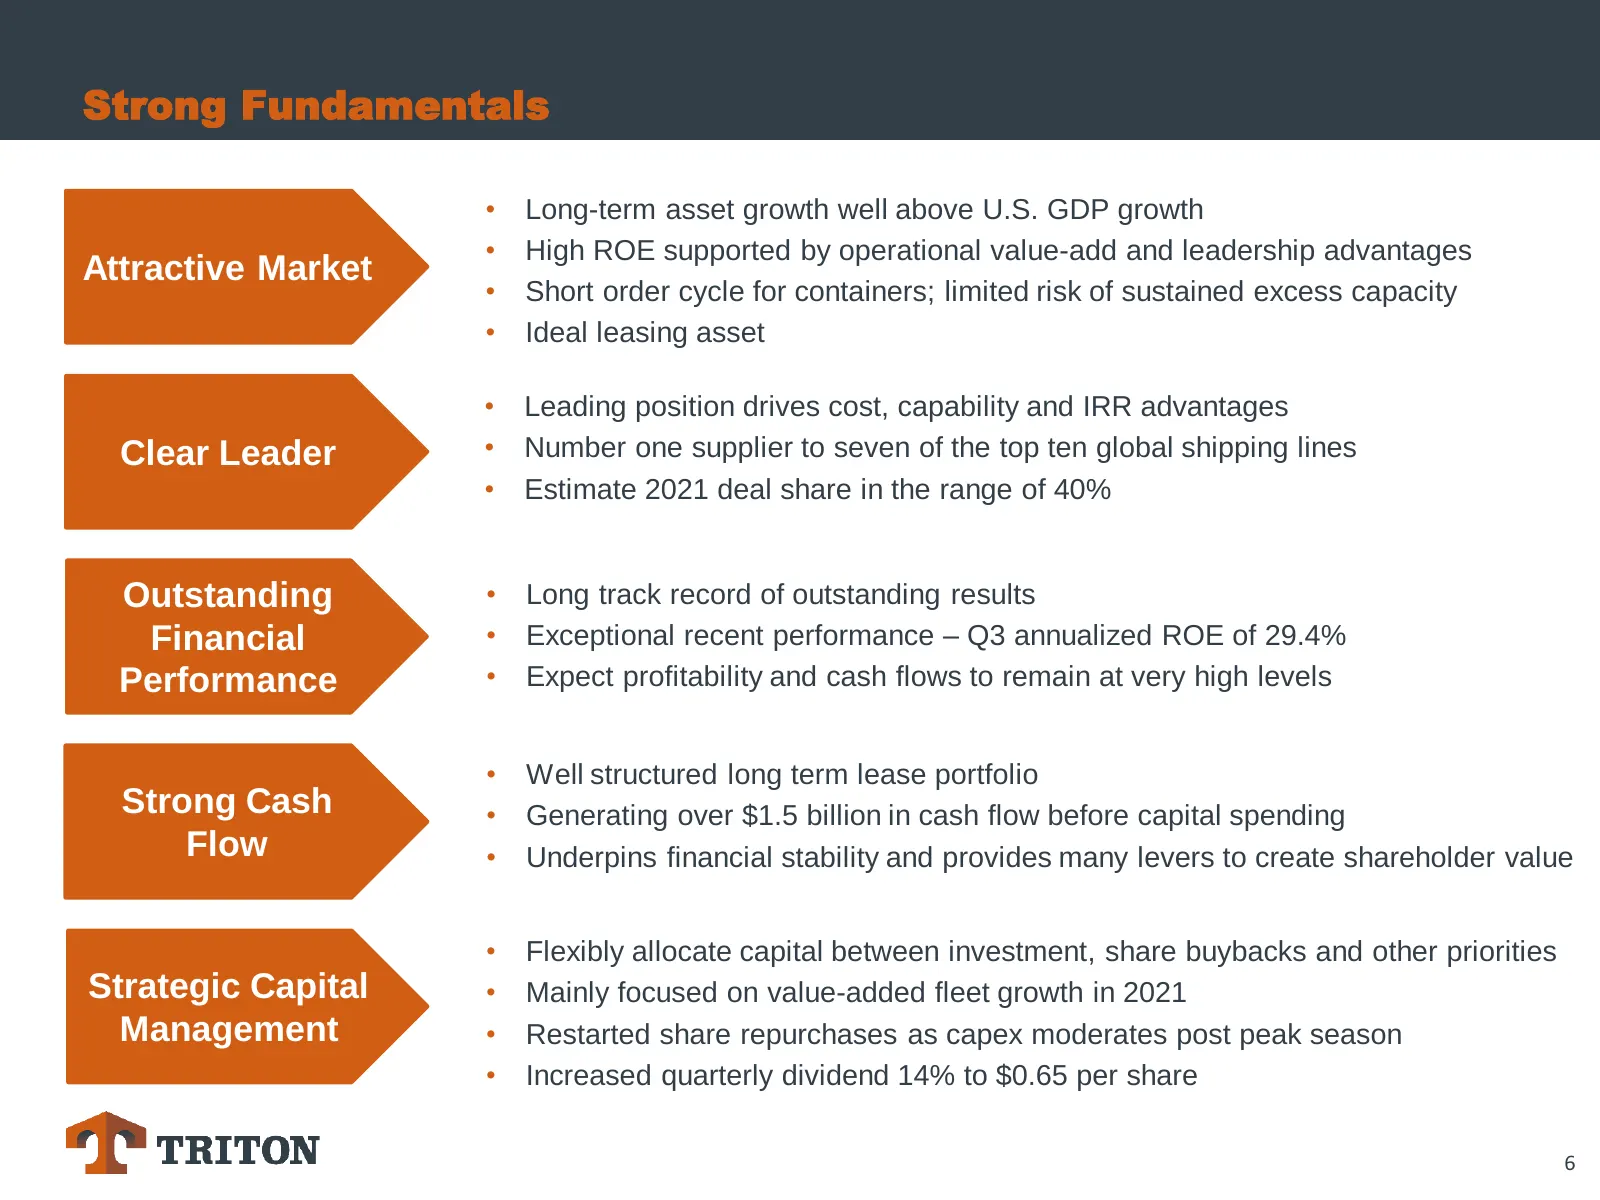
Slide 6: Strong Fundamentals
Strong Fundamentals • Long-term asset growth well above U.S. GDP growth • High ROE supported by operational value-add and leadership advantages Attractive Market • Short order cycle for containers; limited risk of sustained excess capacity • Ideal leasing asset • Leading position drives cost, capabi
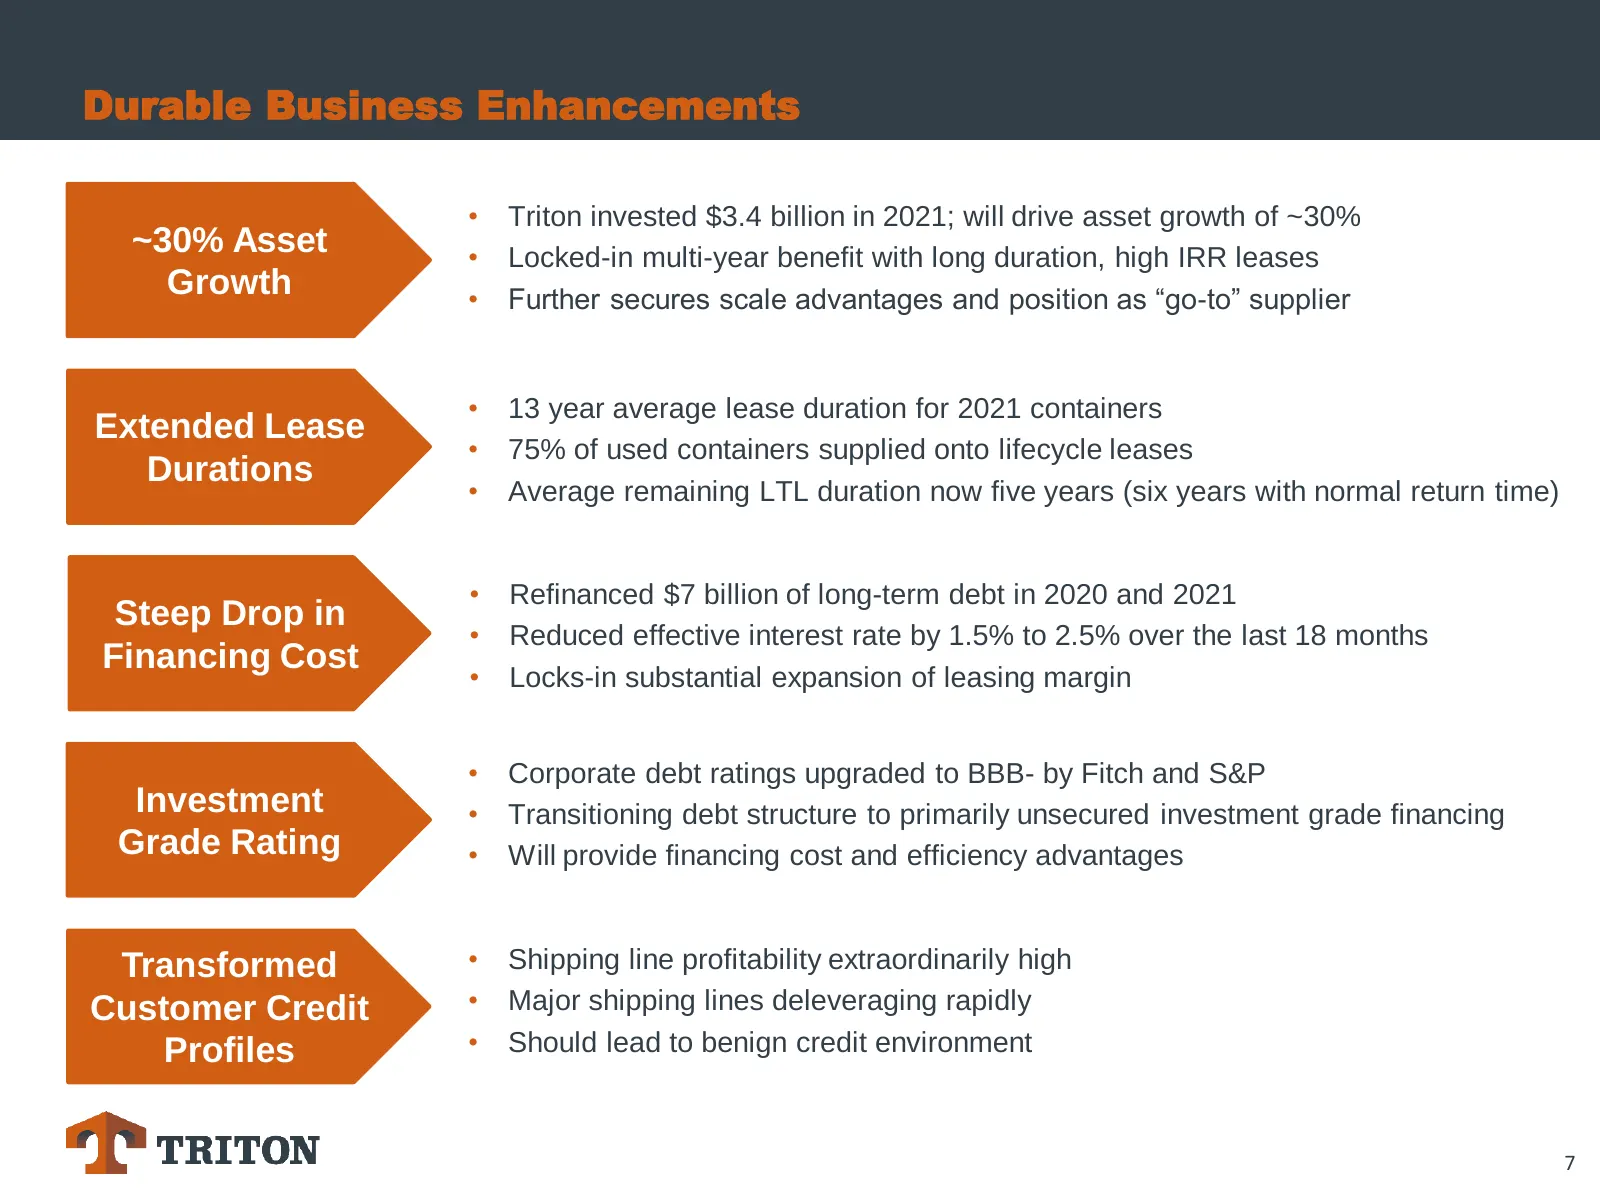
Slide 7: Durable Business Enhancements
Durable Business Enhancements • Triton invested $3.4 billion in 2021; will drive asset growth of ~30% ~30% Asset • Locked-in multi-year benefit with long duration, high IRR leases Growth • Further secures scale advantages and position as “go-to” supplier • 13 year average lease duration for 2021 con
Slide 8: Triton Overview
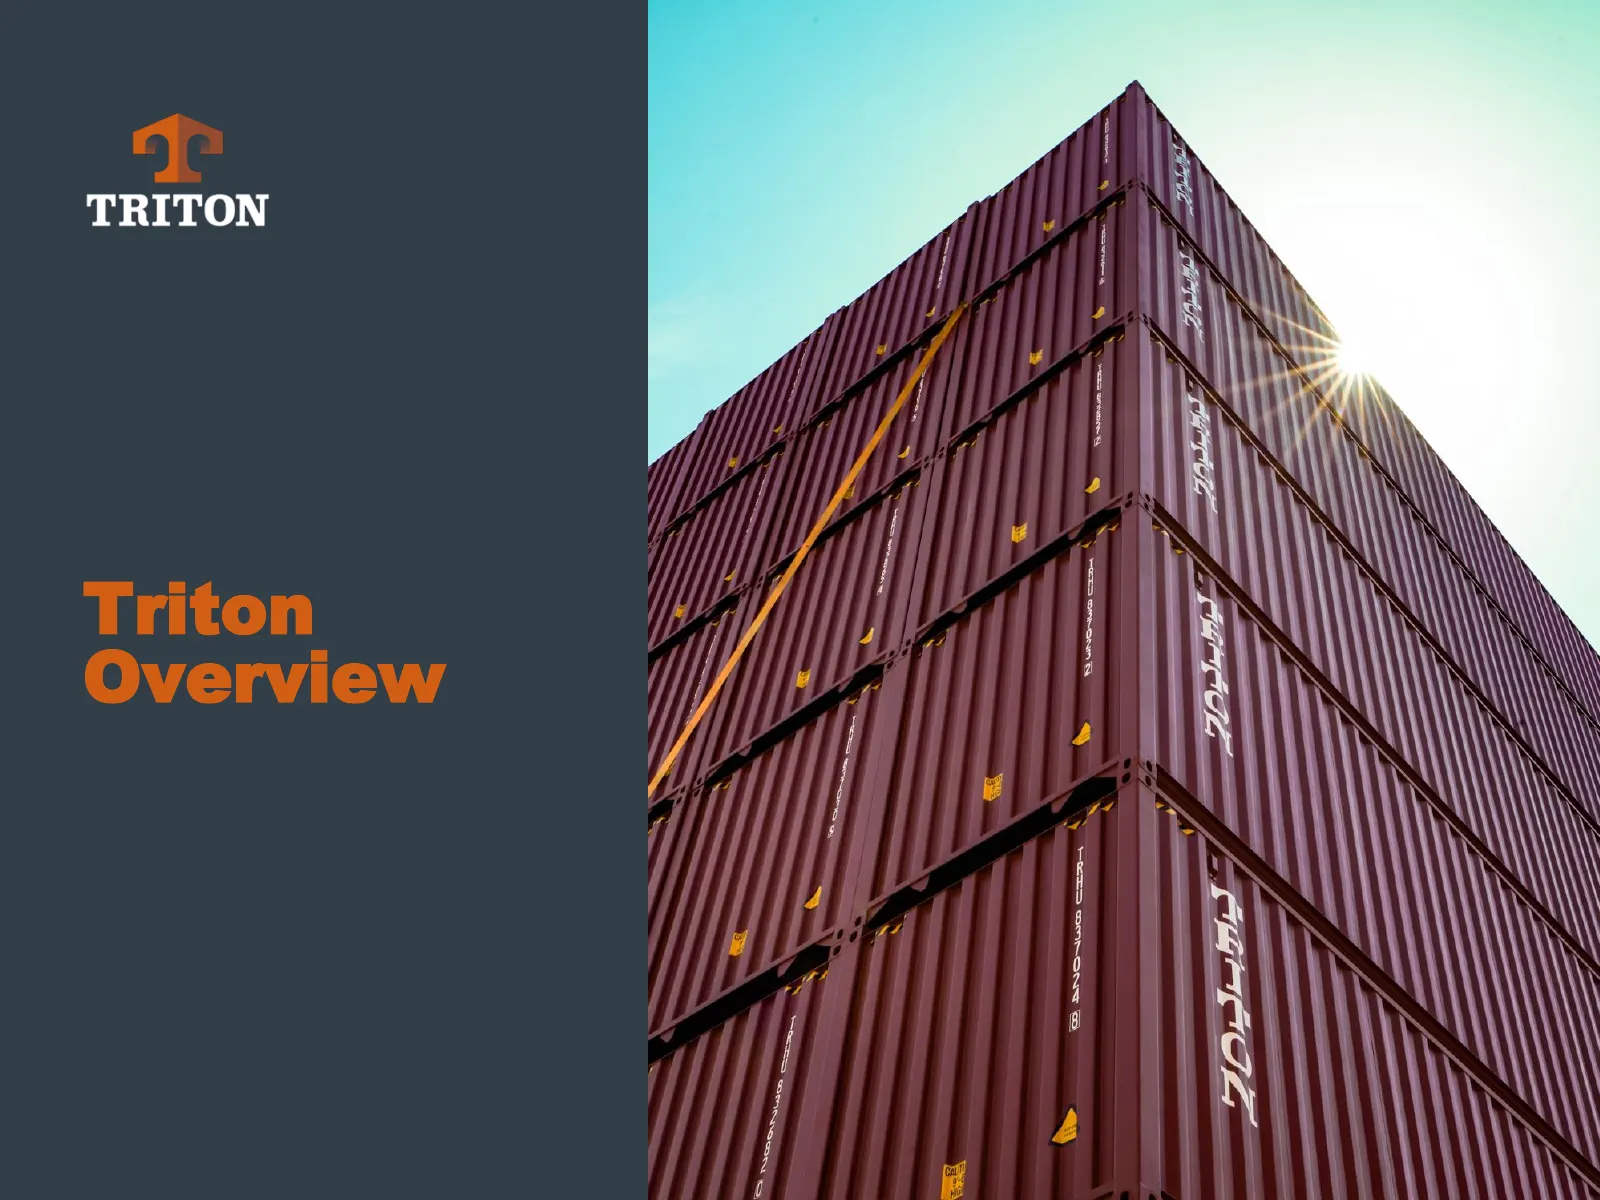
Triton Overview 8
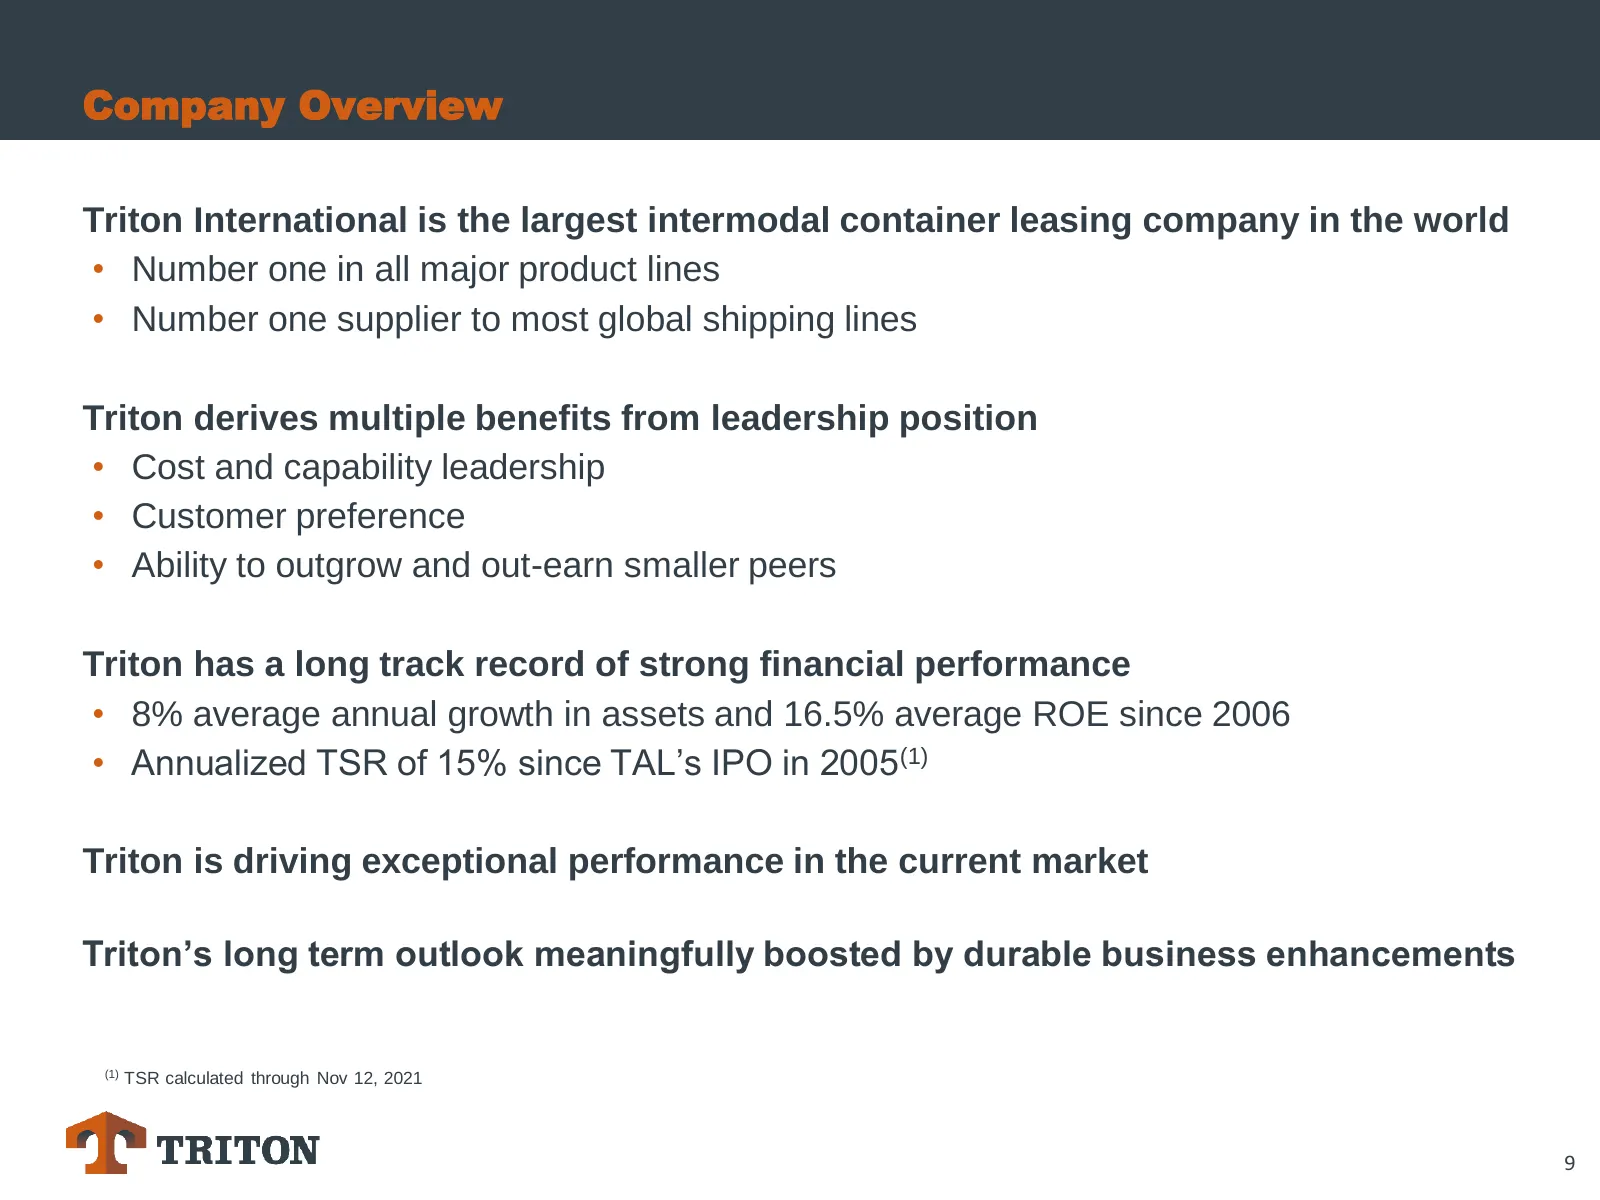
Slide 9: Company Overview
Company Overview Triton International is the largest intermodal container leasing company in the world • Number one in all major product lines • Number one supplier to most global shipping lines Triton derives multiple benefits from leadership position • Cost and capability leadership • Customer pre
Slide 10: #1 Position in Key Product Lines & Strong Lease Portfolio
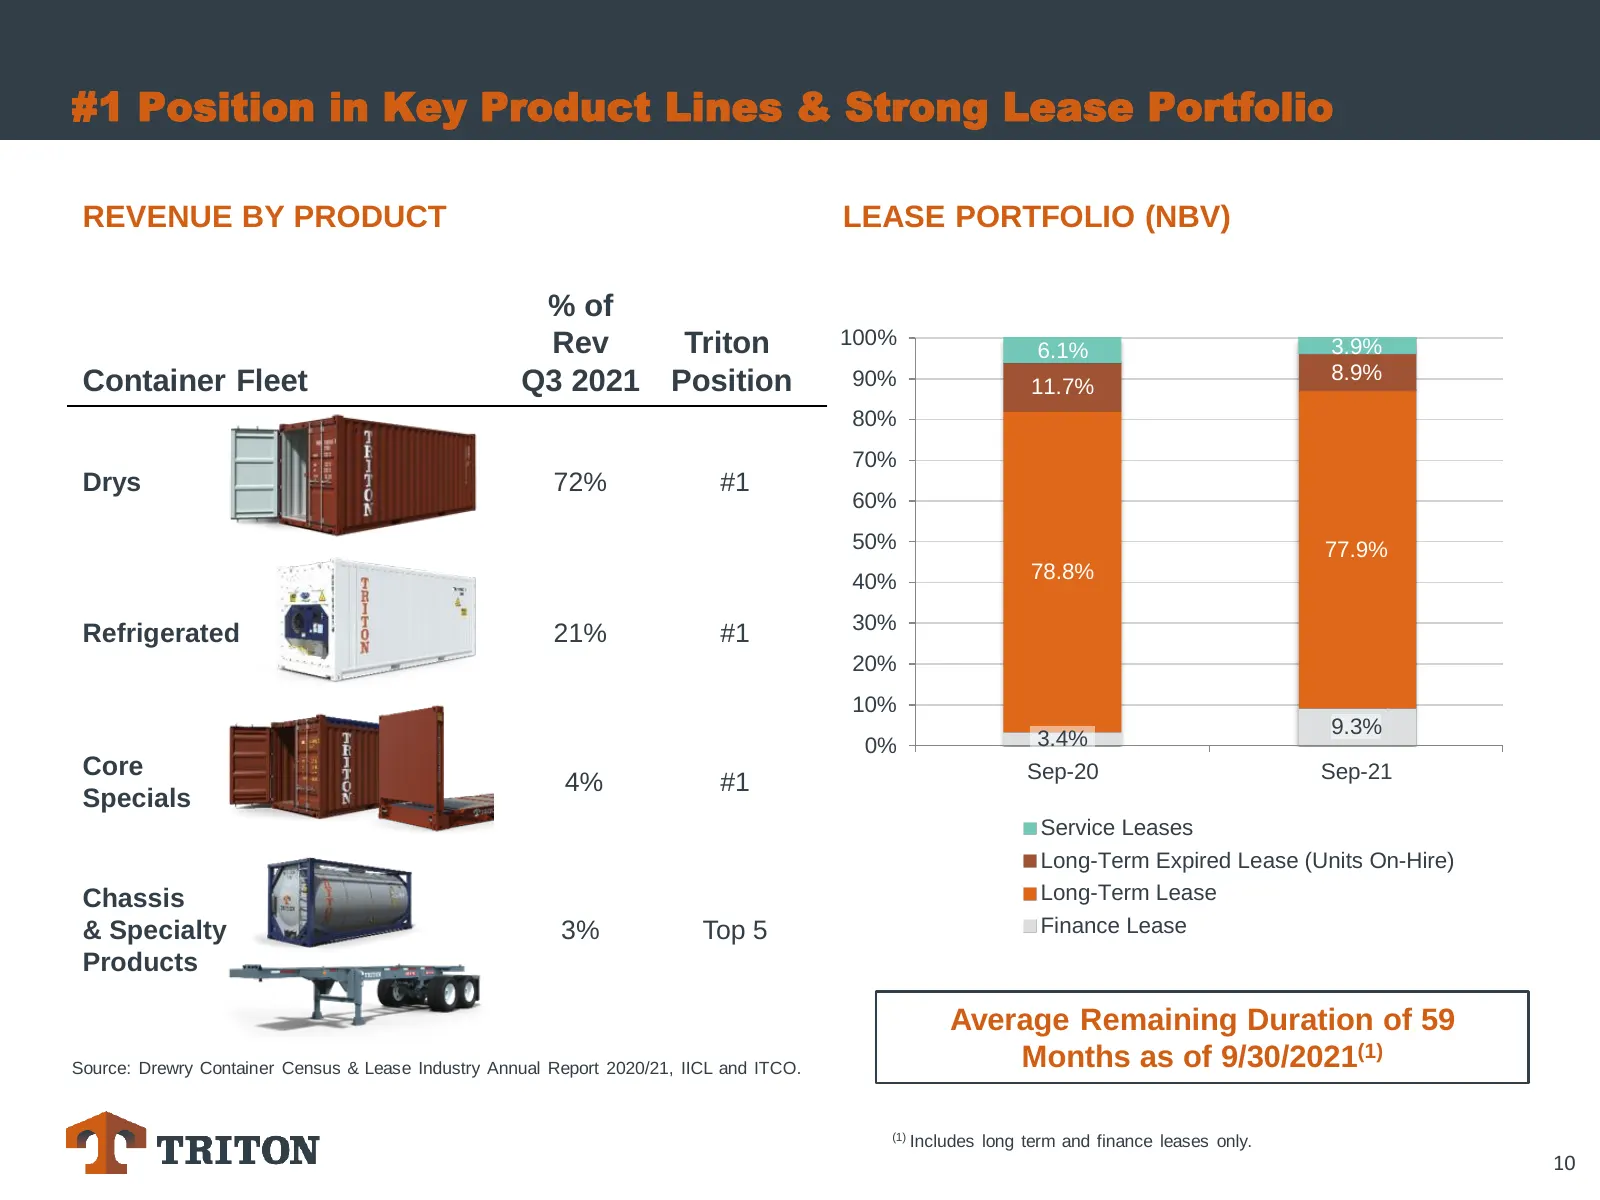
#1 Position in Key Product Lines & Strong Lease Portfolio REVENUE BY PRODUCT LEASE PORTFOLIO (NBV) % of Rev Triton 100% 3.9% 6.1% Container Fleet Q3 2021 Position 90% 8.9% 11.7% 80% 70% Drys 72% #1 60% 50% 77.9% 40% 78.8% 30% Refrigerated 21% #1 20% 10% 9.3% 0% 3.4% Core Sep-20 Sep-21 4% #1 Specials
Slide 11: Leading Position with Top Shipping Lines
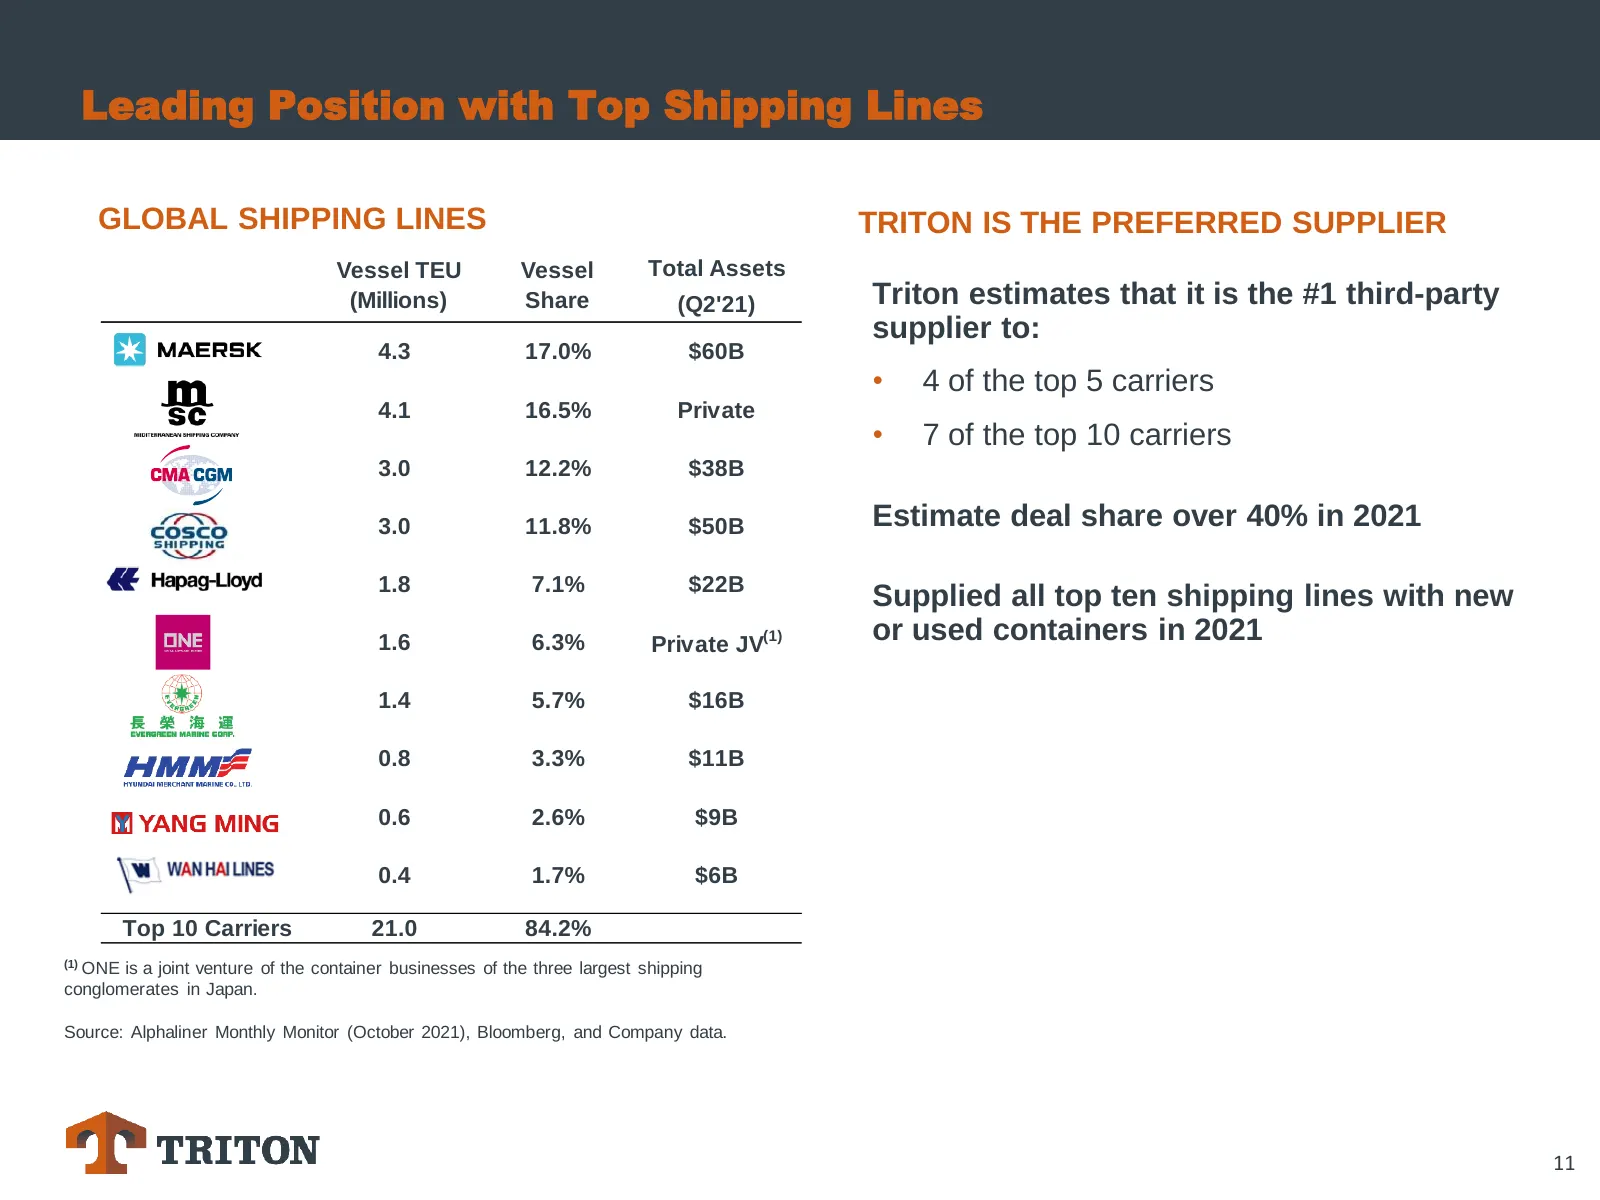
Leading Position with Top Shipping Lines GLOBAL SHIPPING LINES TRITON IS THE PREFERRED SUPPLIER Vessel TEU Vessel Total Assets (Millions) Share (Q2'21) Triton estimates that it is the #1 third-party supplier to: 4.3 17.0% $60B • 4 of the top 5 carriers 4.1 16.5% Private • 7 of the top 10 carriers 3.
Slide 12: Long-Term Market Growth
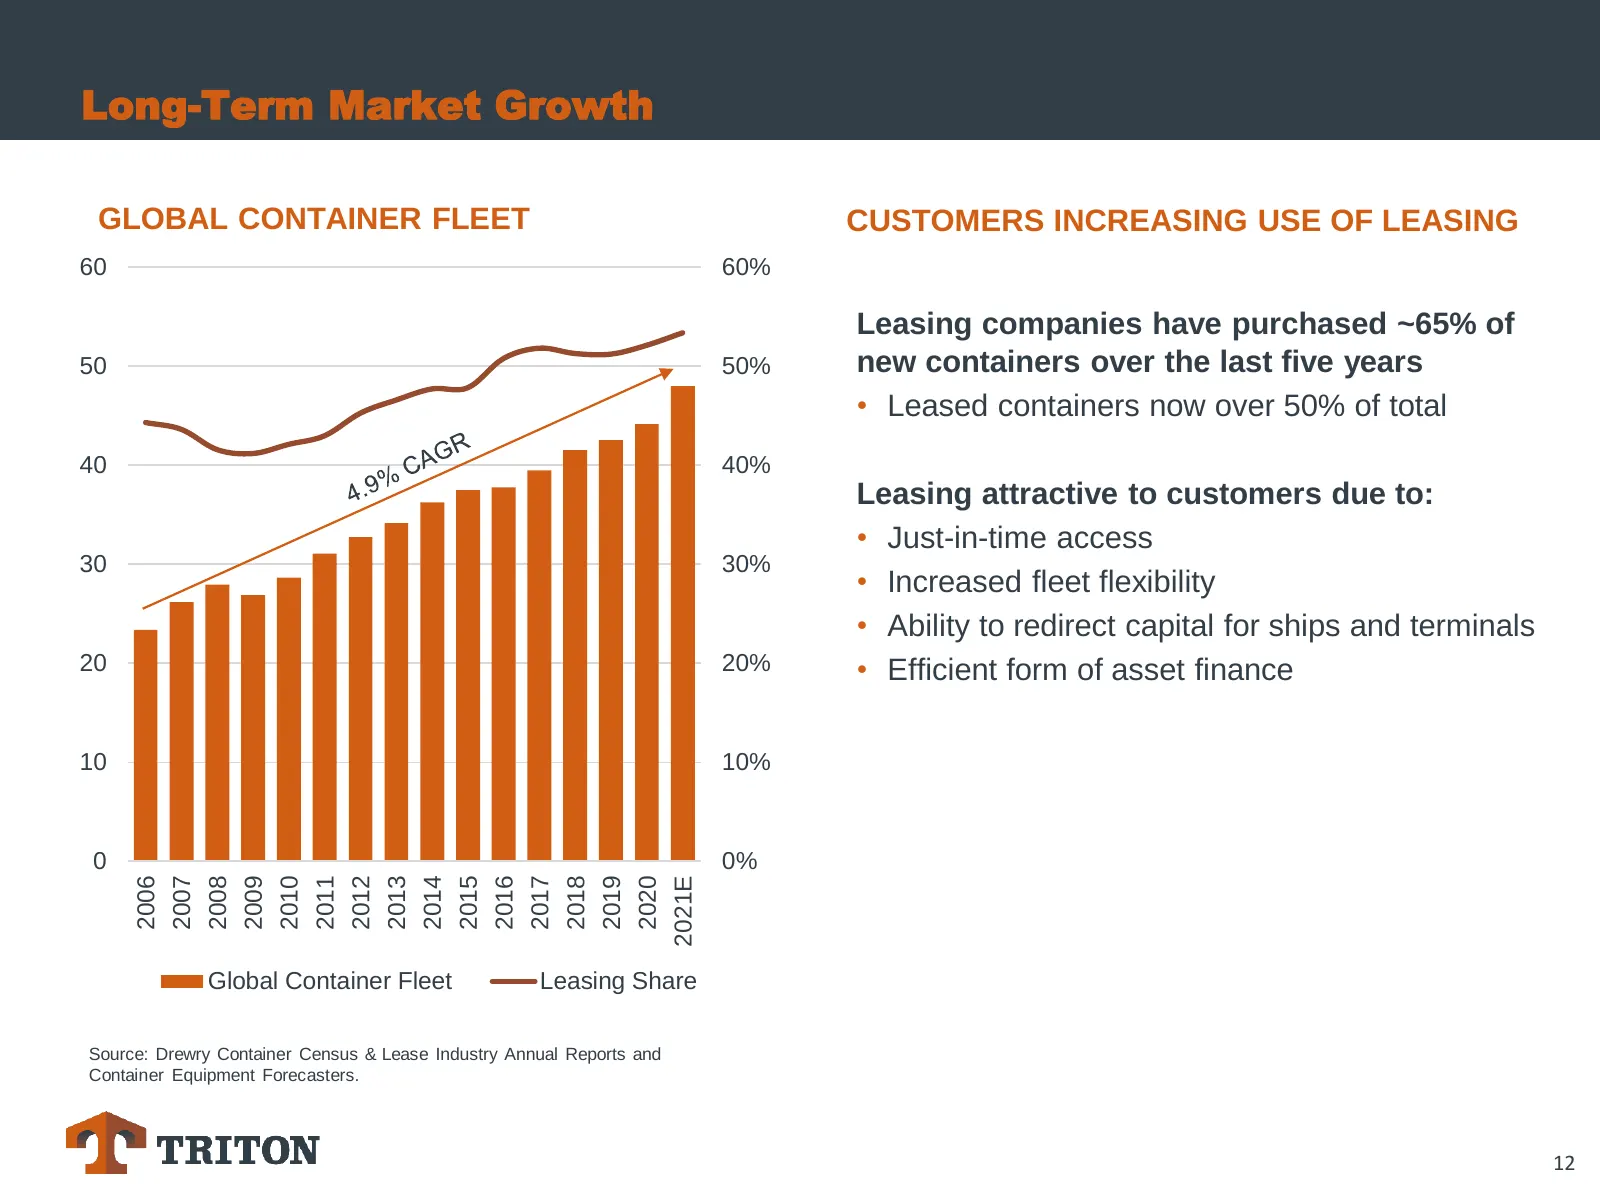
Long-Term Market Growth GLOBAL CONTAINER FLEET CUSTOMERS INCREASING USE OF LEASING 60 60% Leasing companies have purchased ~65% of 50 50% new containers over the last five years • Leased containers now over 50% of total 40 40% Leasing attractive to customers due to: • Just-in-time access 30 30% • In
Slide 13: Additional Growth Drivers for Triton
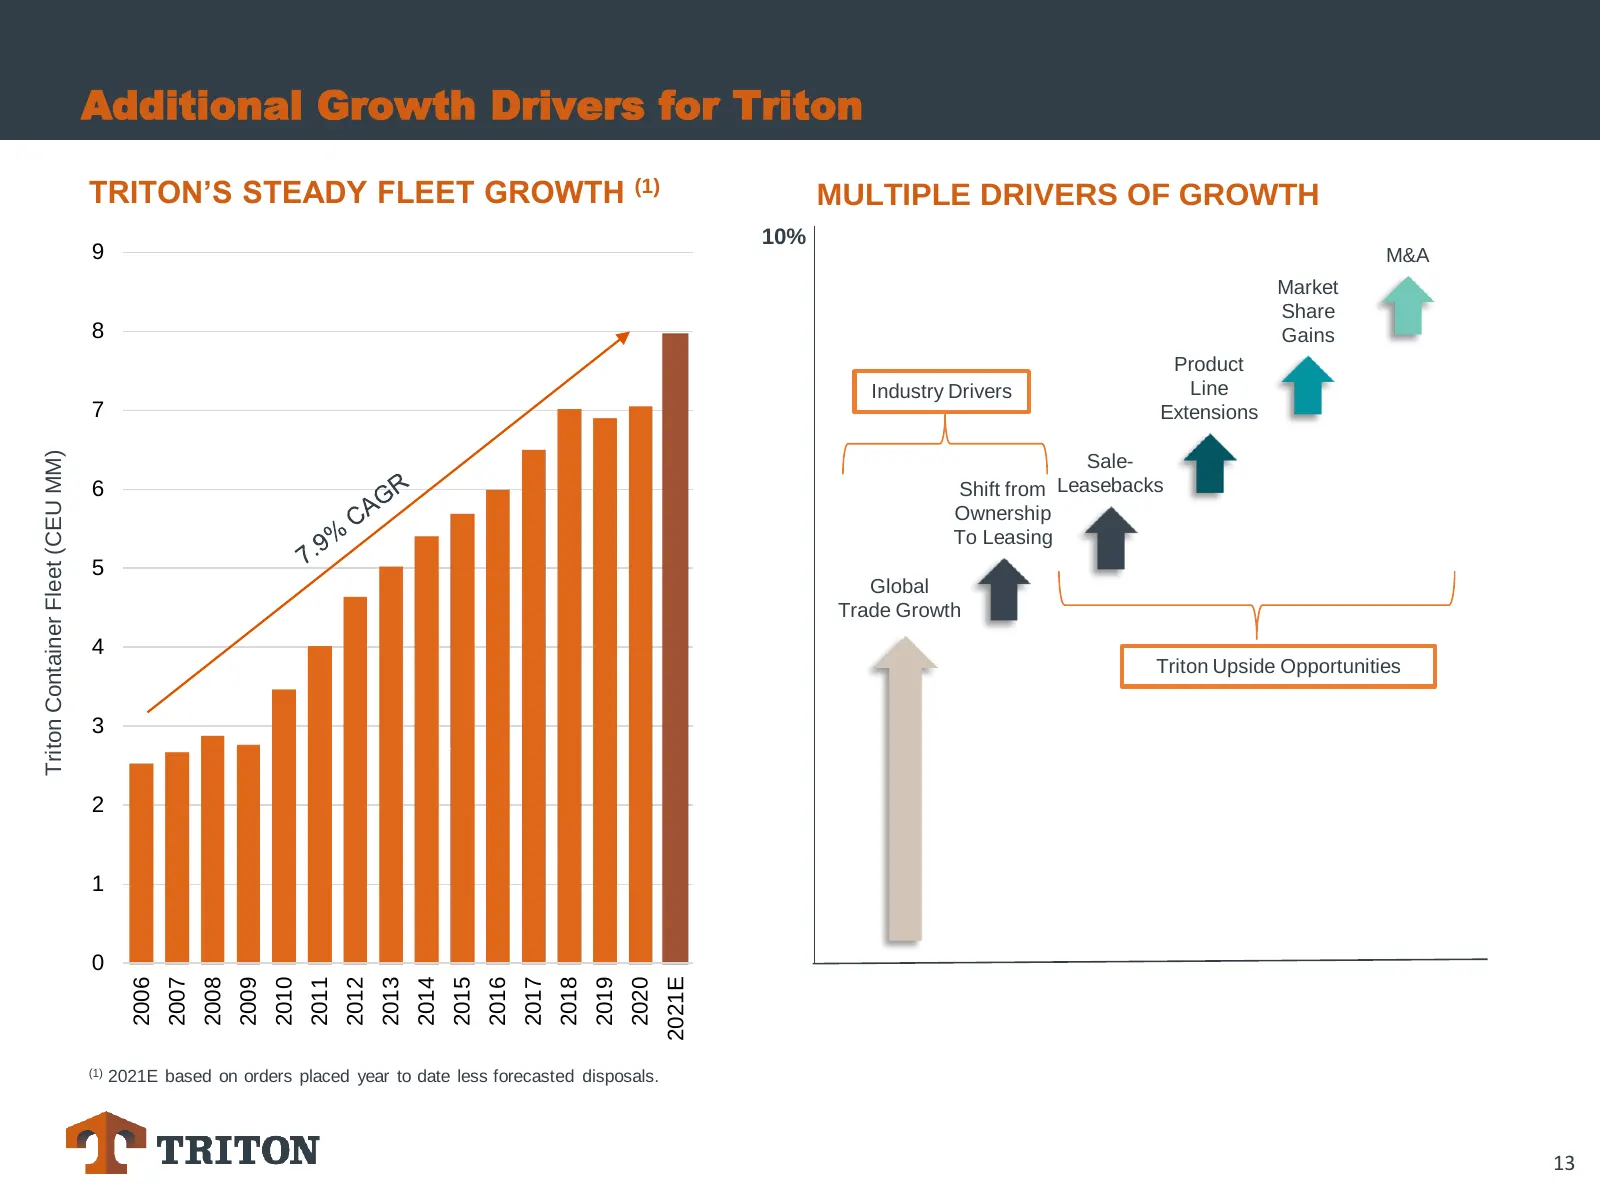
Additional Growth Drivers for Triton TRITON’S STEADY FLEET GROWTH (1) MULTIPLE DRIVERS OF GROWTH 10% 9 M&A Market Share 8 Gains Product Industry Drivers Line 7 Extensions Triton Container Fleet (CEU MM) Sale- 6 Shift from Leasebacks Ownership To Leasing 5 Global Trade Growth 4 Triton Upside Opportun
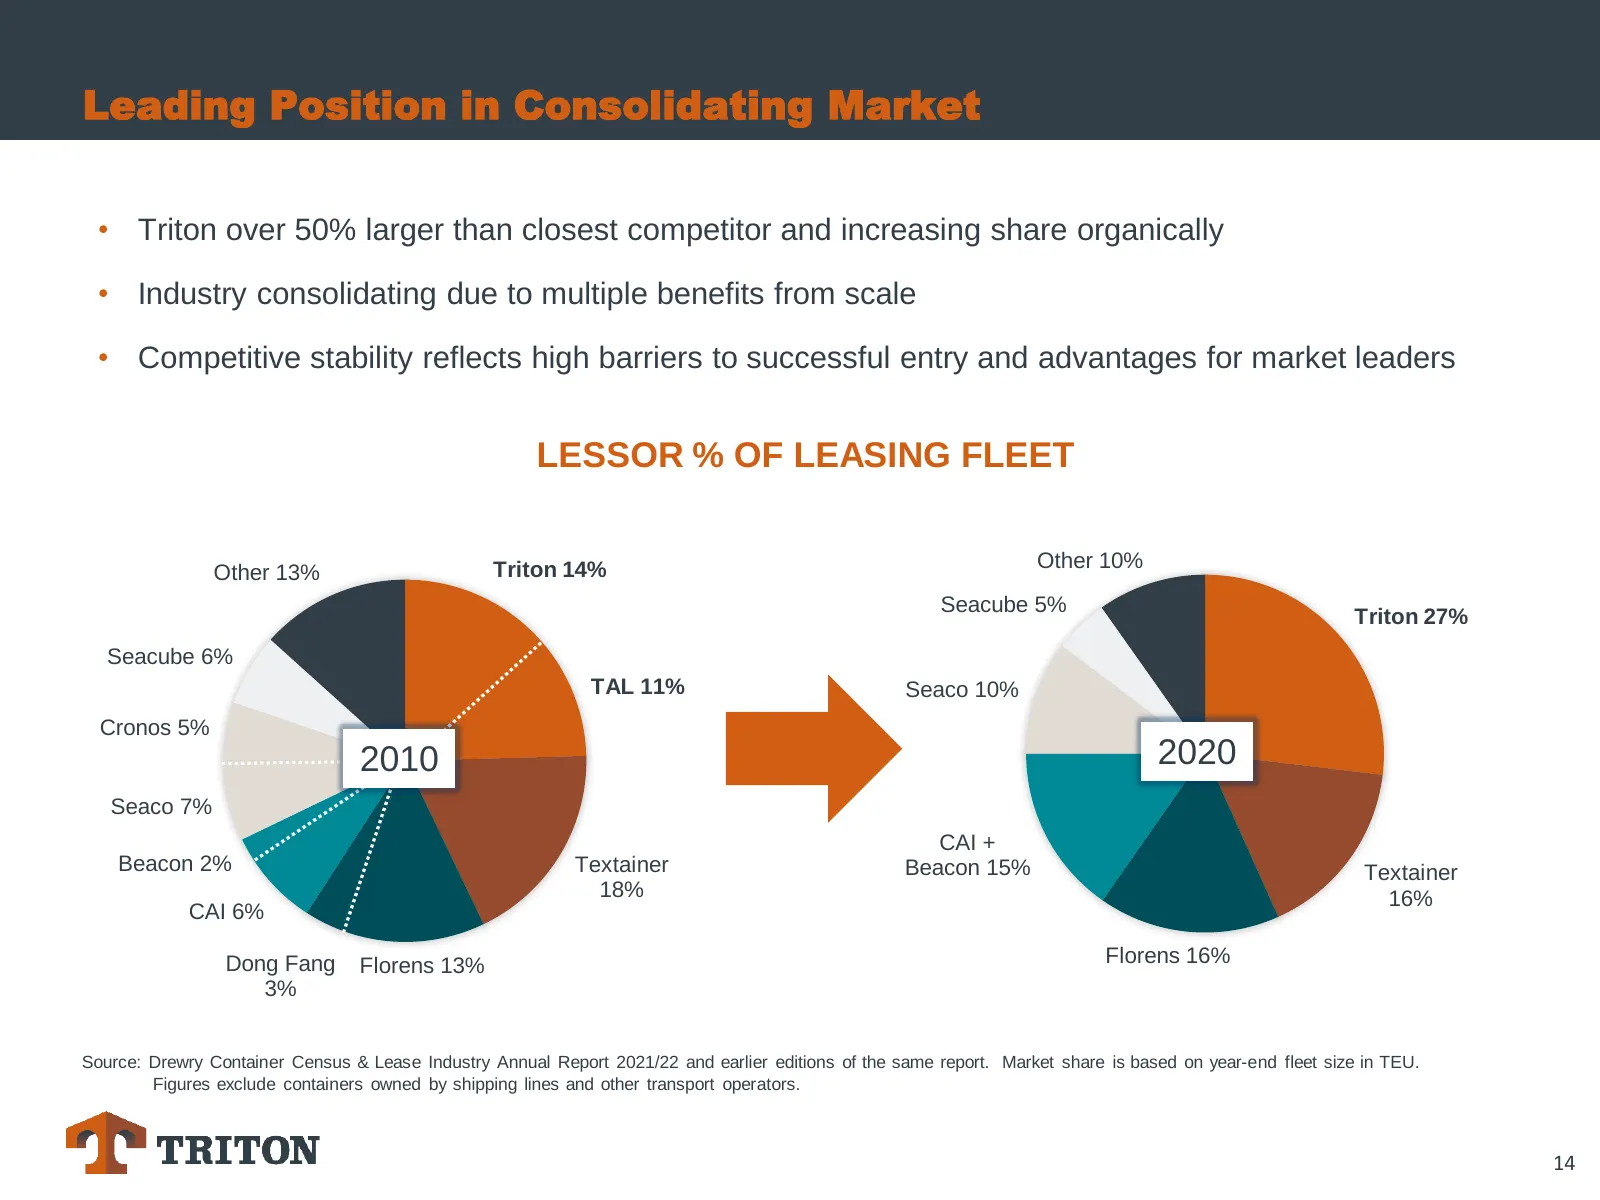
Slide 14: Leading Position in Consolidating Market
Leading Position in Consolidating Market • Triton over 50% larger than closest competitor and increasing share organically • Industry consolidating due to multiple benefits from scale • Competitive stability reflects high barriers to successful entry and advantages for market leaders LESSOR % OF LEA
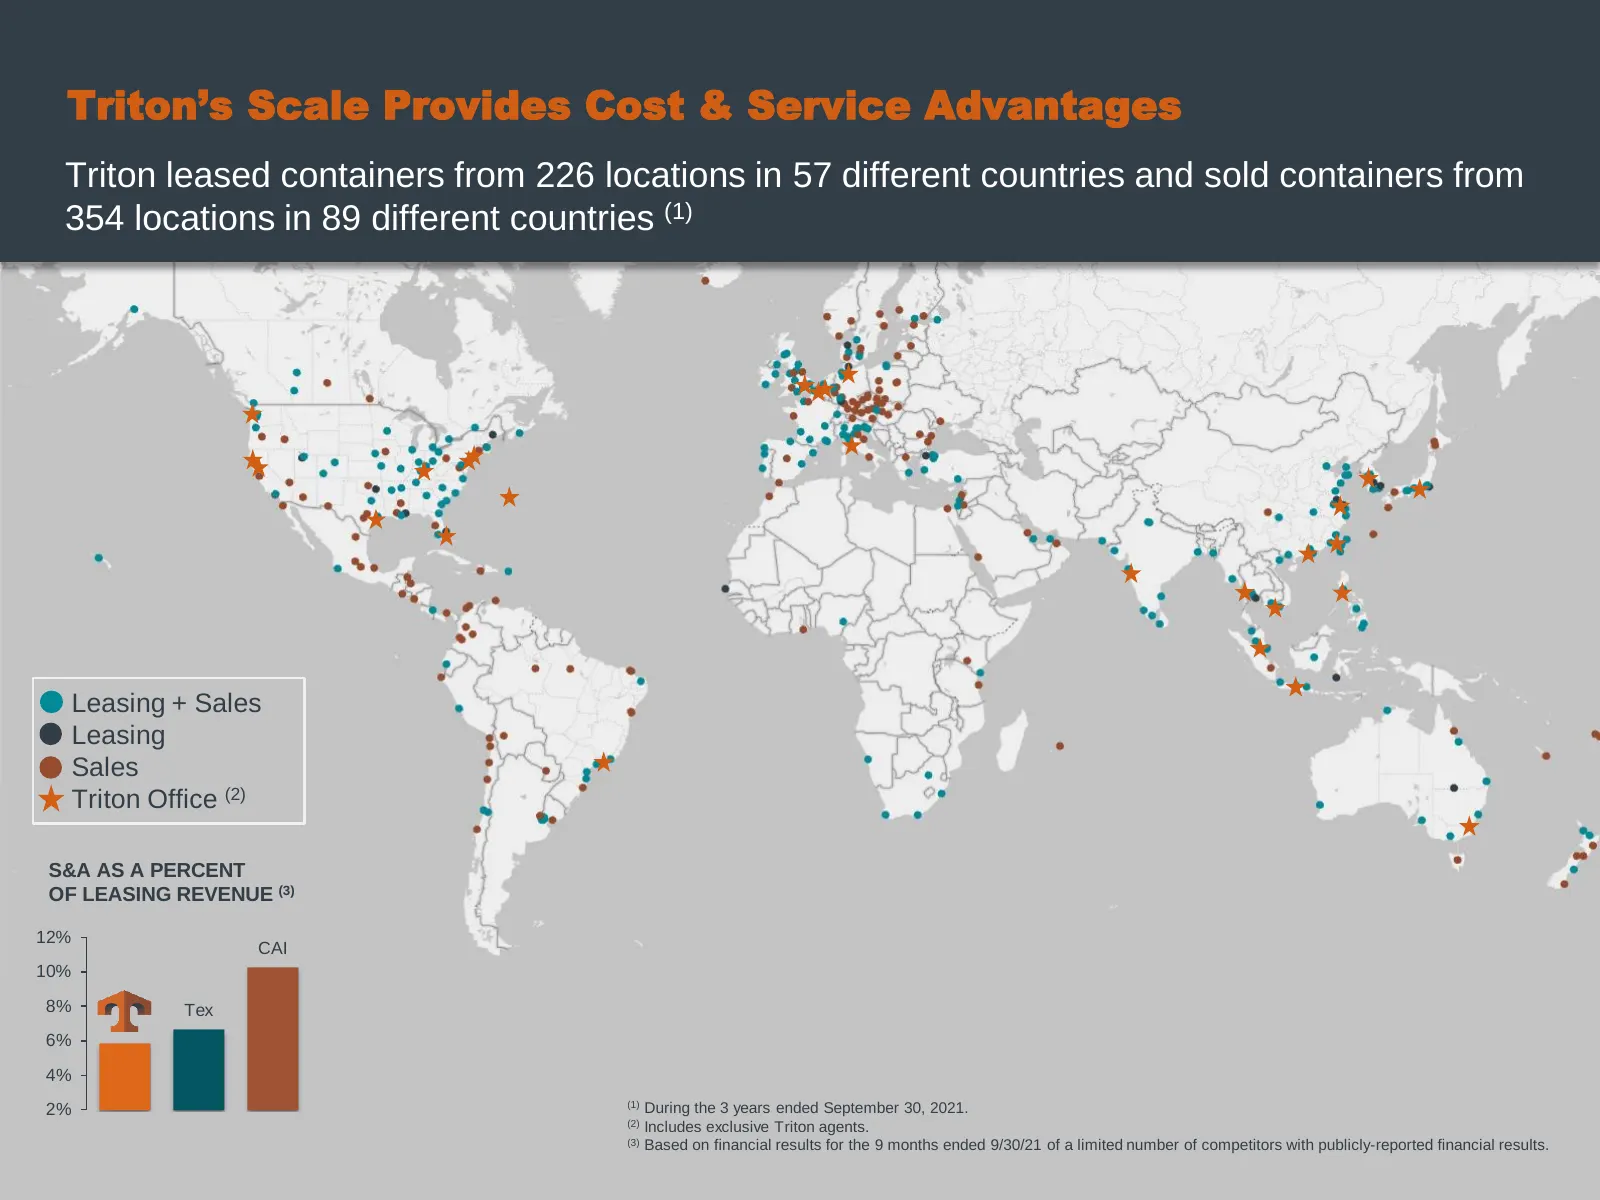
Slide 15: Triton's Scale Provides Cost & Service Advantages
Triton’s Scale Provides Cost & Service Advantages Triton leased containers from 226 locations in 57 different countries and sold containers from 354 locations in 89 different countries (1) Leasing + Sales Leasing Sales Triton Office (2) S&A AS A PERCENT OF LEASING REVENUE (3) 12% CAI 10% 8% Tex 6% 4
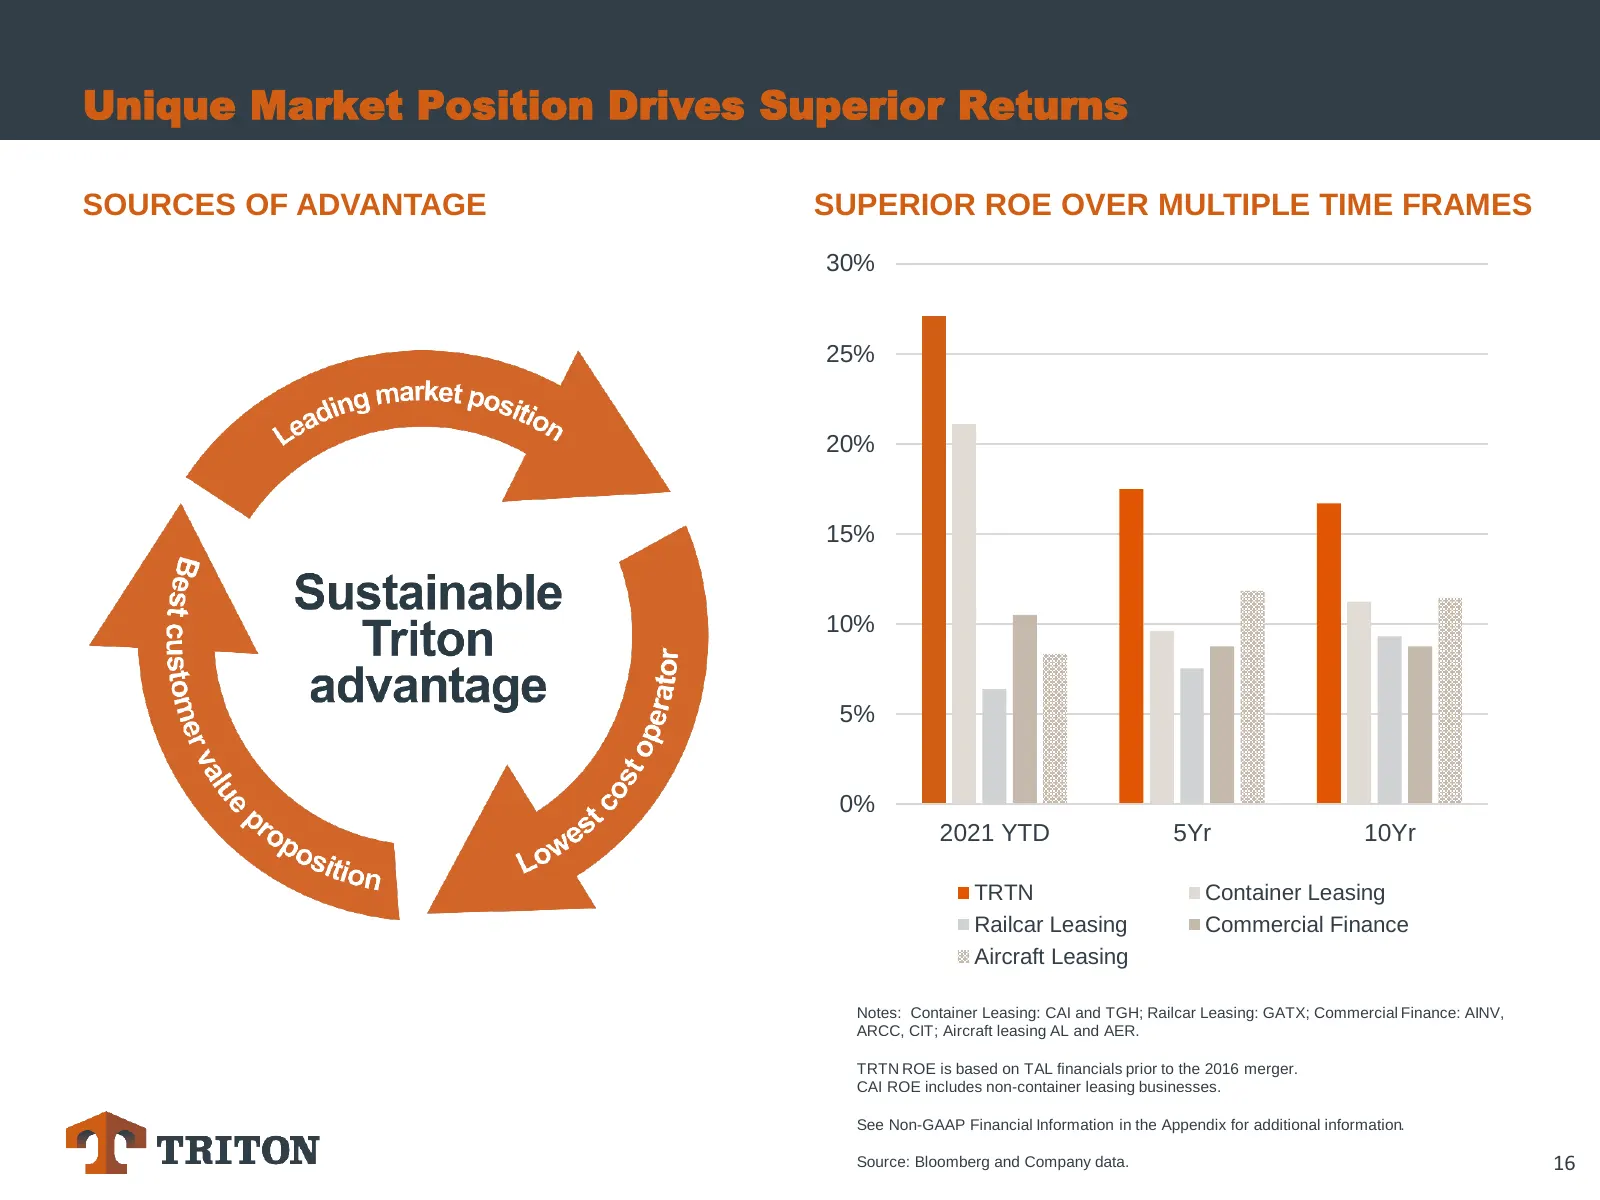
Slide 16: Unique Market Position Drives Superior Returns
Unique Market Position Drives Superior Returns SOURCES OF ADVANTAGE SUPERIOR ROE OVER MULTIPLE TIME FRAMES 30% 25% 20% 15% 10% 5% 0% 2021 YTD 5Yr 10Yr TRTN Container Leasing Railcar Leasing Commercial Finance Aircraft Leasing Notes: Container Leasing: CAI and TGH; Railcar Leasing: GATX; Commercial F
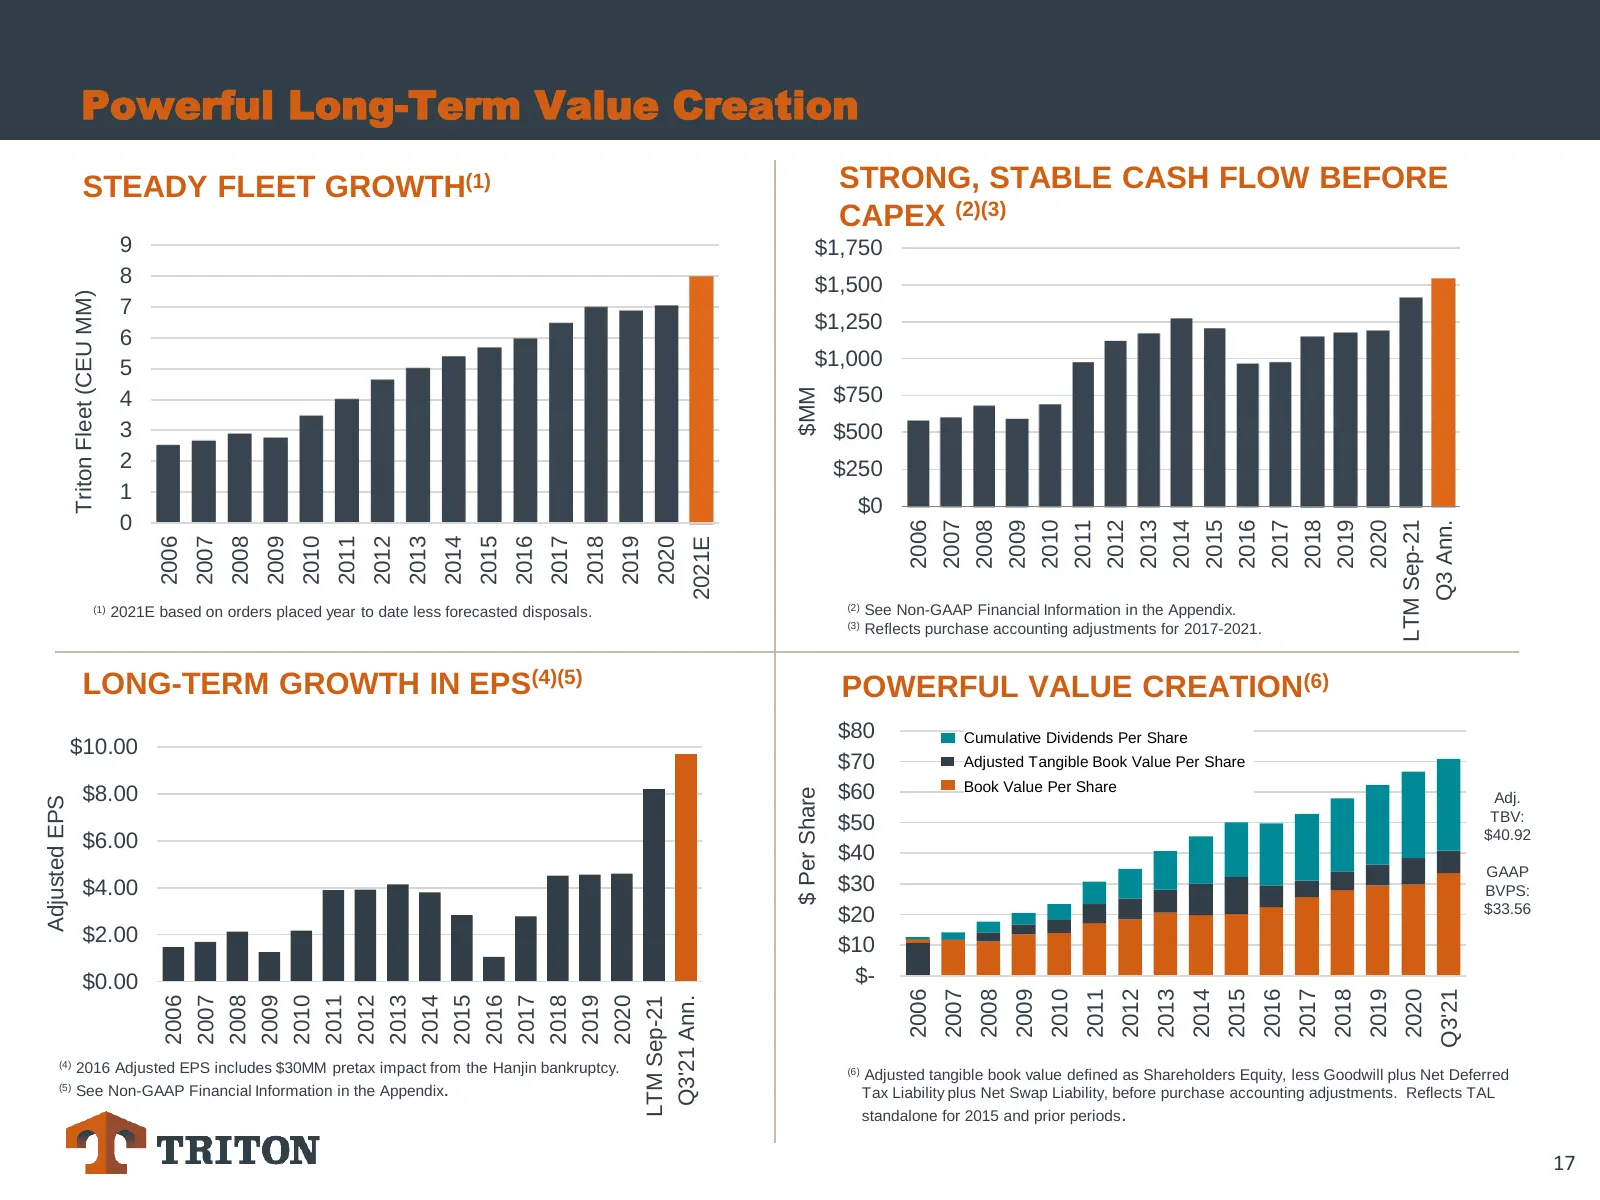
Slide 17: Powerful Long-Term Value Creation
Powerful Long-Term Value Creation STEADY FLEET GROWTH(1) STRONG, STABLE CASH FLOW BEFORE CAPEX (2)(3) 9 $1,750 8 $1,500 Triton Fleet (CEU MM) 7 $1,250 6 5 $1,000 $MM 4 $750 3 $500 2 $250 1 $0 0 2006 2007 2008 2009 2010 2011 2012 2013 2014 2015 2016 2017 2018 2019 2020 LTM Sep-21 Q3 Ann. 2006 2007 20
Slide 18: Current Operating Performance: Leasing
Current Operating Performance LEASING 18
Slide 19: Current Performance Overview
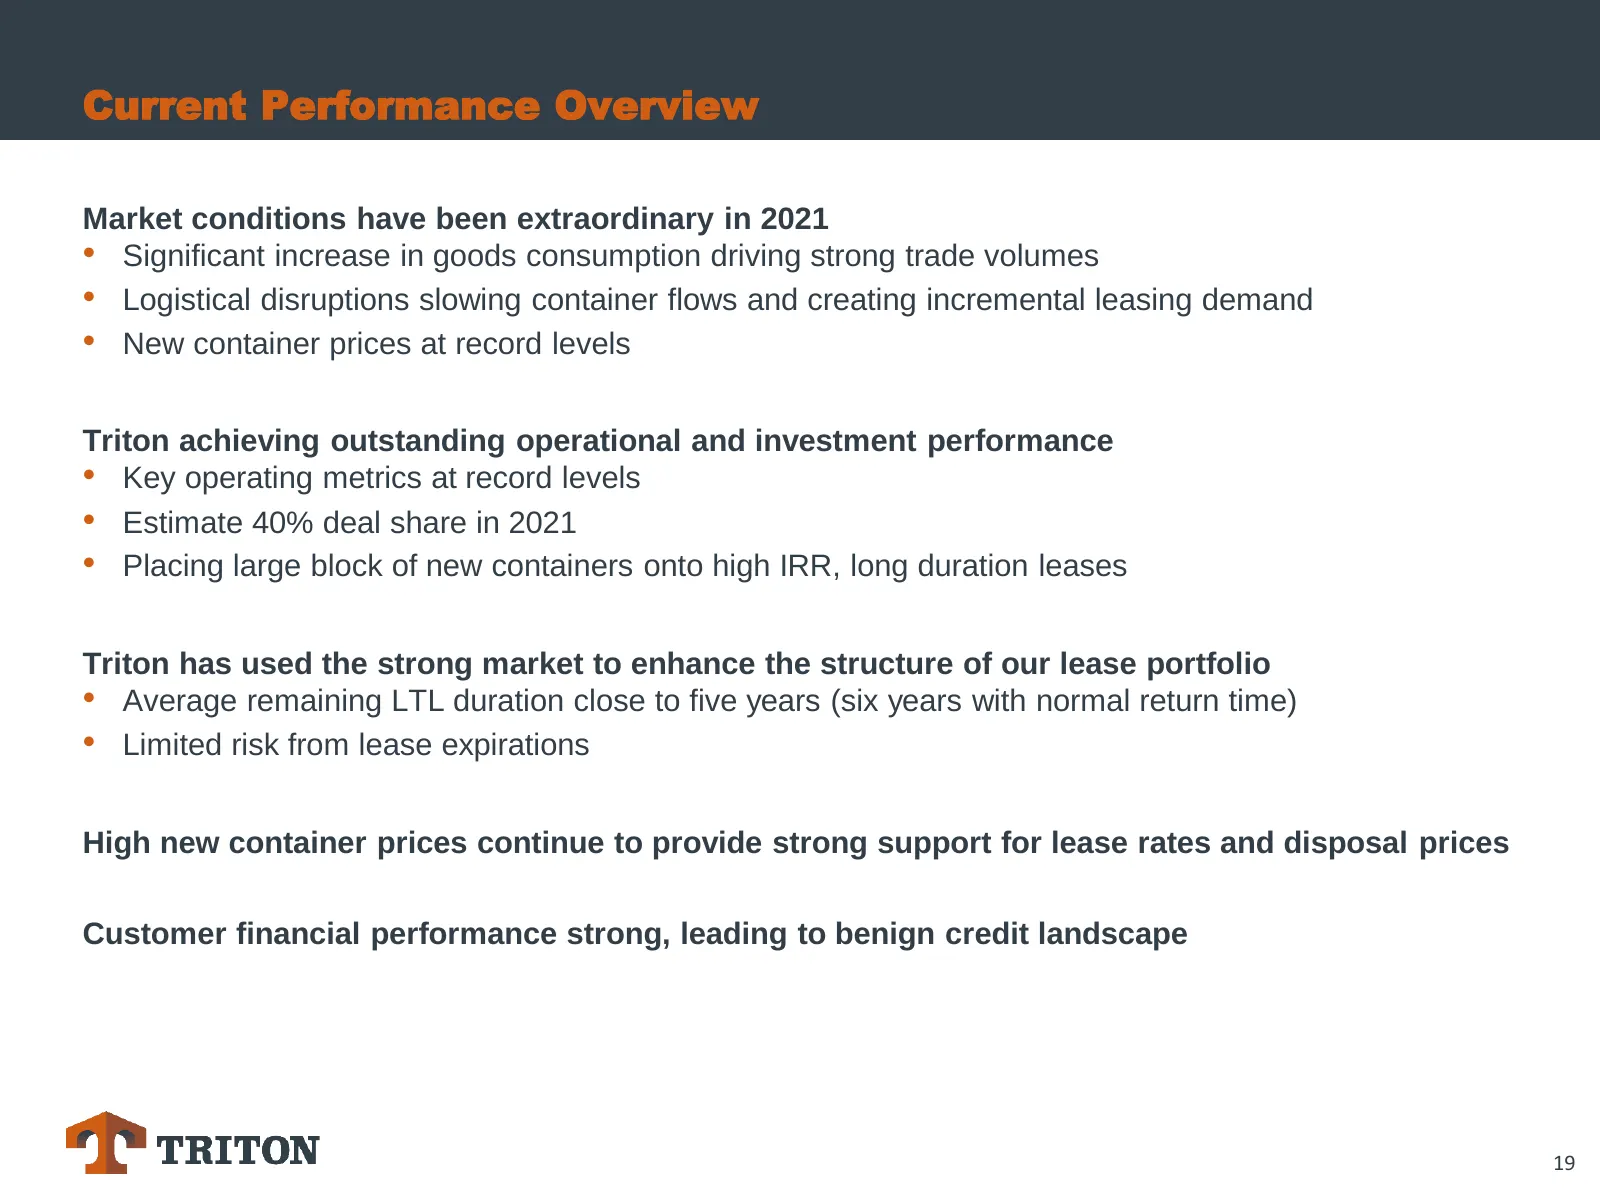
Current Performance Overview Market conditions have been extraordinary in 2021 • Significant increase in goods consumption driving strong trade volumes • Logistical disruptions slowing container flows and creating incremental leasing demand • New container prices at record levels Triton achieving ou
Slide 20: Strong Consumption Growth and Logistical Disruptions Driving Container Demand
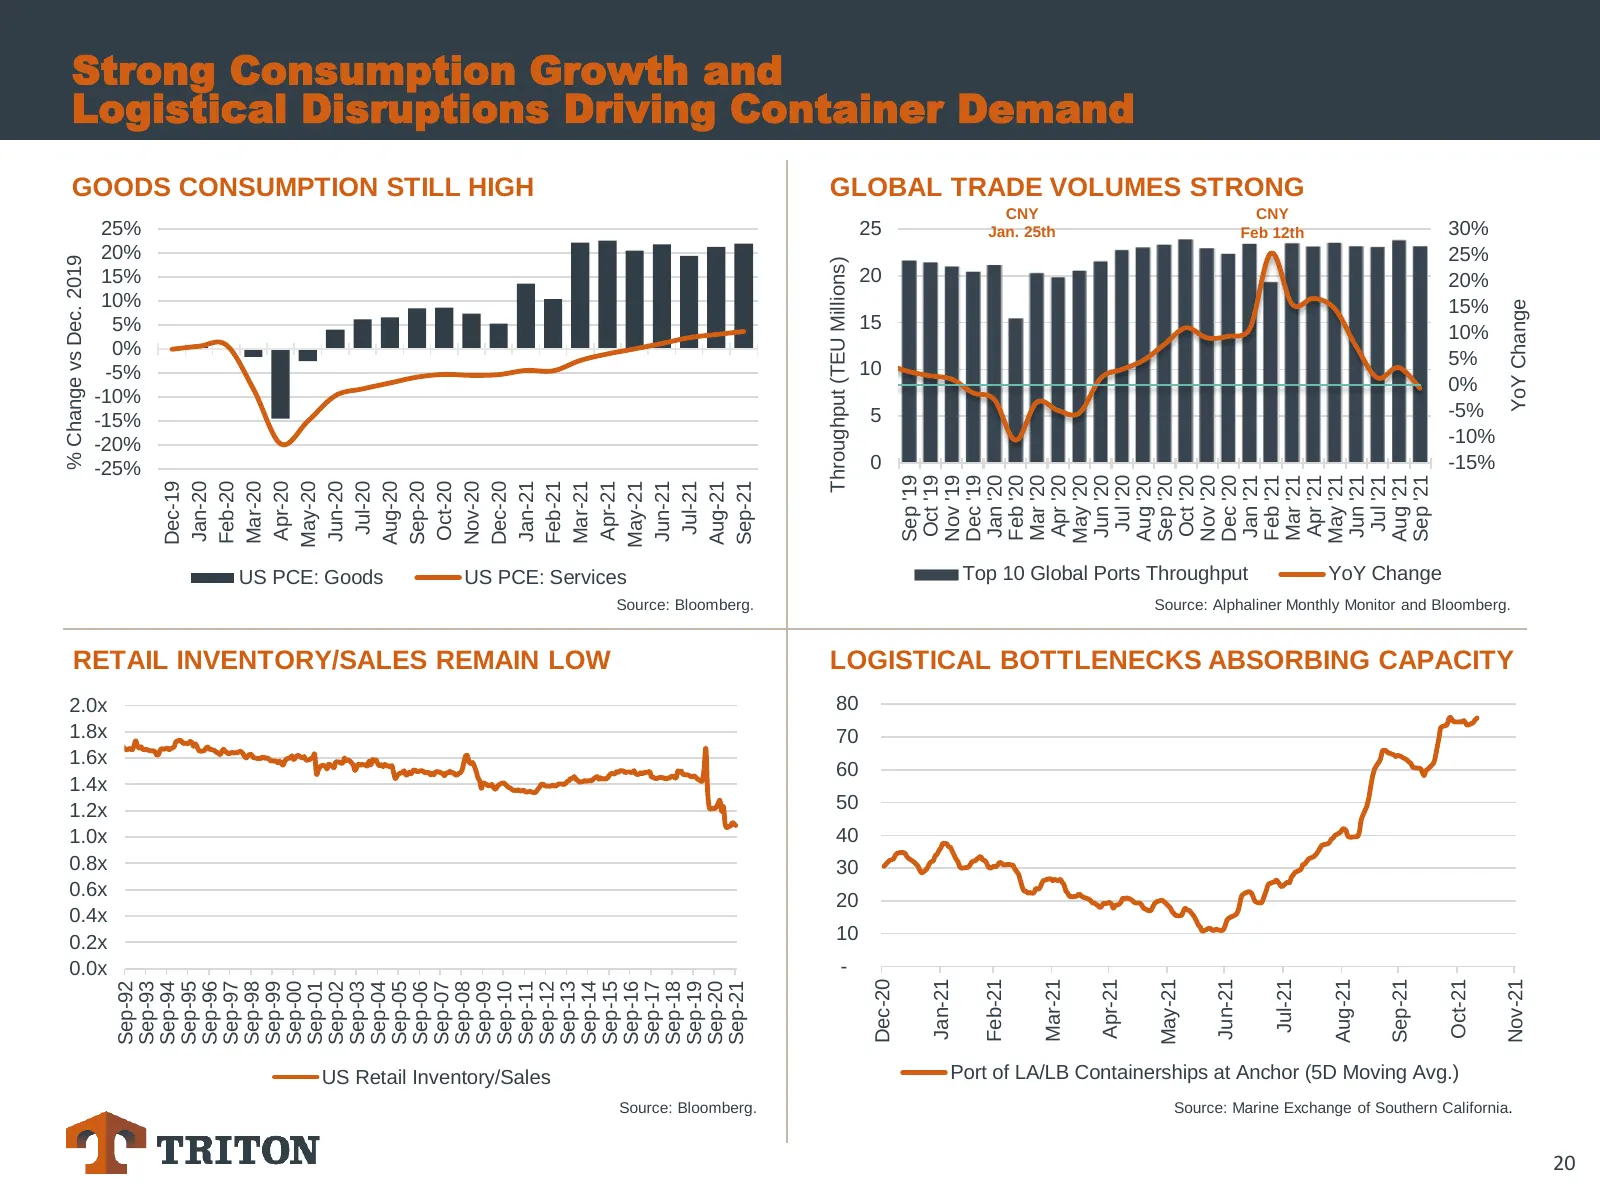
Strong Consumption Growth and Logistical Disruptions Driving Container Demand GOODS CONSUMPTION STILL HIGH GLOBAL TRADE VOLUMES STRONG CNY CNY 25% 25 Jan. 25th Feb 12th 30% 20% 25% % Change vs Dec. 2019 Throughput (TEU Millions) 15% 20 20% 10% 15% YoY Change 5% 15 10% 0% 5% -5% 10 0% -10% 5 -5% -15%
Slide 21: Triton's Key Operating Metrics Exceptional
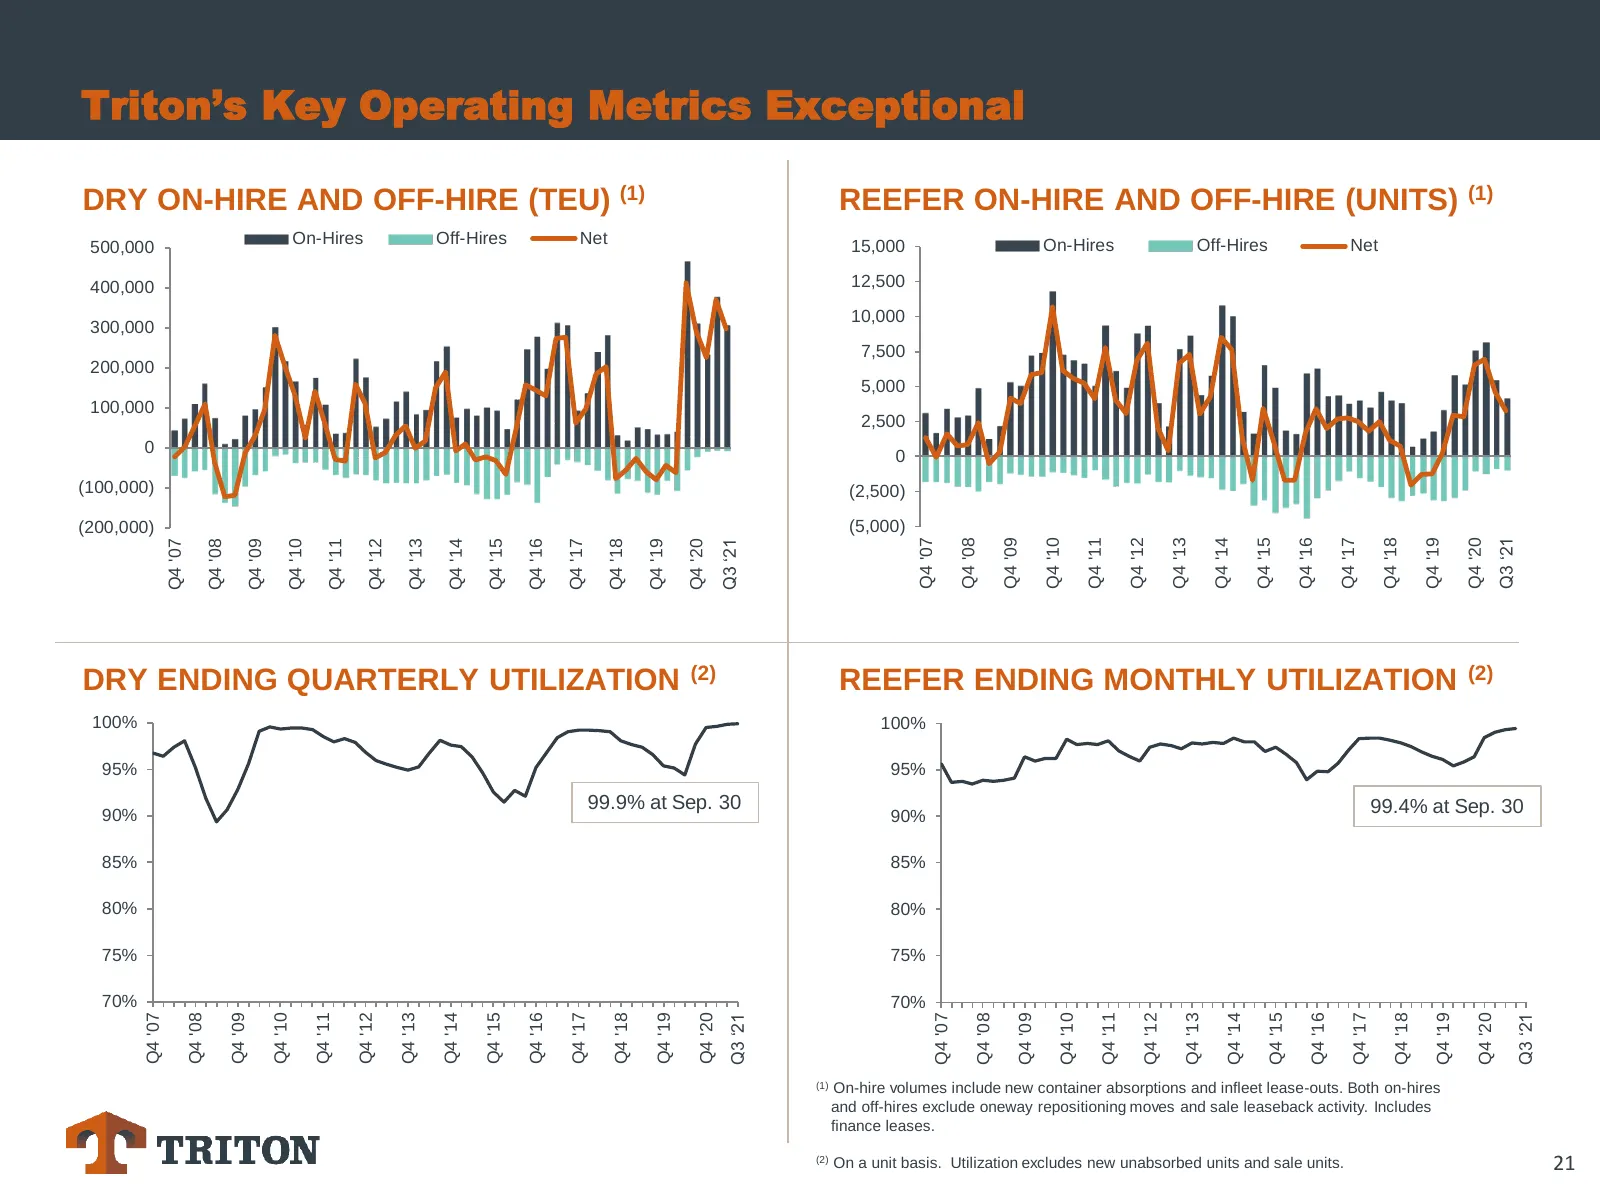
Triton’s Key Operating Metrics Exceptional DRY ON-HIRE AND OFF-HIRE (TEU) (1) REEFER ON-HIRE AND OFF-HIRE (UNITS) (1) On-Hires Off-Hires Net 15,000 On-Hires Off-Hires Net 500,000 400,000 12,500 10,000 300,000 7,500 200,000 5,000 100,000 2,500 0 0 (100,000) (2,500) (200,000) (5,000) Q4 '07 Q4 '08 Q4
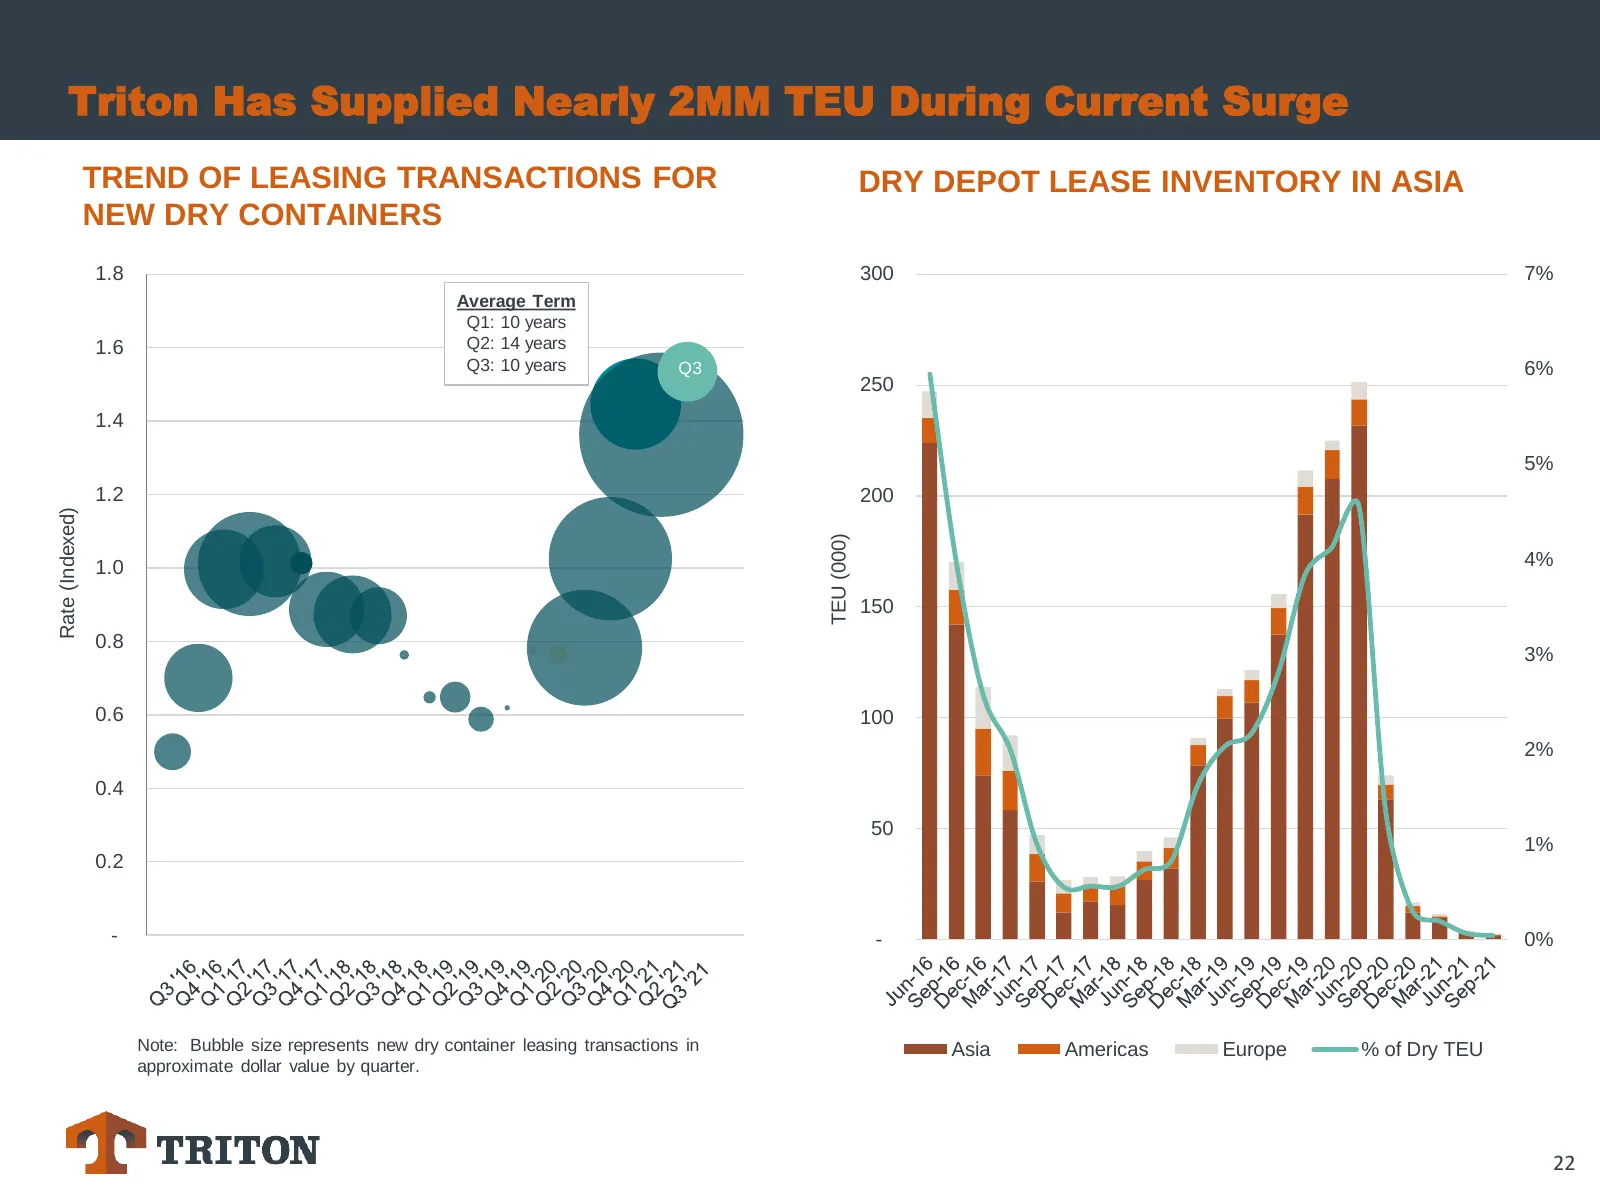
Slide 22: Triton Has Supplied Nearly 2MM TEU During Current Surge
Triton Has Supplied Nearly 2MM TEU During Current Surge TREND OF LEASING TRANSACTIONS FOR DRY DEPOT LEASE INVENTORY IN ASIA NEW DRY CONTAINERS 1.8 300 7% Average Term Q1: 10 years 1.6 Q2: 14 years Q3: 10 years Q3 6% 250 1.4 5% 1.2 200 Rate (Indexed) TEU (000) 1.0 4% 150 0.8 3% 0.6 100 2% 0.4 50 1% 0
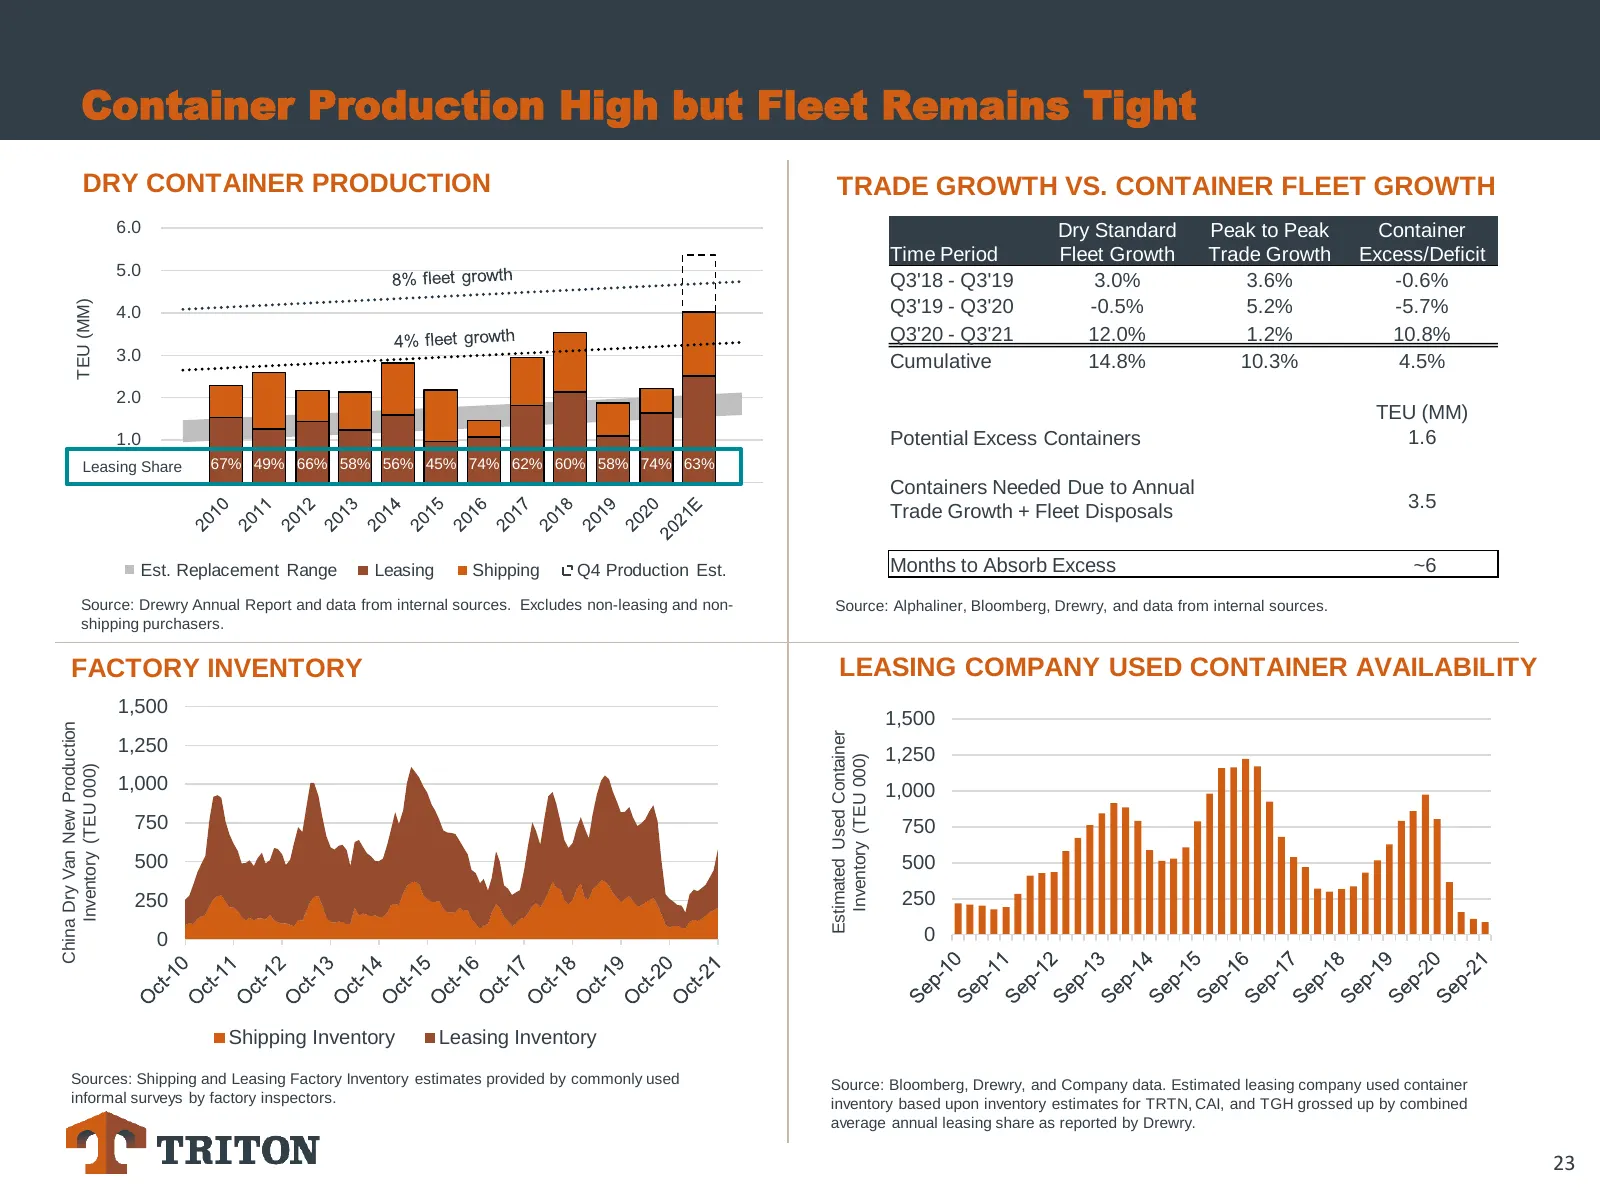
Slide 23: Container Production High but Fleet Remains Tight
Container Production High but Fleet Remains Tight DRY CONTAINER PRODUCTION TRADE GROWTH VS. CONTAINER FLEET GROWTH 6.0 Dry Standard Peak to Peak Container Time Period Fleet Growth Trade Growth Excess/Deficit 5.0 Q3'18 - Q3'19 3.0% 3.6% -0.6% TEU (MM) 4.0 Q3'19 - Q3'20 -0.5% 5.2% -5.7% Q3'20 - Q3'21
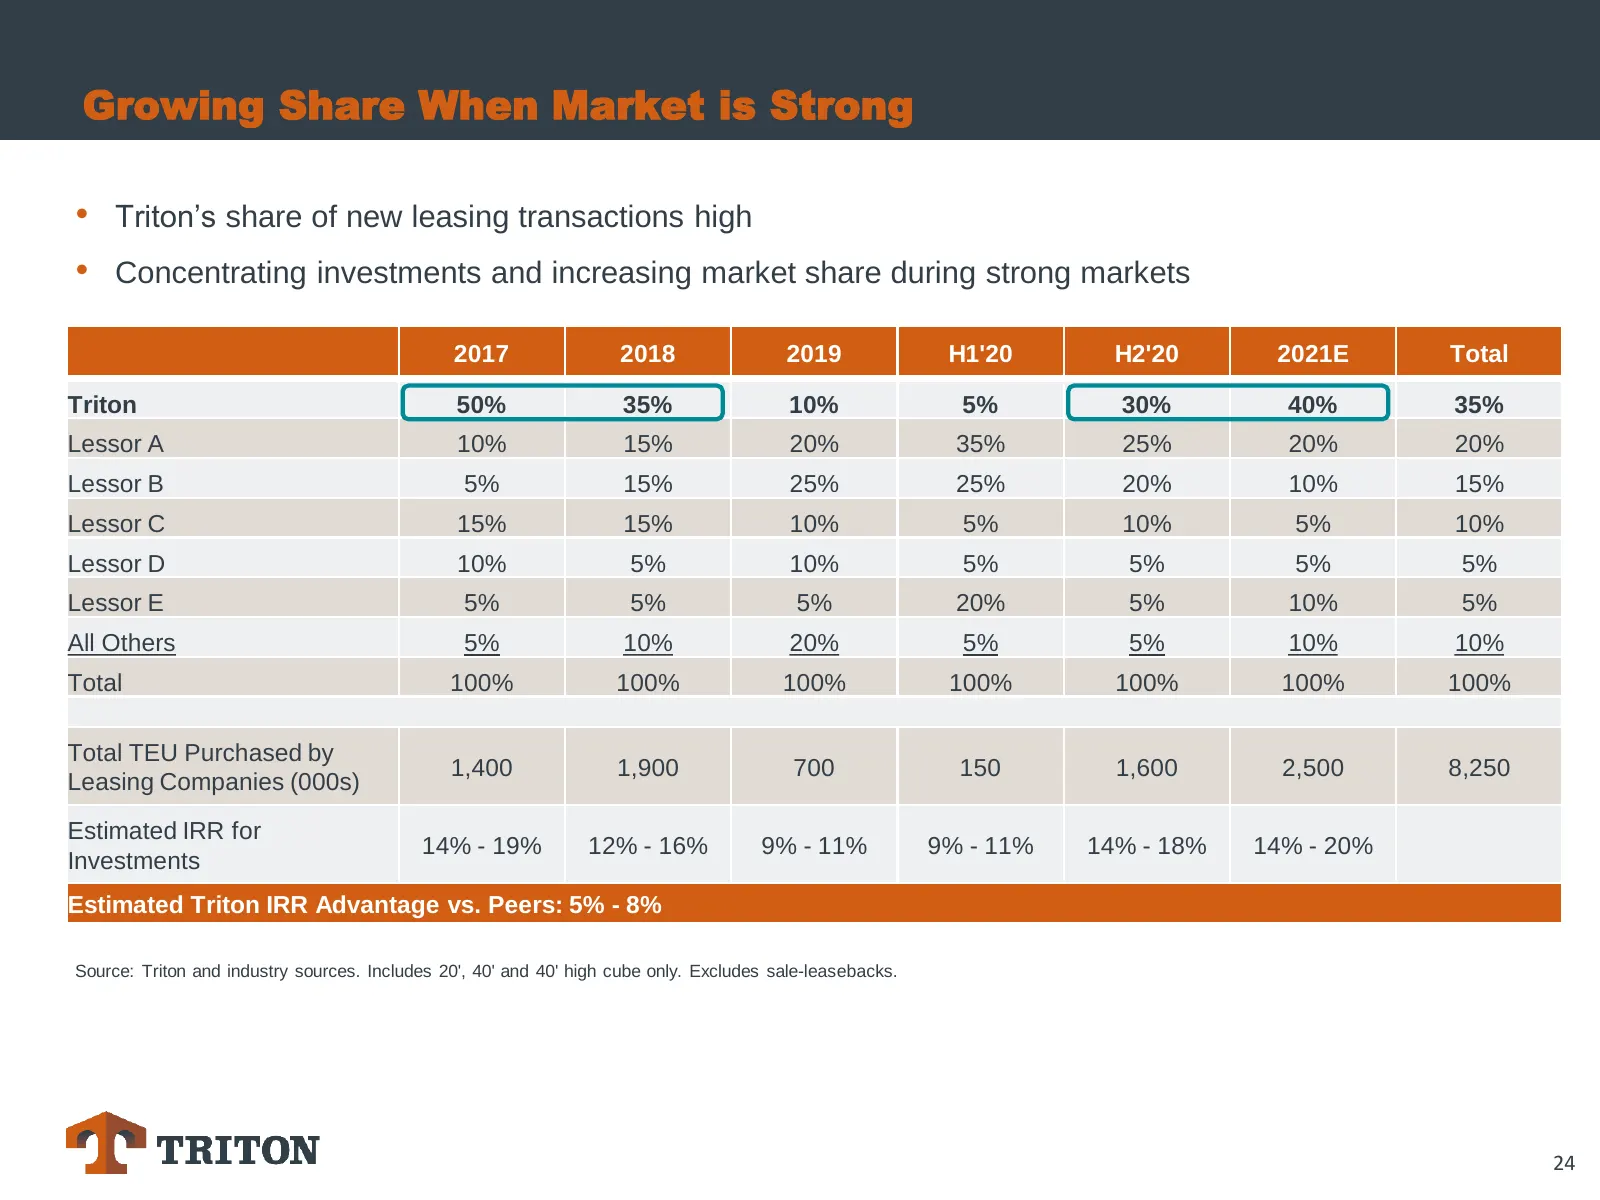
Slide 24: Growing Share When Market is Strong
Growing Share When Market is Strong • Triton’s share of new leasing transactions high • Concentrating investments and increasing market share during strong markets 2017 2018 2019 H1'20 H2'20 2021E Total Triton 50% 35% 10% 5% 30% 40% 35% Lessor A 10% 15% 20% 35% 25% 20% 20% Lessor B 5% 15% 25% 25% 20
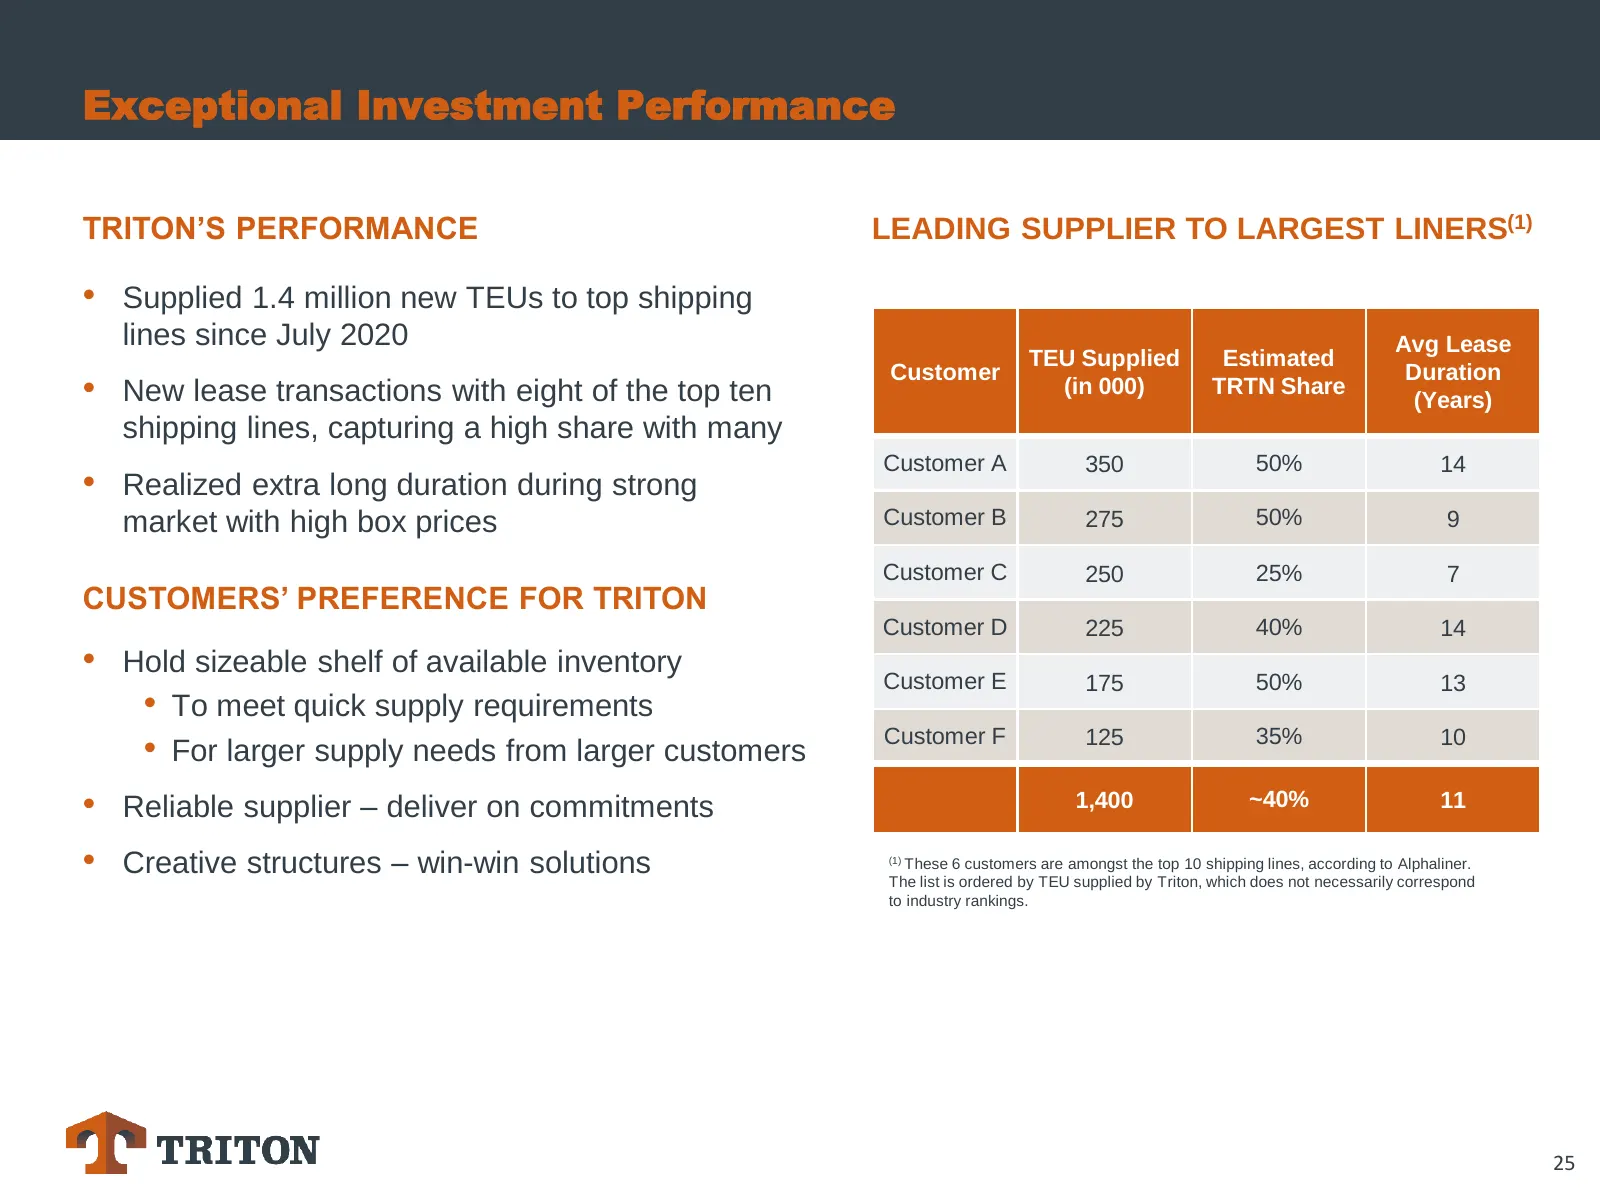
Slide 25: Exceptional Investment Performance
Exceptional Investment Performance TRITON’S PERFORMANCE LEADING SUPPLIER TO LARGEST LINERS(1) • Supplied 1.4 million new TEUs to top shipping lines since July 2020 Avg Lease TEU Supplied Estimated Customer Duration • New lease transactions with eight of the top ten (in 000) TRTN Share (Years) shippi
Slide 26: Increasing Lease Durations
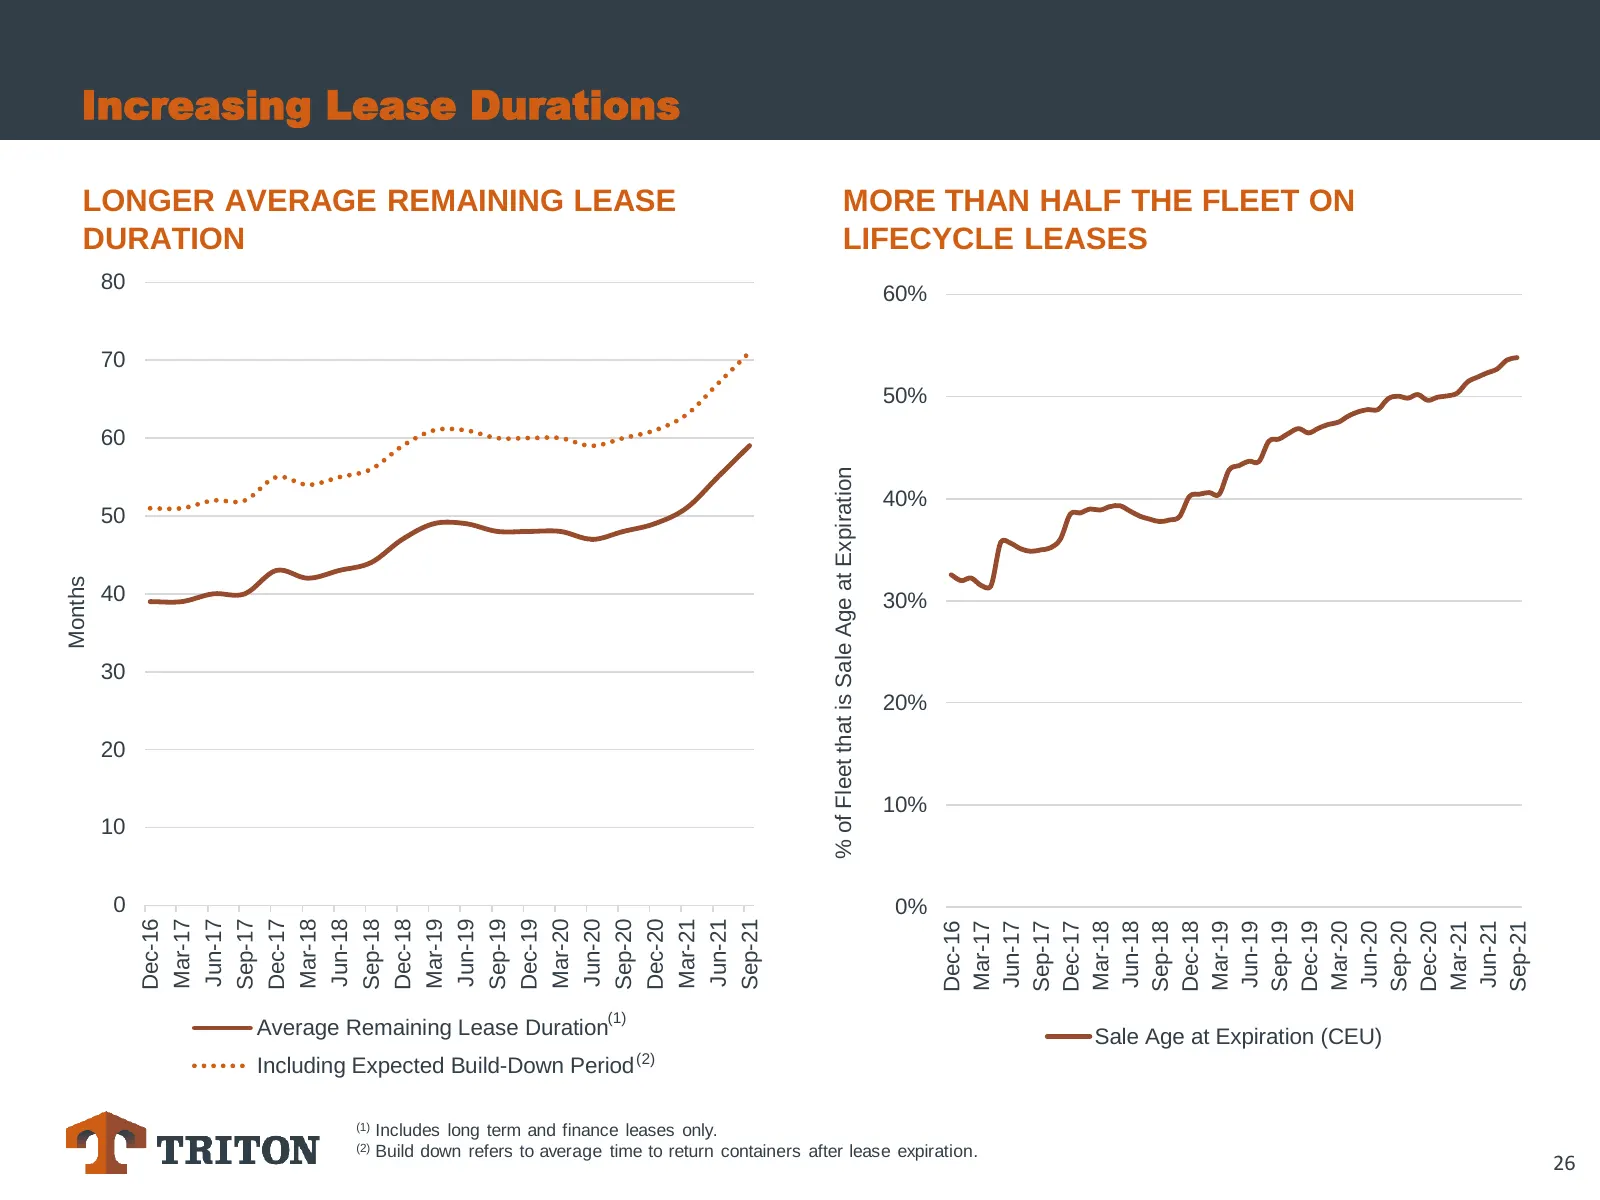
Increasing Lease Durations LONGER AVERAGE REMAINING LEASE MORE THAN HALF THE FLEET ON DURATION LIFECYCLE LEASES 80 60% 70 50% 60 % of Fleet that is Sale Age at Expiration 40% 50 Months 40 30% 30 20% 20 10% 10 0 0% Mar-20 Mar-17 Mar-18 Mar-19 Mar-21 Dec-20 Dec-16 Dec-17 Dec-18 Dec-19 Jun-17 Sep-17 Ju
Slide 27: Limited Risk from Lease Expirations
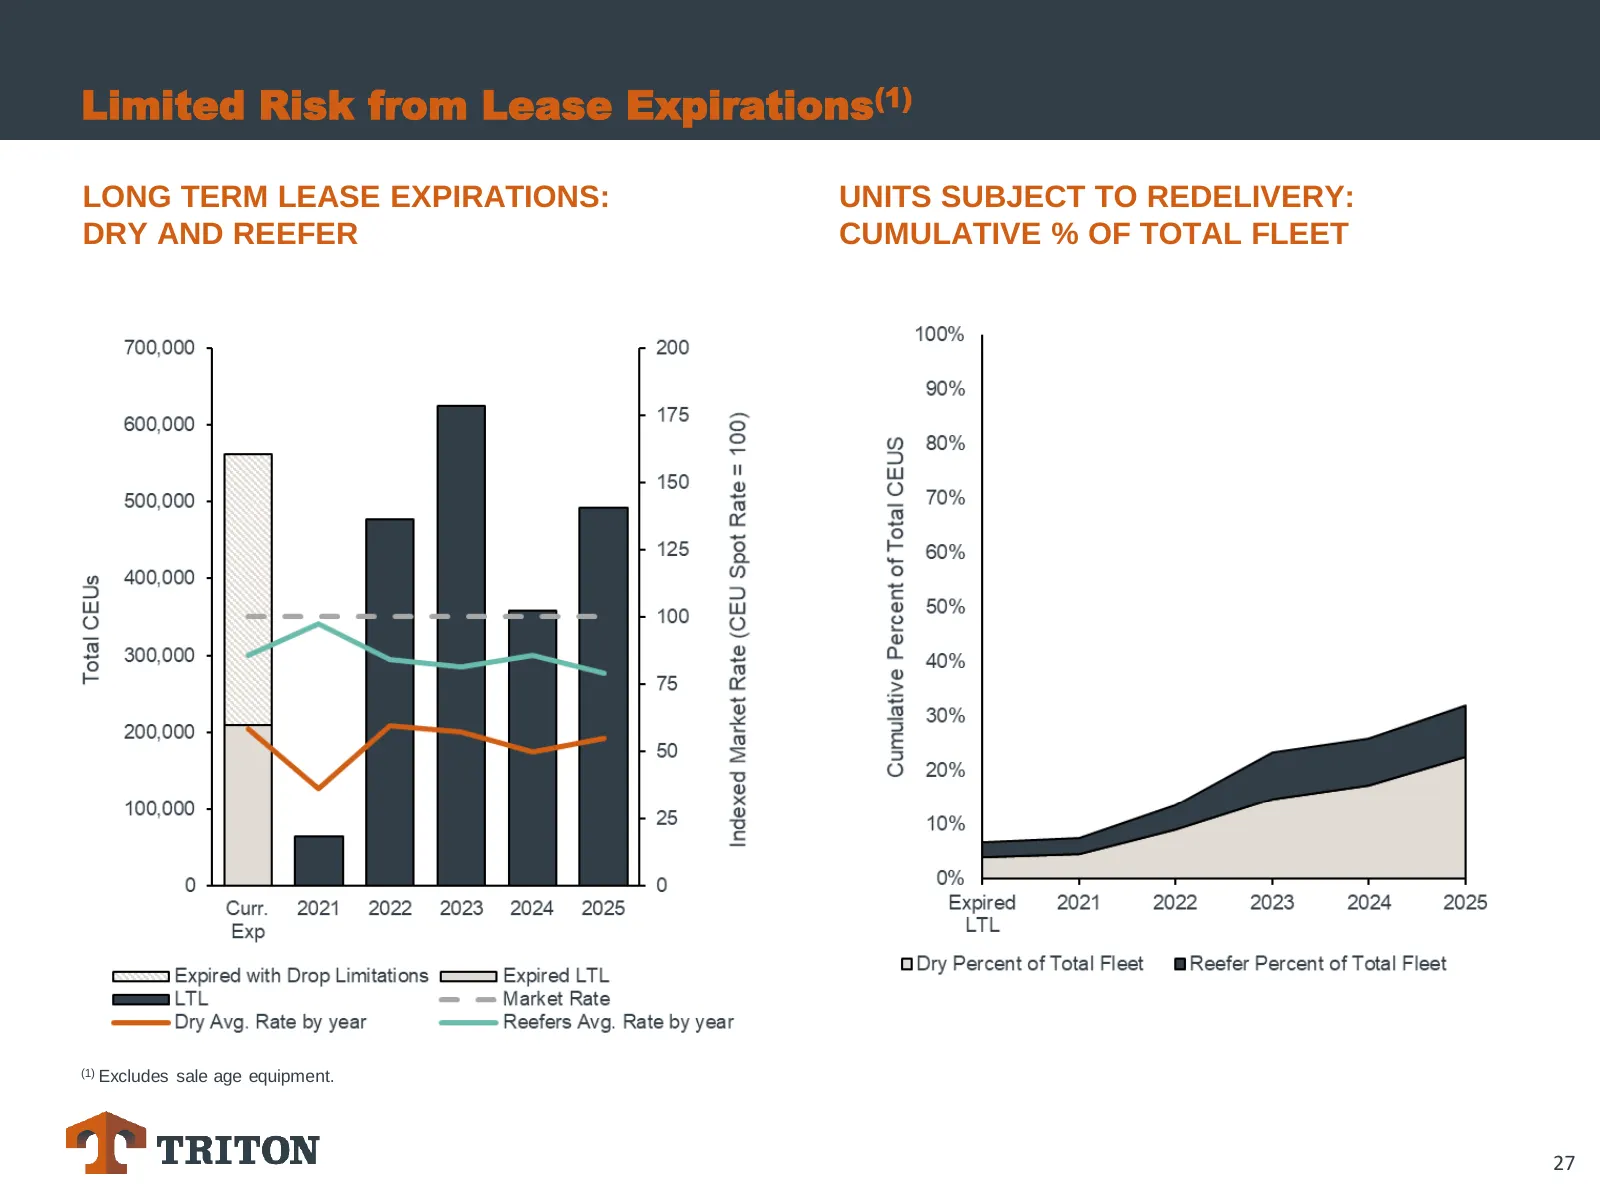
Limited Risk from Lease Expirations(1) LONG TERM LEASE EXPIRATIONS: UNITS SUBJECT TO REDELIVERY: DRY AND REEFER CUMULATIVE % OF TOTAL FLEET (1) Excludes sale age equipment. 27
Slide 28: Exceptional Shipping Line Profitability Reinforcing Strong Customer Credit Performance
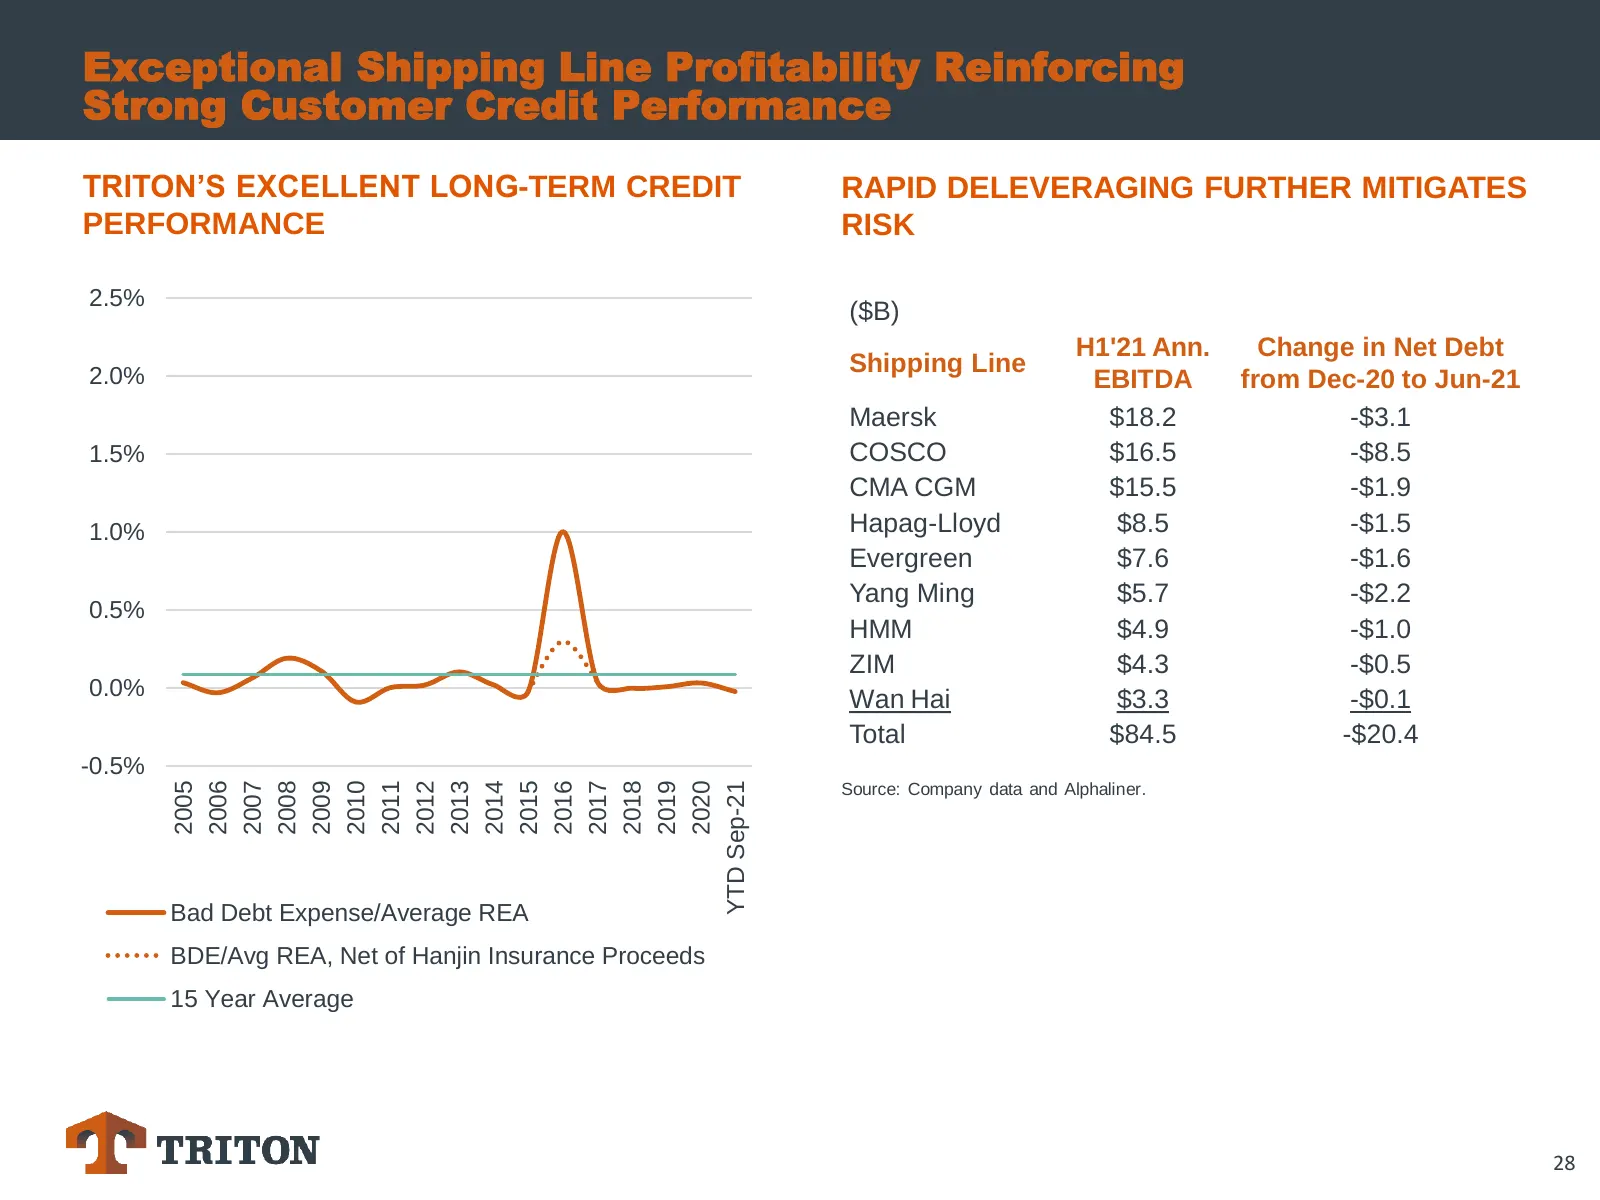
Exceptional Shipping Line Profitability Reinforcing Strong Customer Credit Performance TRITON’S EXCELLENT LONG-TERM CREDIT RAPID DELEVERAGING FURTHER MITIGATES PERFORMANCE RISK 2.5% ($B) H1'21 Ann. Change in Net Debt 2.0% Shipping Line EBITDA from Dec-20 to Jun-21 Maersk $18.2 -$3.1 1.5% COSCO $16.5
Slide 29: Market Outlook
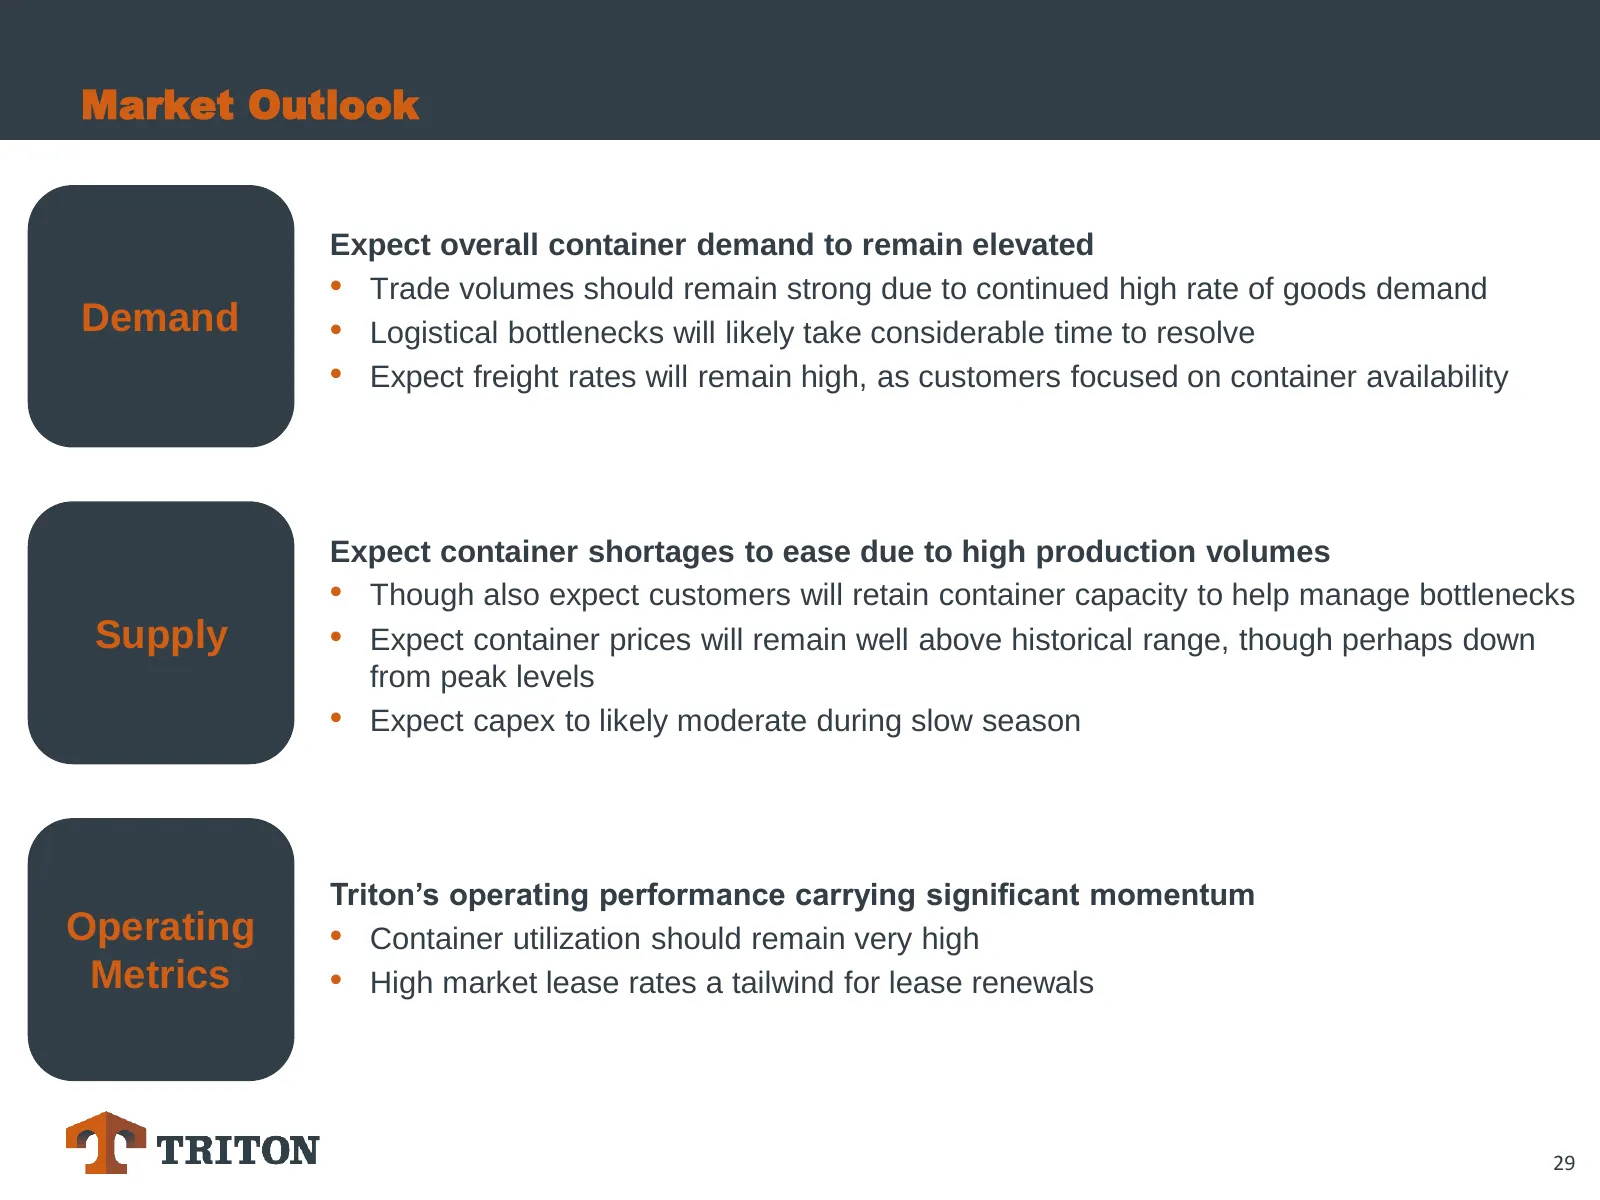
Market Outlook Expect overall container demand to remain elevated • Trade volumes should remain strong due to continued high rate of goods demand Demand • Logistical bottlenecks will likely take considerable time to resolve • Expect freight rates will remain high, as customers focused on container a
Slide 30: Current Operating Performance: Sales
Current Operating Performance SALES 30
Slide 31: Triton Container Sales
Triton Container Sales Triton’s the largest and most capable global seller of used containers • Team includes 45 sales and service specialists based in 20 offices in 16 countries • Supported by Triton’s best-in-class operating infrastructure and bespoke IT systems • Sales in 299 locations across 75
Slide 32: Secondary Market for Containers is Deep and Vibrant
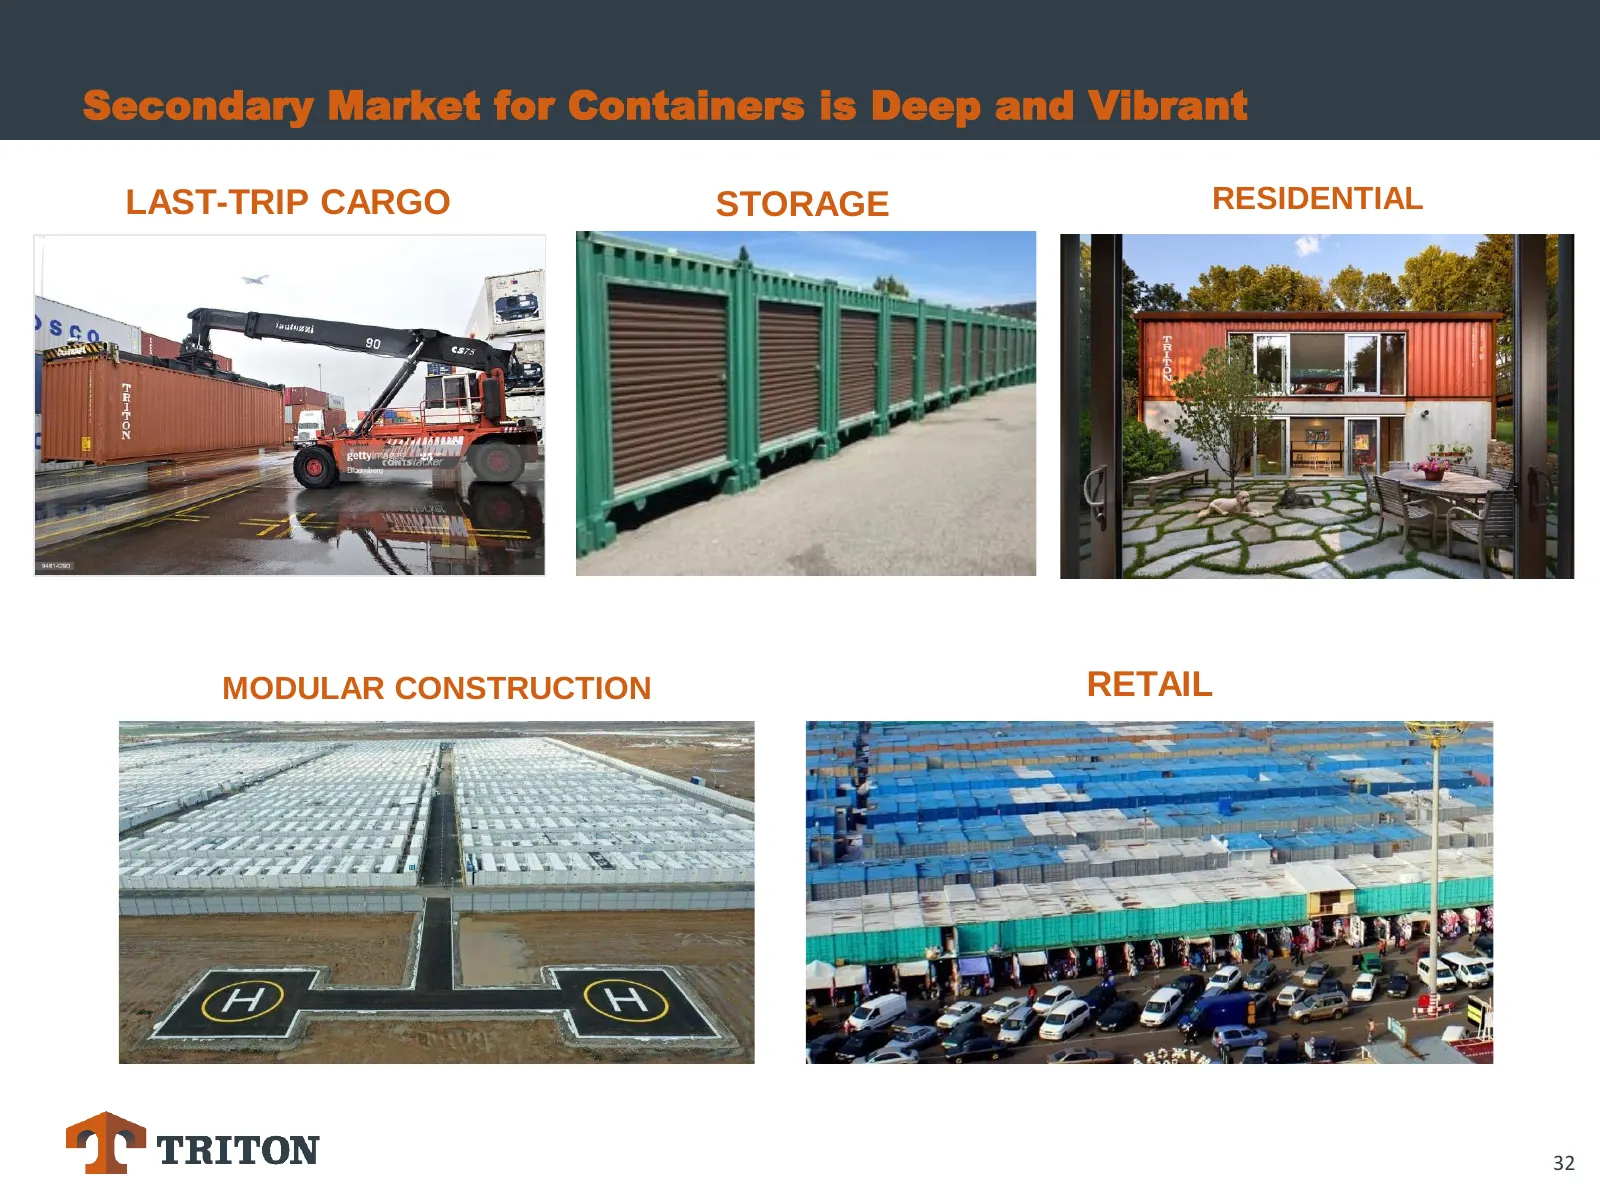
Secondary Market for Containers is Deep and Vibrant LAST-TRIP CARGO STORAGE RESIDENTIAL MODULAR CONSTRUCTION RETAIL 32
Slide 33: Containers are Very Versatile
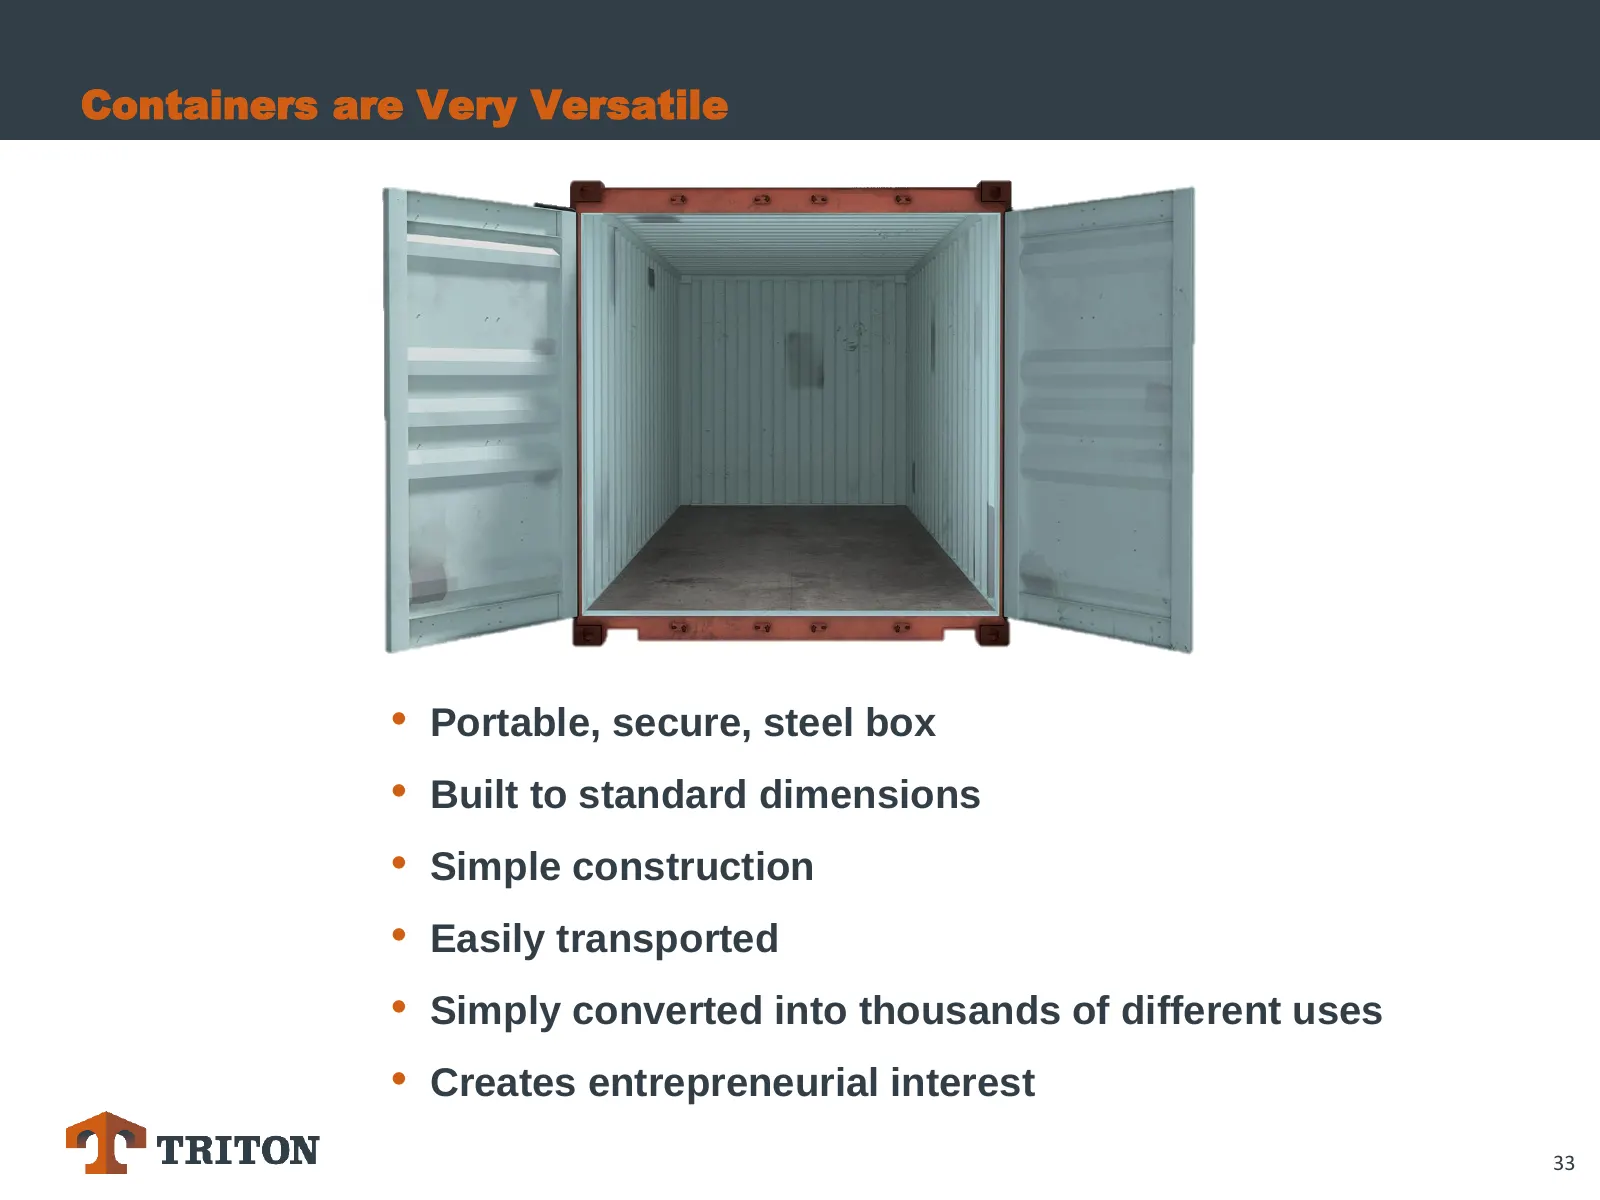
Containers are Very Versatile • Portable, secure, steel box • Built to standard dimensions • Simple construction • Easily transported • Simply converted into thousands of different uses • Creates entrepreneurial interest 33
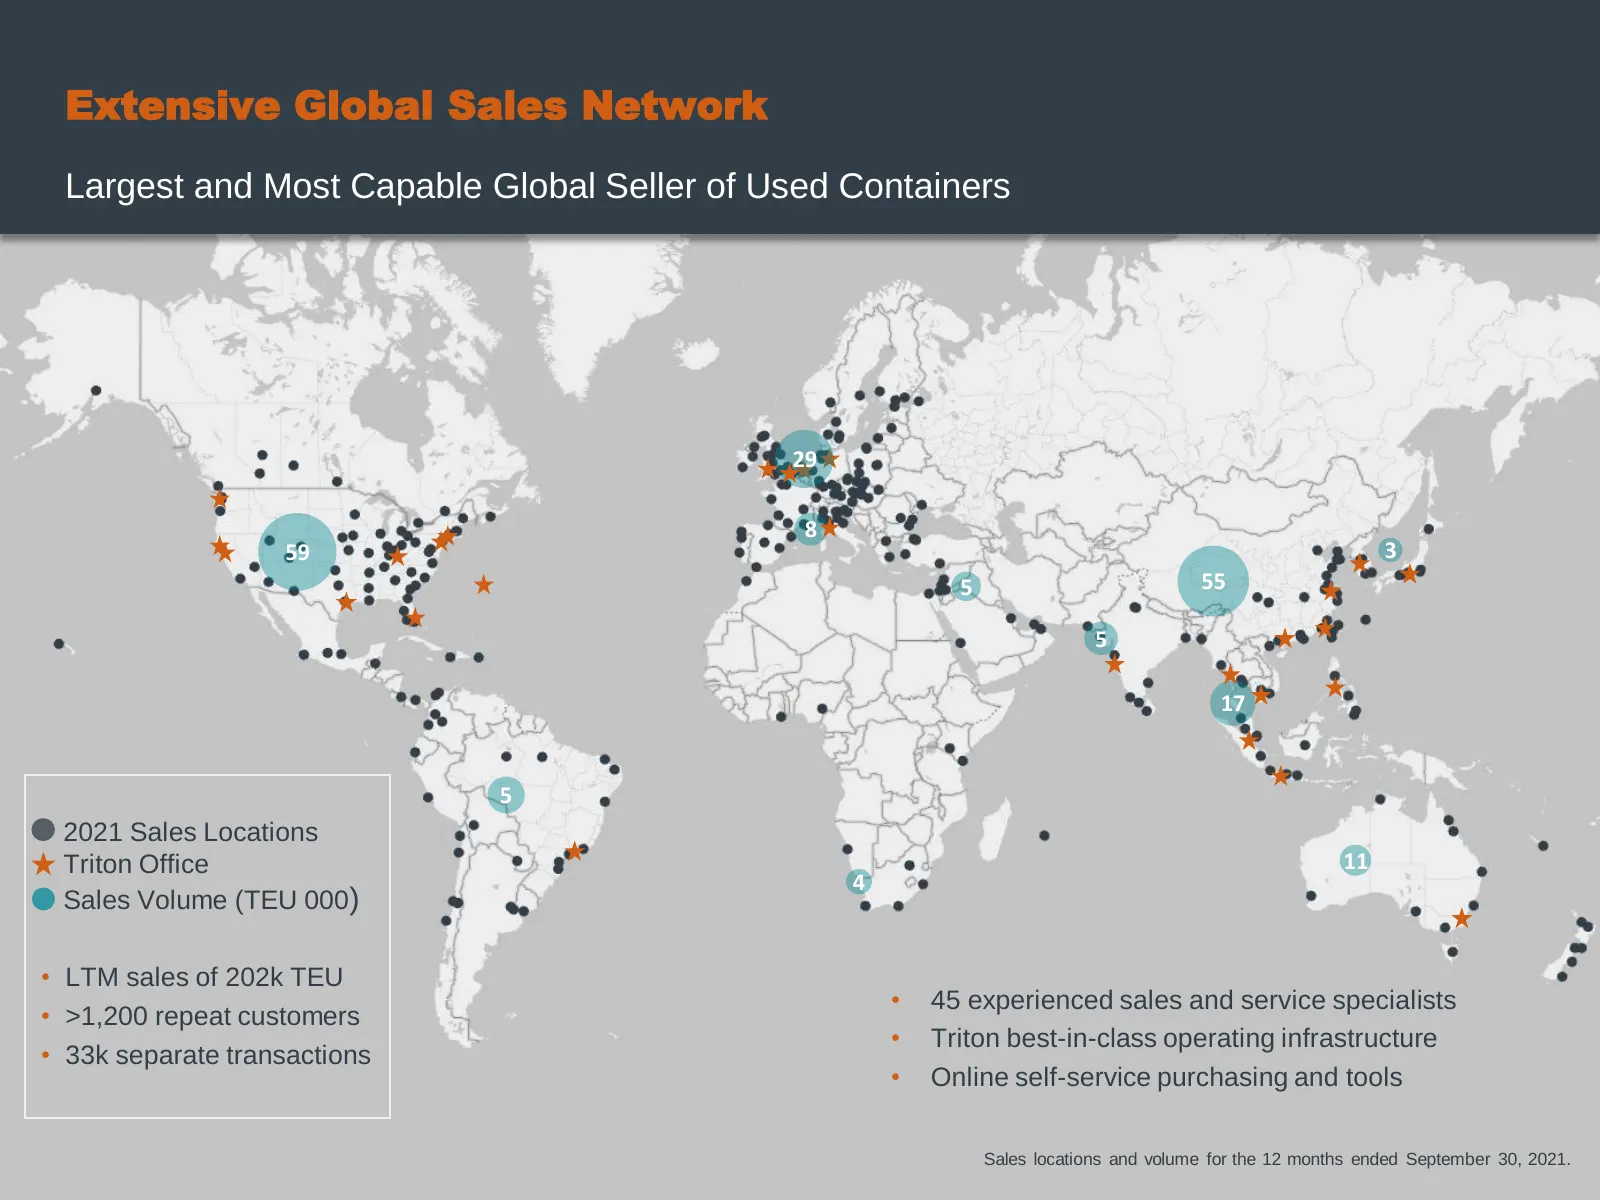
Slide 34: Extensive Global Sales Network
Extensive Global Sales Network Largest and Most Capable Global Seller of Used Containers 29 8 59 3 5 55 5 17 5 2021 Sales Locations Triton Office 11 4 Sales Volume (TEU 000) • LTM sales of 202k TEU • 45 experienced sales and service specialists • >1,200 repeat customers • Triton best-in-class operat
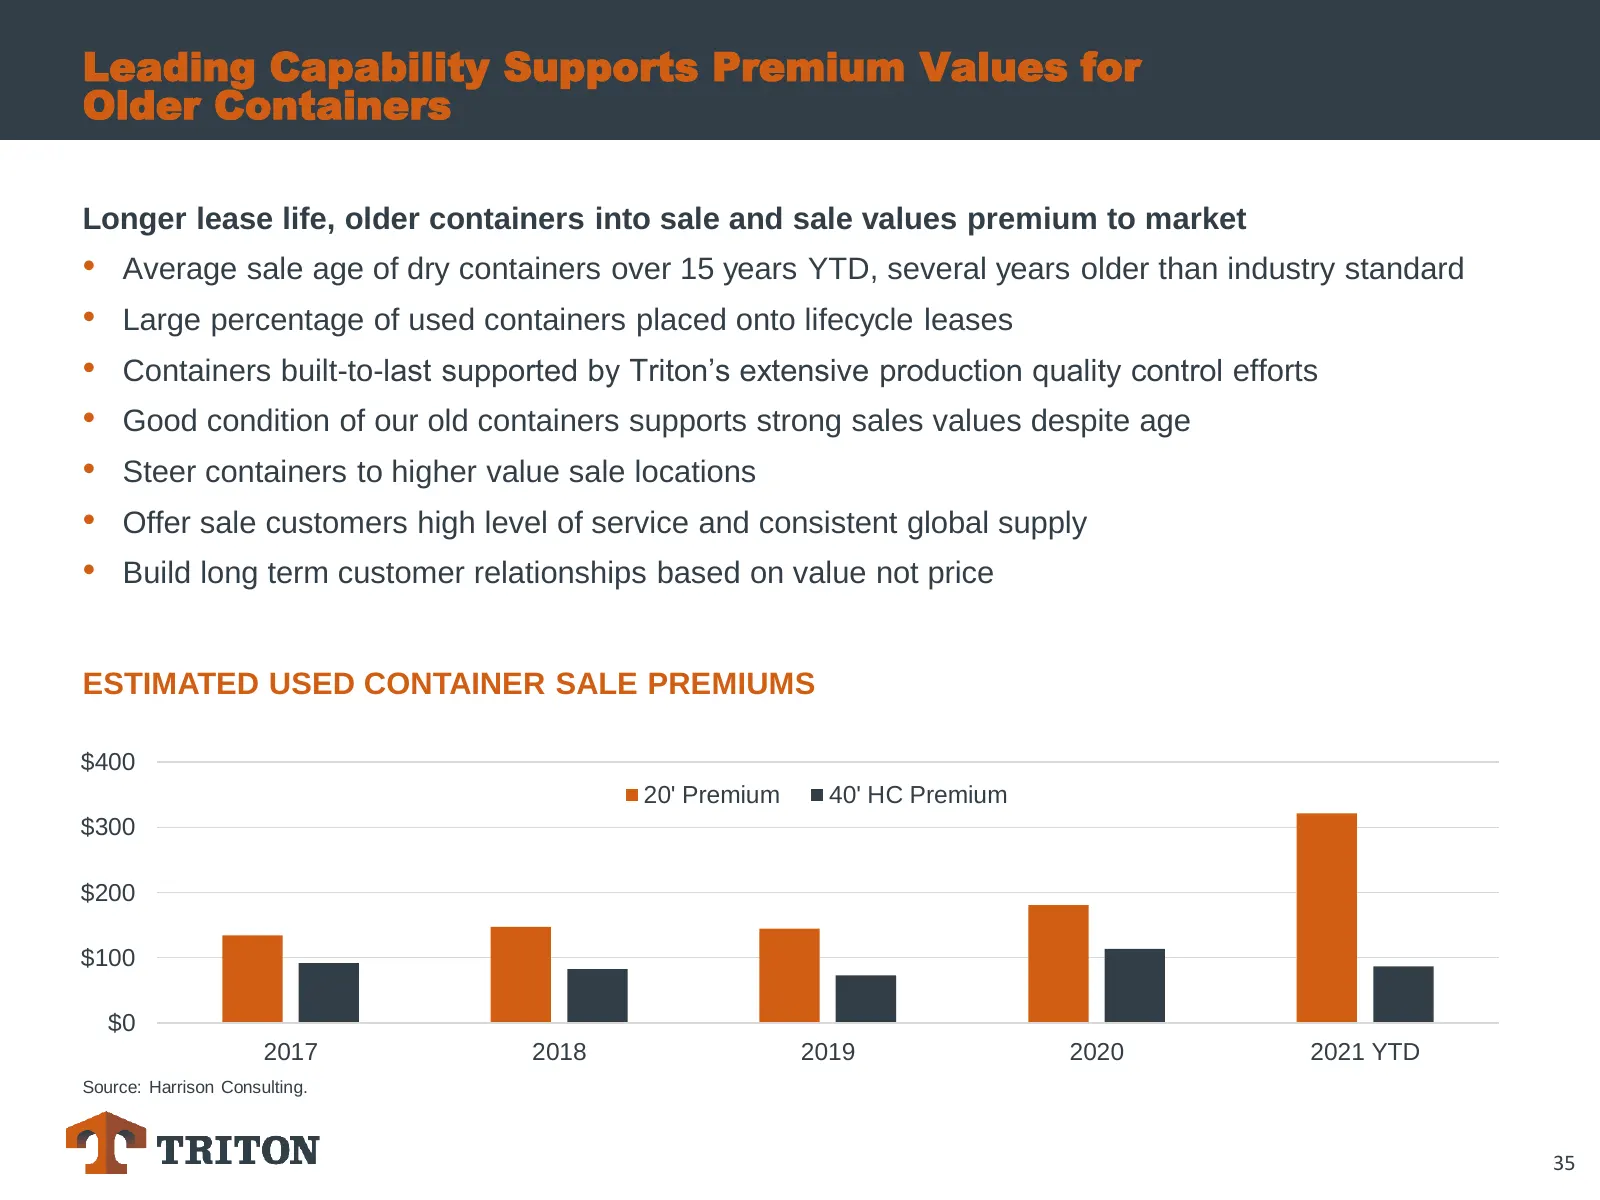
Slide 35: Leading Capability Supports Premium Values for Older Containers
Leading Capability Supports Premium Values for Older Containers Longer lease life, older containers into sale and sale values premium to market • Average sale age of dry containers over 15 years YTD, several years older than industry standard • Large percentage of used containers placed onto lifecyc
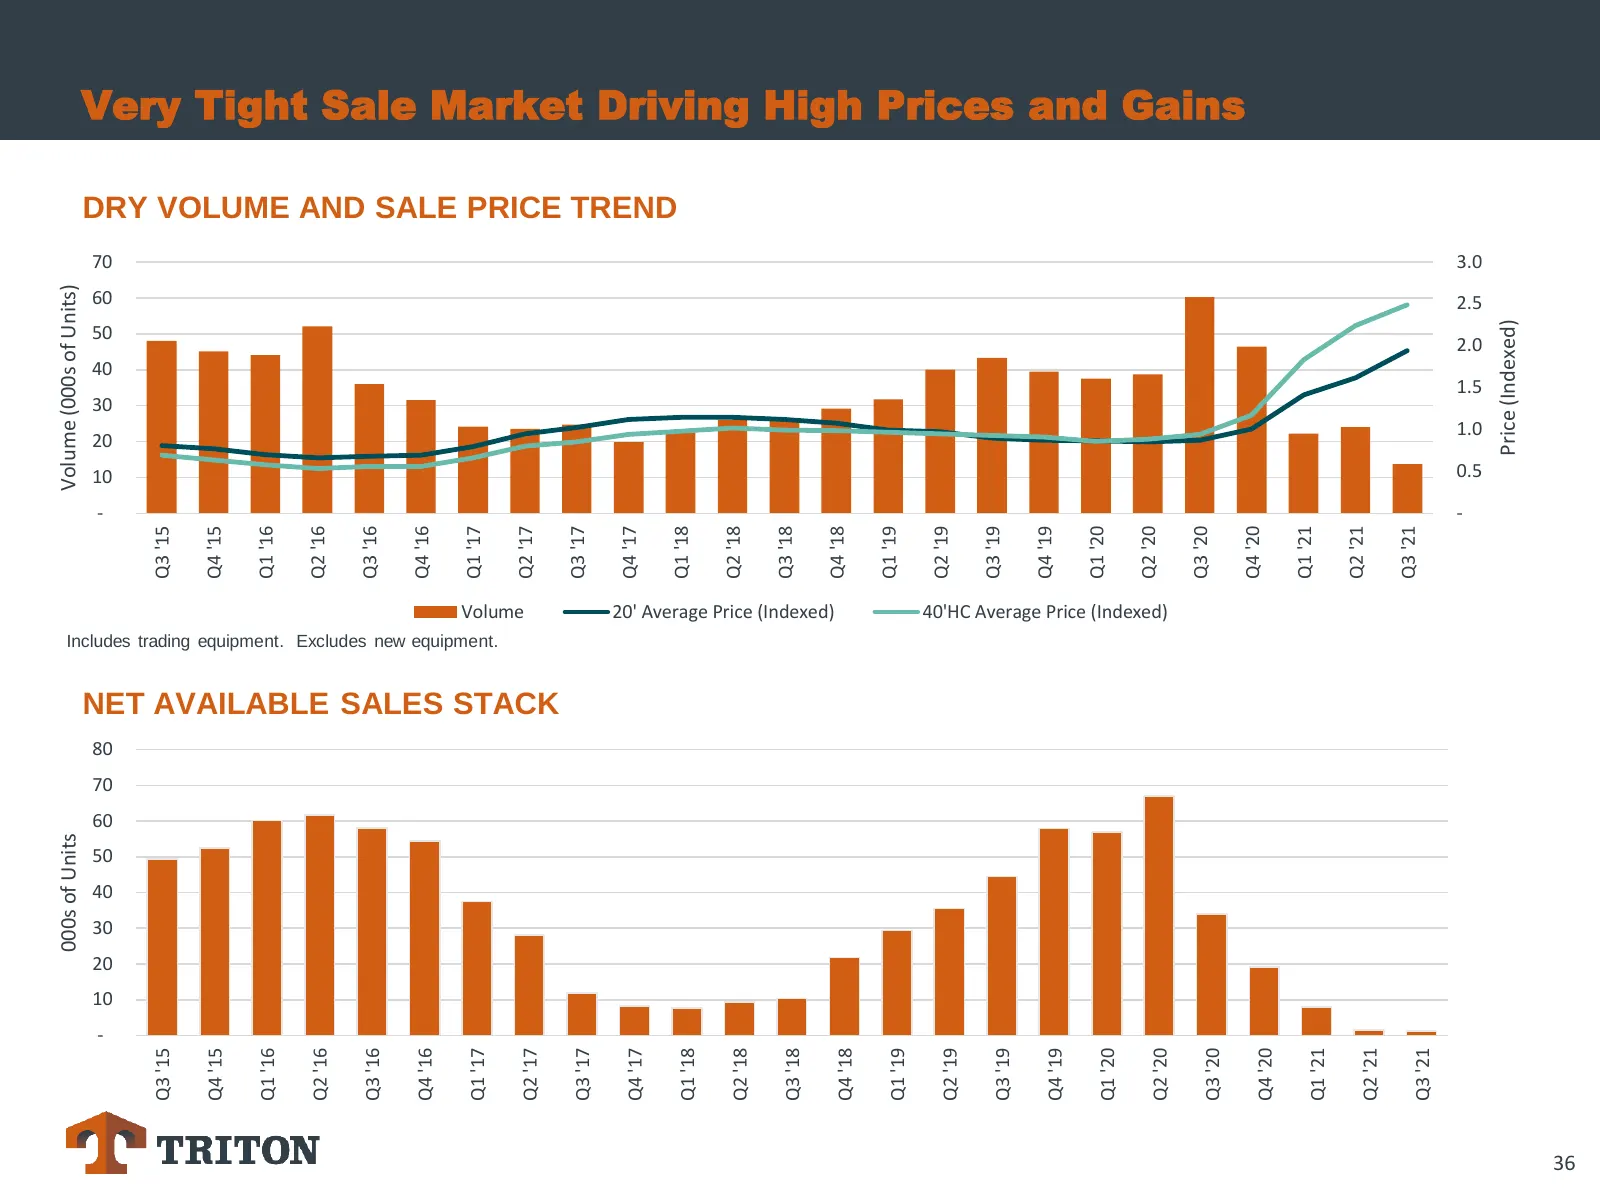
Slide 36: Very Tight Sale Market Driving High Prices and Gains
000s of Units Volume (000s of Units) - - 10 20 30 40 60 70 50 10 20 30 50 60 70 80 40 Q3 '15 Q3 '15 Q4 '15 Q4 '15 Q1 '16 Q1 '16 Q2 '16 Q2 '16 Q3 '16 Q3 '16 Q4 '16 Q4 '16 Q1 '17 Q1 '17 Includes trading equipment. Excludes new equipment. Volume Q2 '17 Q2 '17 NET AVAILABLE SALES STACK Q3 '17 Q3 '17 Q4
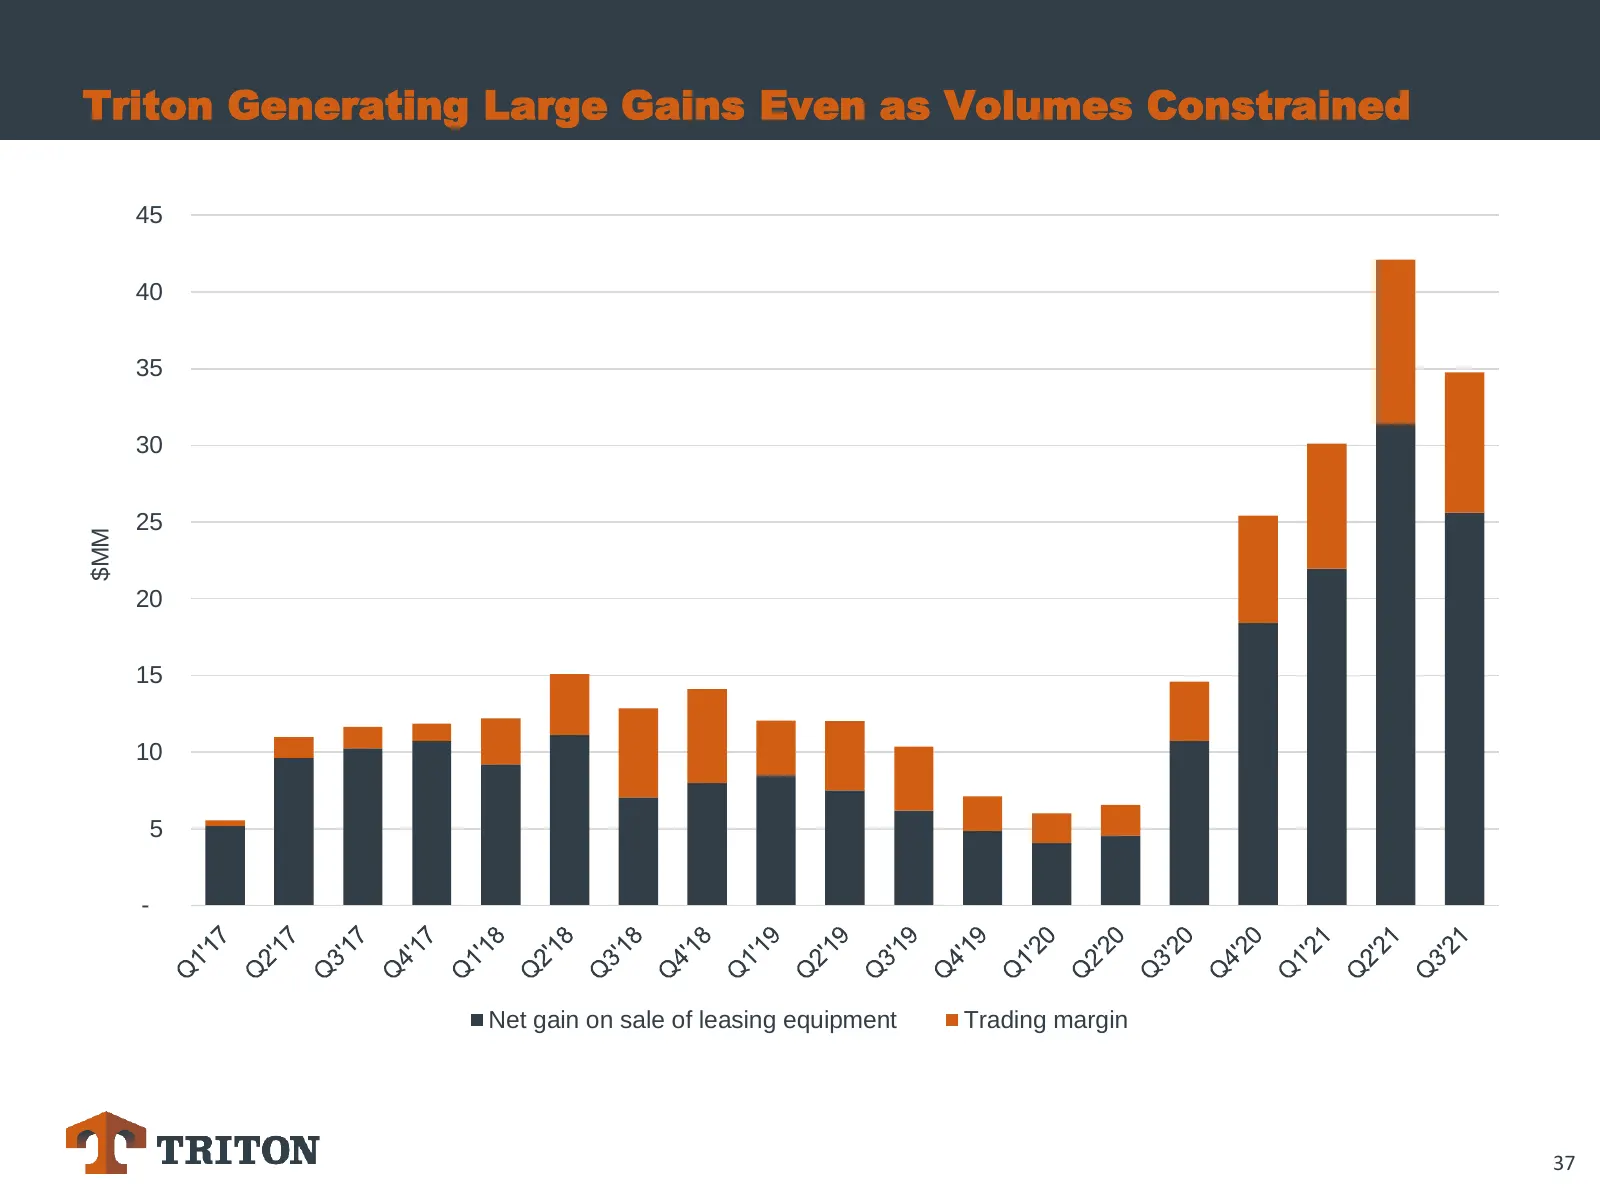
Slide 37: Triton Generating Large Gains Even as Volumes Constrained
Triton Generating Large Gains Even as Volumes Constrained 45 40 35 30 25 $MM 20 15 10 5 - Net gain on sale of leasing equipment Trading margin 37
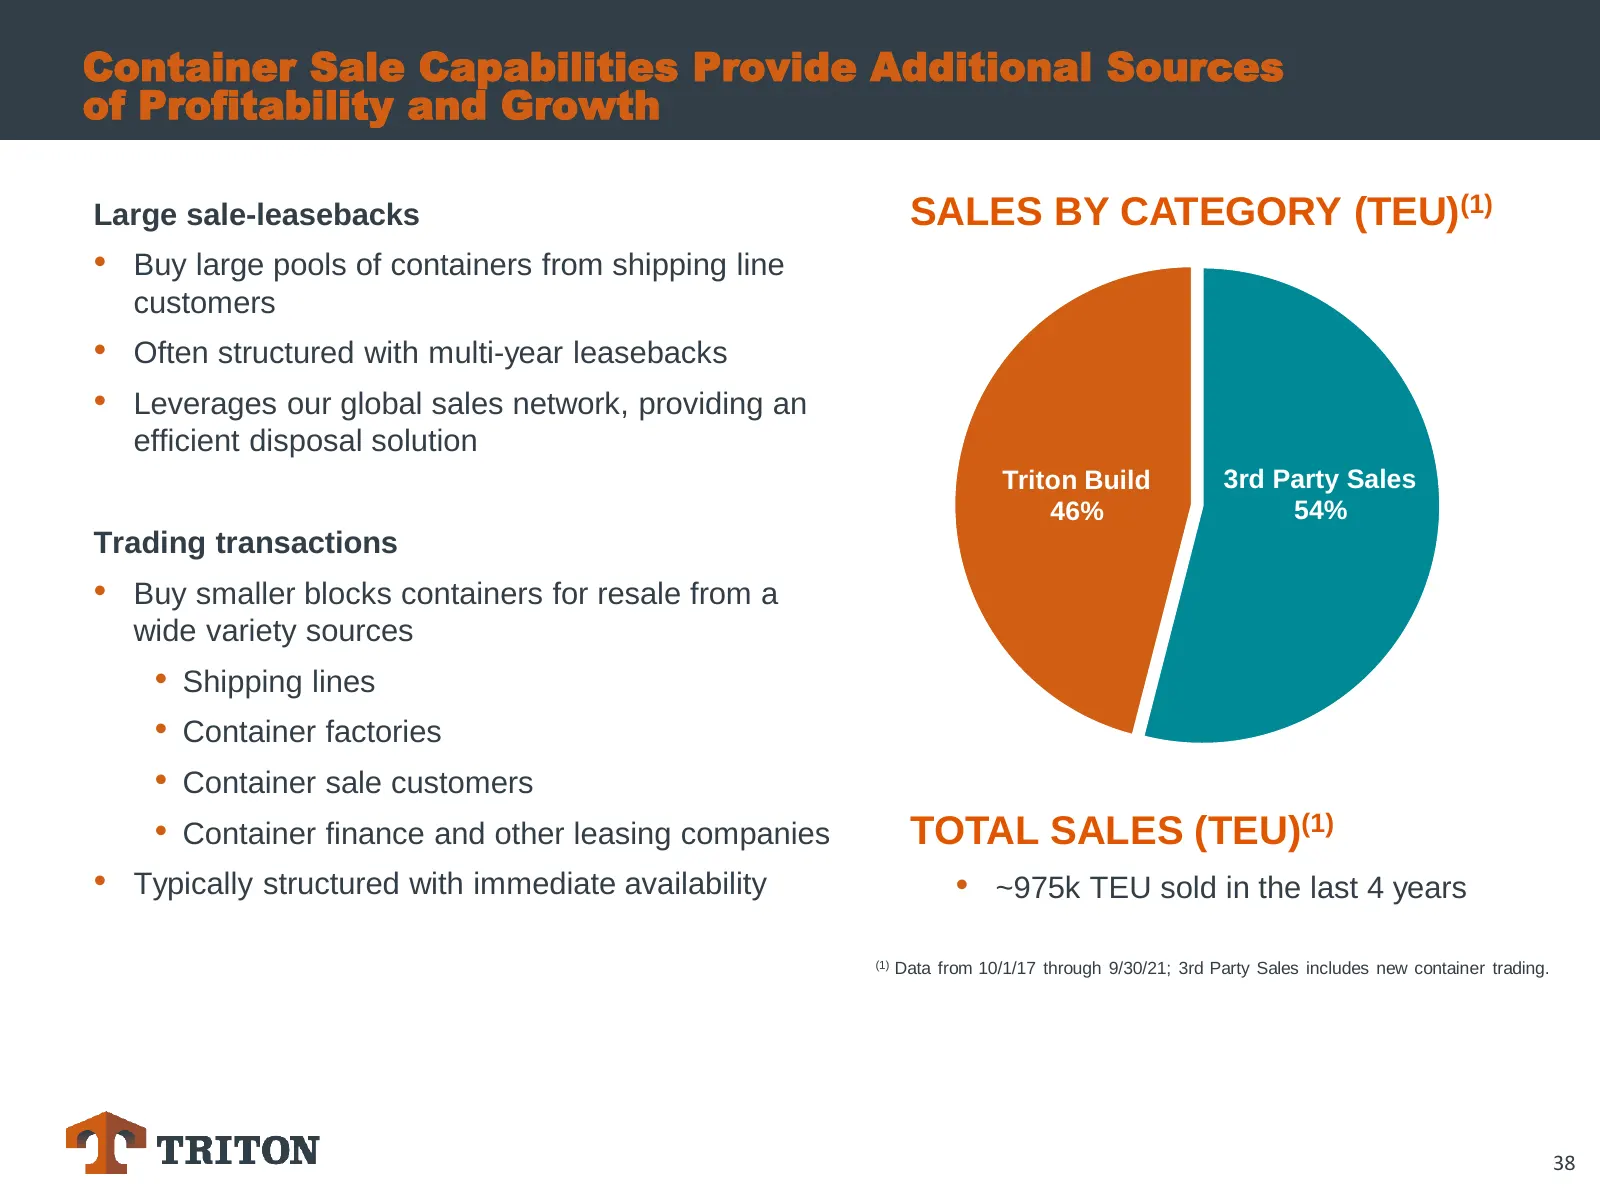
Slide 38: Container Sale Capabilities Provide Additional Sources of Profitability and Growth
Container Sale Capabilities Provide Additional Sources of Profitability and Growth Large sale-leasebacks SALES BY CATEGORY (TEU)(1) • Buy large pools of containers from shipping line customers • Often structured with multi-year leasebacks • Leverages our global sales network, providing an efficient
Slide 39: Financial Performance & Capital Management
Financial Performance & Capital Management 39
Slide 40: Financial Performance Overview
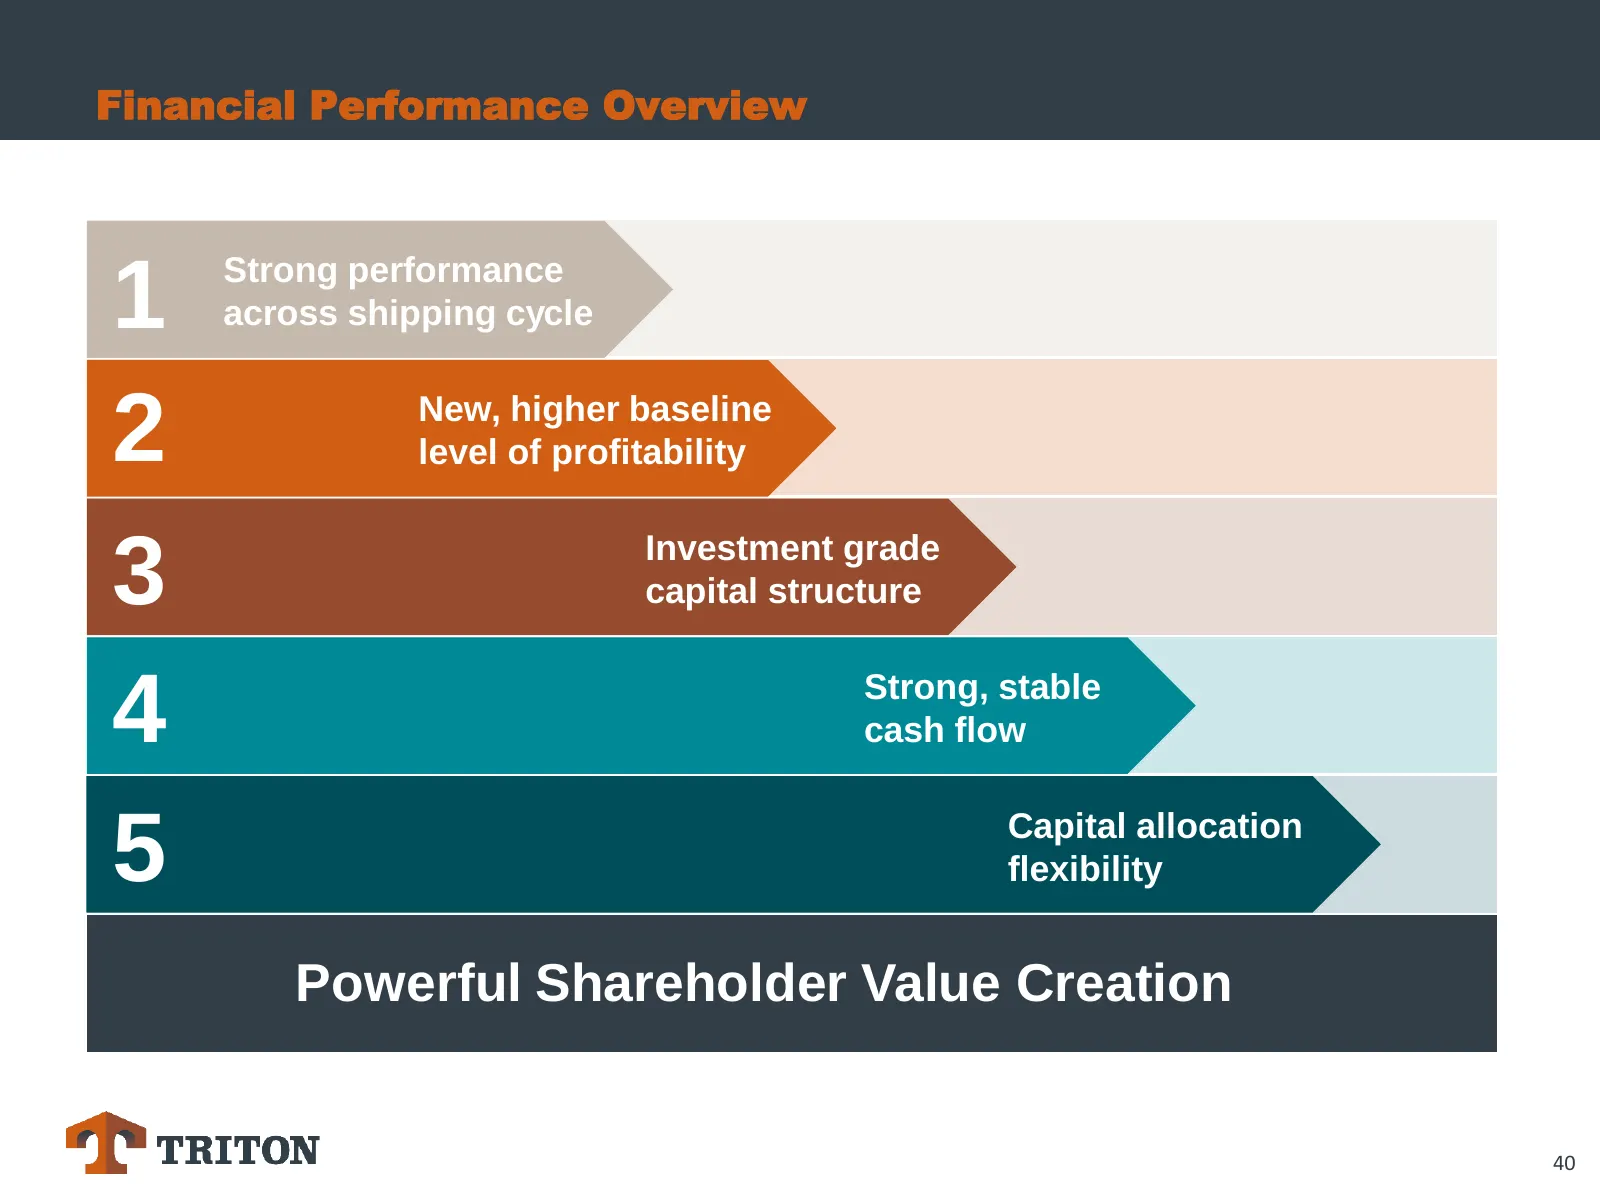
Financial Performance Overview Strong performance 1 across shipping cycle 2 New, higher baseline level of profitability 3 Investment grade capital structure 4 Strong, stable cash flow 5 Capital allocation flexibility Powerful Shareholder Value Creation 40
Slide 41: Strong Profitability Across the Shipping Cycle
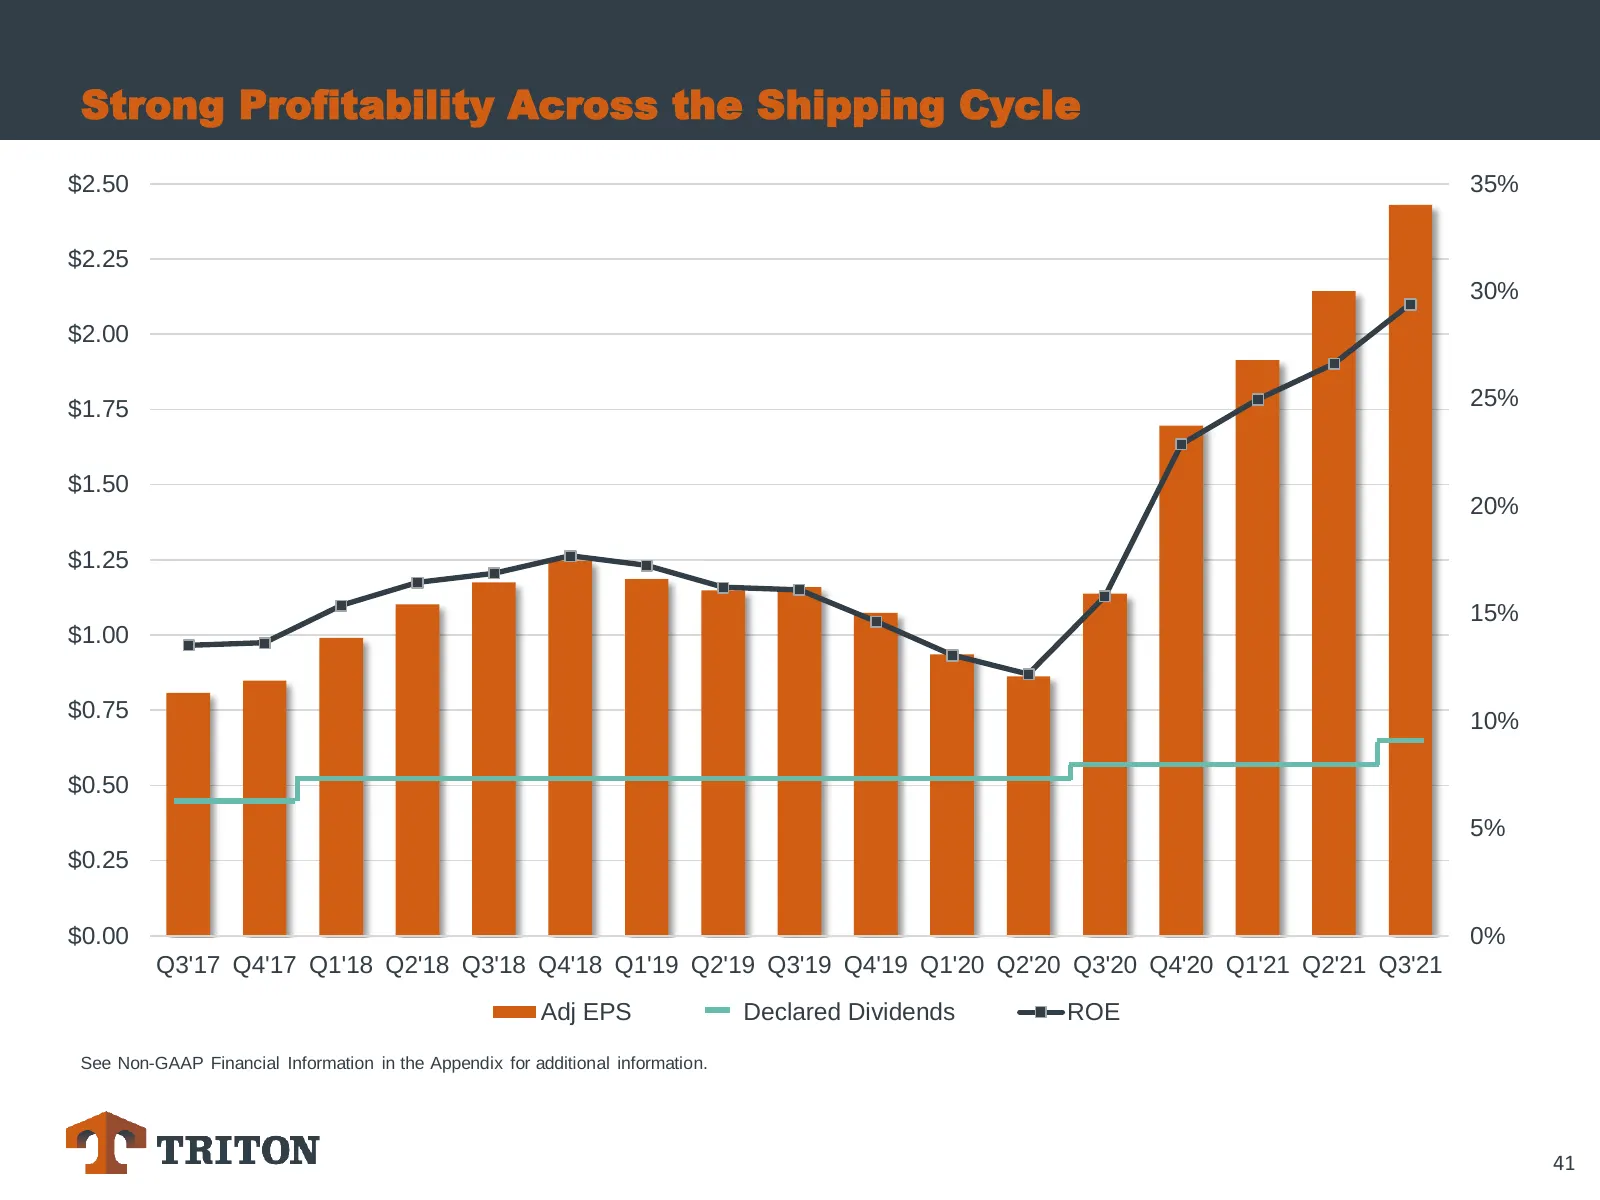
Strong Profitability Across the Shipping Cycle $2.50 35% $2.25 30% $2.00 $1.75 25% $1.50 20% $1.25 15% $1.00 $0.75 10% $0.50 5% $0.25 $0.00 0% Q3'17 Q4'17 Q1'18 Q2'18 Q3'18 Q4'18 Q1'19 Q2'19 Q3'19 Q4'19 Q1'20 Q2'20 Q3'20 Q4'20 Q1'21 Q2'21 Q3'21 Adj EPS Declared Dividends ROE See Non-GAAP Financial I
Slide 42: Expect Increase in Profitability Will be Durable
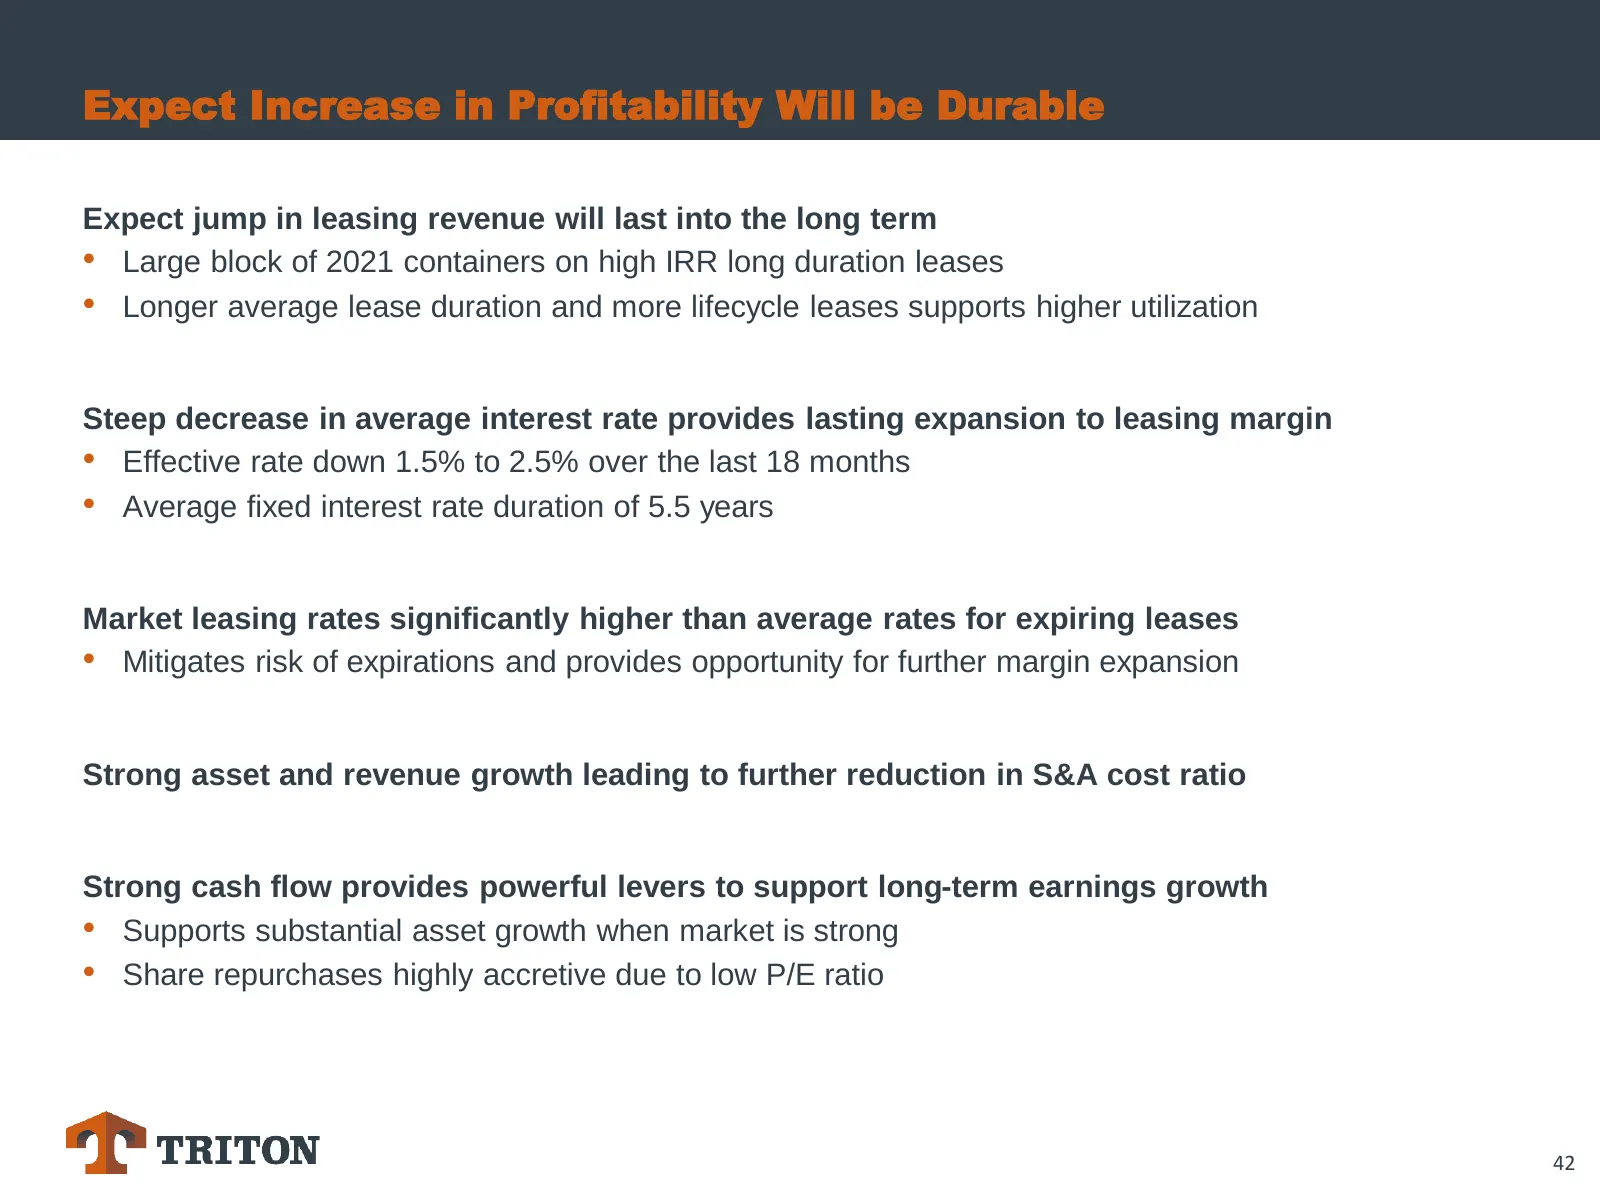
Expect Increase in Profitability Will be Durable Expect jump in leasing revenue will last into the long term • Large block of 2021 containers on high IRR long duration leases • Longer average lease duration and more lifecycle leases supports higher utilization Steep decrease in average interest rate
Slide 43: Expect Leasing Margin Will Remain Elevated
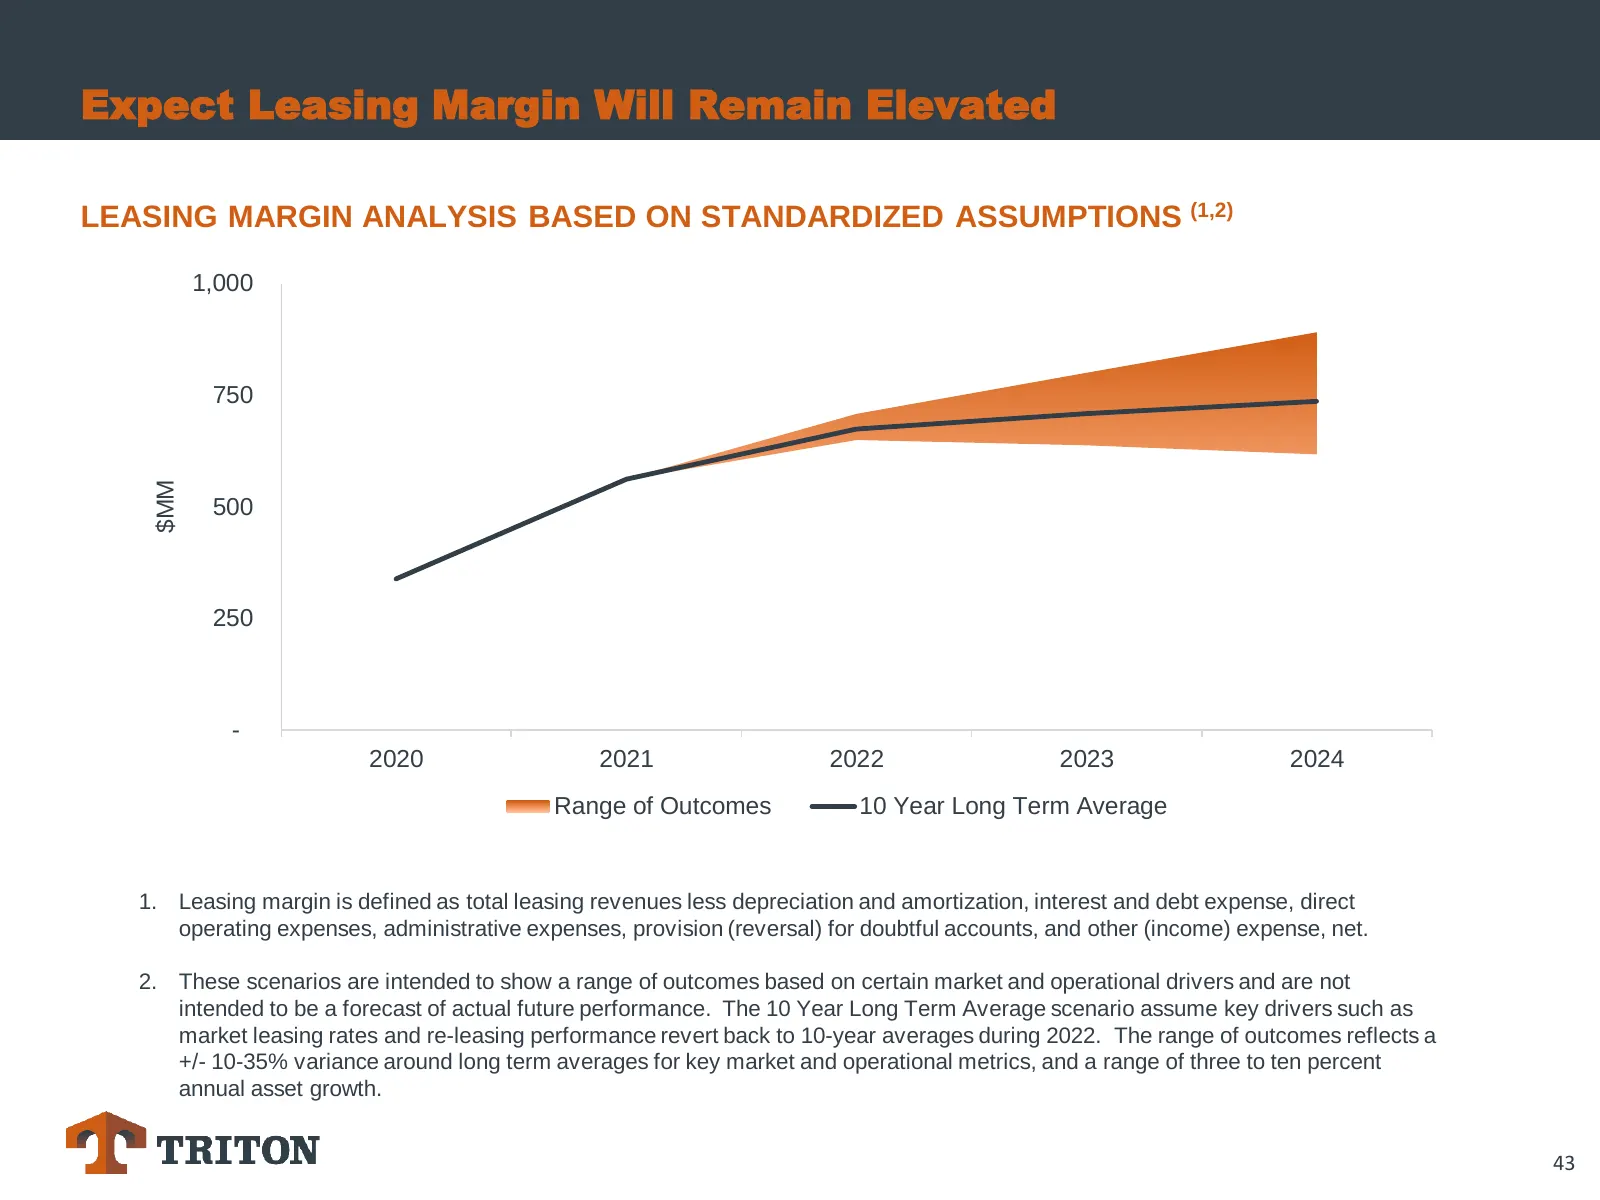
Expect Leasing Margin Will Remain Elevated LEASING MARGIN ANALYSIS BASED ON STANDARDIZED ASSUMPTIONS (1,2) 1,000 750 $MM 500 250 - 2020 2021 2022 2023 2024 Range of Outcomes 10 Year Long Term Average 1. Leasing margin is defined as total leasing revenues less depreciation and amortization, interest
Slide 44: Strong Lease Protections Across All Vintages
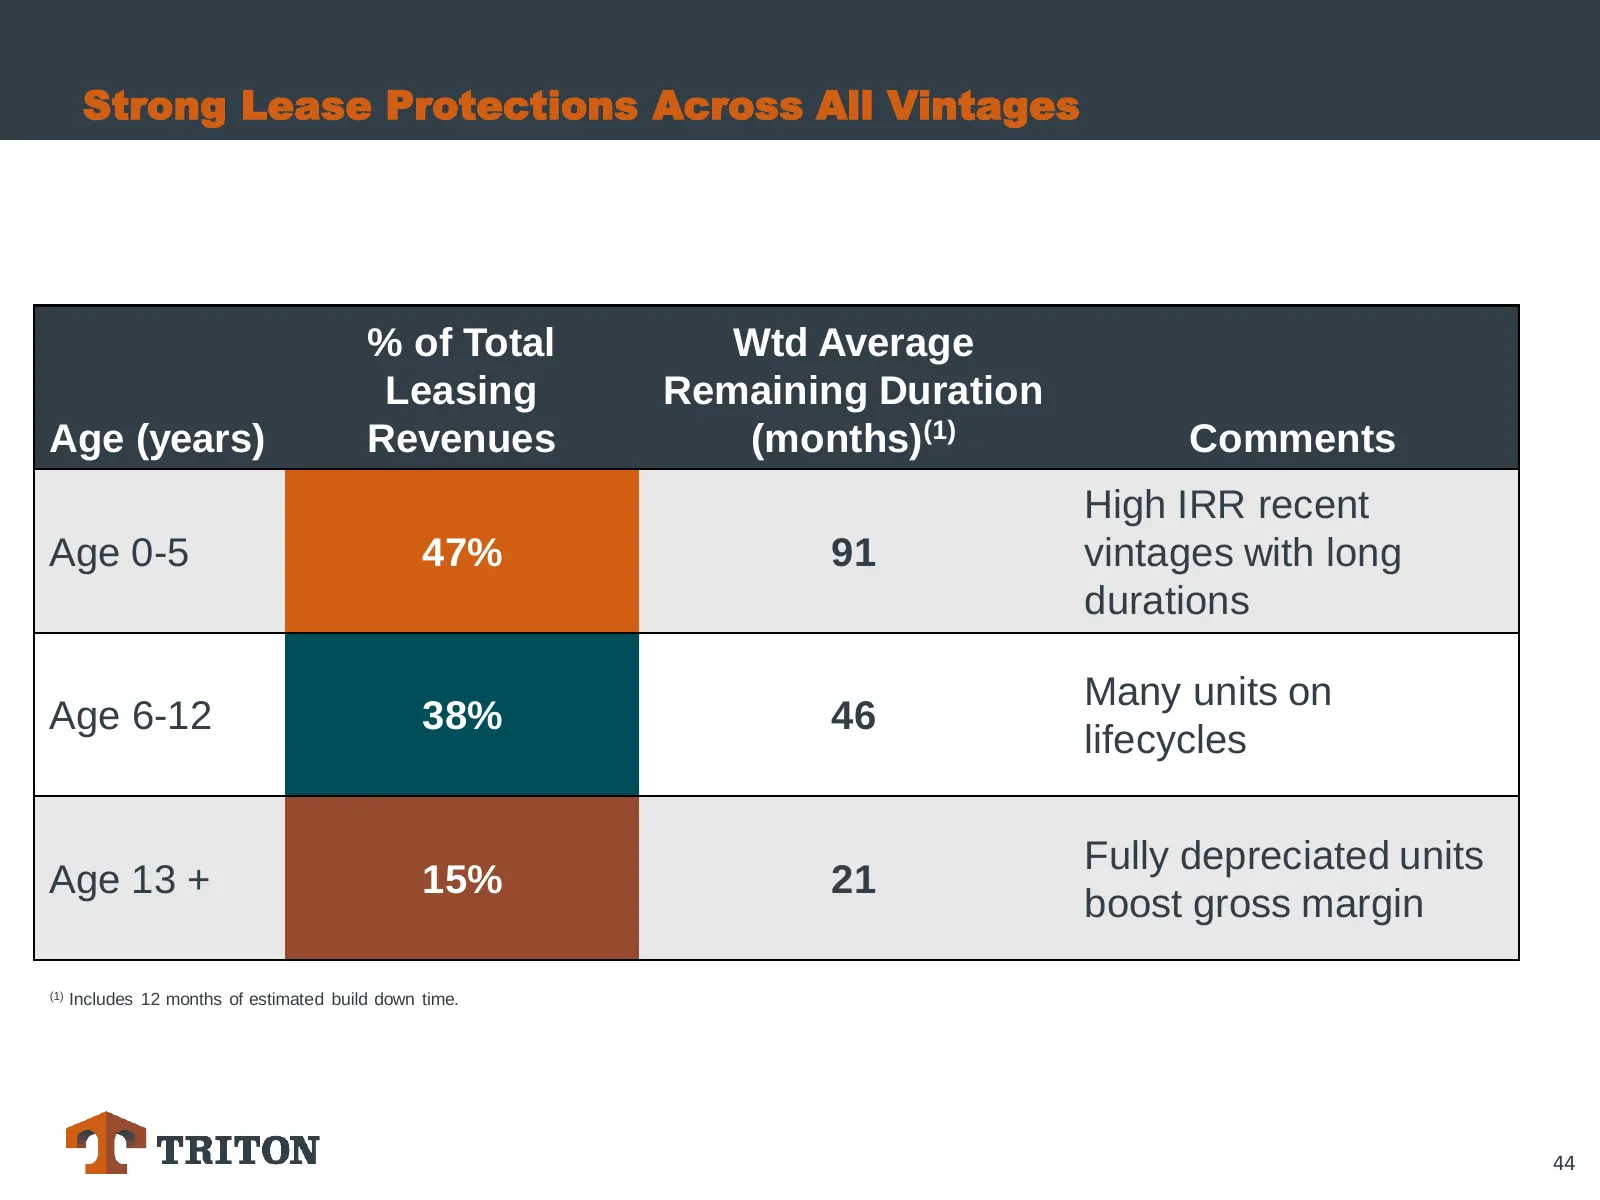
Strong Lease Protections Across All Vintages % of Total Wtd Average Leasing Remaining Duration Age (years) Revenues (months)(1) Comments High IRR recent Age 0-5 47% 91 vintages with long durations Many units on Age 6-12 38% 46 lifecycles Fully depreciated units Age 13 + 15% 21 boost gross margin (1)
Slide 45: Aggressive Refinancing has Significantly Reduced our Average Effective Interest Rate
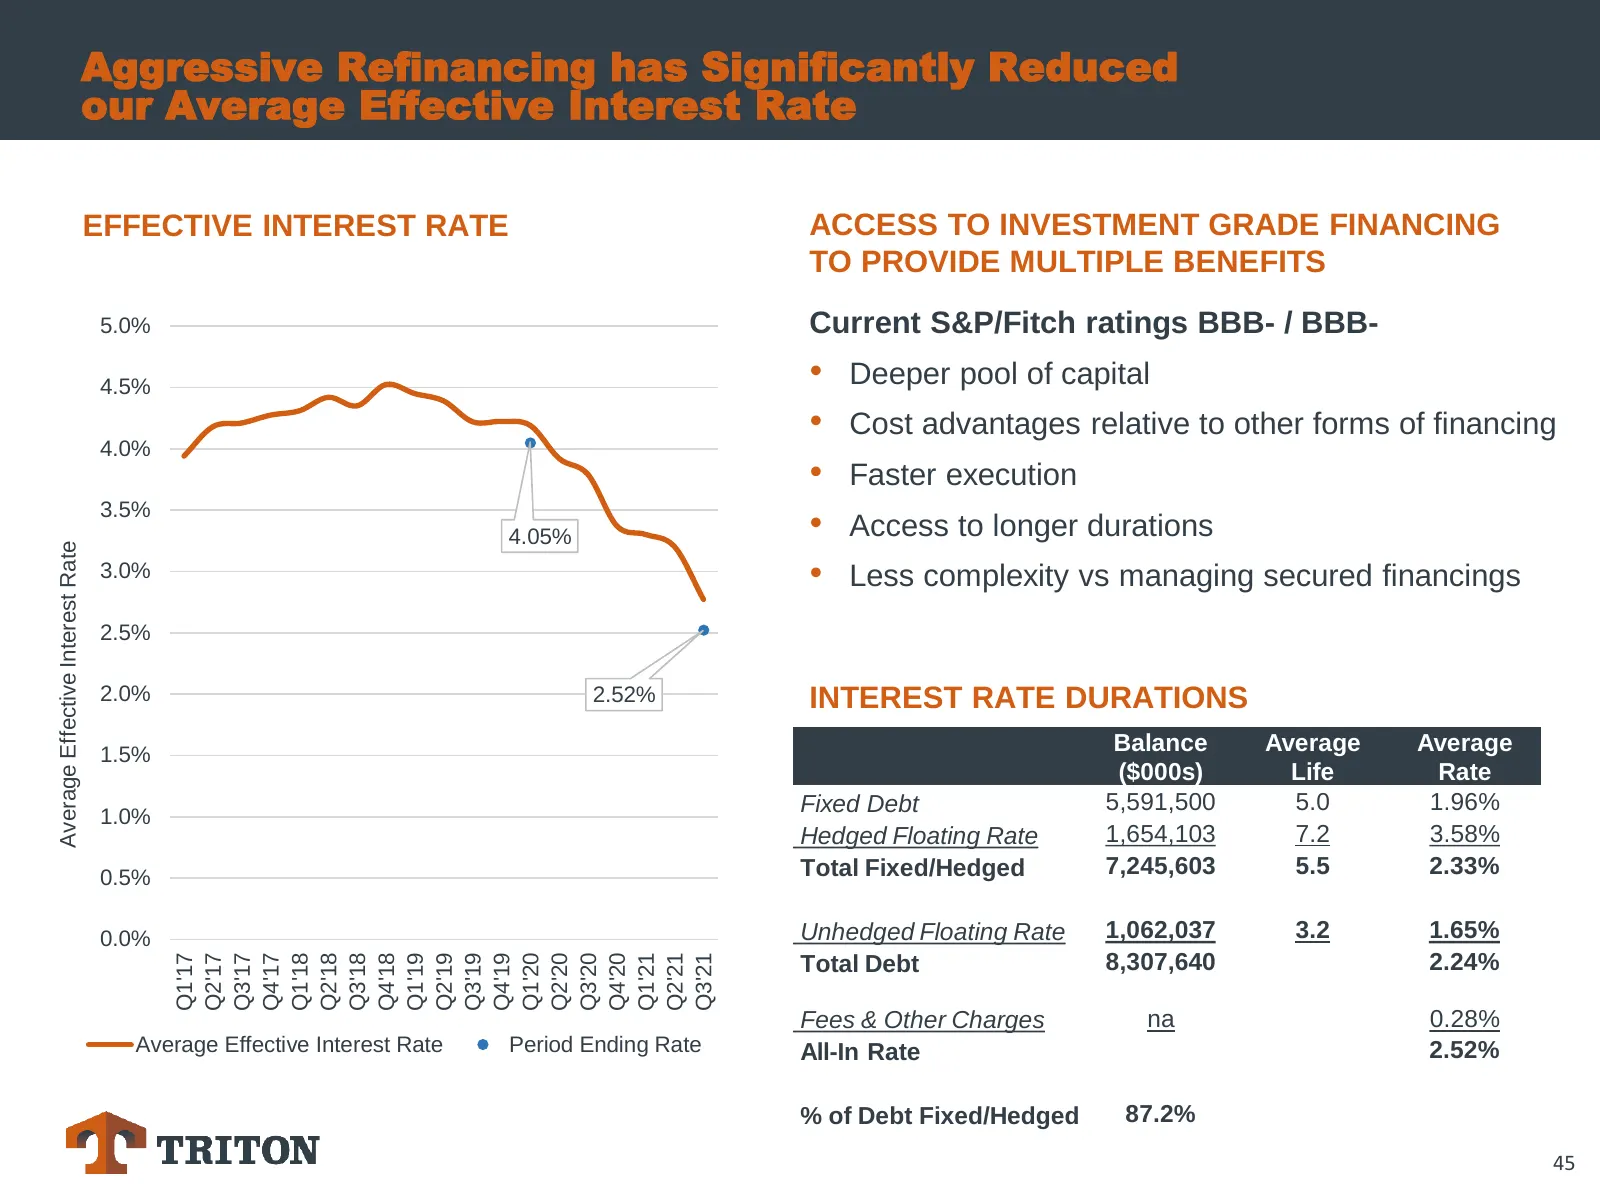
Aggressive Refinancing has Significantly Reduced our Average Effective Interest Rate EFFECTIVE INTEREST RATE ACCESS TO INVESTMENT GRADE FINANCING TO PROVIDE MULTIPLE BENEFITS 5.0% Current S&P/Fitch ratings BBB- / BBB- 4.5% • Deeper pool of capital • Cost advantages relative to other forms of financi
Slide 46: Strong and Stable Balance Sheet
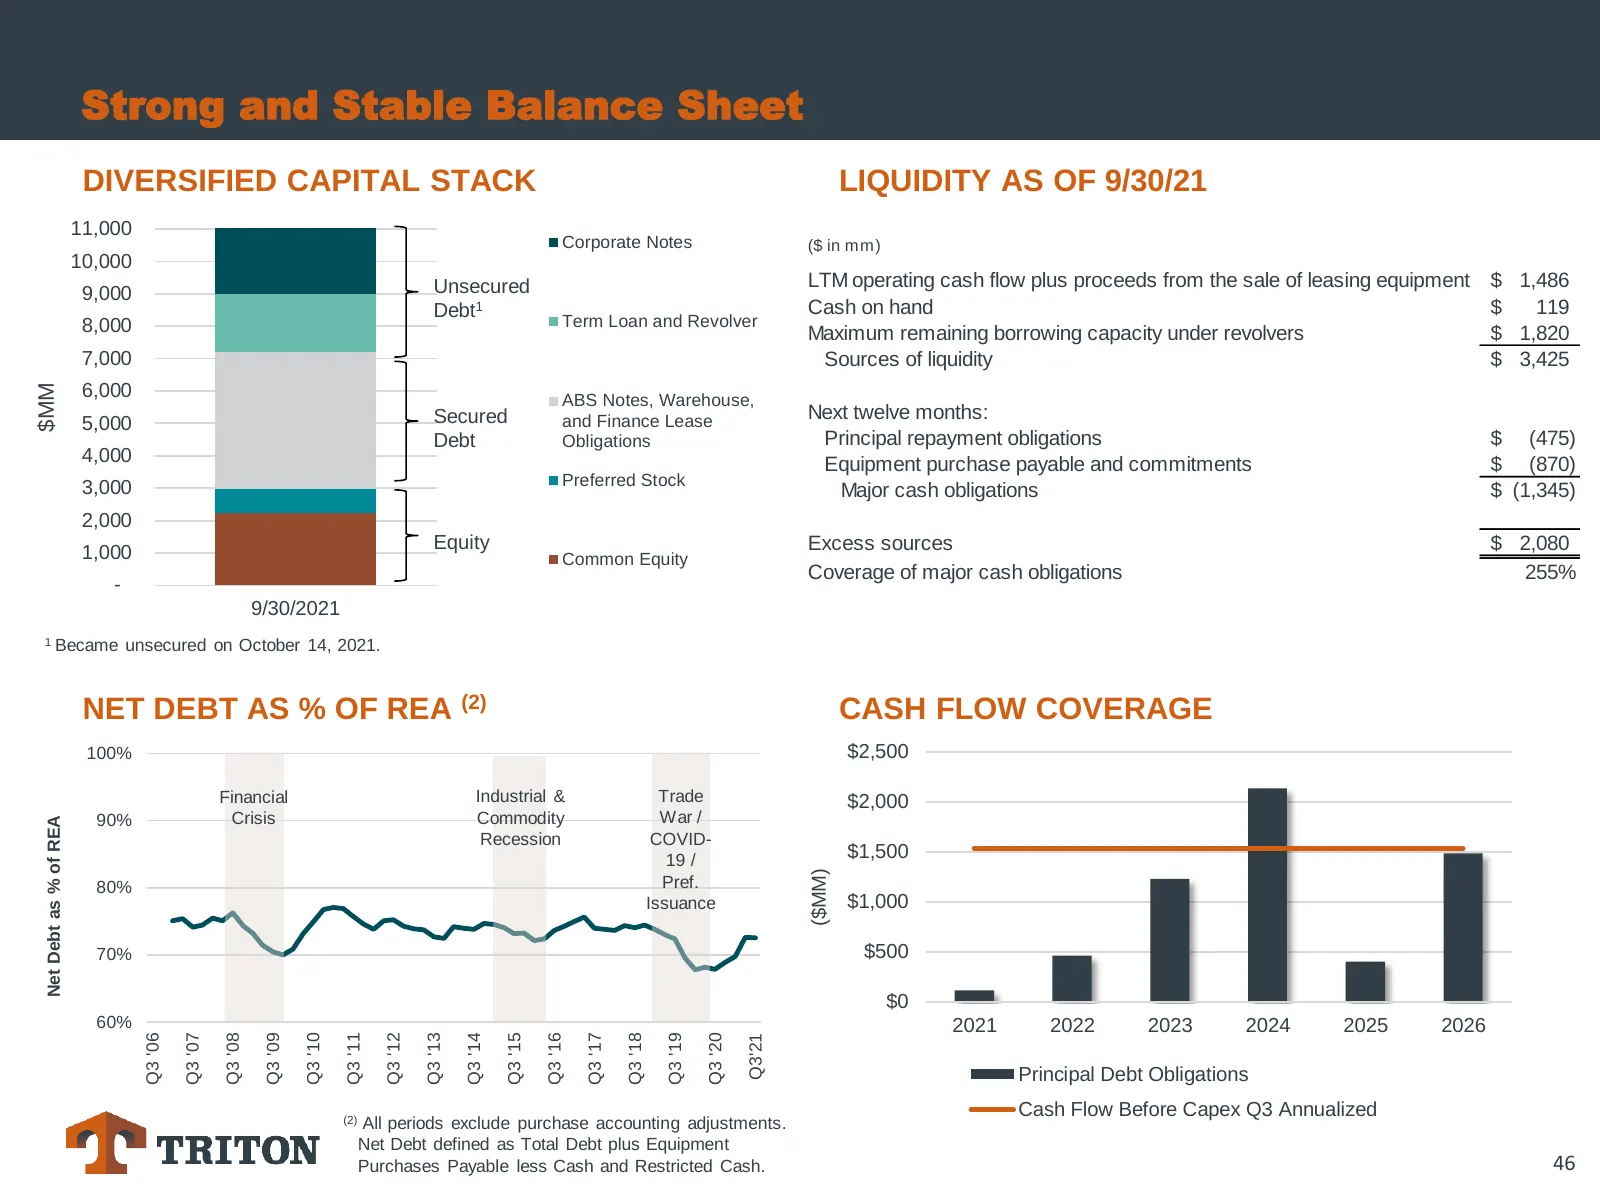
Strong and Stable Balance Sheet DIVERSIFIED CAPITAL STACK LIQUIDITY AS OF 9/30/21 11,000 Corporate Notes ($ in mm) 10,000 Unsecured LTM operating cash flow plus proceeds from the sale of leasing equipment $ 1,486 9,000 Debt1 Cash on hand $ 119 8,000 Term Loan and Revolver Maximum remaining borrowing
Slide 47: Fleet Analysis
Fleet Analysis 47
Slide 48: How Has the Fleet Portfolio Improved?
How Has the Fleet Portfolio Improved? The embedded value of Triton’s container fleet has increased meaningfully during the current surge • $4 billion of containers added since summer 2020 on high IRR, long duration leases • Increase in lease durations and share of lifecycle leases for existing conta
Slide 49: Lease Portfolio Valuation Analysis (I)
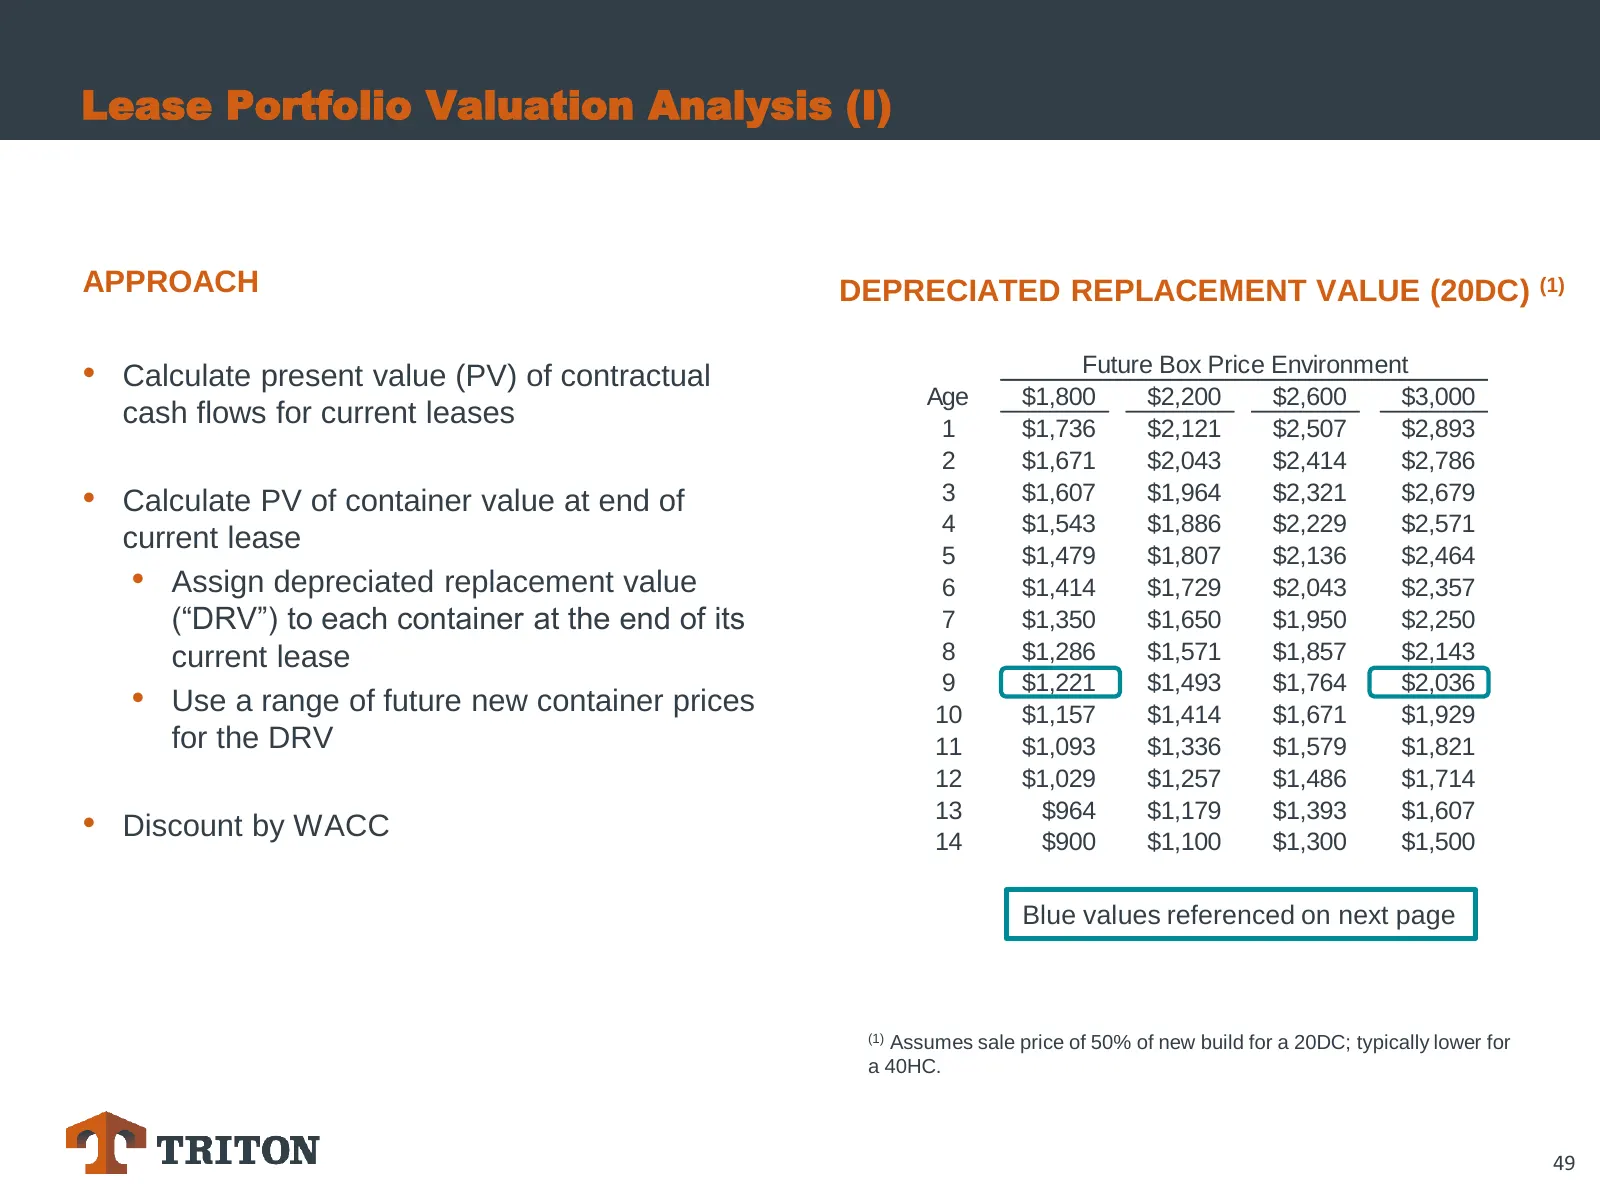
Lease Portfolio Valuation Analysis (I) APPROACH DEPRECIATED REPLACEMENT VALUE (20DC) (1) • Calculate present value (PV) of contractual Future Box Price Environment Age $1,800 $2,200 $2,600 $3,000 cash flows for current leases 1 $1,736 $2,121 $2,507 $2,893 2 $1,671 $2,043 $2,414 $2,786 • Calculate PV
Slide 50: Lease Portfolio Valuation Analysis (II)
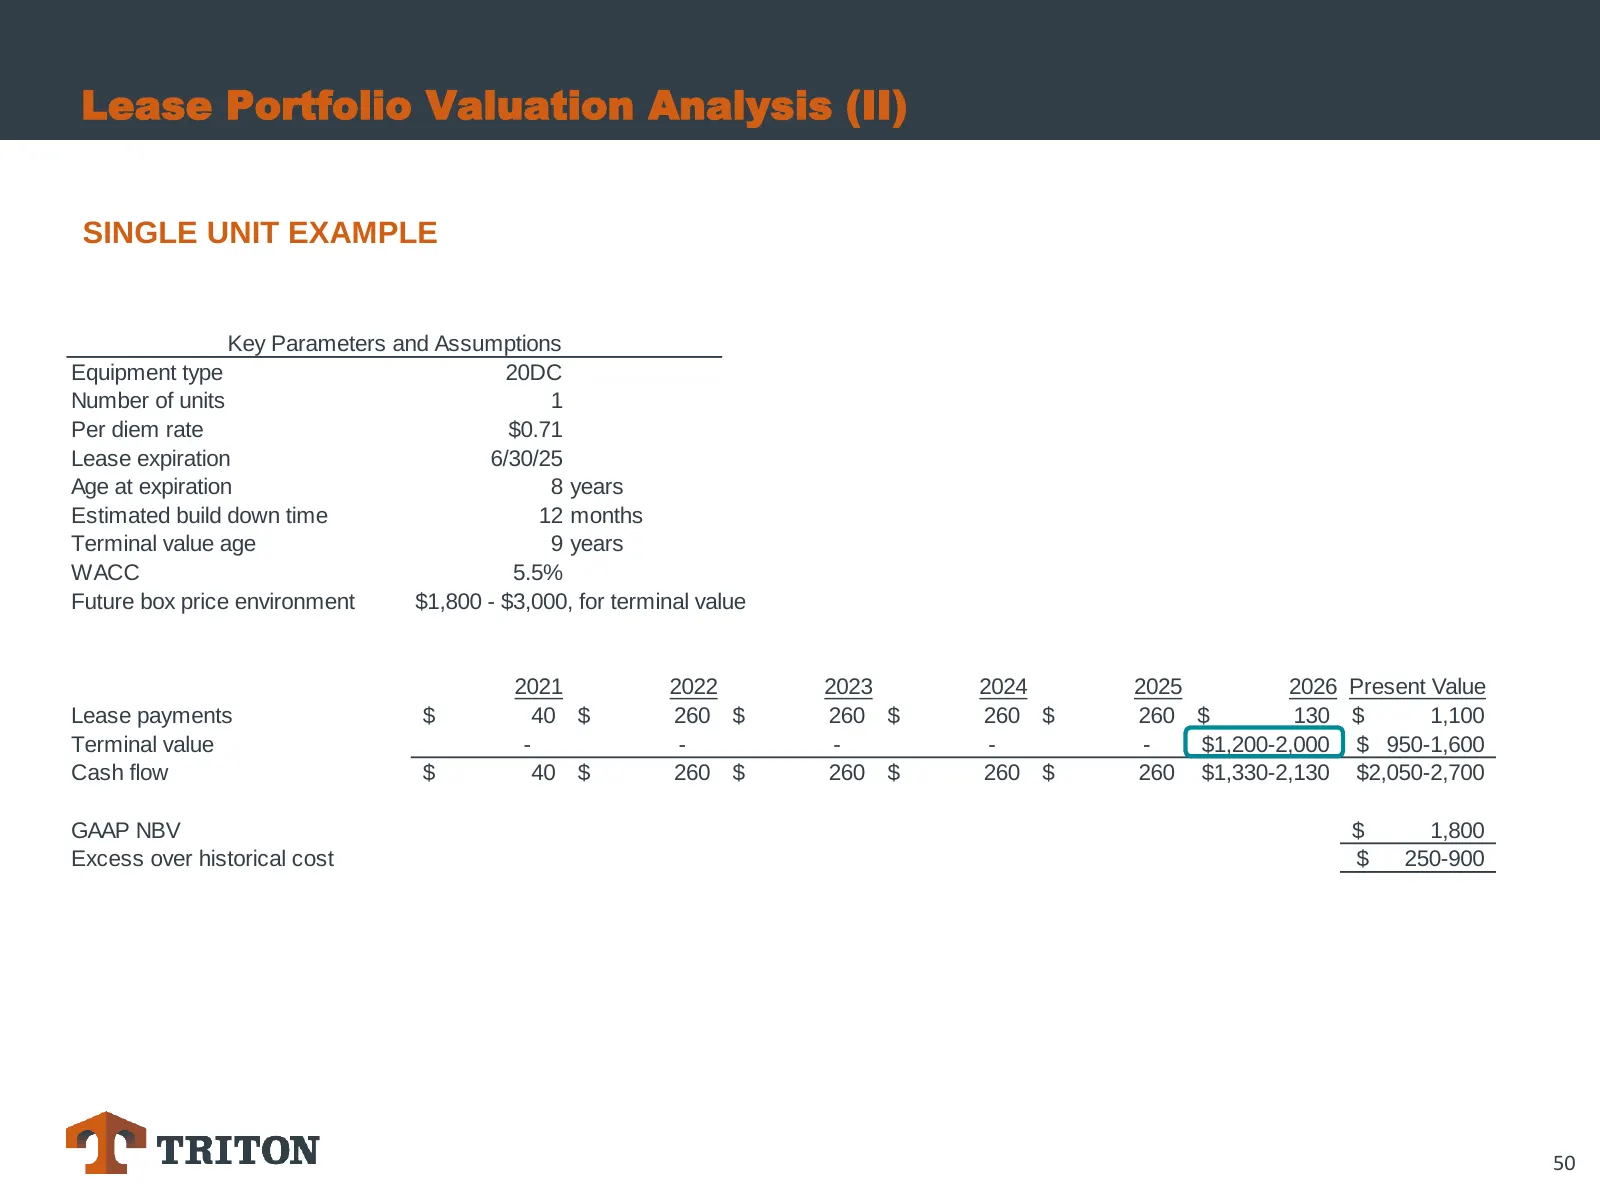
Lease Portfolio Valuation Analysis (II) SINGLE UNIT EXAMPLE Key Parameters and Assumptions Equipment type 20DC Number of units 1 Per diem rate $0.71 Lease expiration 6/30/25 Age at expiration 8 years Estimated build down time 12 months Terminal value age 9 years WACC 5.5% Future box price environmen
Slide 51: Lease Portfolio Valuation Analysis (III)
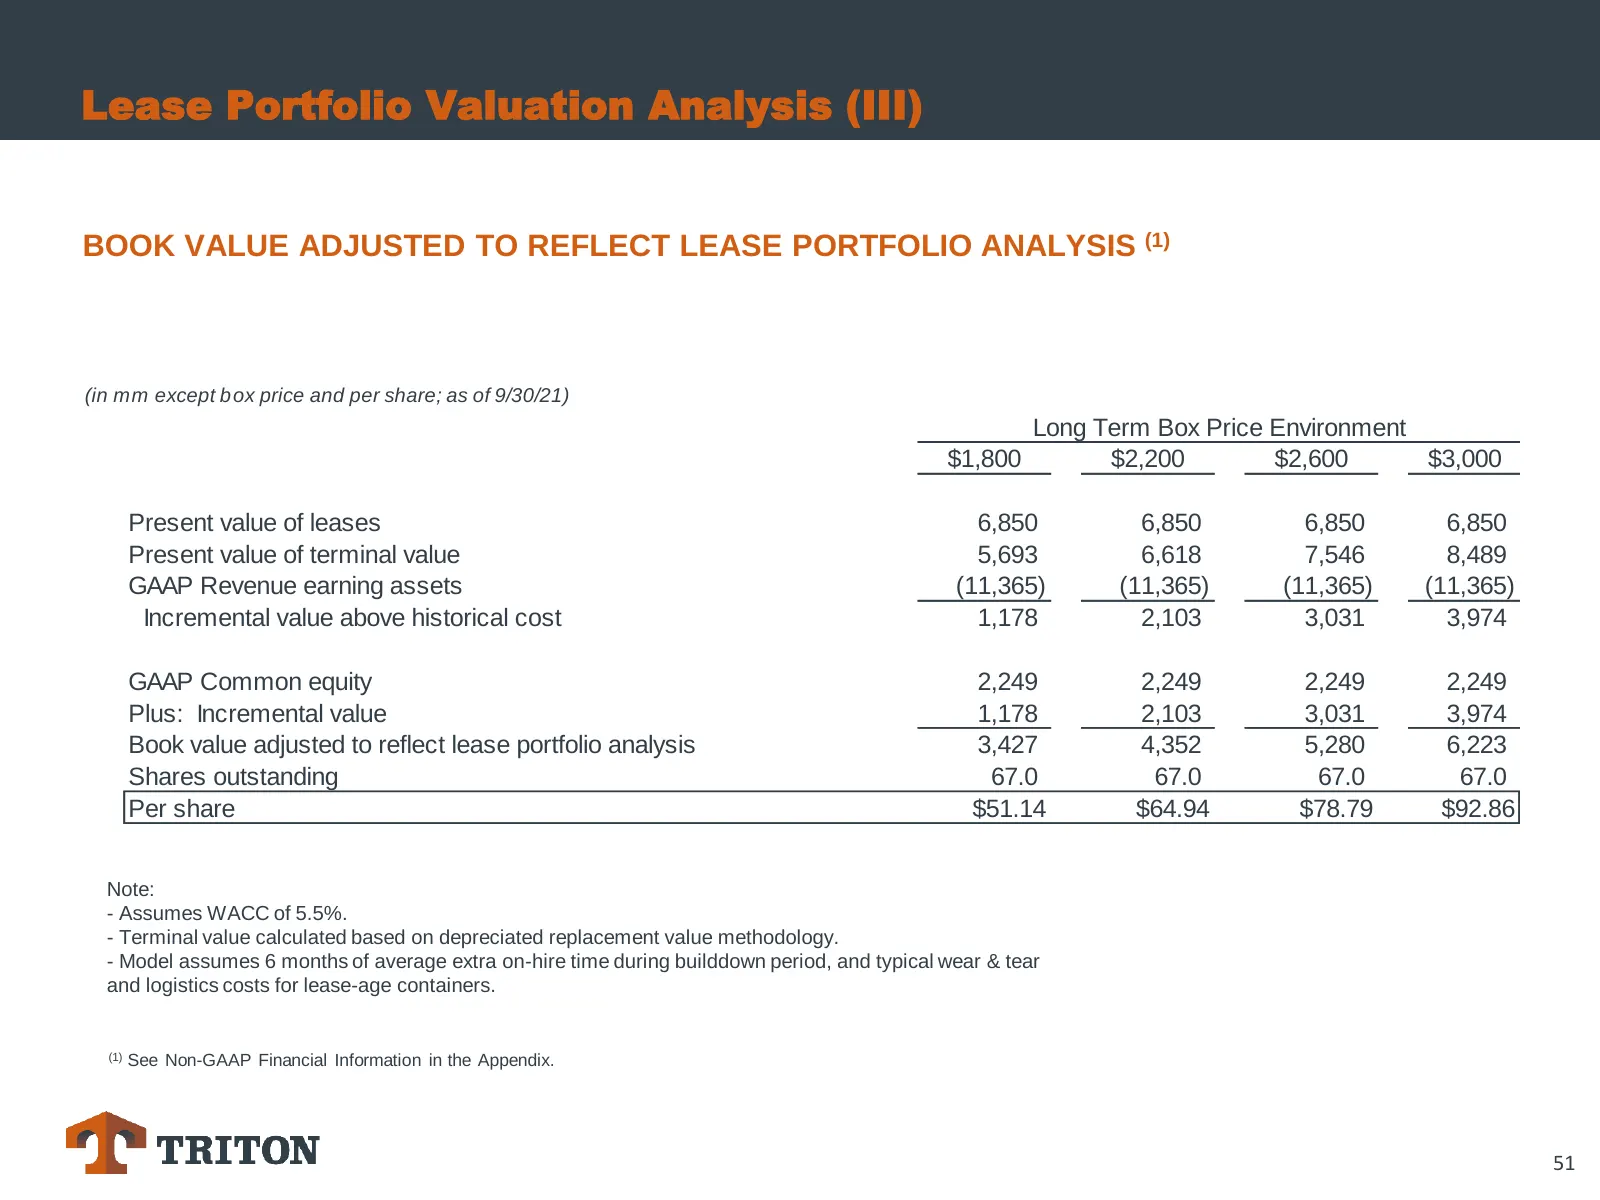
Lease Portfolio Valuation Analysis (III) BOOK VALUE ADJUSTED TO REFLECT LEASE PORTFOLIO ANALYSIS (1) (in mm except b ox price and per share; as of 9/30/21) Long Term Box Price Environment $1,800 $2,200 $2,600 $3,000 Present value of leases 6,850 6,850 6,850 6,850 Present value of terminal value 5,69
Slide 52: Capital Allocation
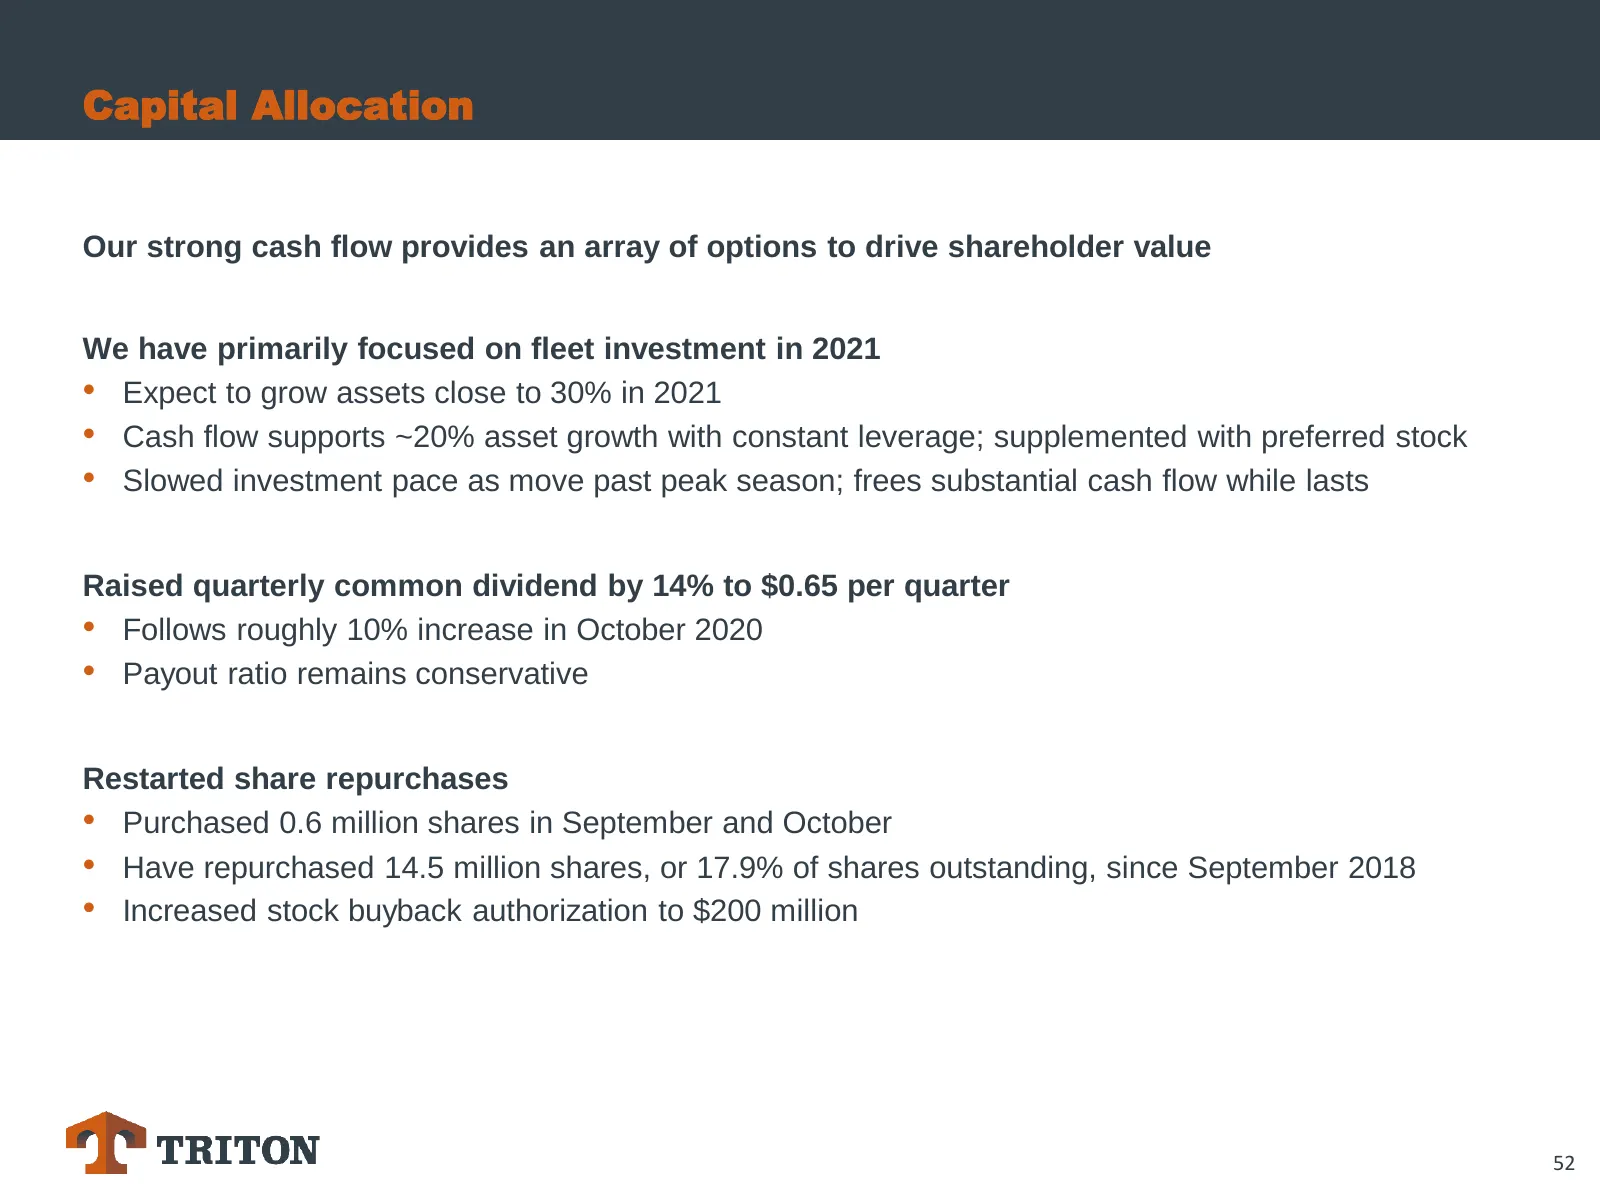
Capital Allocation Our strong cash flow provides an array of options to drive shareholder value We have primarily focused on fleet investment in 2021 • Expect to grow assets close to 30% in 2021 • Cash flow supports ~20% asset growth with constant leverage; supplemented with preferred stock • Slowed
Slide 53: Strong Cash Flow Provides Capital Allocation Alternatives
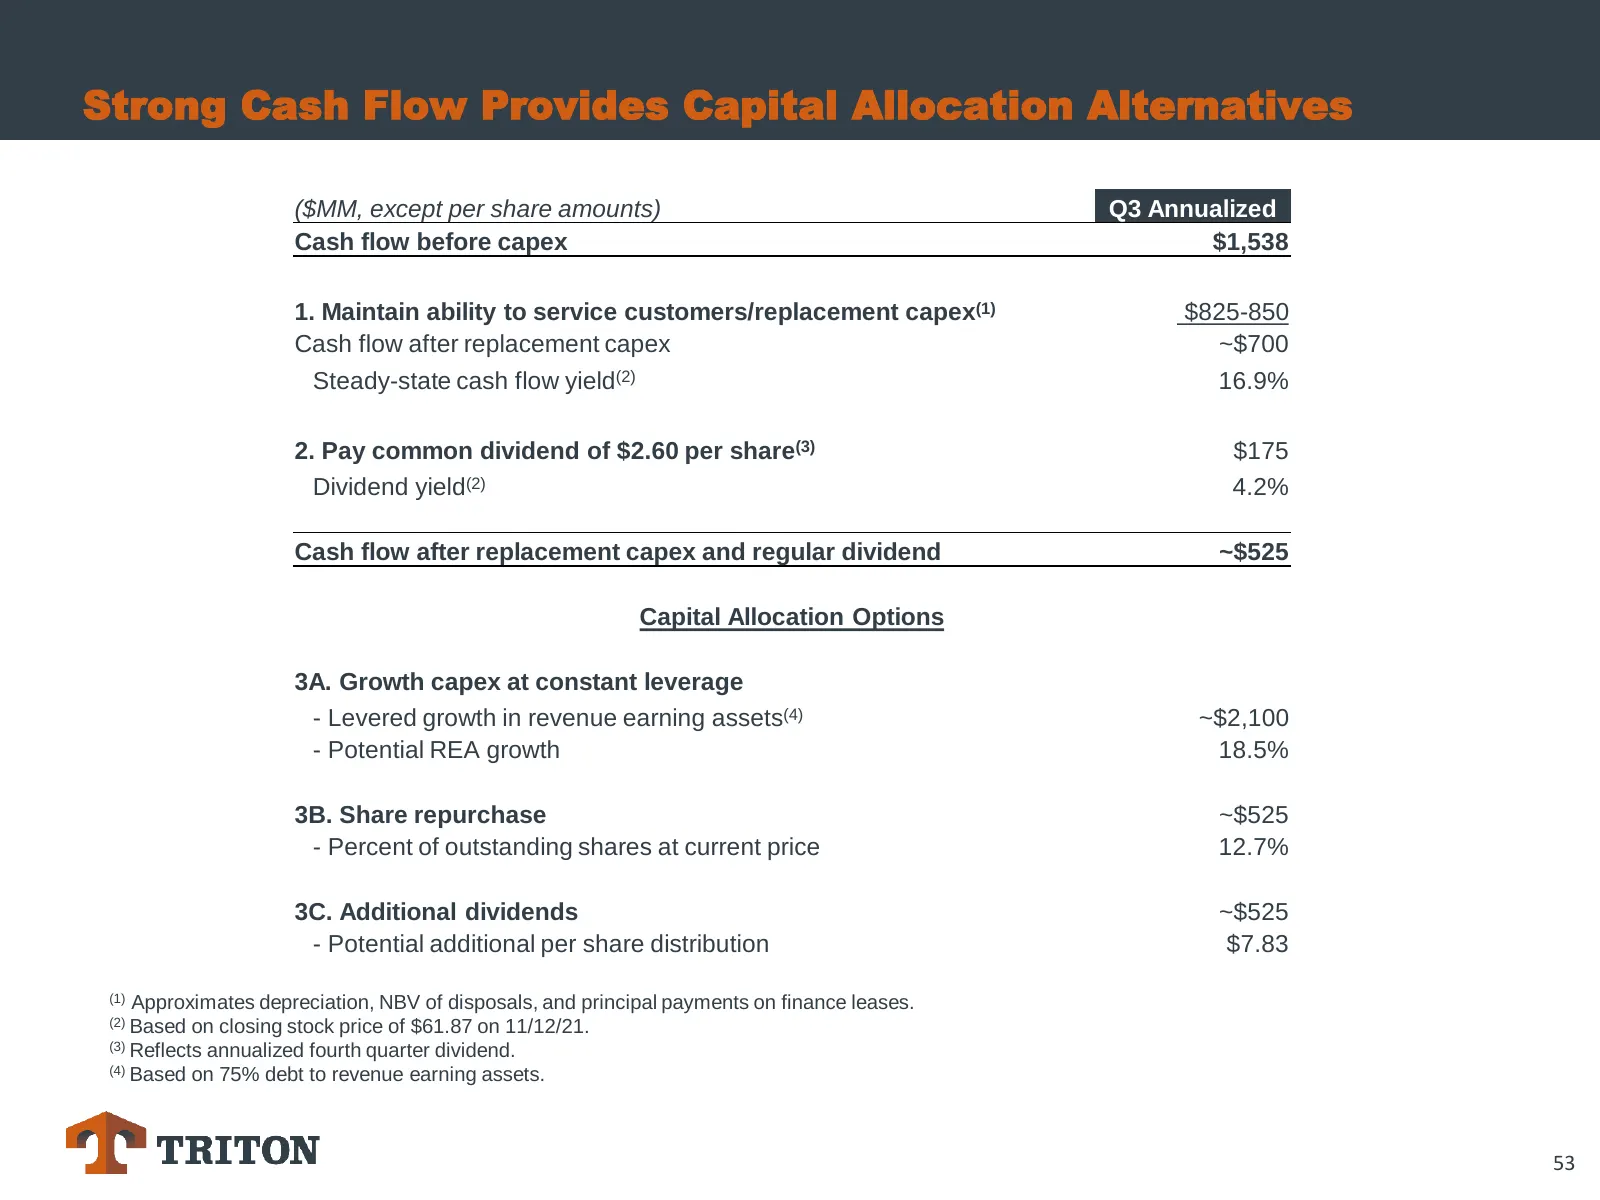
Strong Cash Flow Provides Capital Allocation Alternatives ($MM, except per share amounts) Q3 Annualized Cash flow before capex $1,538 1. Maintain ability to service customers/replacement capex(1) $825-850 Cash flow after replacement capex ~$700 Steady-state cash flow yield(2) 16.9% 2. Pay common div
Slide 54: Triton Capital Allocation Over the Last Five Years
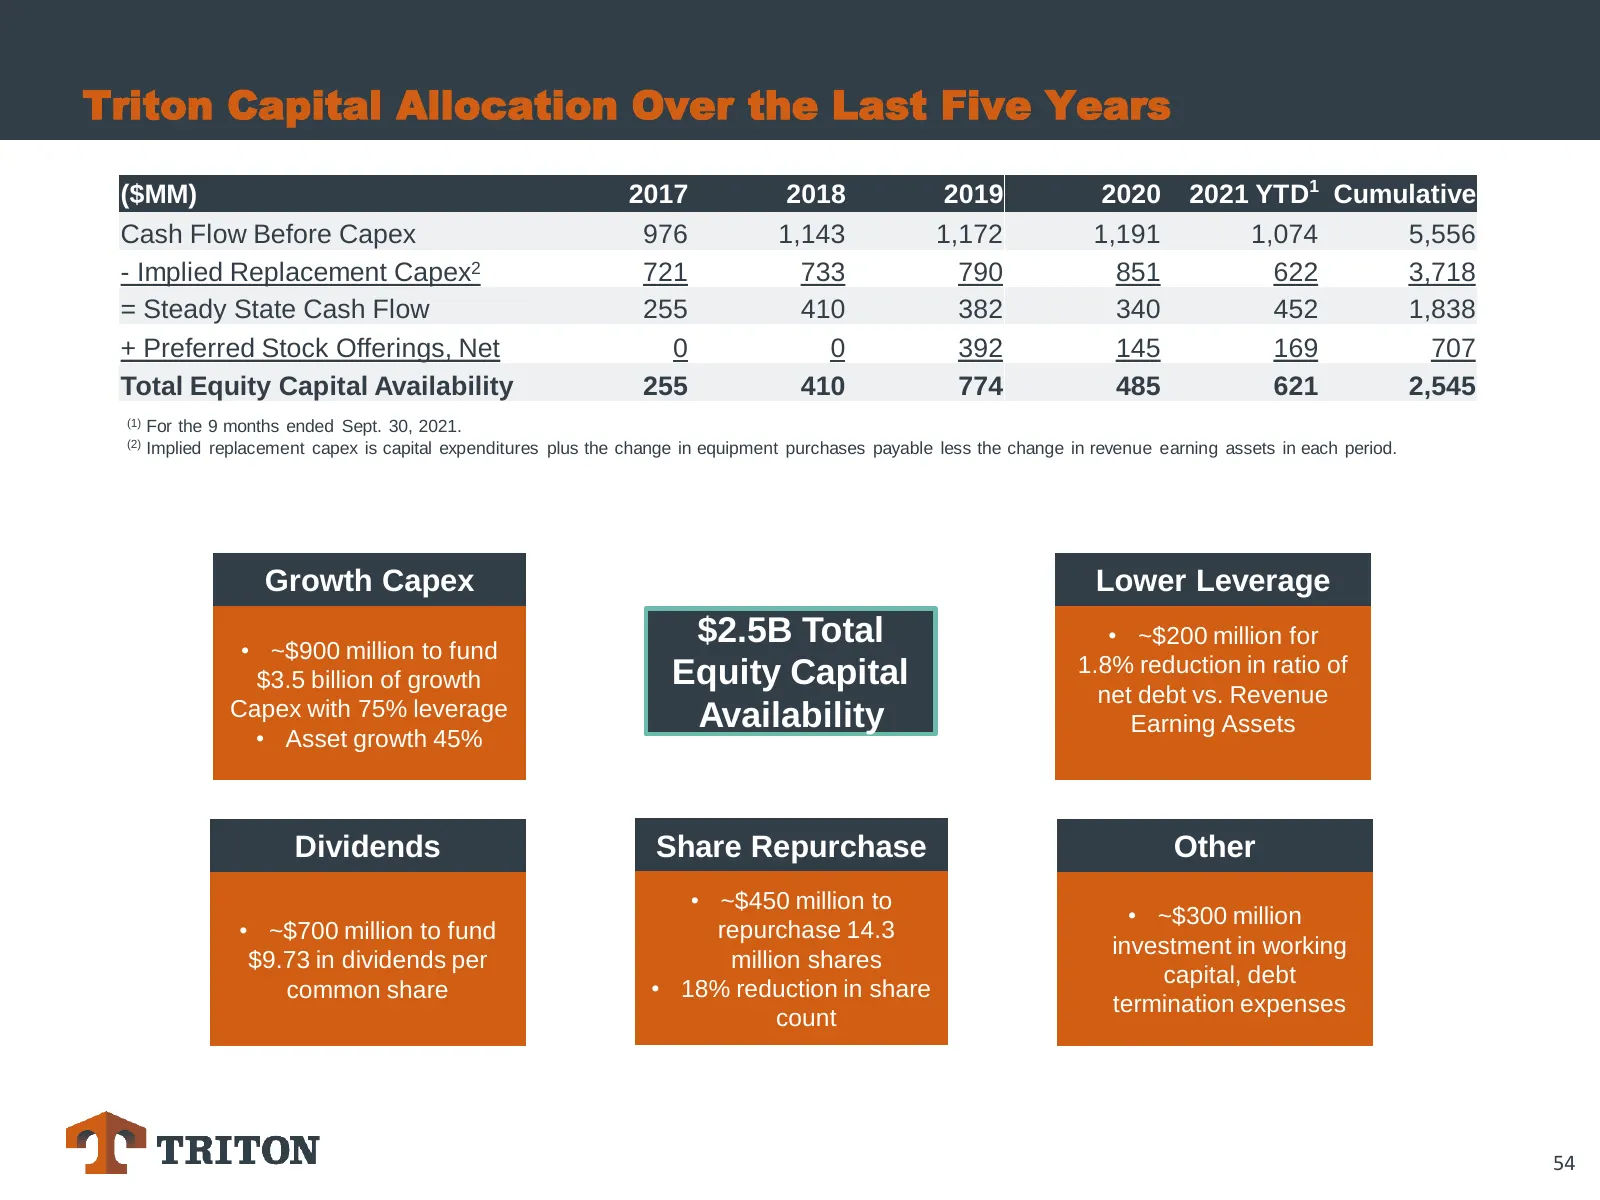
Triton Capital Allocation Over the Last Five Years ($MM) 2017 2018 2019 2020 2021 YTD1 Cumulative Cash Flow Before Capex 976 1,143 1,172 1,191 1,074 5,556 - Implied Replacement Capex2 721 733 790 851 622 3,718 = Steady State Cash Flow 255 410 382 340 452 1,838 + Preferred Stock Offerings, Net 0 0 39
Slide 55: ESG Initiatives
TRITON — TRHU is, — e —| [a #
Slide 56: Our Focus on ESG
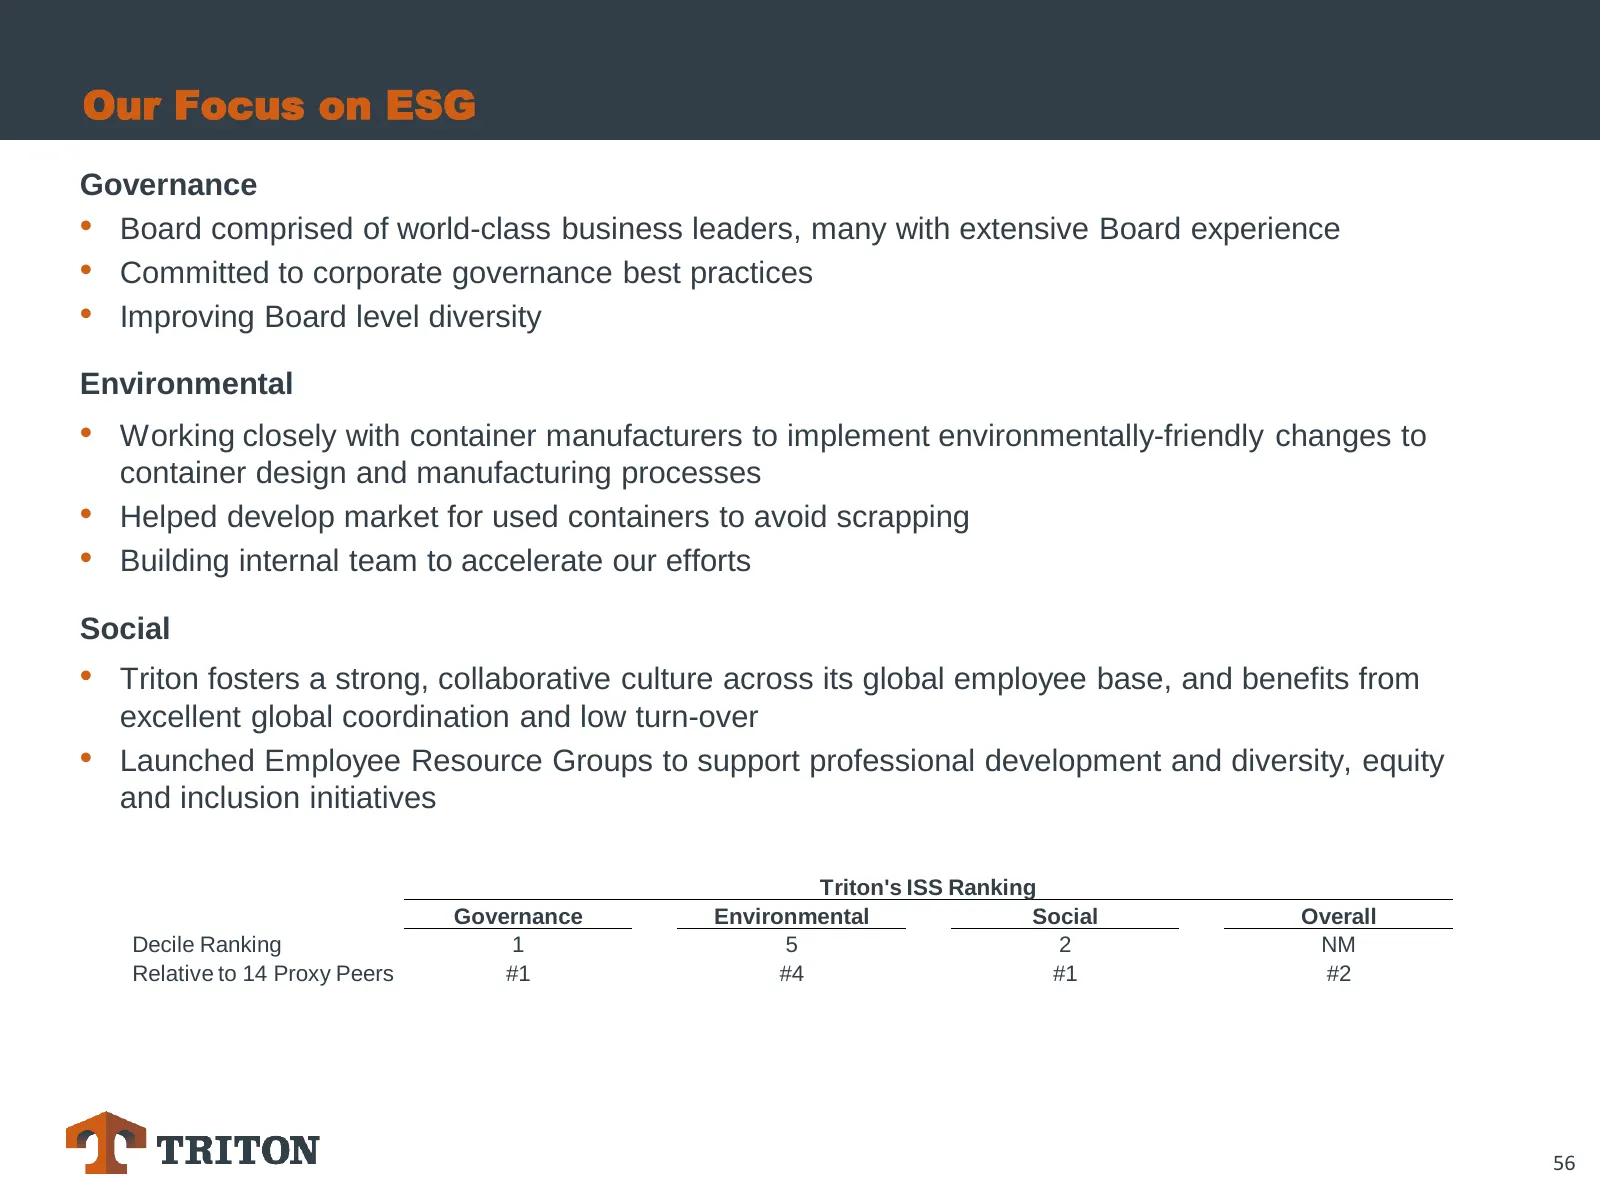
Our Focus on ESG Governance • Board comprised of world-class business leaders, many with extensive Board experience • Committed to corporate governance best practices • Improving Board level diversity Environmental • Working closely with container manufacturers to implement environmentally-friendly
Slide 57: How We Operate
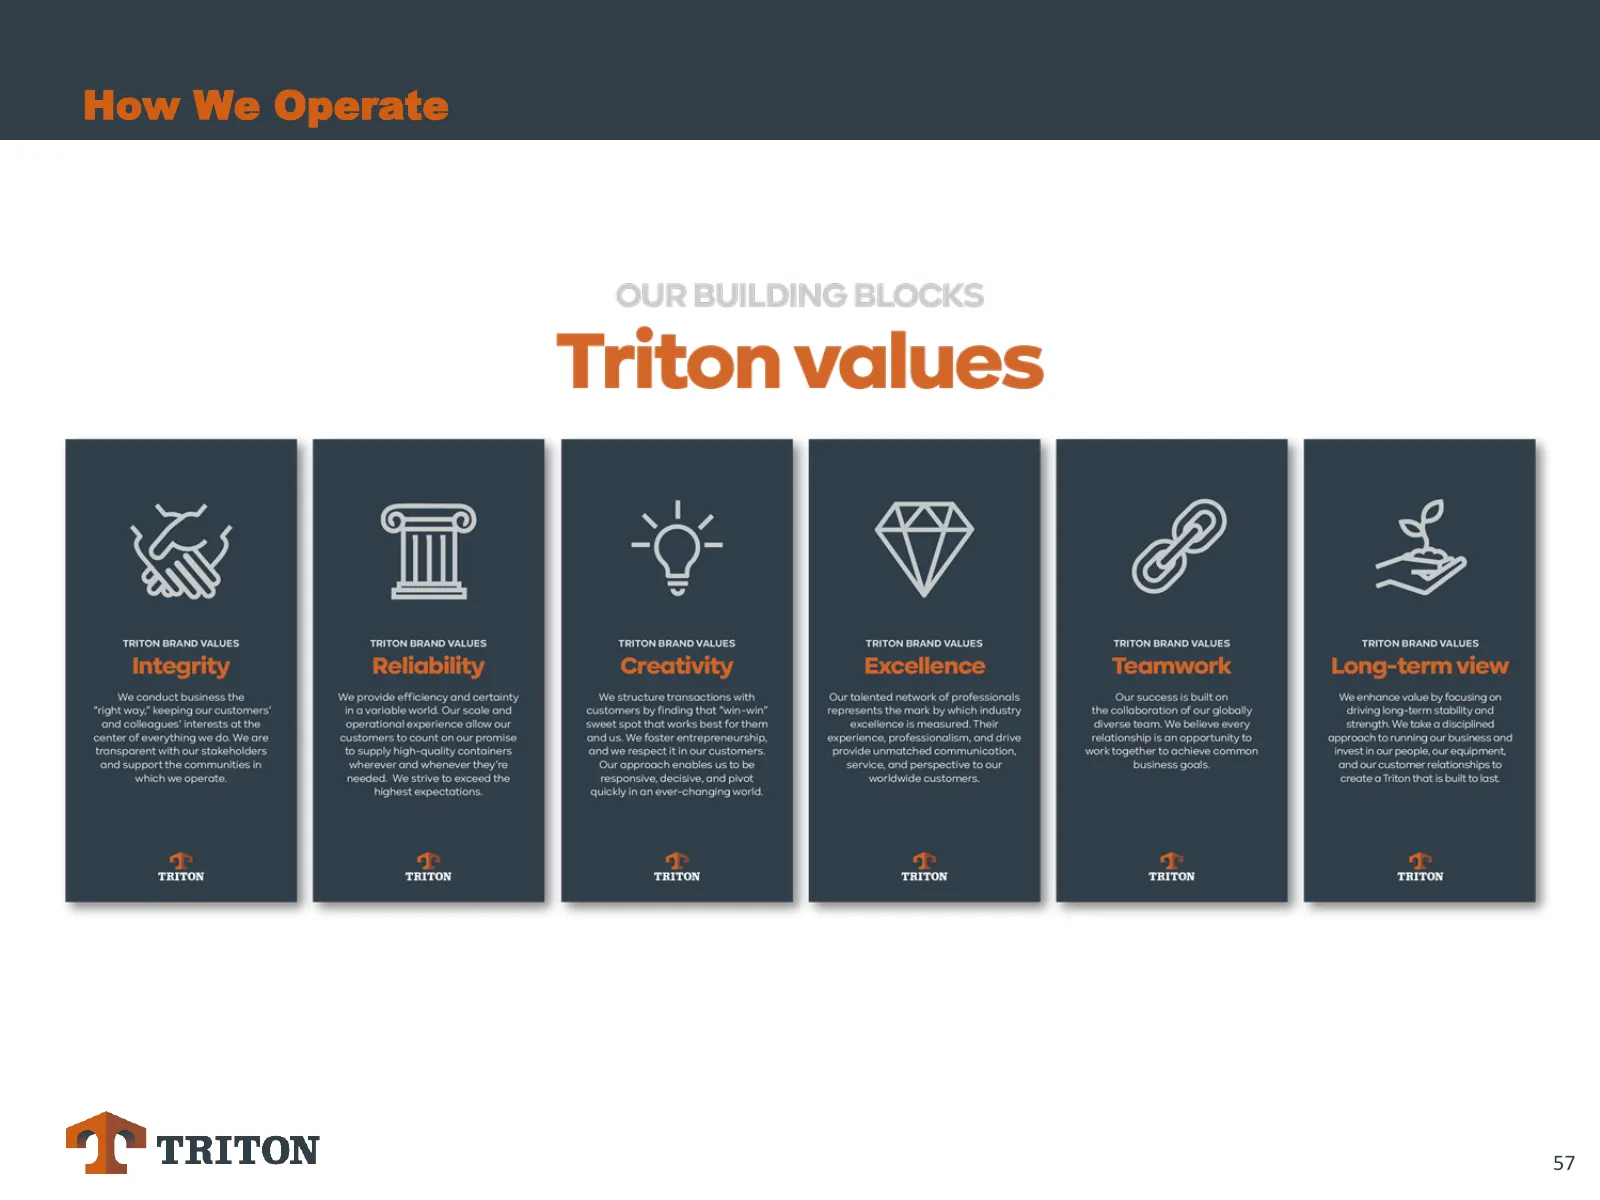
How We Operate ‘TRITON BRAND VALUES, TRITON BRAND VALUES TRITON BRAND VALUES. ‘TRITON BRAND VALUES TRITON BRAND VALUES. ‘TRITON BRAND VALUES Integrity Reliability Creativity Excellence Teamwork Long-term view *P triton -
Slide 58: Conclusions & Outlook
Conclusions & Outlook 58
Slide 59: Conclusions & Outlook
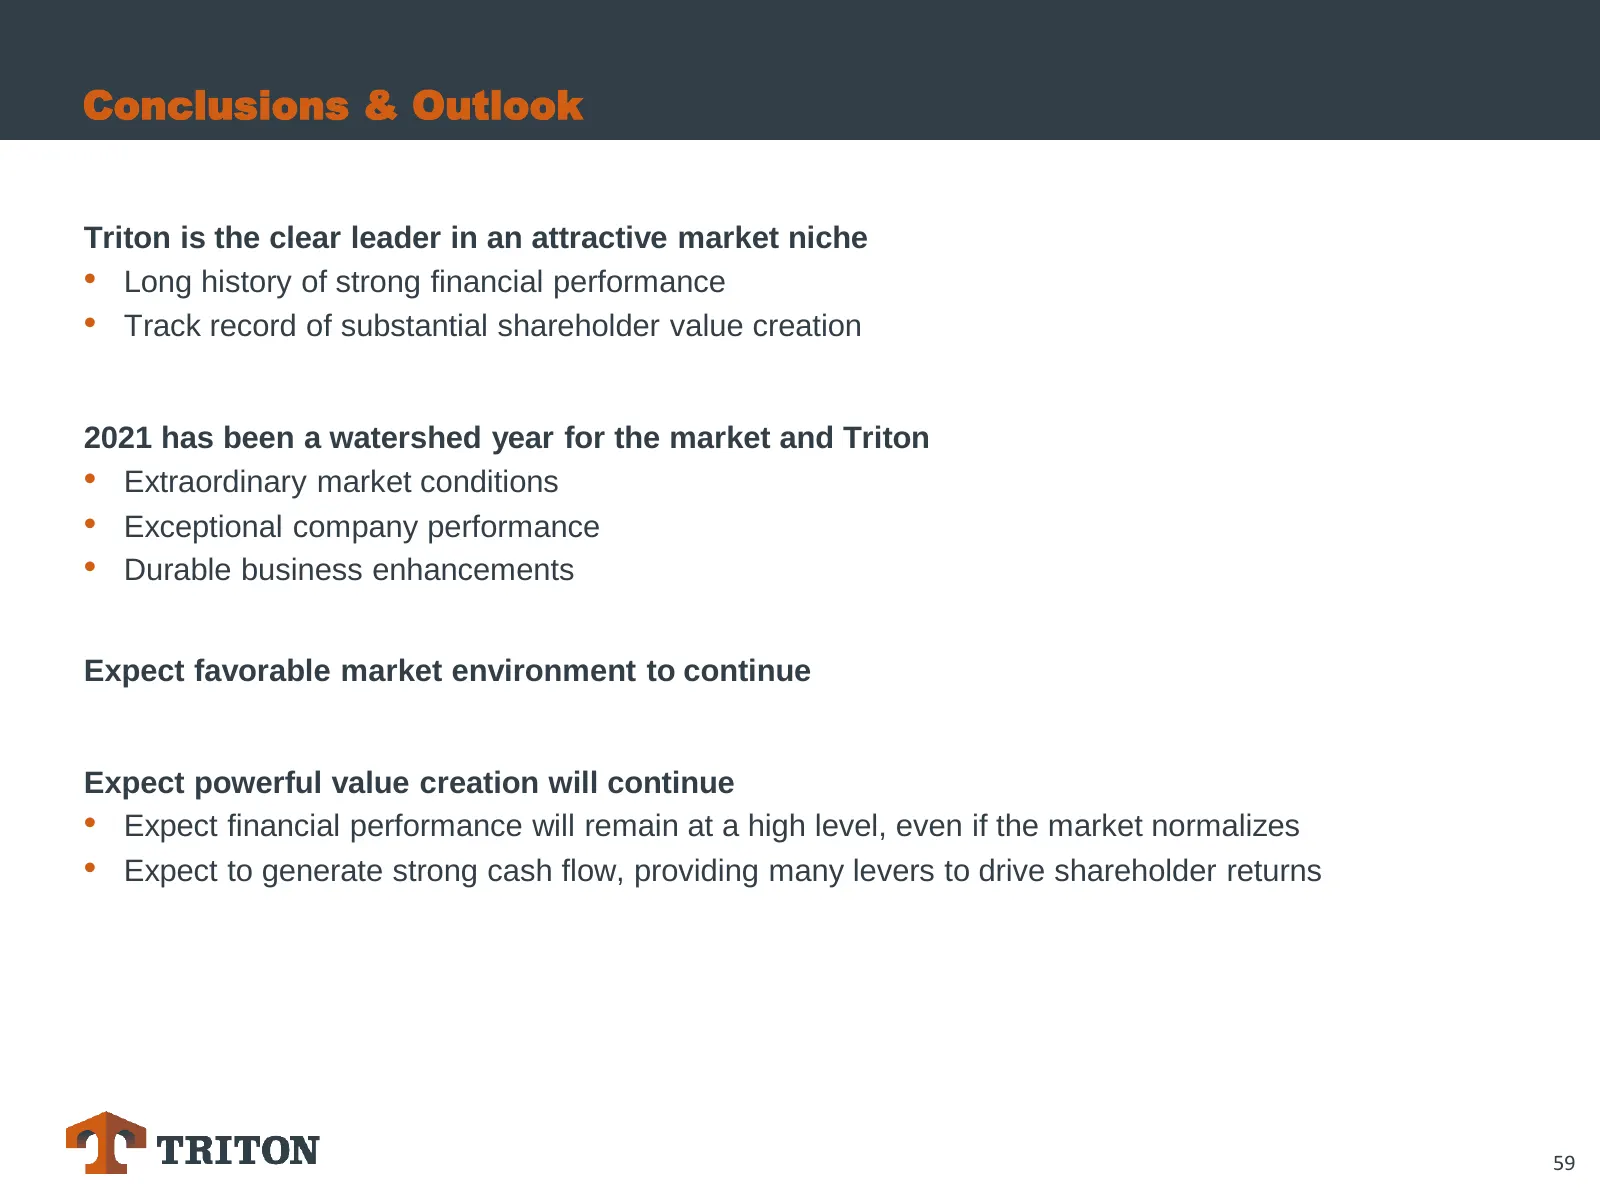
Conclusions & Outlook Triton is the clear leader in an attractive market niche • Long history of strong financial performance • Track record of substantial shareholder value creation 2021 has been a watershed year for the market and Triton • Extraordinary market conditions • Exceptional company perf
Slide 60: At MA z
At MA 3 z TRITON a [AAA EL LP wma ALLL A AAA) DALY ma) aT aT a Toi ALLL HET UT mr ii = LL | | i | | “4 | | Ly i | i i | Lt FLA (ep ia B oD Tae FFP | a ' ee ' * =r 5 poss L] The : = 3 - ee
Slide 61: Appendix
Tt TRITON Appendix 61
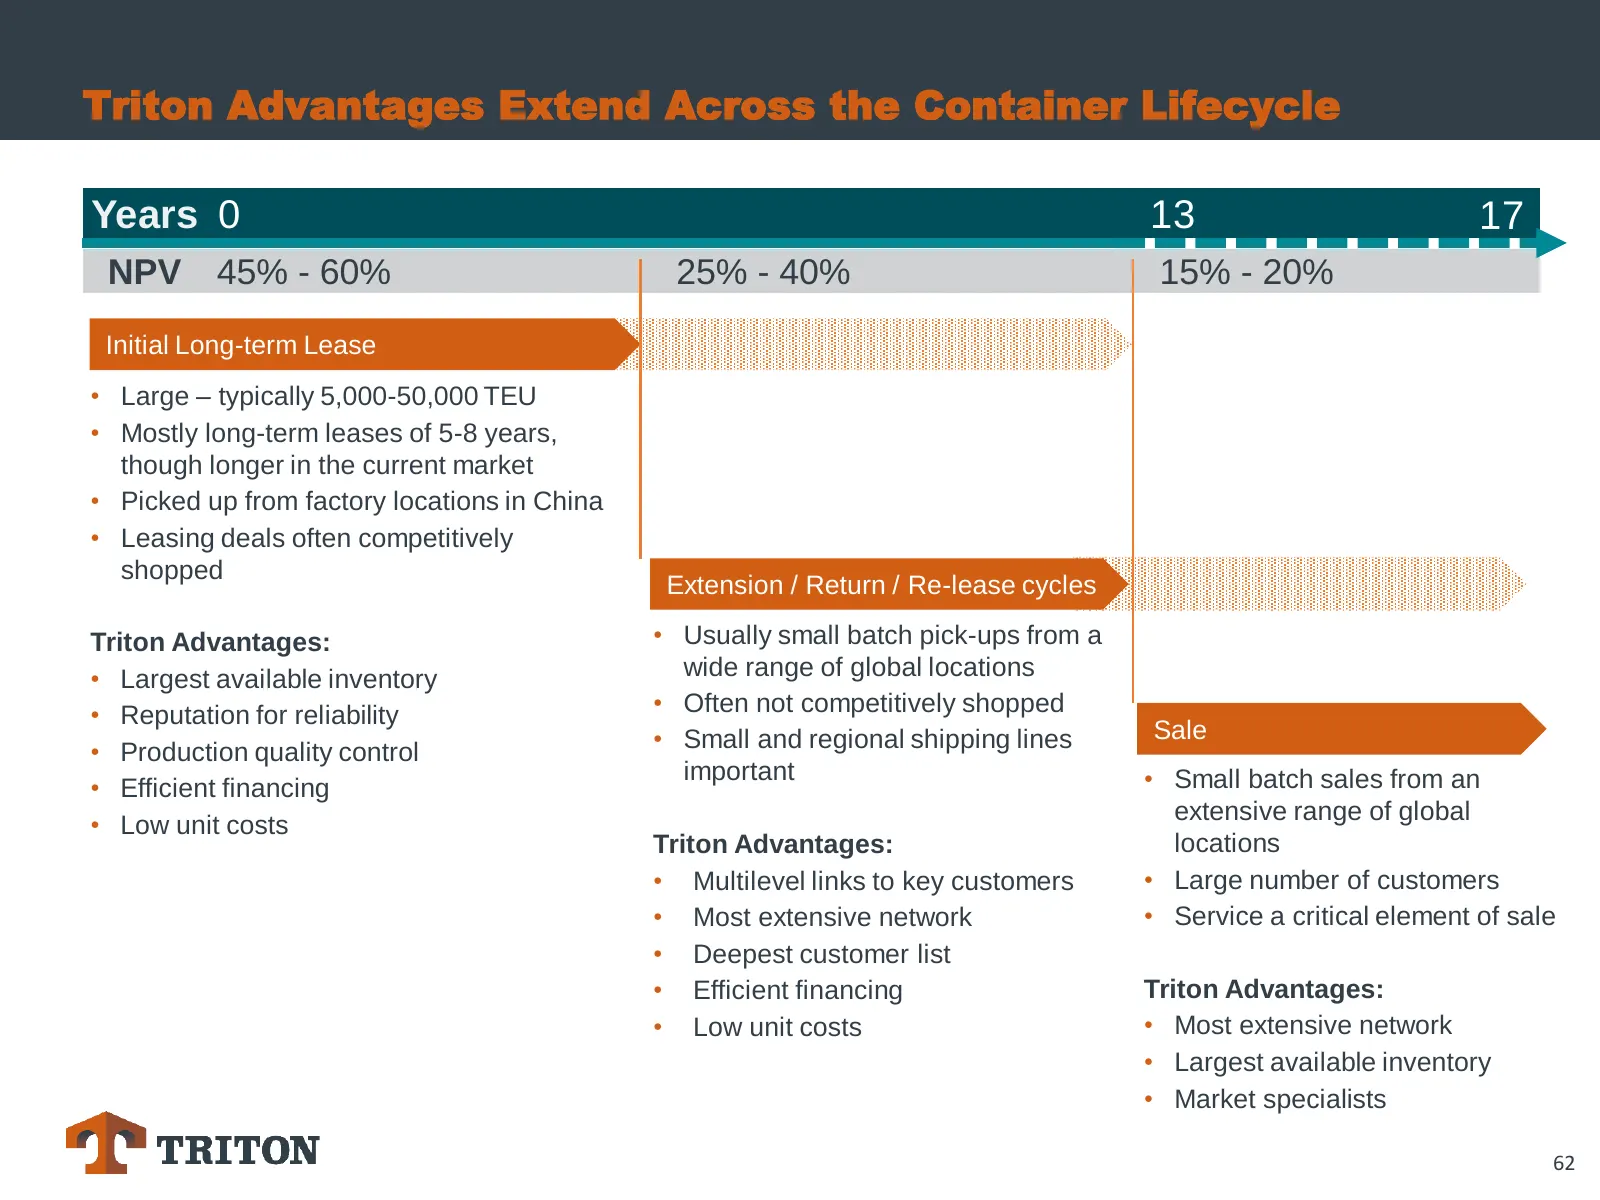
Slide 62: Triton Advantages Extend Across the Container Lifecycle
Triton Advantages Extend Across the Container Lifecycle Years 0 13 17 NPV 45% - 60% 25% - 40% 15% - 20% Initial Long-term Lease • Large – typically 5,000-50,000 TEU • Mostly long-term leases of 5-8 years, though longer in the current market • Picked up from factory locations in China • Leasing deals
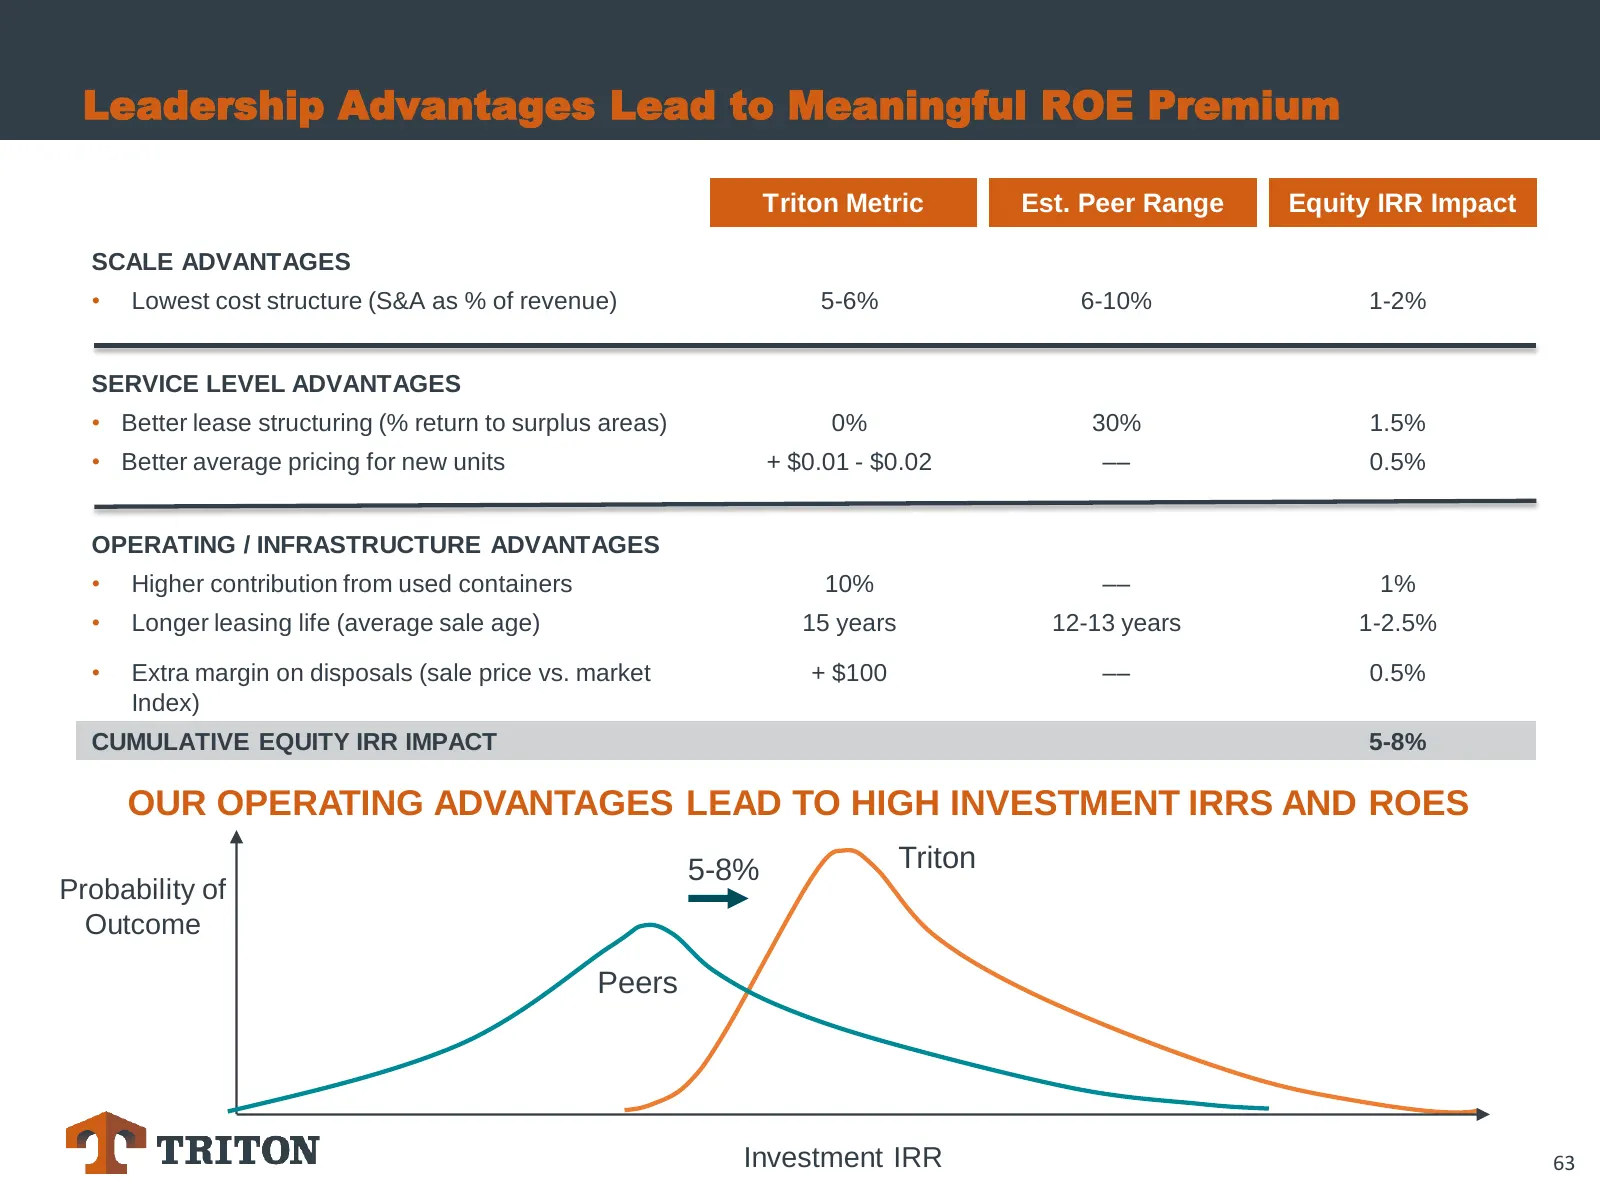
Slide 63: Leadership Advantages Lead to Meaningful ROE Premium
Leadership Advantages Lead to Meaningful ROE Premium Triton Metric Est. Peer Range Equity IRR Impact SCALE ADVANTAGES • Lowest cost structure (S&A as % of revenue) 5-6% 6-10% 1-2% SERVICE LEVEL ADVANTAGES • Better lease structuring (% return to surplus areas) 0% 30% 1.5% • Better average pricing for
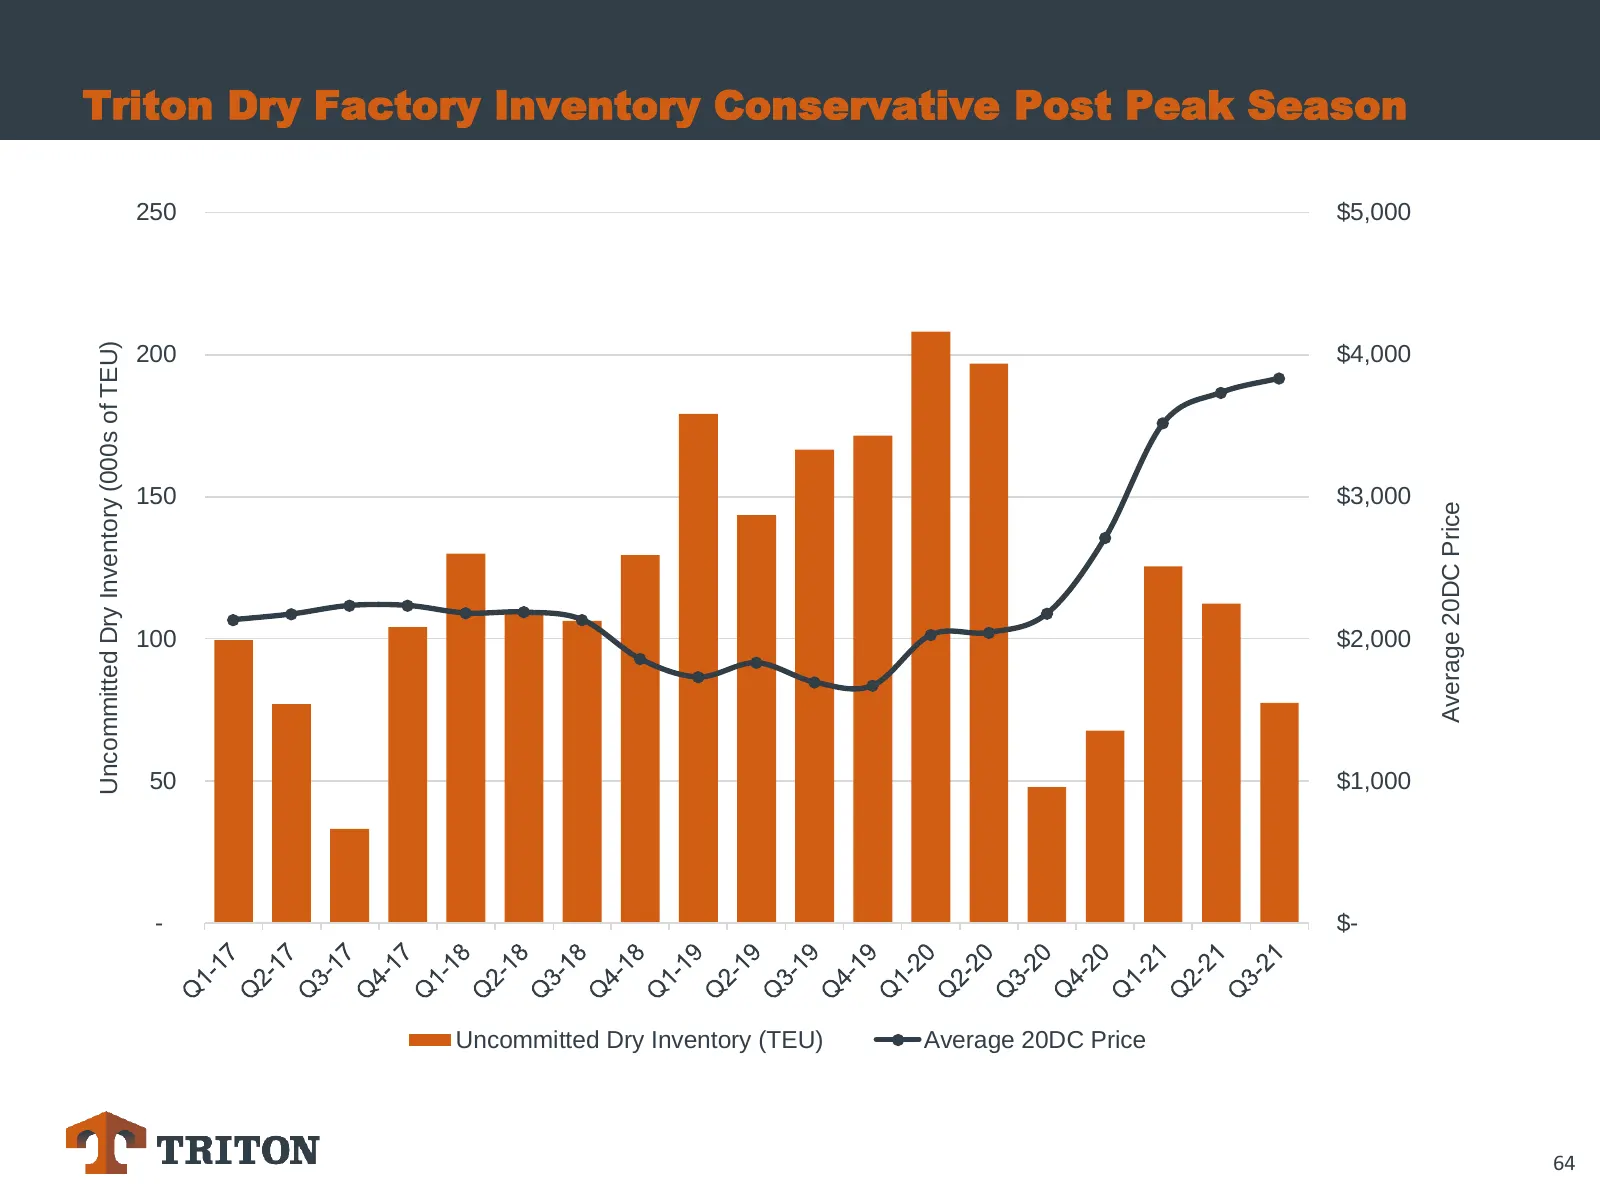
Slide 64: Triton Dry Factory Inventory Conservative Post Peak Season
Triton Dry Factory Inventory Conservative Post Peak Season 250 $5,000 Uncommitted Dry Inventory (000s of TEU) 200 $4,000 150 $3,000 Average 20DC Price 100 $2,000 50 $1,000 - $- Uncommitted Dry Inventory (TEU) Average 20DC Price 64
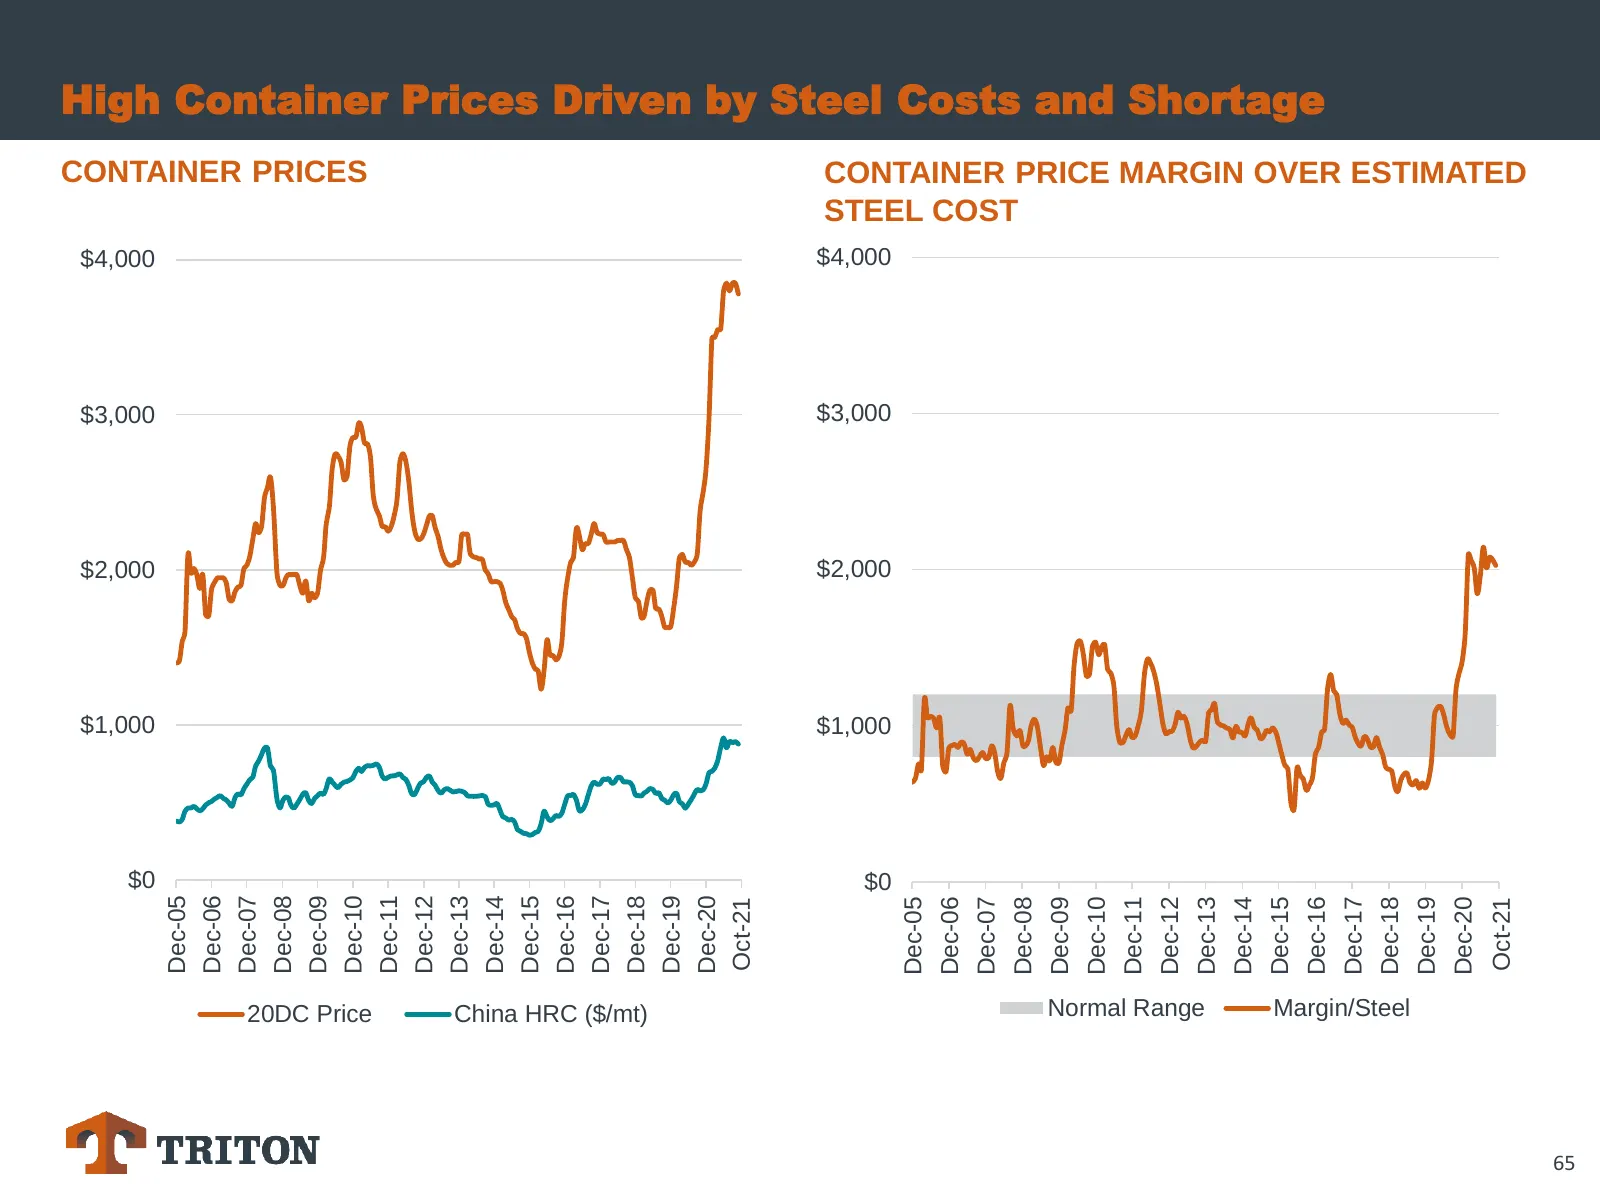
Slide 65: High Container Prices Driven by Steel Costs and Shortage
High Container Prices Driven by Steel Costs and Shortage CONTAINER PRICES CONTAINER PRICE MARGIN OVER ESTIMATED STEEL COST $4,000 $4,000 $3,000 $3,000 $2,000 $2,000 $1,000 $1,000 $0 $0 Dec-14 Dec-16 Dec-05 Dec-06 Dec-07 Dec-08 Dec-09 Dec-10 Dec-11 Dec-12 Dec-13 Dec-15 Dec-17 Dec-18 Dec-19 Dec-20 Dec
Slide 66: Reconciliation of Non-GAAP Financial Information
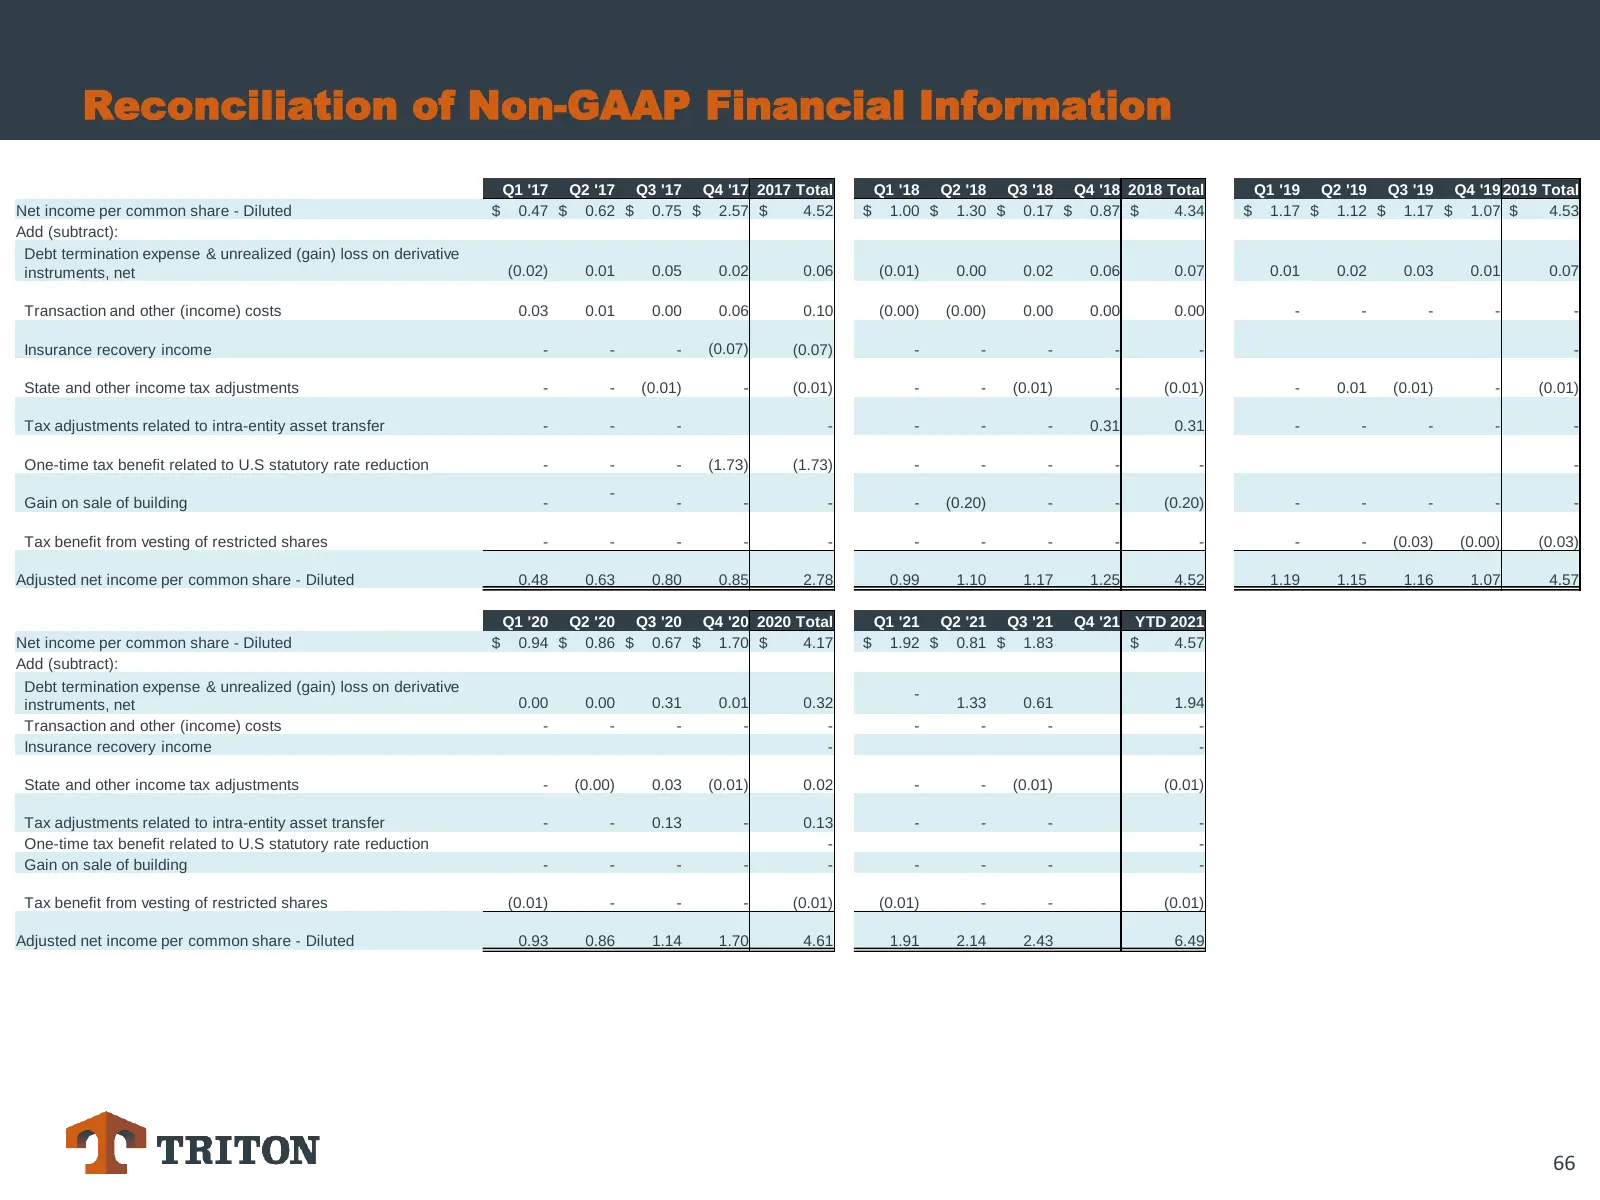
Reconciliation of Non-GAAP Financial Information Q1 '17 Q2 '17 Q3 '17 Q4 '17 2017 Total Q1 '18 Q2 '18 Q3 '18 Q4 '18 2018 Total Q1 '19 Q2 '19 Q3 '19 Q4 '19 2019 Total Net income per common share - Diluted $ 0.47 $ 0.62 $ 0.75 $ 2.57 $ 4.52 $ 1.00 $ 1.30 $ 0.17 $ 0.87 $ 4.34 $ 1.17 $ 1.12 $ 1.17 $ 1.0
Slide 67: Reconciliation of Non-GAAP Financial Information
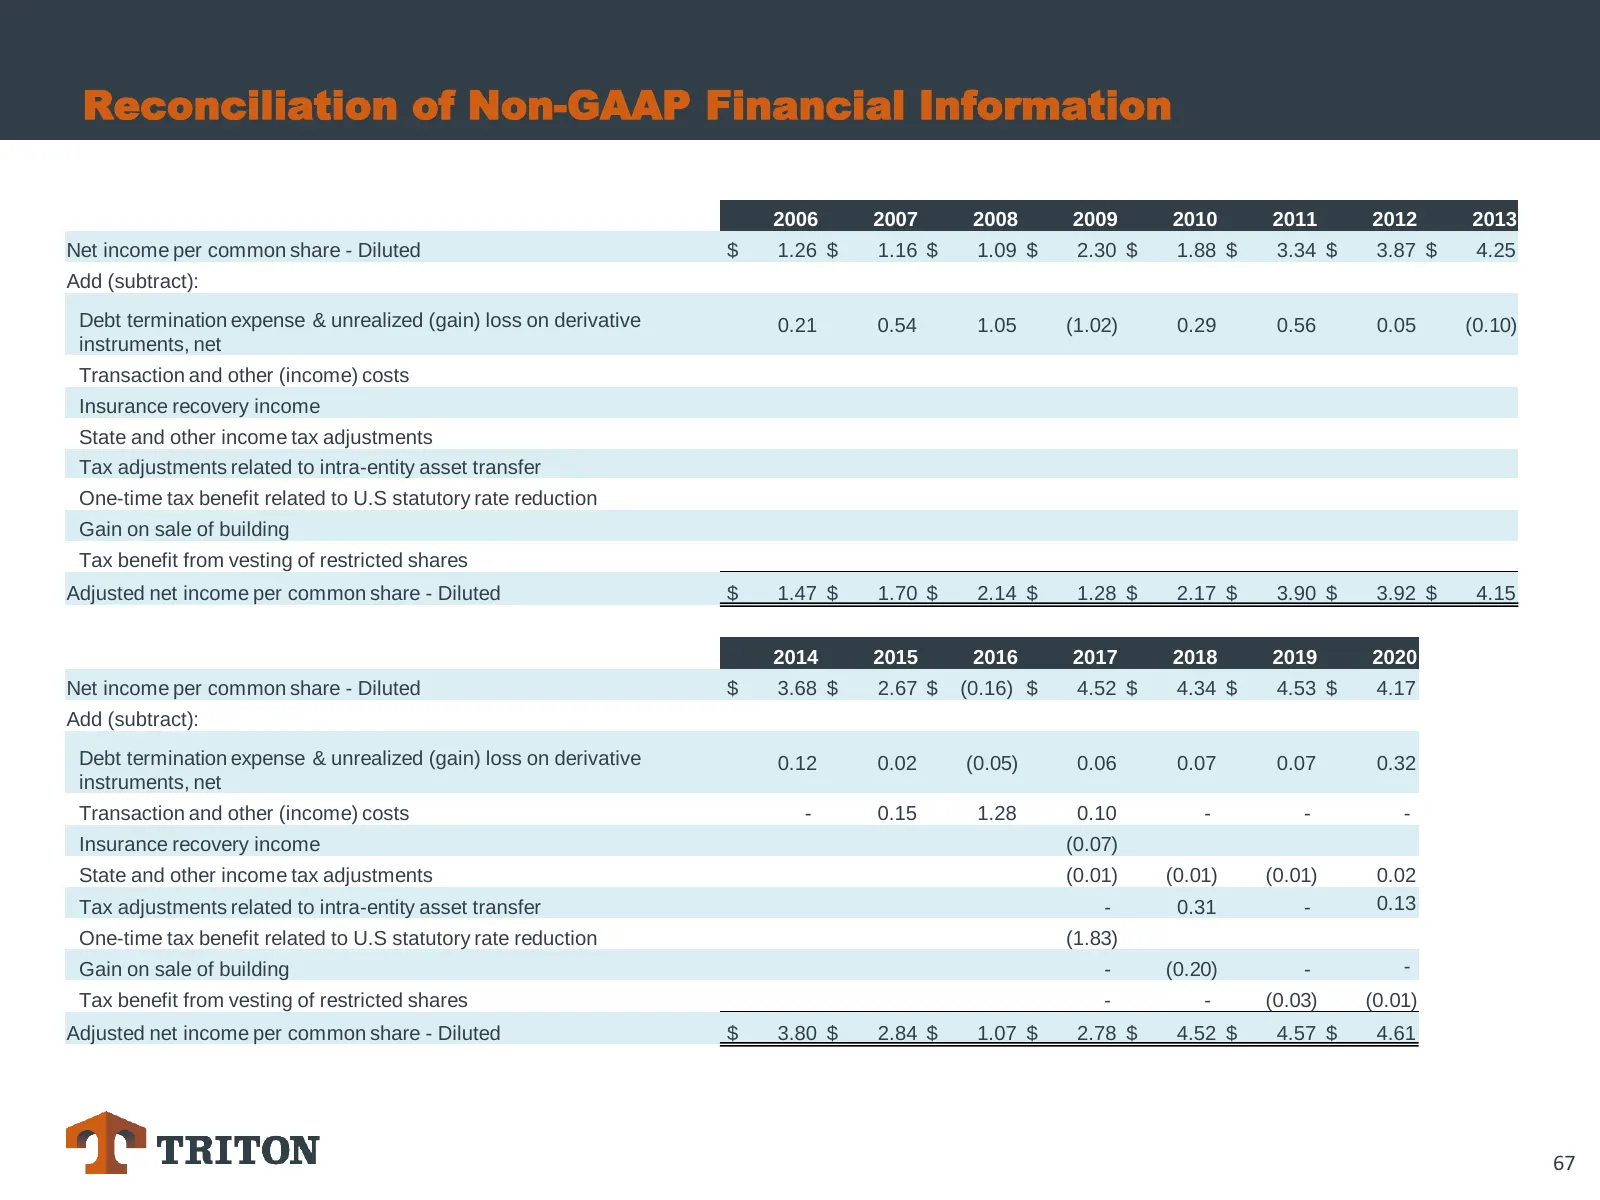
Reconciliation of Non-GAAP Financial Information 2006 2007 2008 2009 2010 2011 2012 2013 Net income per common share - Diluted $ 1.26 $ 1.16 $ 1.09 $ 2.30 $ 1.88 $ 3.34 $ 3.87 $ 4.25 Add (subtract): Debt termination expense & unrealized (gain) loss on derivative 0.21 0.54 1.05 (1.02) 0.29 0.56 0.05
Slide 68: Reconciliation of Non-GAAP Financial Information
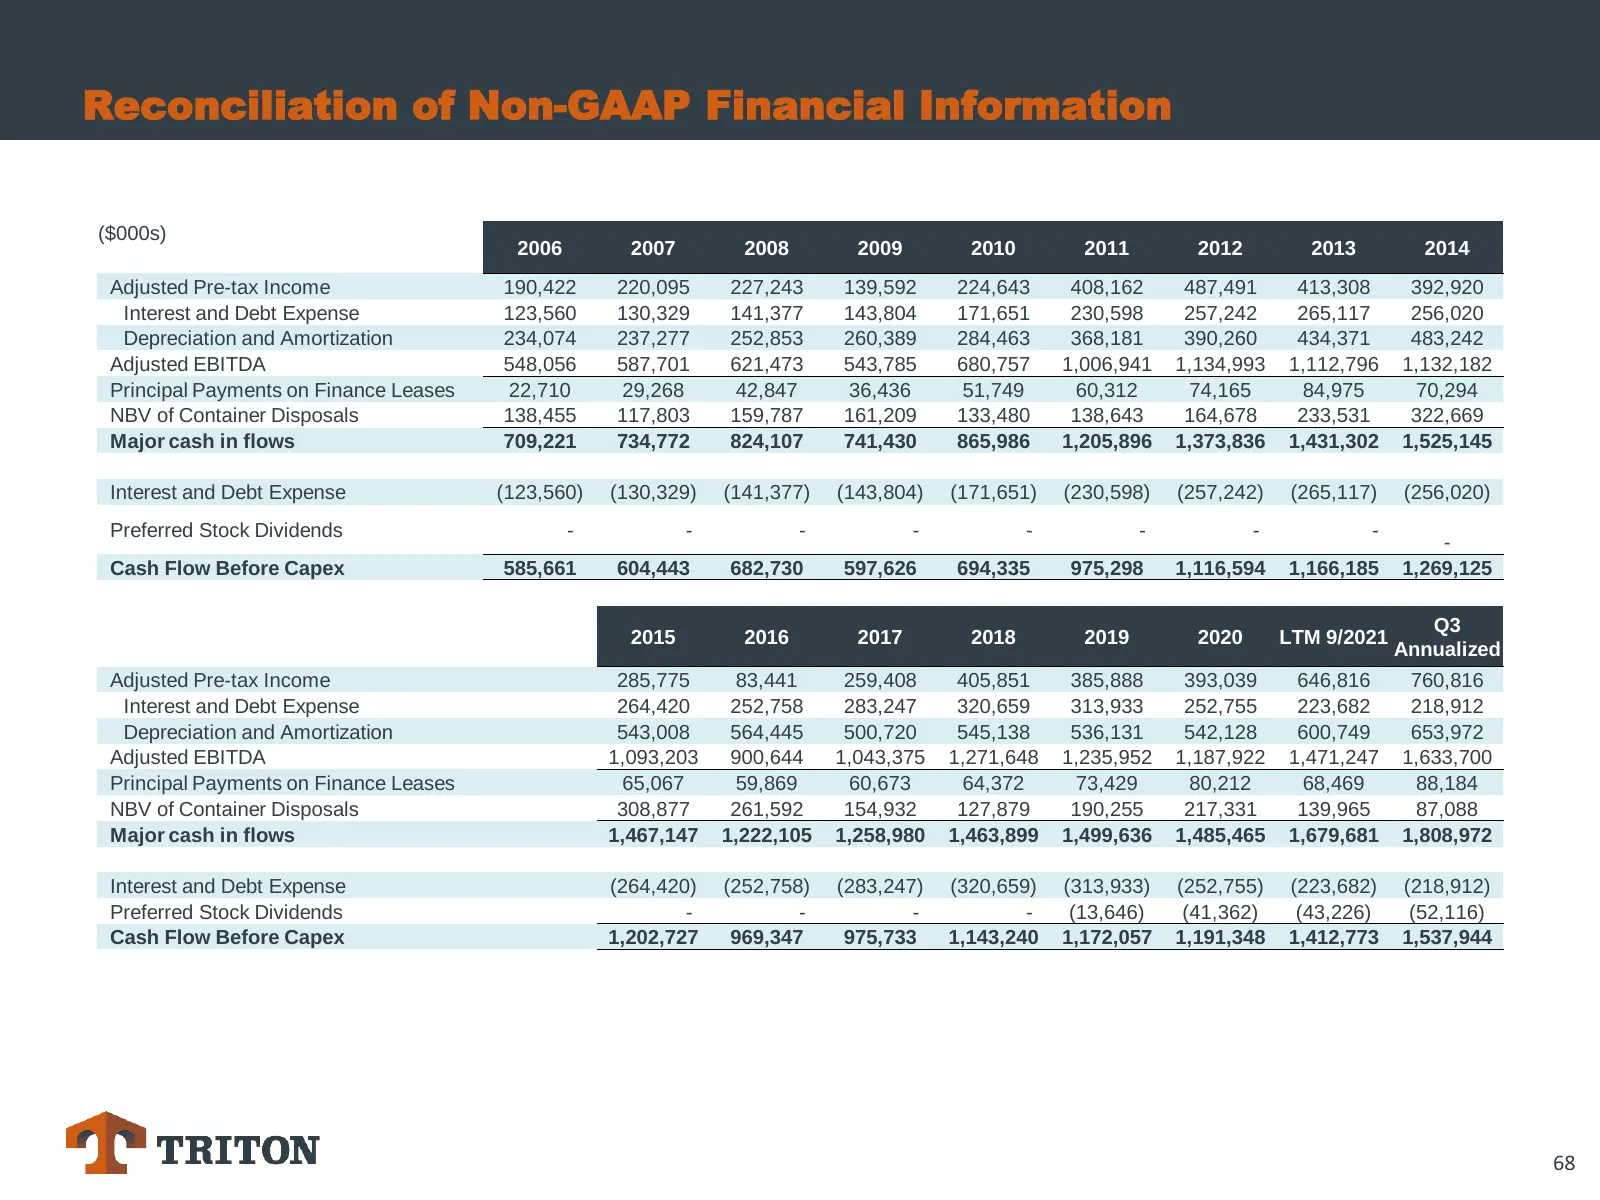
Reconciliation of Non-GAAP Financial Information ($000s) 2006 2007 2008 2009 2010 2011 2012 2013 2014 Adjusted Pre-tax Income 190,422 220,095 227,243 139,592 224,643 408,162 487,491 413,308 392,920 Interest and Debt Expense 123,560 130,329 141,377 143,804 171,651 230,598 257,242 265,117 256,020 Depr
Slide 69: Reconciliation of Non-GAAP Financial Information
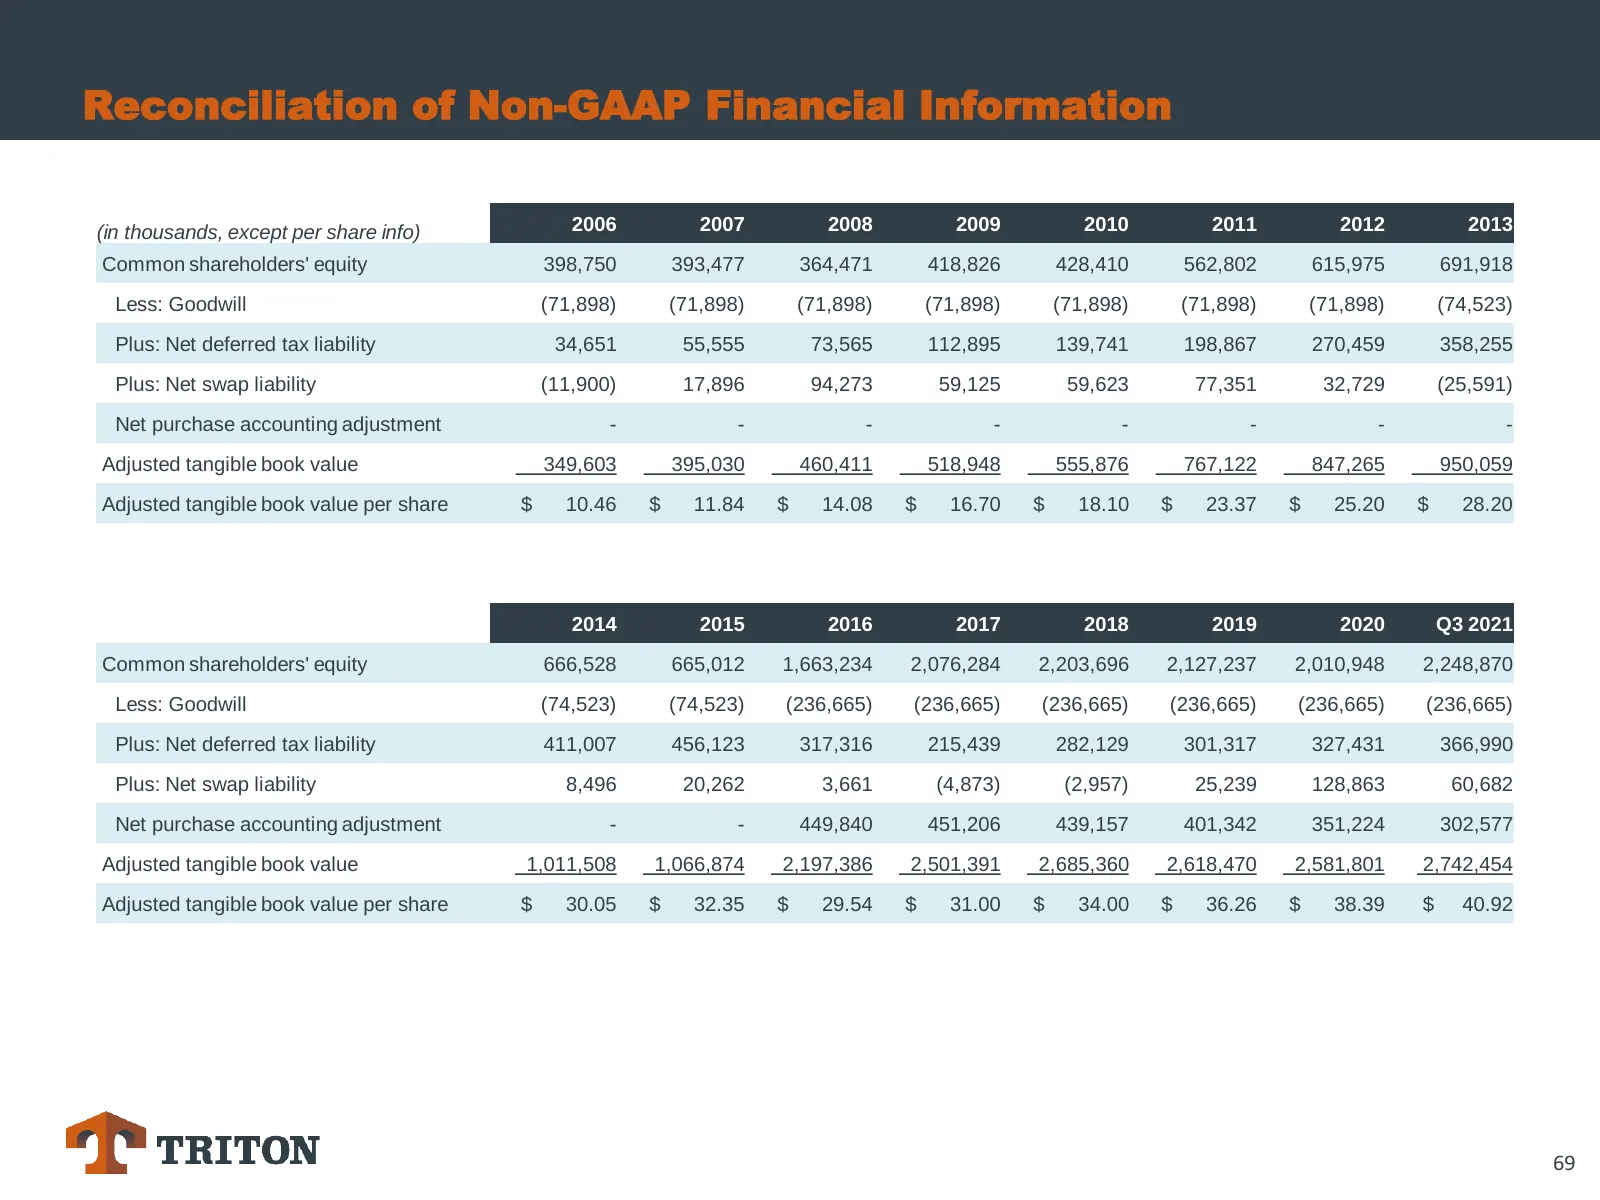
Reconciliation of Non-GAAP Financial Information (in thousands, except per share info) 2006 2007 2008 2009 2010 2011 2012 2013 Common shareholders' equity 398,750 393,477 364,471 418,826 428,410 562,802 615,975 691,918 Less: Goodwill (71,898) (71,898) (71,898) (71,898) (71,898) (71,898) (71,898) (74
Slide 70: Non-GAAP Financial Information
Non-GAAP Financial Information We use the terms "Adjusted net income," “Adjusted EPS,” “Return on equity,” “cash flow before capex” and other non-GAAP financial measures throughout this presentation. These items are not presented in accordance with U.S. GAAP and should not be considered as alternati
Source: Internet Archive copy of tritoninternational.com
More decks from Triton International Ltd.
 Q3 2026 Earnings Presentation14 slides · November 2026
 Q2 2026 Earnings Presentation14 slides · August 2026
 Q1 2026 Earnings Presentation14 slides · May 2026
 Q4 2025 Earnings Presentation12 slides · February 2026
 Investor Presentation (January 2026)12 slides · January 2026
 Q2 2025 Earnings Presentation13 slides · September 2025