ASB Bancorp — The Community Bank Investor Conference 2014
35 slides from ASB Bancorp's conference presentation, Mar 5, 2014
Slide 1: The Community Bank Investor Conference
Exhibit 99.1 The Community Bank Investor Conference New York, New York March 6, 2014 NASDAQ | ASBB
Slide 2: Forward-Looking Statements
Forward-Looking Statements This presentation, as well as other written communications made from time to time by the Company and its subsidiaries and oral communications made from time to time by authorized officers of the Company, may contain statements relating to the future results of the Company
Slide 3: Overview
Overview * Introduction ¢ Profile and Executive Management * Market Area and Geographic Footprint ¢ Financial Performance * Stock Information * Selected Balance Sheet Data * Selected Income Statement Data * Competitive Environment * Deposit Market Share * Objectives ° Near Term * Longer Term BA NASD
Slide 4: Introduction
BA NASDAQ | ASBB Introduction
Slide 5: Profile
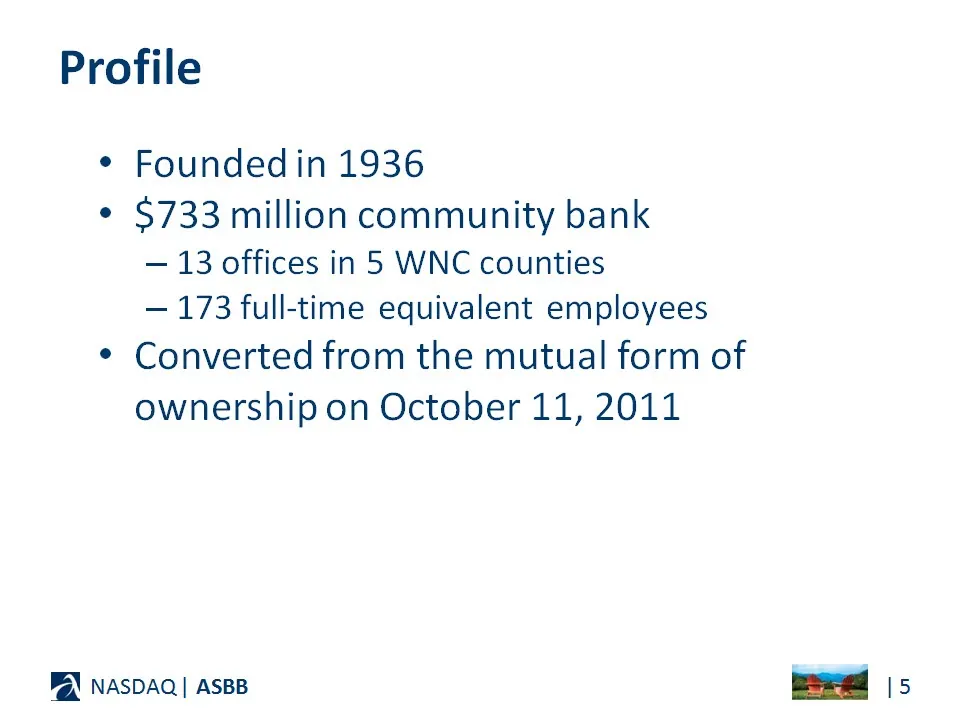
Profile ¢ Founded in 1936 * $733 million community bank — 13 offices in 5 WNC counties — 173 full-time equivalent employees * Converted from the mutual form of ownership on October 11, 2011 BA NASDAQ | ASBB

Slide 6: Selected as one of the Best Places to Work
Selected as one of the | 013 an BRST Re NORTH CAROLINA i BUSINESS NORTH CAROLINA a a (February 2013) ” © BAX NASDAQ| ASBB eed
Slide 7: Executive Management
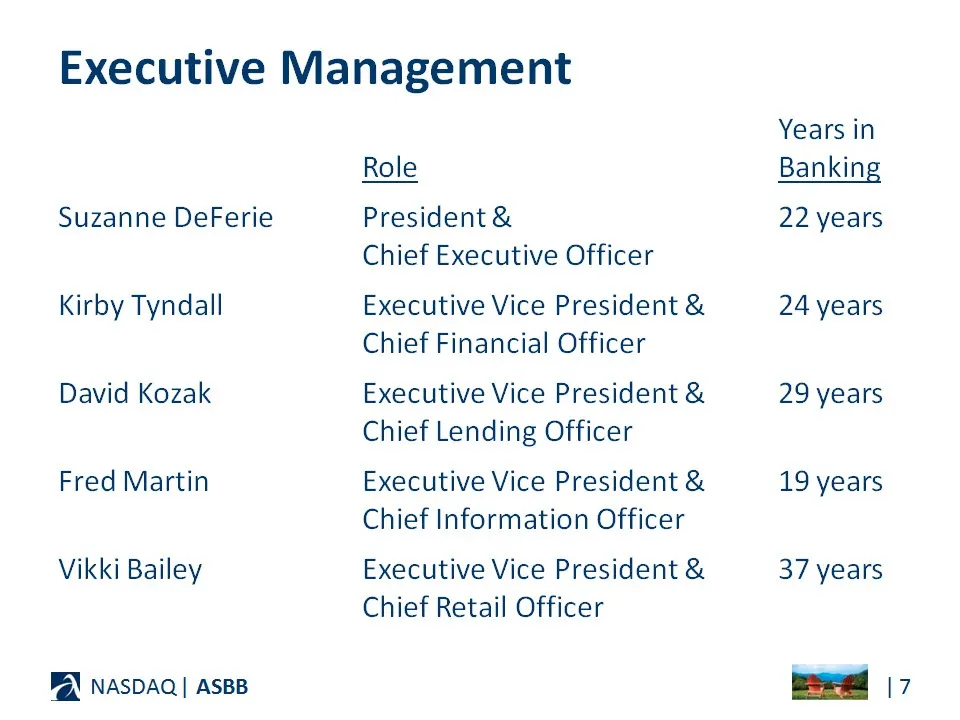
Executive Management Years in Role Banking Suzanne DeFerie President & 22 years Chief Executive Officer Kirby Tyndall Executive Vice President & 24 years Chief Financial Officer David Kozak Executive Vice President & 29 years Chief Lending Officer Fred Martin Executive Vice President & 19 years Chie
Slide 8: Attractive Market Area
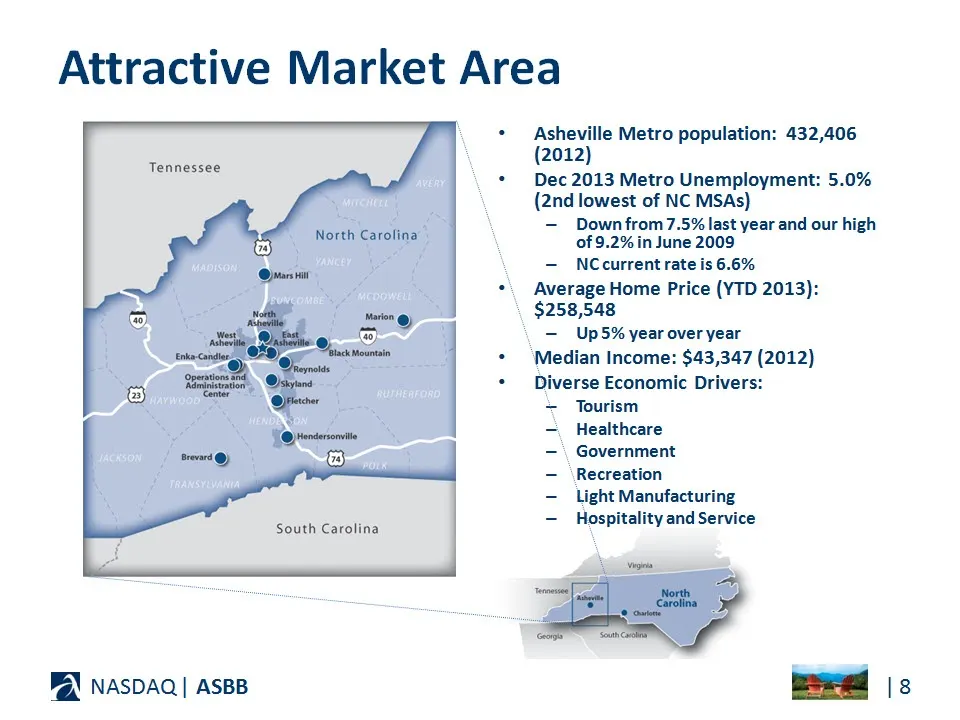
Attractive Market Area Tennessee BA NASDAQ | ASBB North Carolina» South Carolina Asheville Metro population: 432,406 (2012) Dec 2013 Metro Unemployment: 5.0% (2nd lowest of NC MSAs) — Down from 7.5% last year and our high of 9.2% in June 2009 — NCcurrent rate is 6.6% Average Home Price (YTD 2013): $
Slide 9: Financial Performance
Financial Performance BA NASDAQ | ASBB
Slide 10: Stock Information
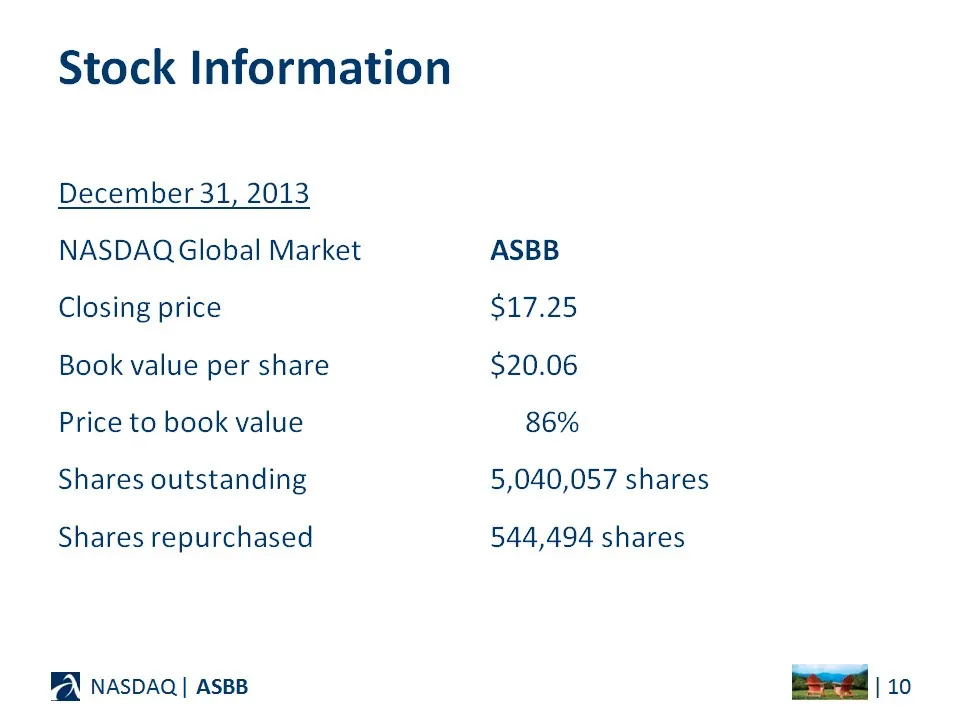
Stock Information December 31, 2013 NASDAQ Global Market ASBB Closing price S17:25 Book value per share $20.06 Price to book value 86% Shares outstanding 5,040,057 shares Shares repurchased 544,494 shares BA NASDAQ | ASBB Bead | 10
Slide 11: Change in Stock Price
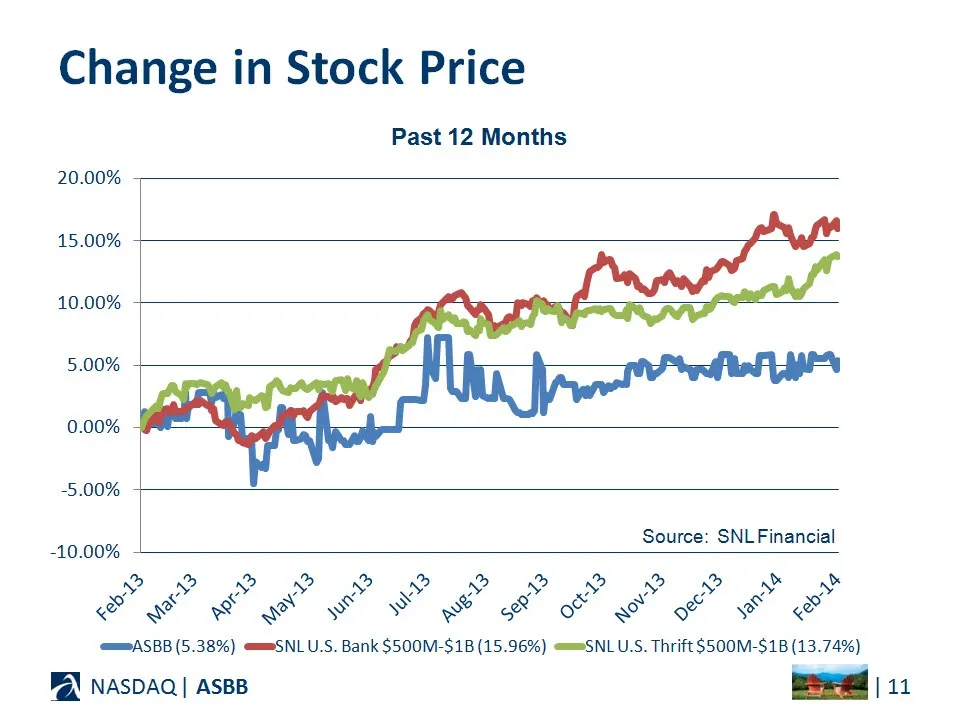
Change in Stock Price Past 12 Months 20.00% 15.00% 10.00% 5.00% 0.00% Source: SNL Financial a x & we ¥ we se yw So ==ASBB (5.38%) @[email protected]. Bank SSOOM-$1B (15.96%) @==SNL U.S. Thrift $SOOM-S1B (13.74%) BAX NasDAQ| ASBB eeu
Slide 12: Balance Sheet — Assets
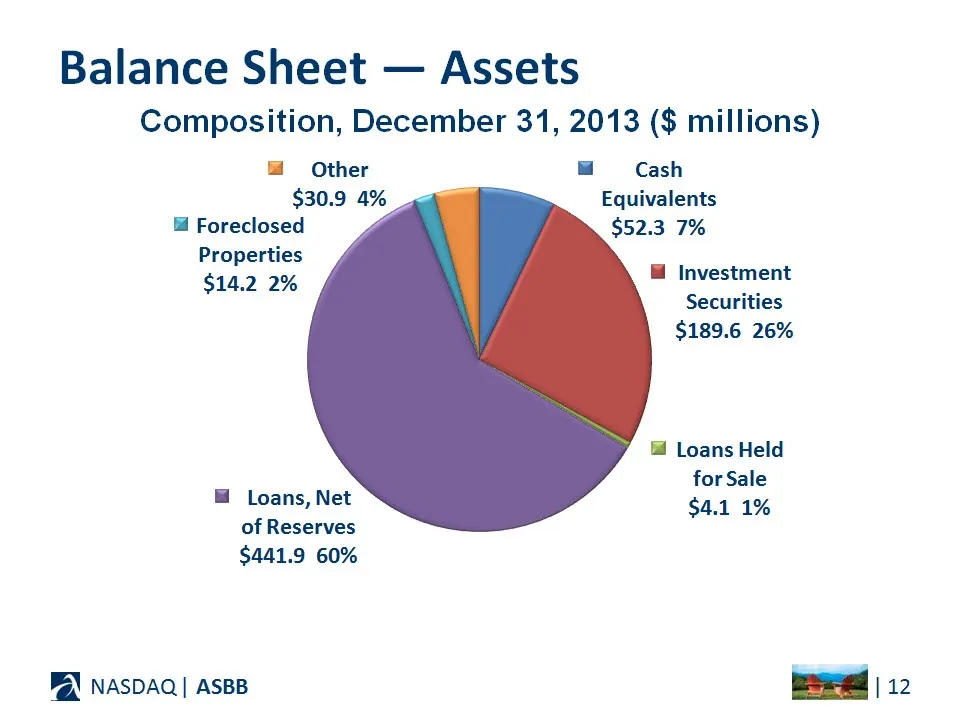
Balance Sheet — Assets Composition, December 31, 2013 ($ millions) @ Other a Cash $30.9 4% Equivalents '@ Foreclosed $52.3 7% Properties . $14.2 2% Investment Securities $189.6 26% '@ Loans Held forSale @ Loans, Net $4.1 1% of Reserves $441.9 60% BA NASDAQ | ASBB eed | 12
Slide 13: Balance Sheet — Liabilities & Equity
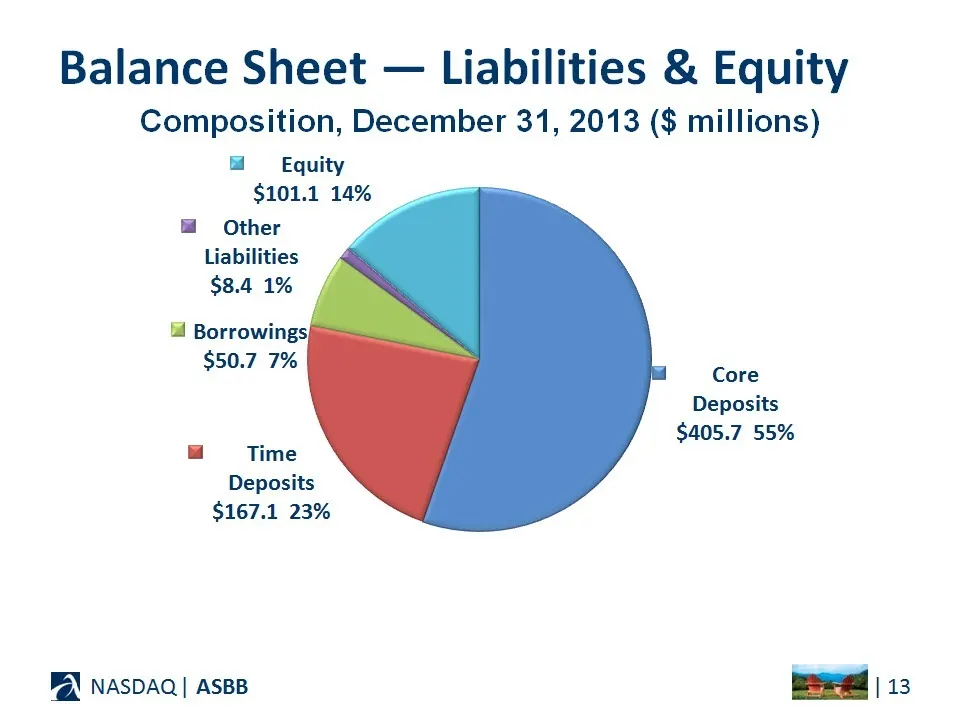
Balance Sheet — Liabilities & Equity Composition, December 31, 2013 ($ millions) @ = Equity $101.1 14% @ Other Liabilities $8.4 1% '§ Borrowings $50.7 7% Gace Deposits $405.7 55% a Time Deposits $167.1 23% BAX NaASDAQ| ASBB eee 1s
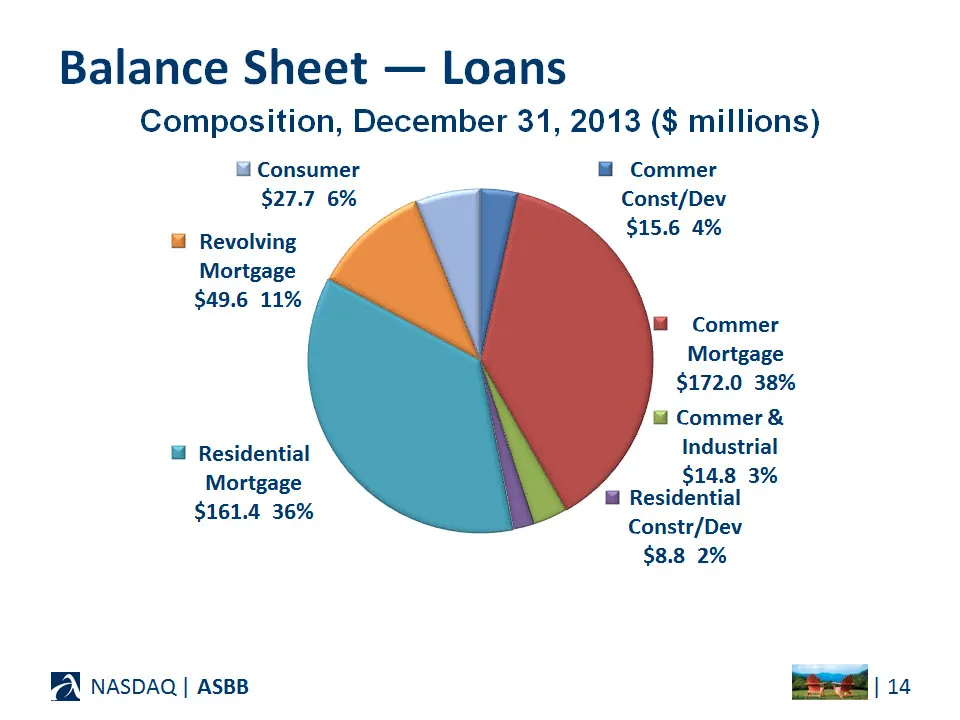
Slide 14: Balance Sheet — Loans
Balance Sheet — Loans Composition, December 31, 2013 ($ millions) lf Consumer @ Commer $27.7 6% Const/Dev $15.6 4% @ Revolving Mortgage $49.6 11% = ~=Commer Mortgage $172.0 38% & Commer & Industrial $14.8 3% @ Residential Constr/Dev $8.8 2% @ Residential Mortgage $161.4 36% FAX NasDAQ | ASBB Ie
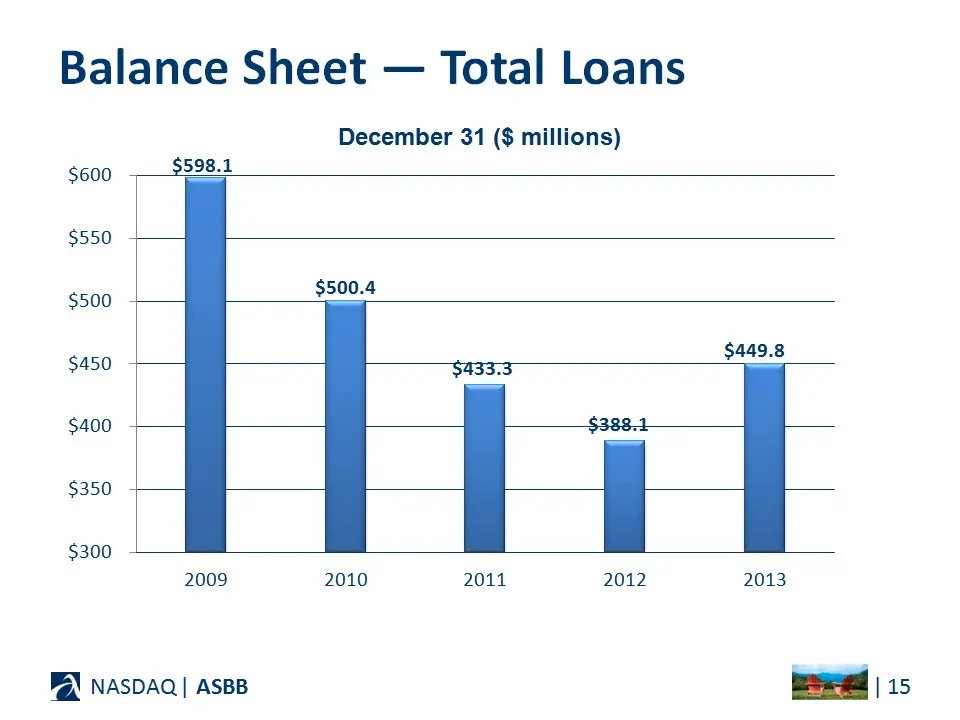
Slide 15: Balance Sheet — Total Loans
Balance Sheet — Total Loans December 31 ($ millions) $600 $598.1 $550 556 $500.4 $449.8 $450 $433.3 $400 $388.4 _ u $300 2009 2010 2011 2012 2013 BA NASDAQ | ASBB peed | 1s
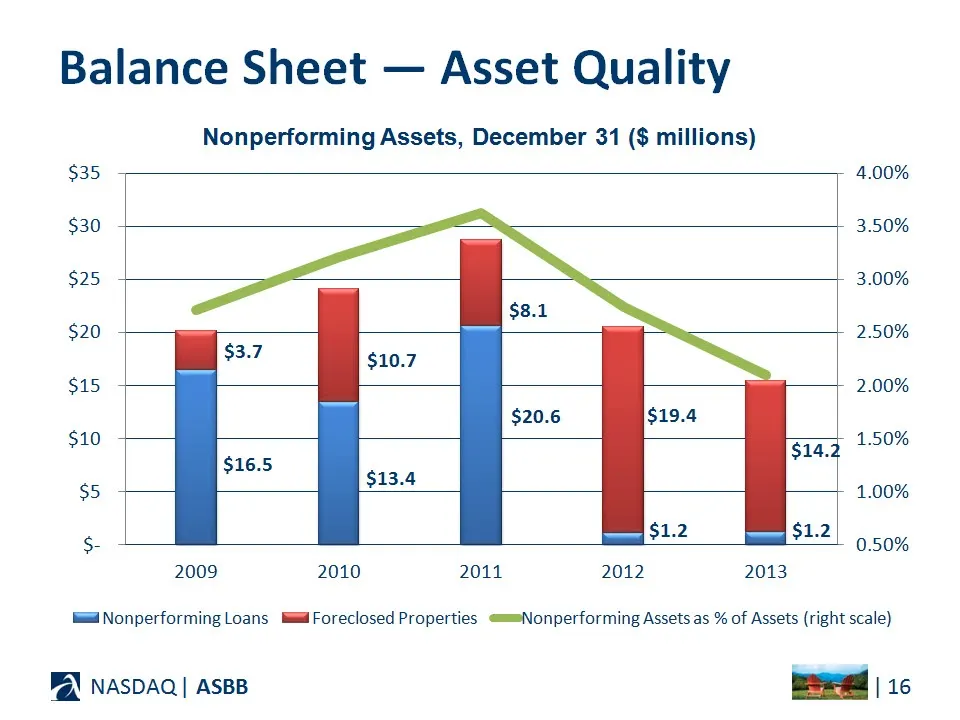
Slide 16: Balance Sheet — Asset Quality
Balance Sheet — Asset Quality Nonperforming Assets, December 31 ($ millions) $35 $30 $25 $8.1 $20.6 $14.2 $20 $3.7 $10.7 $15 $10 $5 $16.5 $13.4 S- $1.2 2009 2010 2011 2012 2013 4.00% 3.50% 3.00% 2.50% 2.00% 1.50% 1.00% 0.50% Si Nonperforming Loans tll Foreclosed Properties «==Nonperforming Assets as
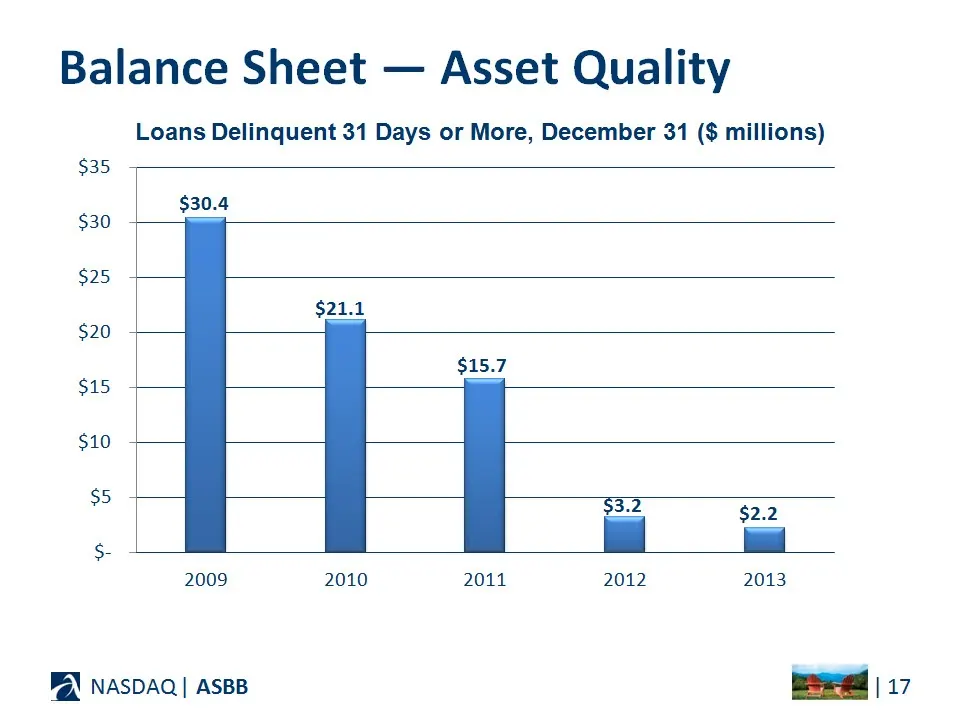
Slide 17: Balance Sheet — Asset Quality
Balance Sheet — Asset Quality Loans Delinquent 31 Days or More, December 31 ($ millions) $35 $30.4 $30 $25 $21.1 $20 $15.7 $15 $10 $5 $3.2 OE x jul jul 2009 2010 2011 2012 2013 BAX NasDAQ| ASBB =< Ad
Slide 18: Balance Sheet — Asset Quality
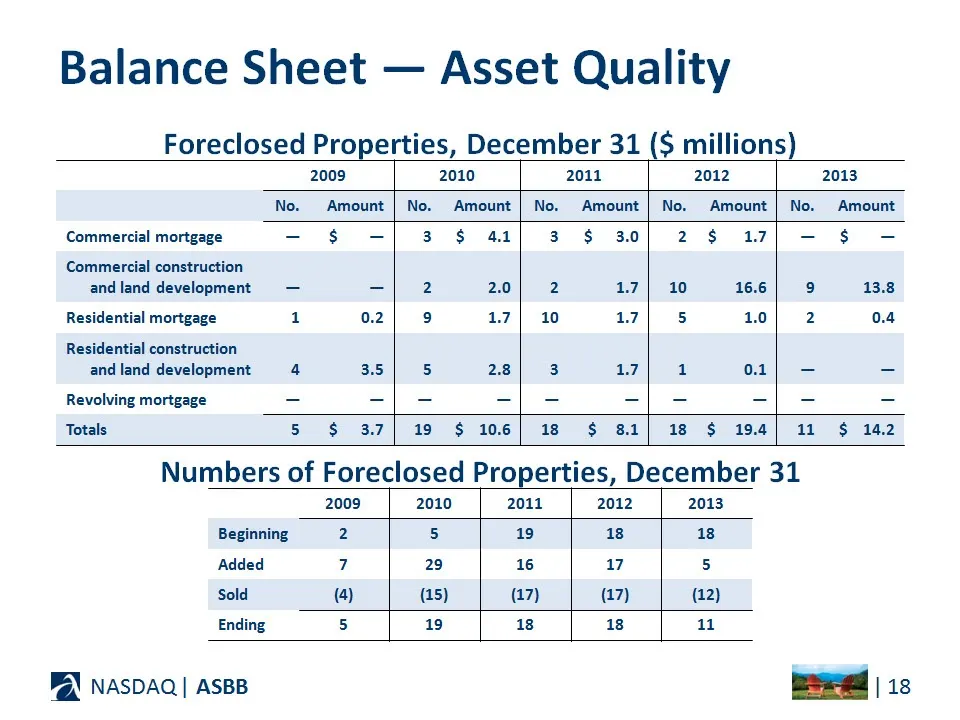
Balance Sheet — Asset Quality Foreclosed Properties, December 31 ($ millions) 2009 2010 2011 2012 2013 No. Amount | No. Amount | No. Amount | No. Amount | No. Amount Commercial mortgage - $ - 53 $ &f 3 $ 30 2$ a7] - $ = Commercial construction and land development = ce = 2.0 2 Res 10 16.6 9 13.8 Res
Slide 19: Balance Sheet — Deposits
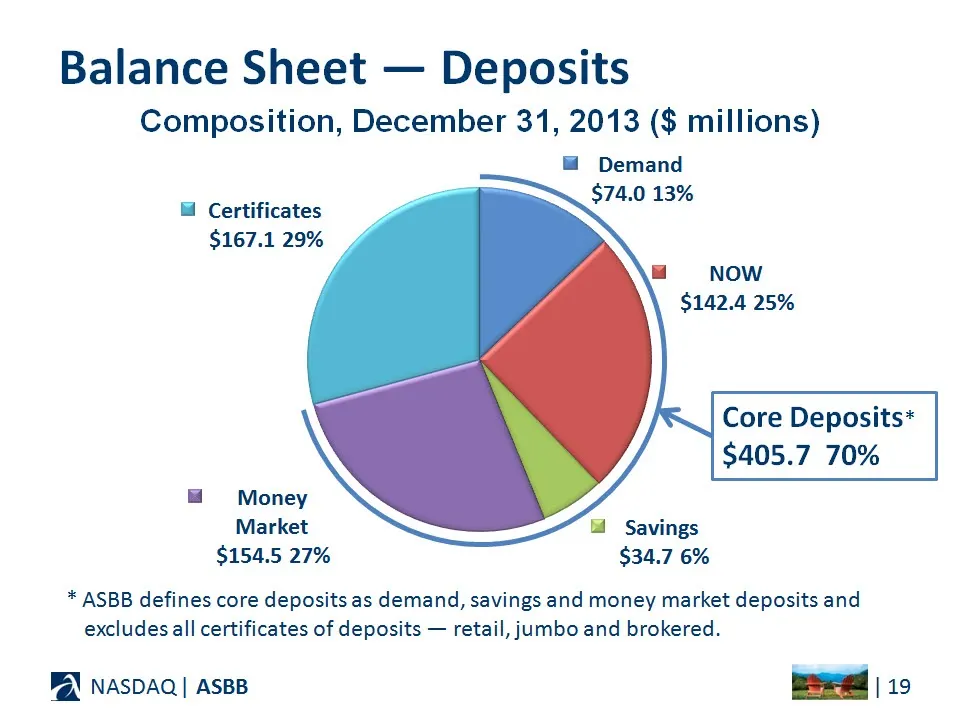
Balance Sheet — Deposits Composition, December 31, 2013 ($ millions) @ Demand $74.0 13% & Certificates $167.1 29% a NOW $142.4 25% Core Deposits* $405.7 70% ™& Money Market lf Savings $154.5 27% $34.7 6% * ASBB defines core deposits as demand, savings and money market deposits and excludes all certi
Slide 20: Balance Sheet—Core Deposits
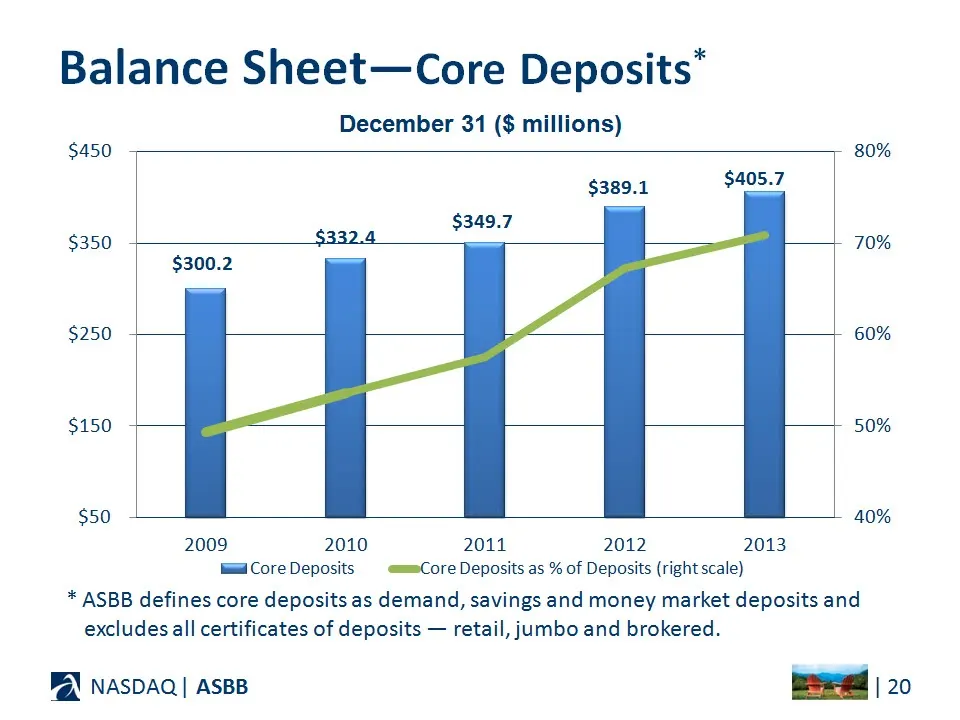
Balance Sheet—Core Deposits* December 31 ($ millions) $450 80% $389.1 $405.7 $350 70% $250 60% $150 50% $50 40% 2009 2010 2011 2012 2013 Ha CoreDeposits emCore Deposits as % of Deposits (right scale) * ASBB defines core deposits as demand, savings and money market deposits and excludes all certifica
Slide 21: Balance Sheet — Regulatory Capital
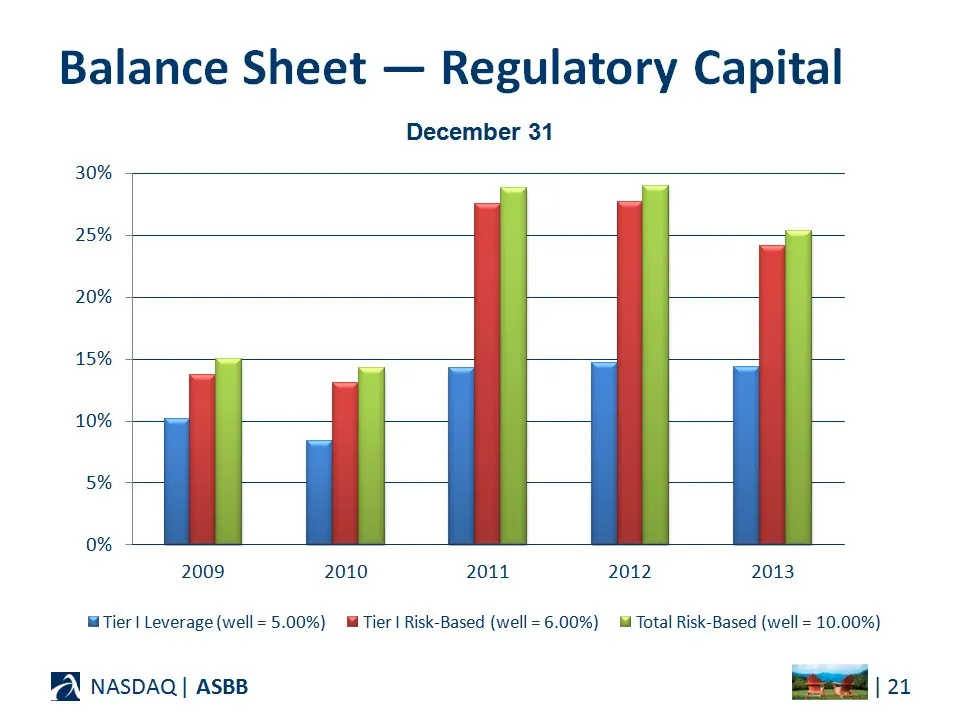
Balance Sheet — Regulatory Capital 30% 25% 20% 15% 10% 5% 0% December 31 2009 2010 2011 2012 2013 Tier | Leverage (well = 5.00%) i Tier | Risk-Based (well = 6.00%) ll Total Risk-Based (well = 10.00%) BAX NASDAQ| ASBB eed
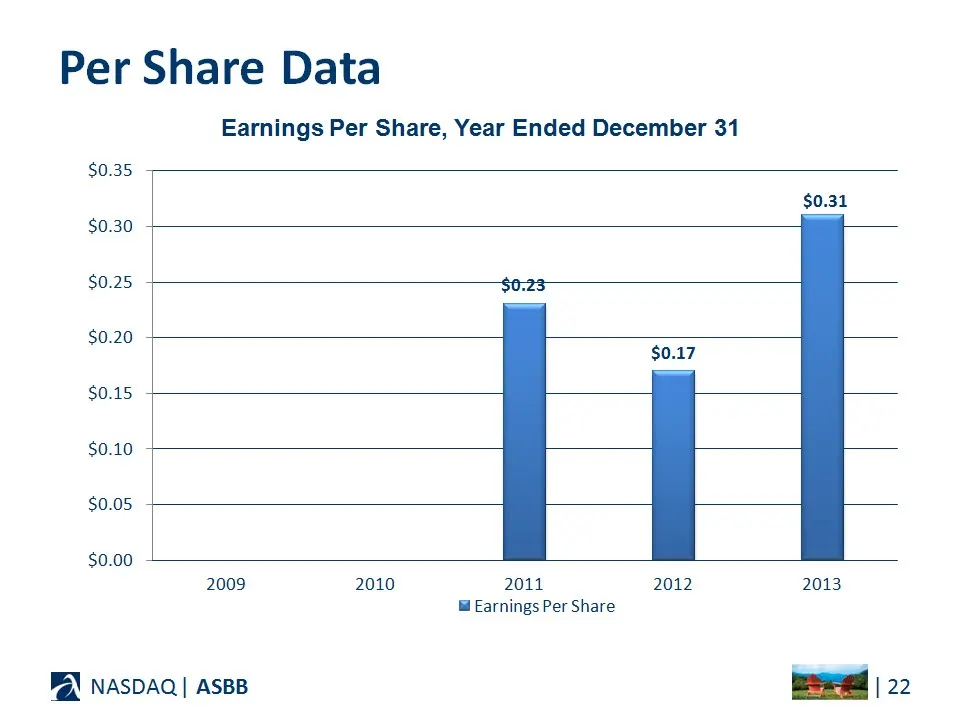
Slide 22: Per Share Data
Per Share Data Earnings Per Share, Year Ended December 31 $0.35 $0.31 $0.30 $0.25 $0.23 $0.20 $0.17 $0.15 $0.10 $0.05 $0.00 2009 2010 2011 2012 2013 Earnings Per Share BAX NasDAQ| ASBB pee 22
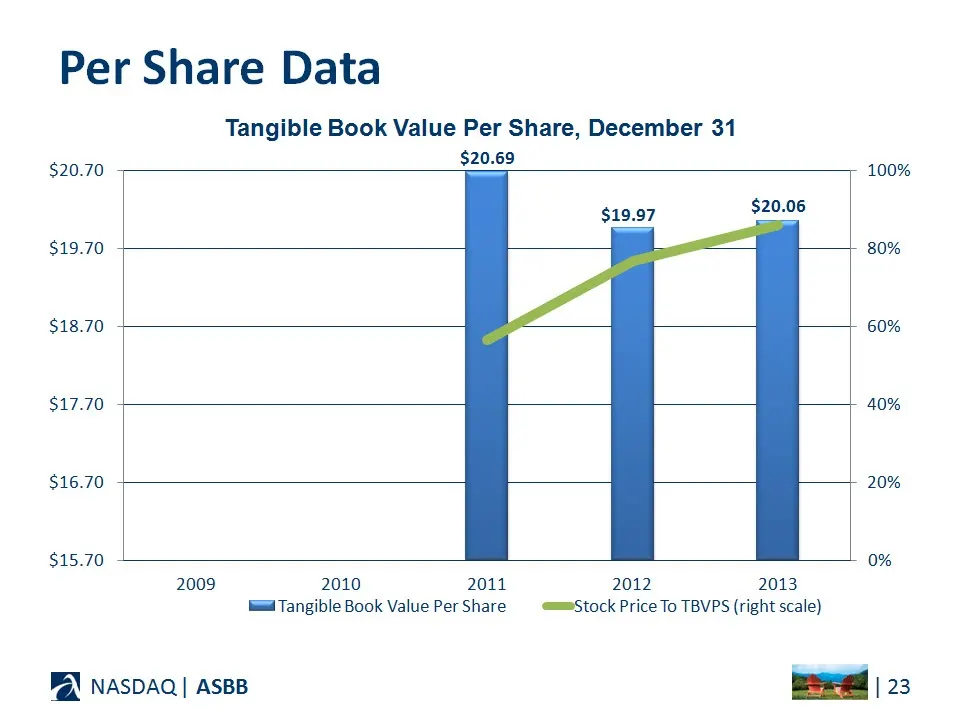
Slide 23: Per Share Data
Per Share Data Tangible Book Value Per Share, December 31 $20.70 $19.70 $18.70 $17.70 $16.70 $15.70 $20.69 $19.97 $20.06 2009 2010 2011 ta Tangible Book Value Per Share BA NASDAQ | ASBB 2012 2013 «==Stock Price To TBVPS (right scale) 100% 80% 60% 40% 20% 0% ead | 2
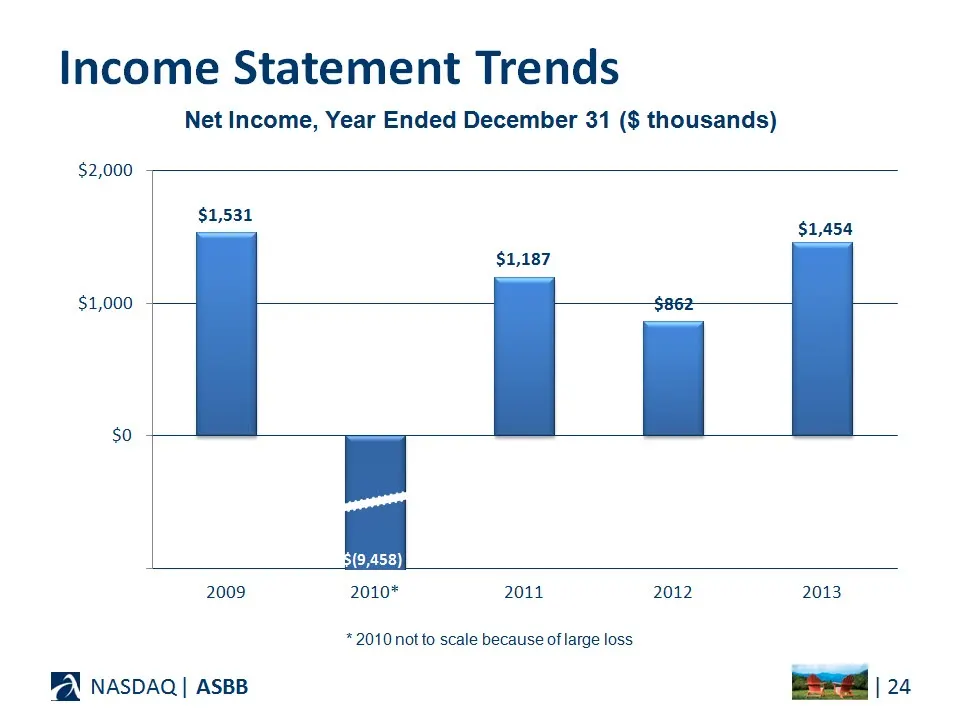
Slide 24: Income Statement Trends
Income Statement Trends $2,000 $1,000 $o Net Income, Year Ended December 31 ($ thousands) 1,531 s $1,454 ' ; ' 7 j 2009 2010* 2011 2012 2013 * 2010 not to scale because of large loss BAX NasDAQ| ASBB ed 2s
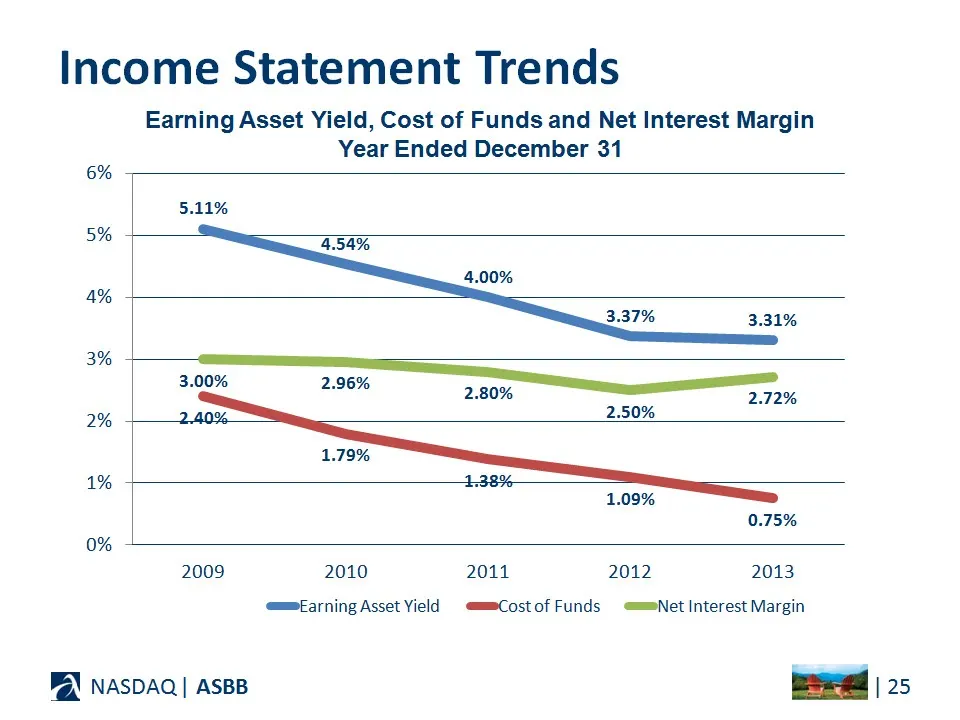
Slide 25: Income Statement Trends
Income Statement Trends Earning Asset Yield, Cost of Funds and Net Interest Margin Year Ended December 31 6% 5.11% 5% 4% 3% 2% 1% 0.75% 0% 2009 2010 2011 2012 2013 Earning Asset Yield mmCost of Funds «=mNet Interest Margin BAX NasDAQ| ASBB =< es
Slide 26: Income Statement Trends
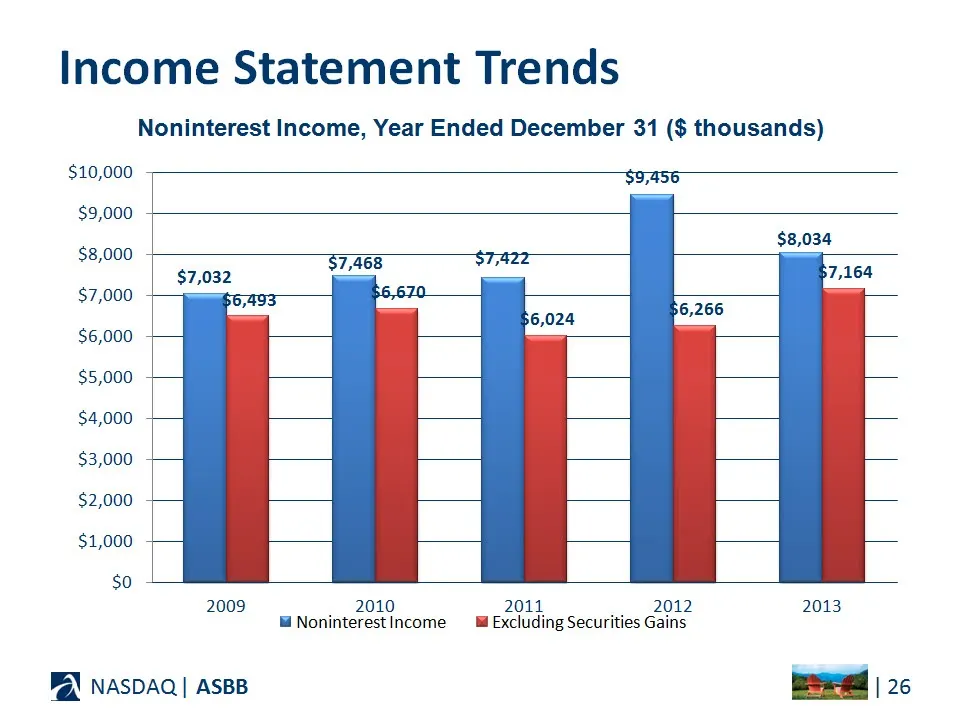
Income Statement Trends Noninterest Income, Year Ended December 31 ($ thousands) $10,000 $9,456 $9,000 $8,034 $8,000 $7,468 $74 $7,032 - 7,164 $7,000 + & nies 6,266 $6,000 $5,000 $4,000 $3,000 $2,000 $1,000 $o 2009 2010 2011 2012 2013 @NoninterestIncome ‘i Excluding Securities Gains BAX NasDAQ| ASBB
Slide 27: Income Statement Trends
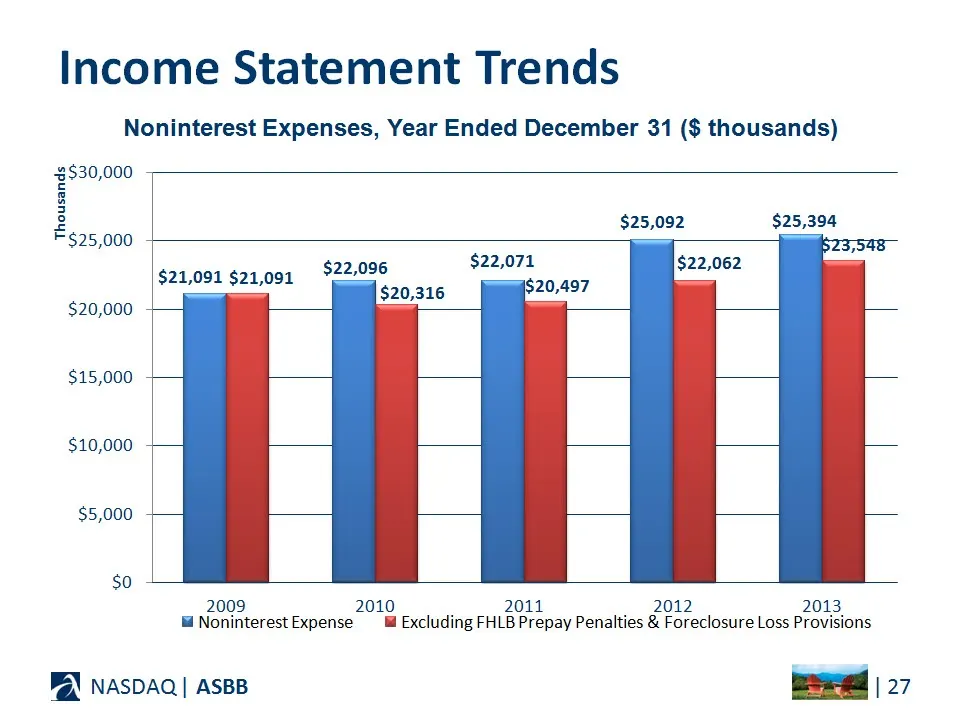
Income Statement Trends Noninterest Expenses, Year Ended December 31 ($ thousands) $30,000 5 Ee $25,092 $25,394 25,000 , $22,096 $22,071 $22,062 $21,091 $21,091 aa $20,497 $20,000 $15,000 $10,000 $5,000 $o 2009 2010 2011 2012 2013 li Noninterest Expense il Excluding FHLB Prepay Penalties & Foreclosu
Slide 28: Competitive Environment
Competitive Environment BA NASDAQ | ASBB peed | 22
Slide 29: Deposit Market Share — June 30, 2013
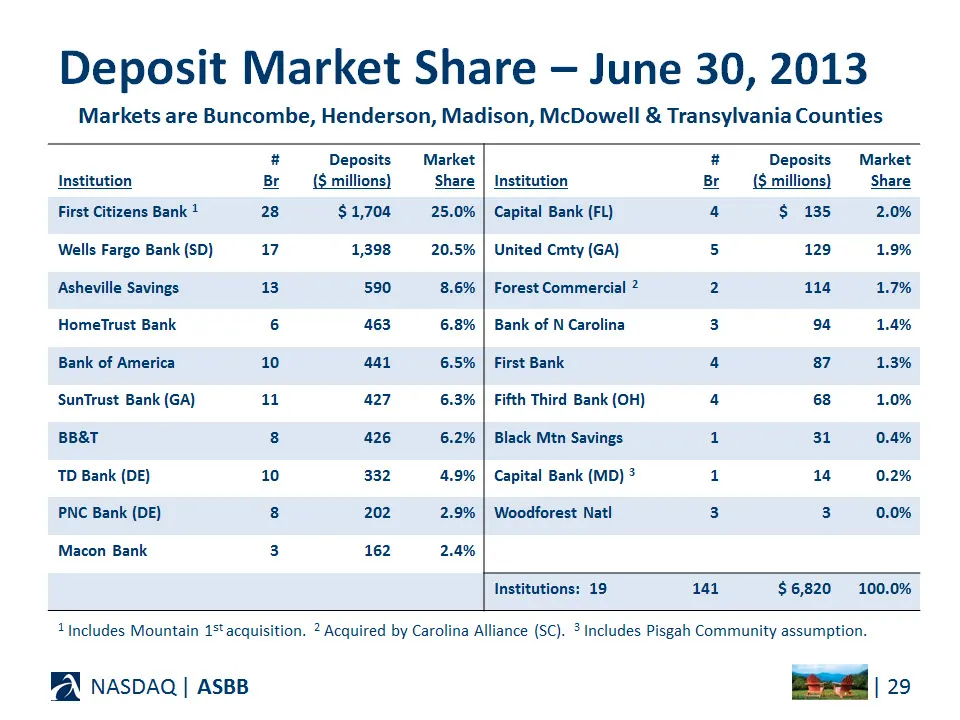
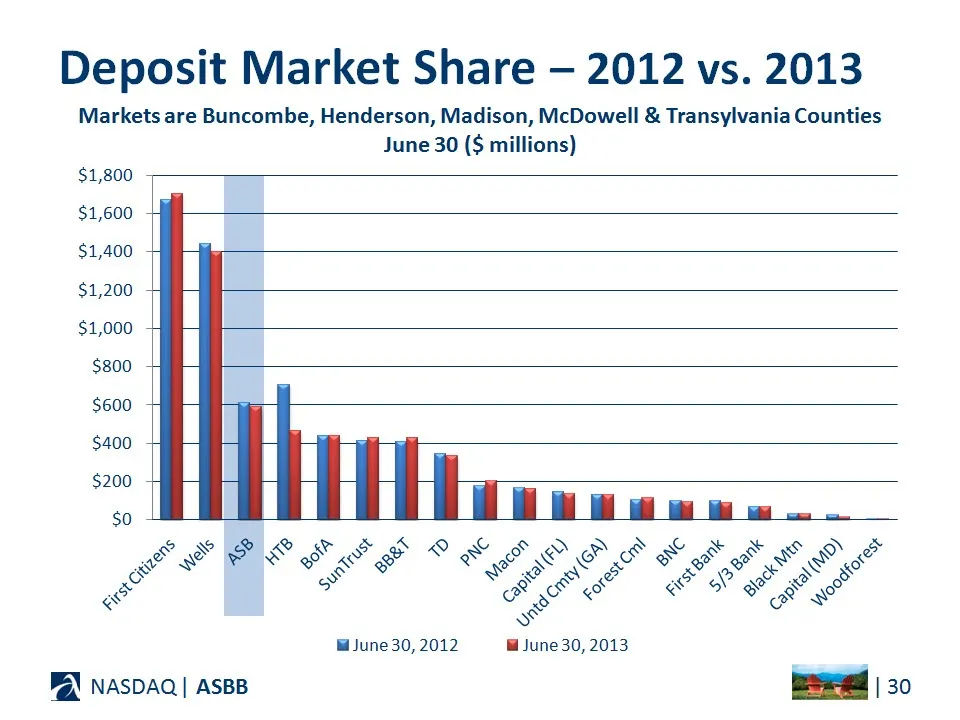
Deposit Market Share — June 30, 2013 Markets are Buncombe, Henderson, Madison, McDowell & Transylvania Counties # Deposits Institution Br ($ millions) First Citizens Bank ! 28 $1,704 Wells Fargo Bank (SD) 7 1,398 Asheville Savings 13 590 HomeTrust Bank 6 463 Bank of America 10 4a. SunTrust Bank (GA)
Slide 30: Deposit Market Share — 2012 vs. 2013
Deposit Market Share — 2012 vs. 2013 Markets are Buncombe, Henderson, Madison, McDowell & Transylvania Counties June 30 ($ millions) $1,800 $1,600 + $1,400 + $1,200 + $1,000 + $800 - $600 + $400 - $200 + so + 2 @ S GO: Be Di gW oO wo SS > PP PLL SFHF OE SFOS FESO S & se ° Fe OE EL SHS & & & x) < s S
Slide 31: Objectives
BA NASDAQ | ASBB Objectives peed | 31
Slide 32: Strategic Vision
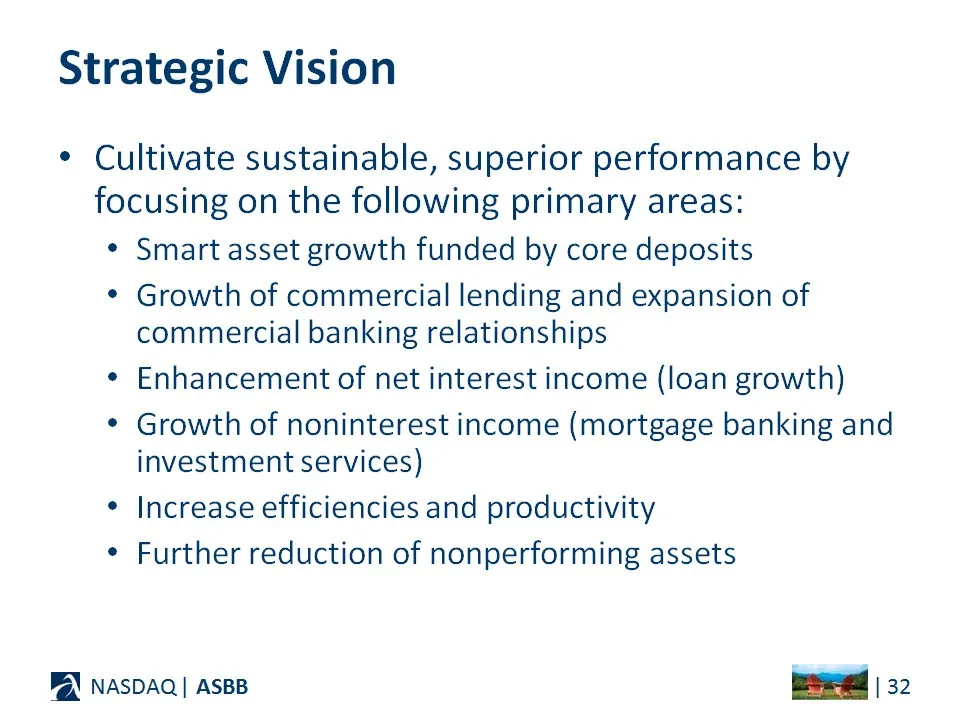
Strategic Vision * Cultivate sustainable, superior performance by focusing on the following primary areas: Smart asset growth funded by core deposits Growth of commercial lending and expansion of commercial banking relationships Enhancement of net interest income (loan growth) Growth of noninterest
Slide 33: Strategic Vision (continued)
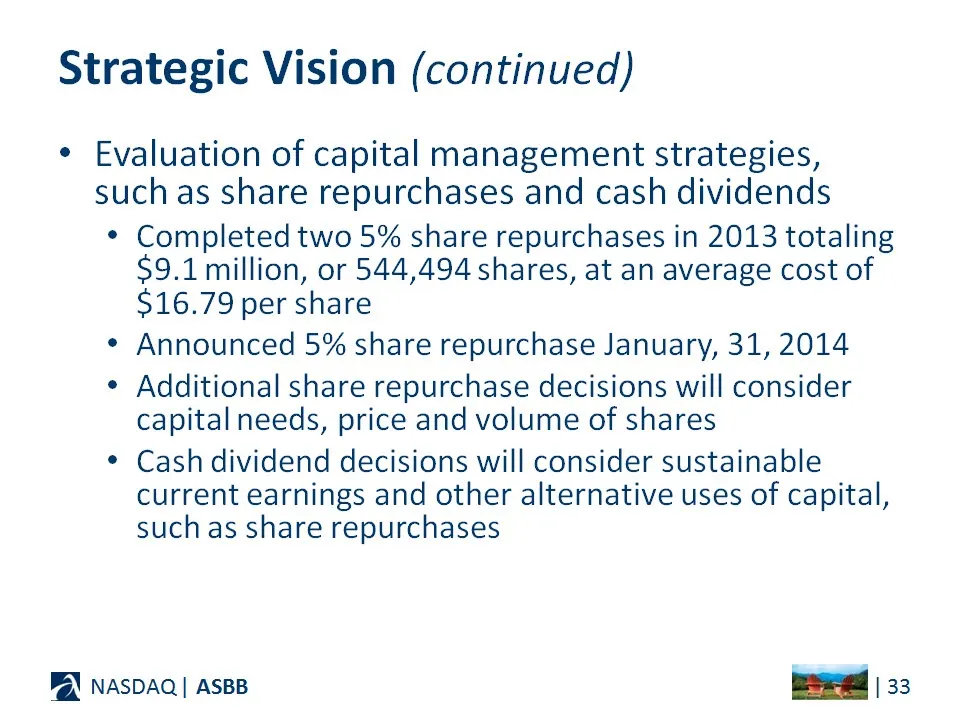
Strategic Vision (continued) ¢ Evaluation of capital management strategies, such as share repurchases and cash dividends * Completed two 5% share repurchases in 2013 totaling $9.1 million, or 544,494 shares, at an average cost of $16.79 per share ¢ Announced 5% share repurchase January, 31, 2014 ¢ A
Slide 34: Strategic Vision (continued)
Strategic Vision (continued) * Corporate governance and risk management practices * Employee Development * Commitment to Community BA NASDAQ | ASBB ead | 34

Slide 35: ASB Bancorp, Inc.
RN ASB BANCORP, INC NASDAQ | ASBB
Source: SEC EDGAR · 8-K filed Mar 5, 2014
More decks from ASB Bancorp Inc
 Shareholder Meeting (May 2017)34 slides · May 19, 2017
 Merger or Acquisition (May 2017)15 slides · May 1, 2017
 KBW 2016 Community Bank Investor Conference42 slides · Jul 29, 2016
 Shareholder Meeting (May 2016)34 slides · May 20, 2016
 Investor Presentation (August 2015)44 slides · Aug 25, 2015
 Shareholder Meeting (May 2015)37 slides · May 22, 2015