TXCO Resources — Exploration Co of Delaware — Shareholder Meeting (May 2007)
11 slides from TXCO Resources's shareholder meeting presentation, May 16, 2007
Slide 1: Outline of Slides for the Annual Shareholders' Meeting Presentations
Exhibit 99.1 Outline of Slides for the Annual Shareholders' Meeting Presentations May 11, 2007 Slide 1 - Annual Meeting of Shareholders Friday, May 11, 2007 Slide 2 - Corporate Information · Headquarters: TXCO Resources Inc.; 777 E. Sonterra Blvd., Suite 350; San Antonio, Texas 78258; Phone: (210) 4
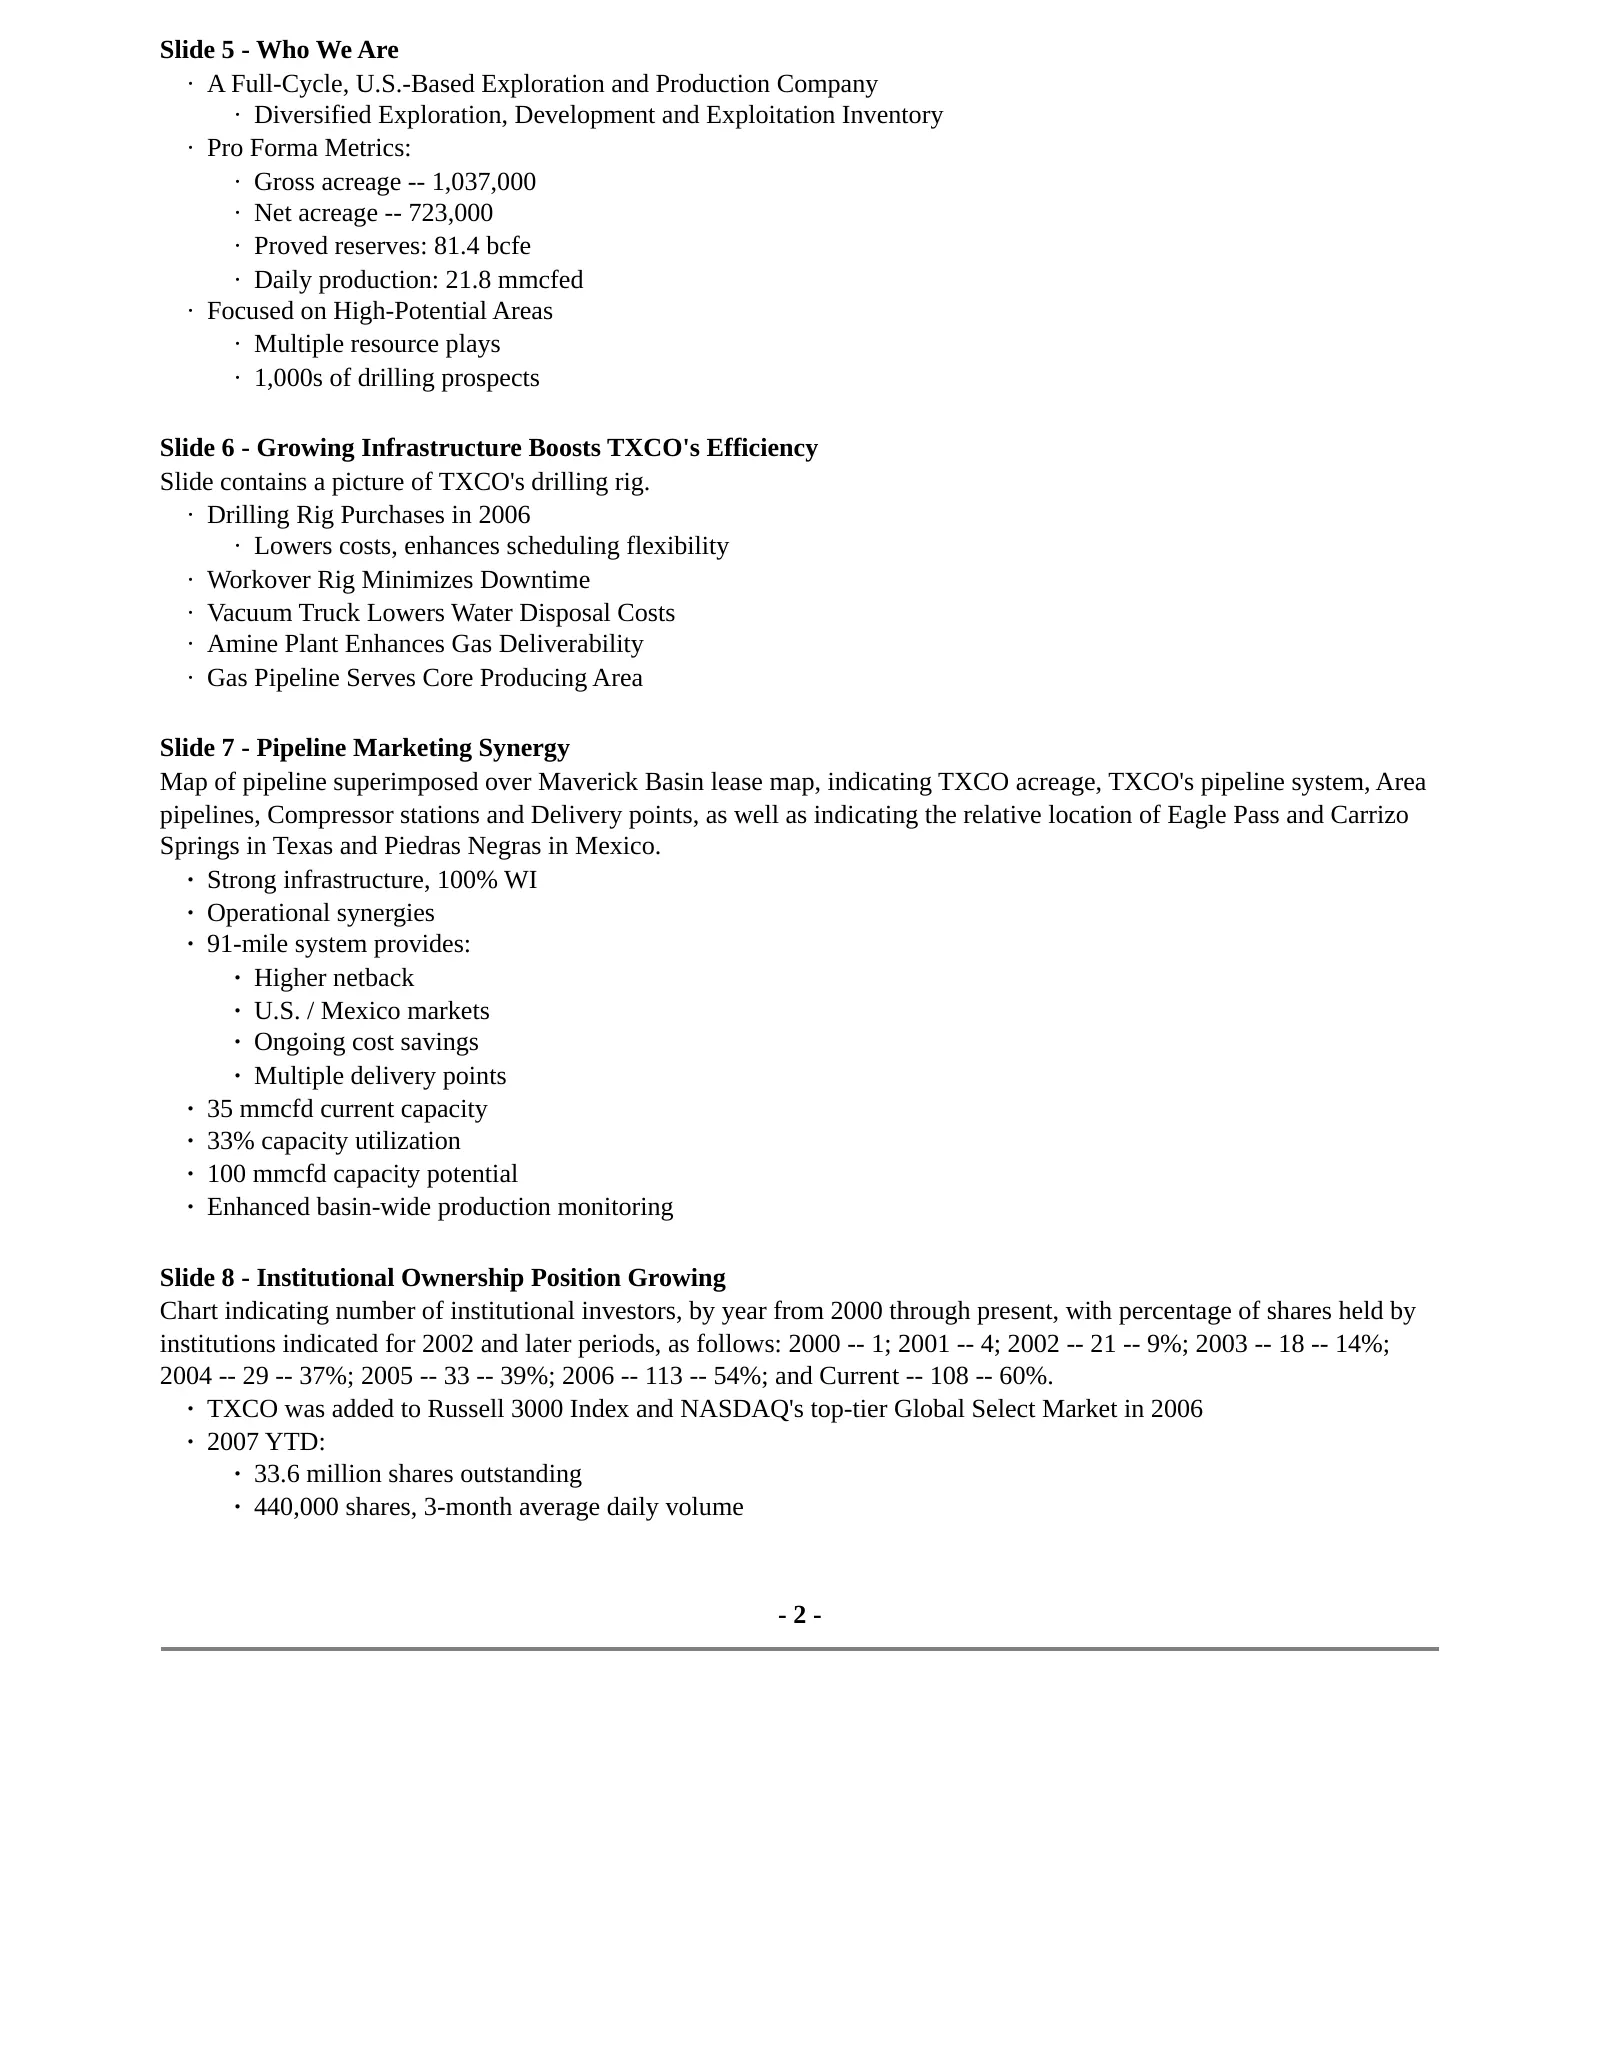
Slide 2: Who We Are; Infrastructure; Pipeline; Institutional Ownership
Slide 5 - Who We Are · A Full-Cycle, U.S.-Based Exploration and Production Company · Diversified Exploration, Development and Exploitation Inventory · Pro Forma Metrics: · Gross acreage -- 1,037,000 · Net acreage -- 723,000 · Proved reserves: 81.4 bcfe · Daily production: 21.8 mmcfed · Focused on Hi
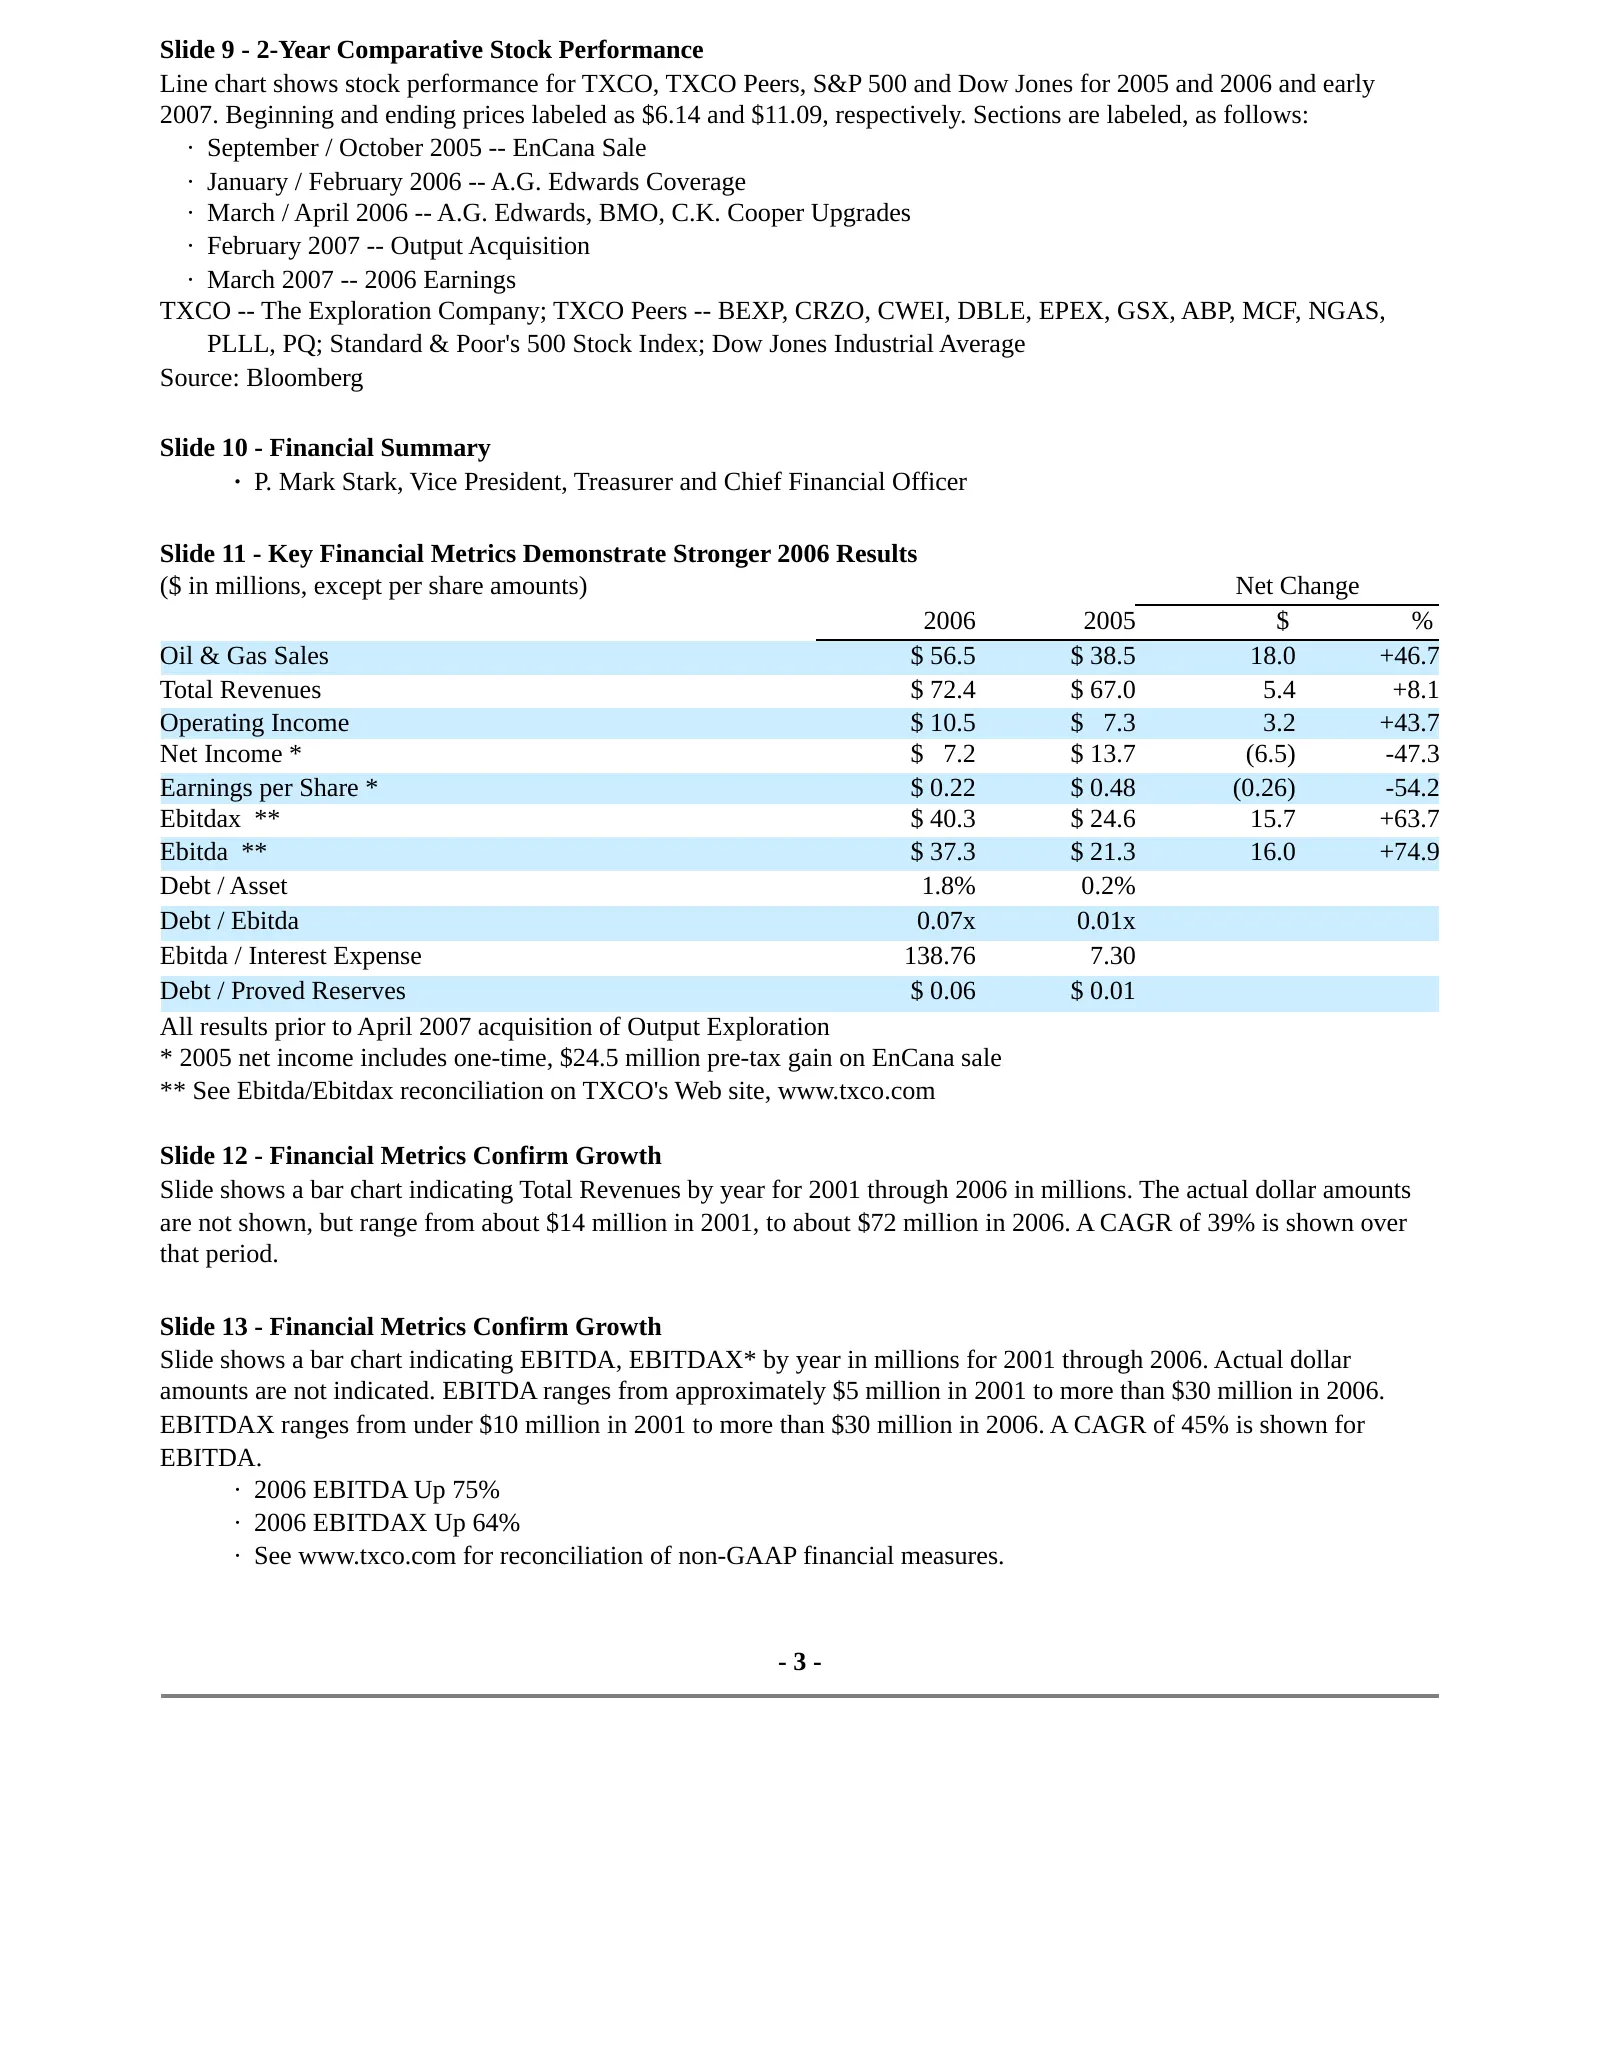
Slide 3: 2-Year Comparative Stock Performance and Financial Summary
Slide 9 - 2-Year Comparative Stock Performance Line chart shows stock performance for TXCO, TXCO Peers, S&P 500 and Dow Jones for 2005 and 2006 and early 2007. Beginning and ending prices labeled as $6.14 and $11.09, respectively. Sections are labeled, as follows: · September / October 2005 -- EnCan
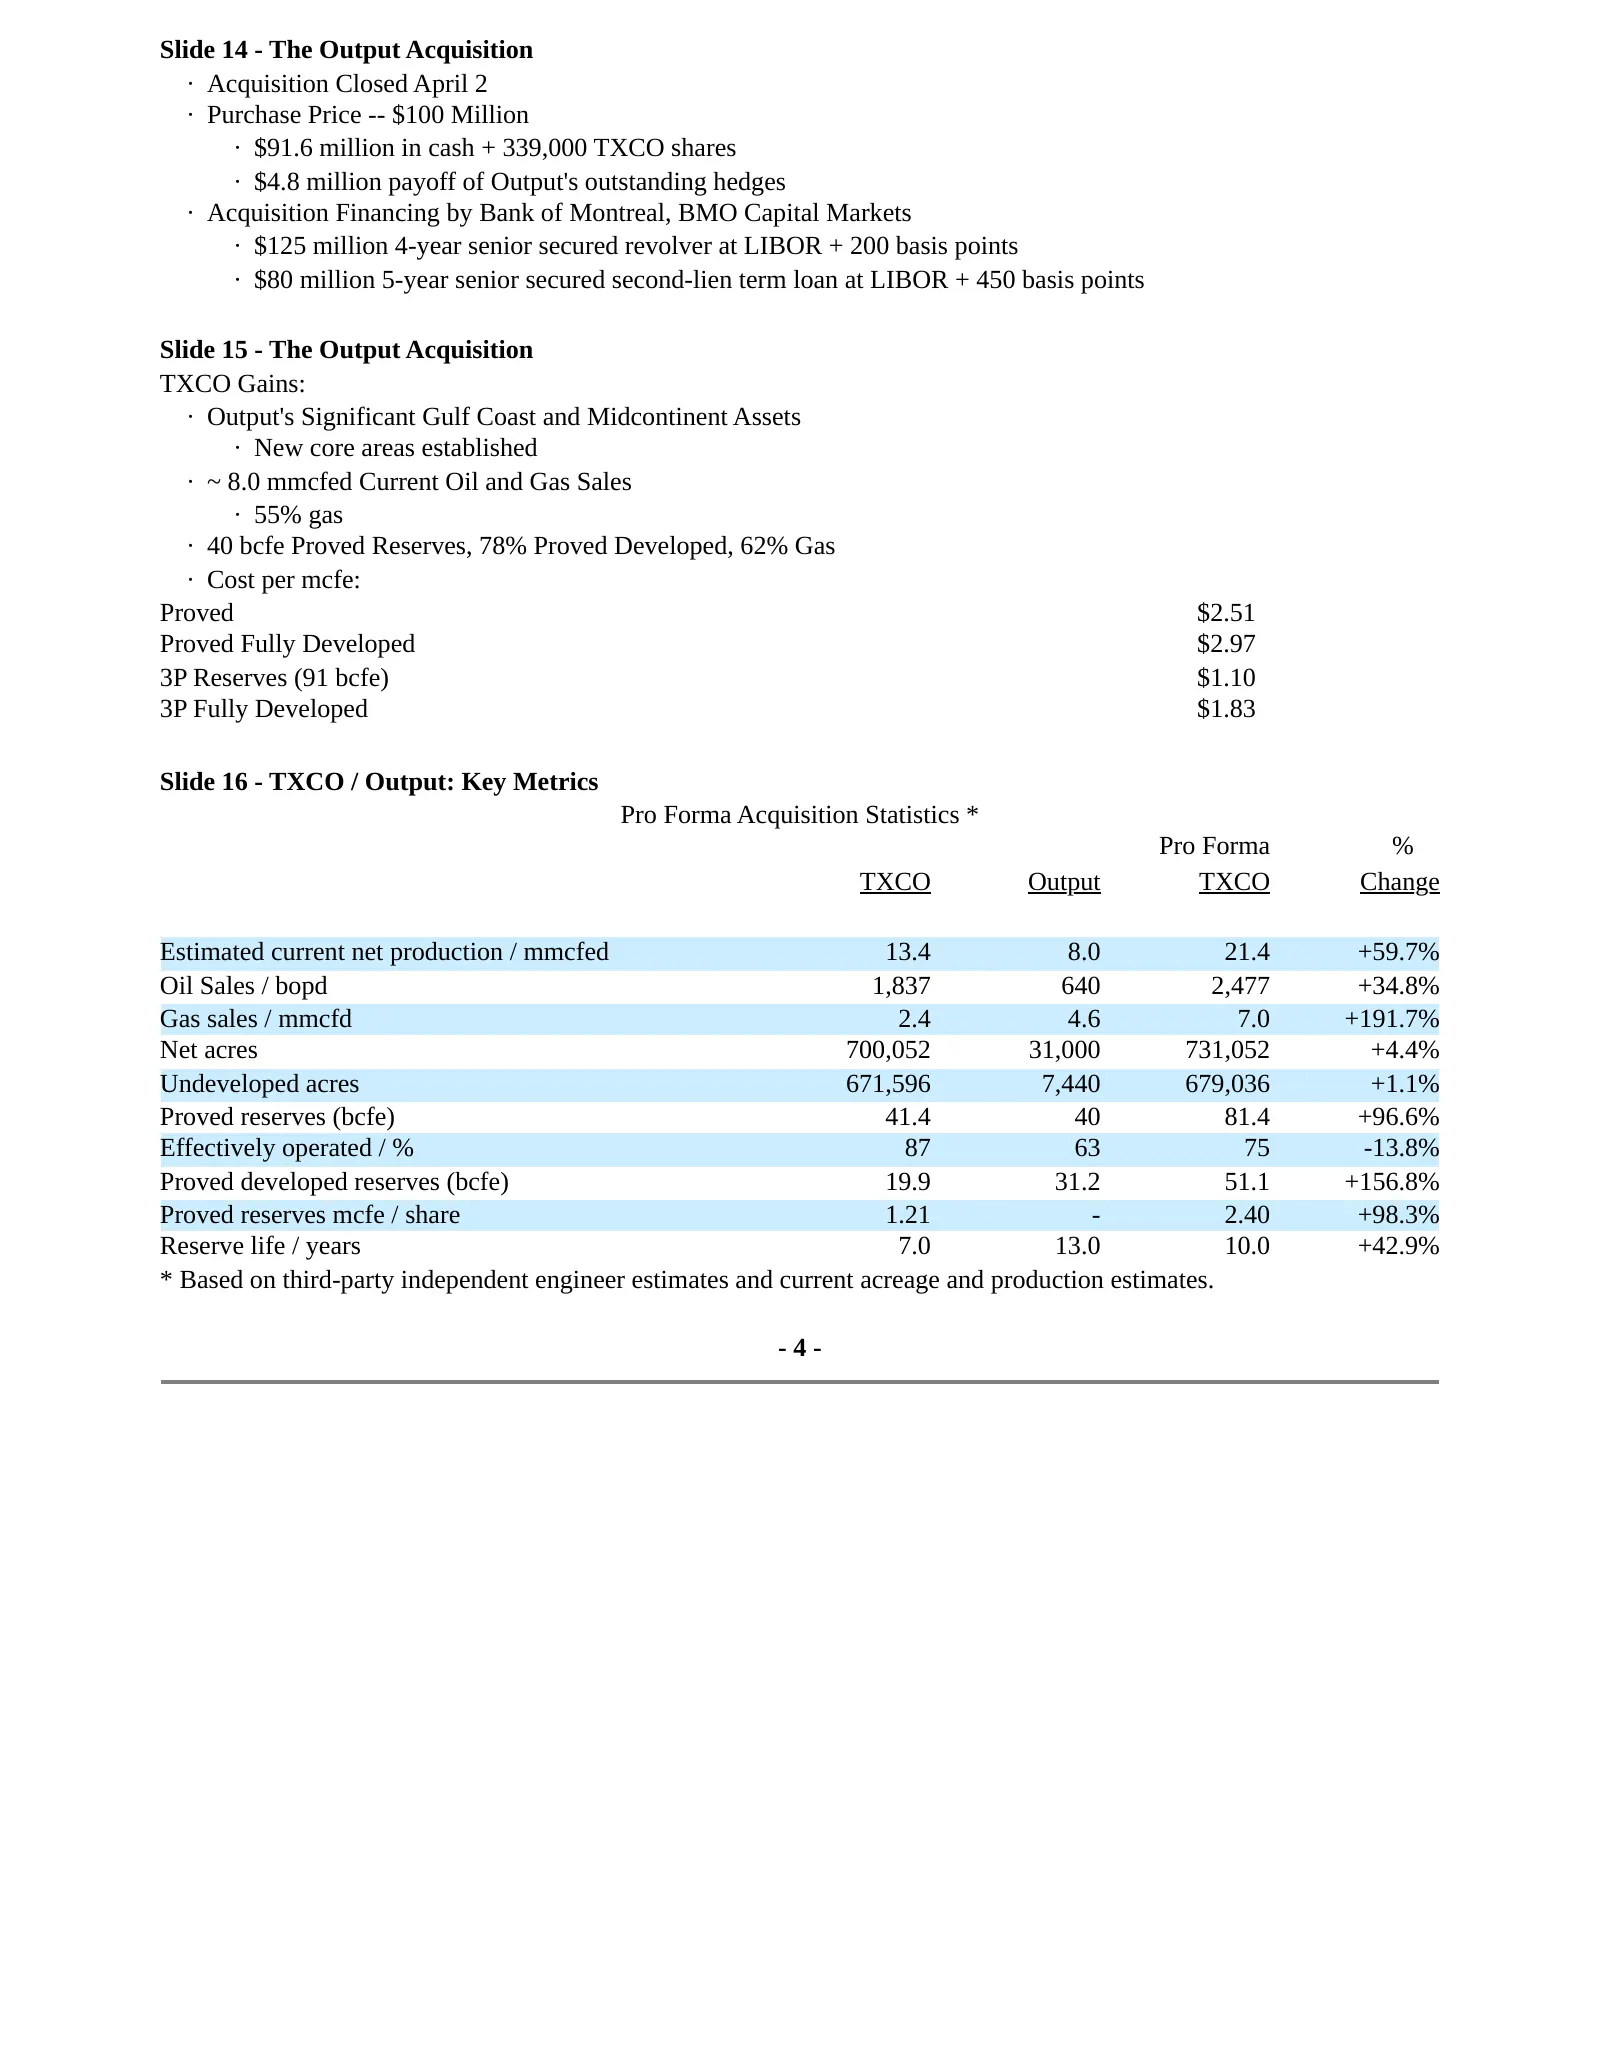
Slide 4: The Output Acquisition
Slide 14 - The Output Acquisition · Acquisition Closed April 2 · Purchase Price -- $100 Million · $91.6 million in cash + 339,000 TXCO shares · $4.8 million payoff of Output's outstanding hedges · Acquisition Financing by Bank of Montreal, BMO Capital Markets · $125 million 4-year senior secured rev
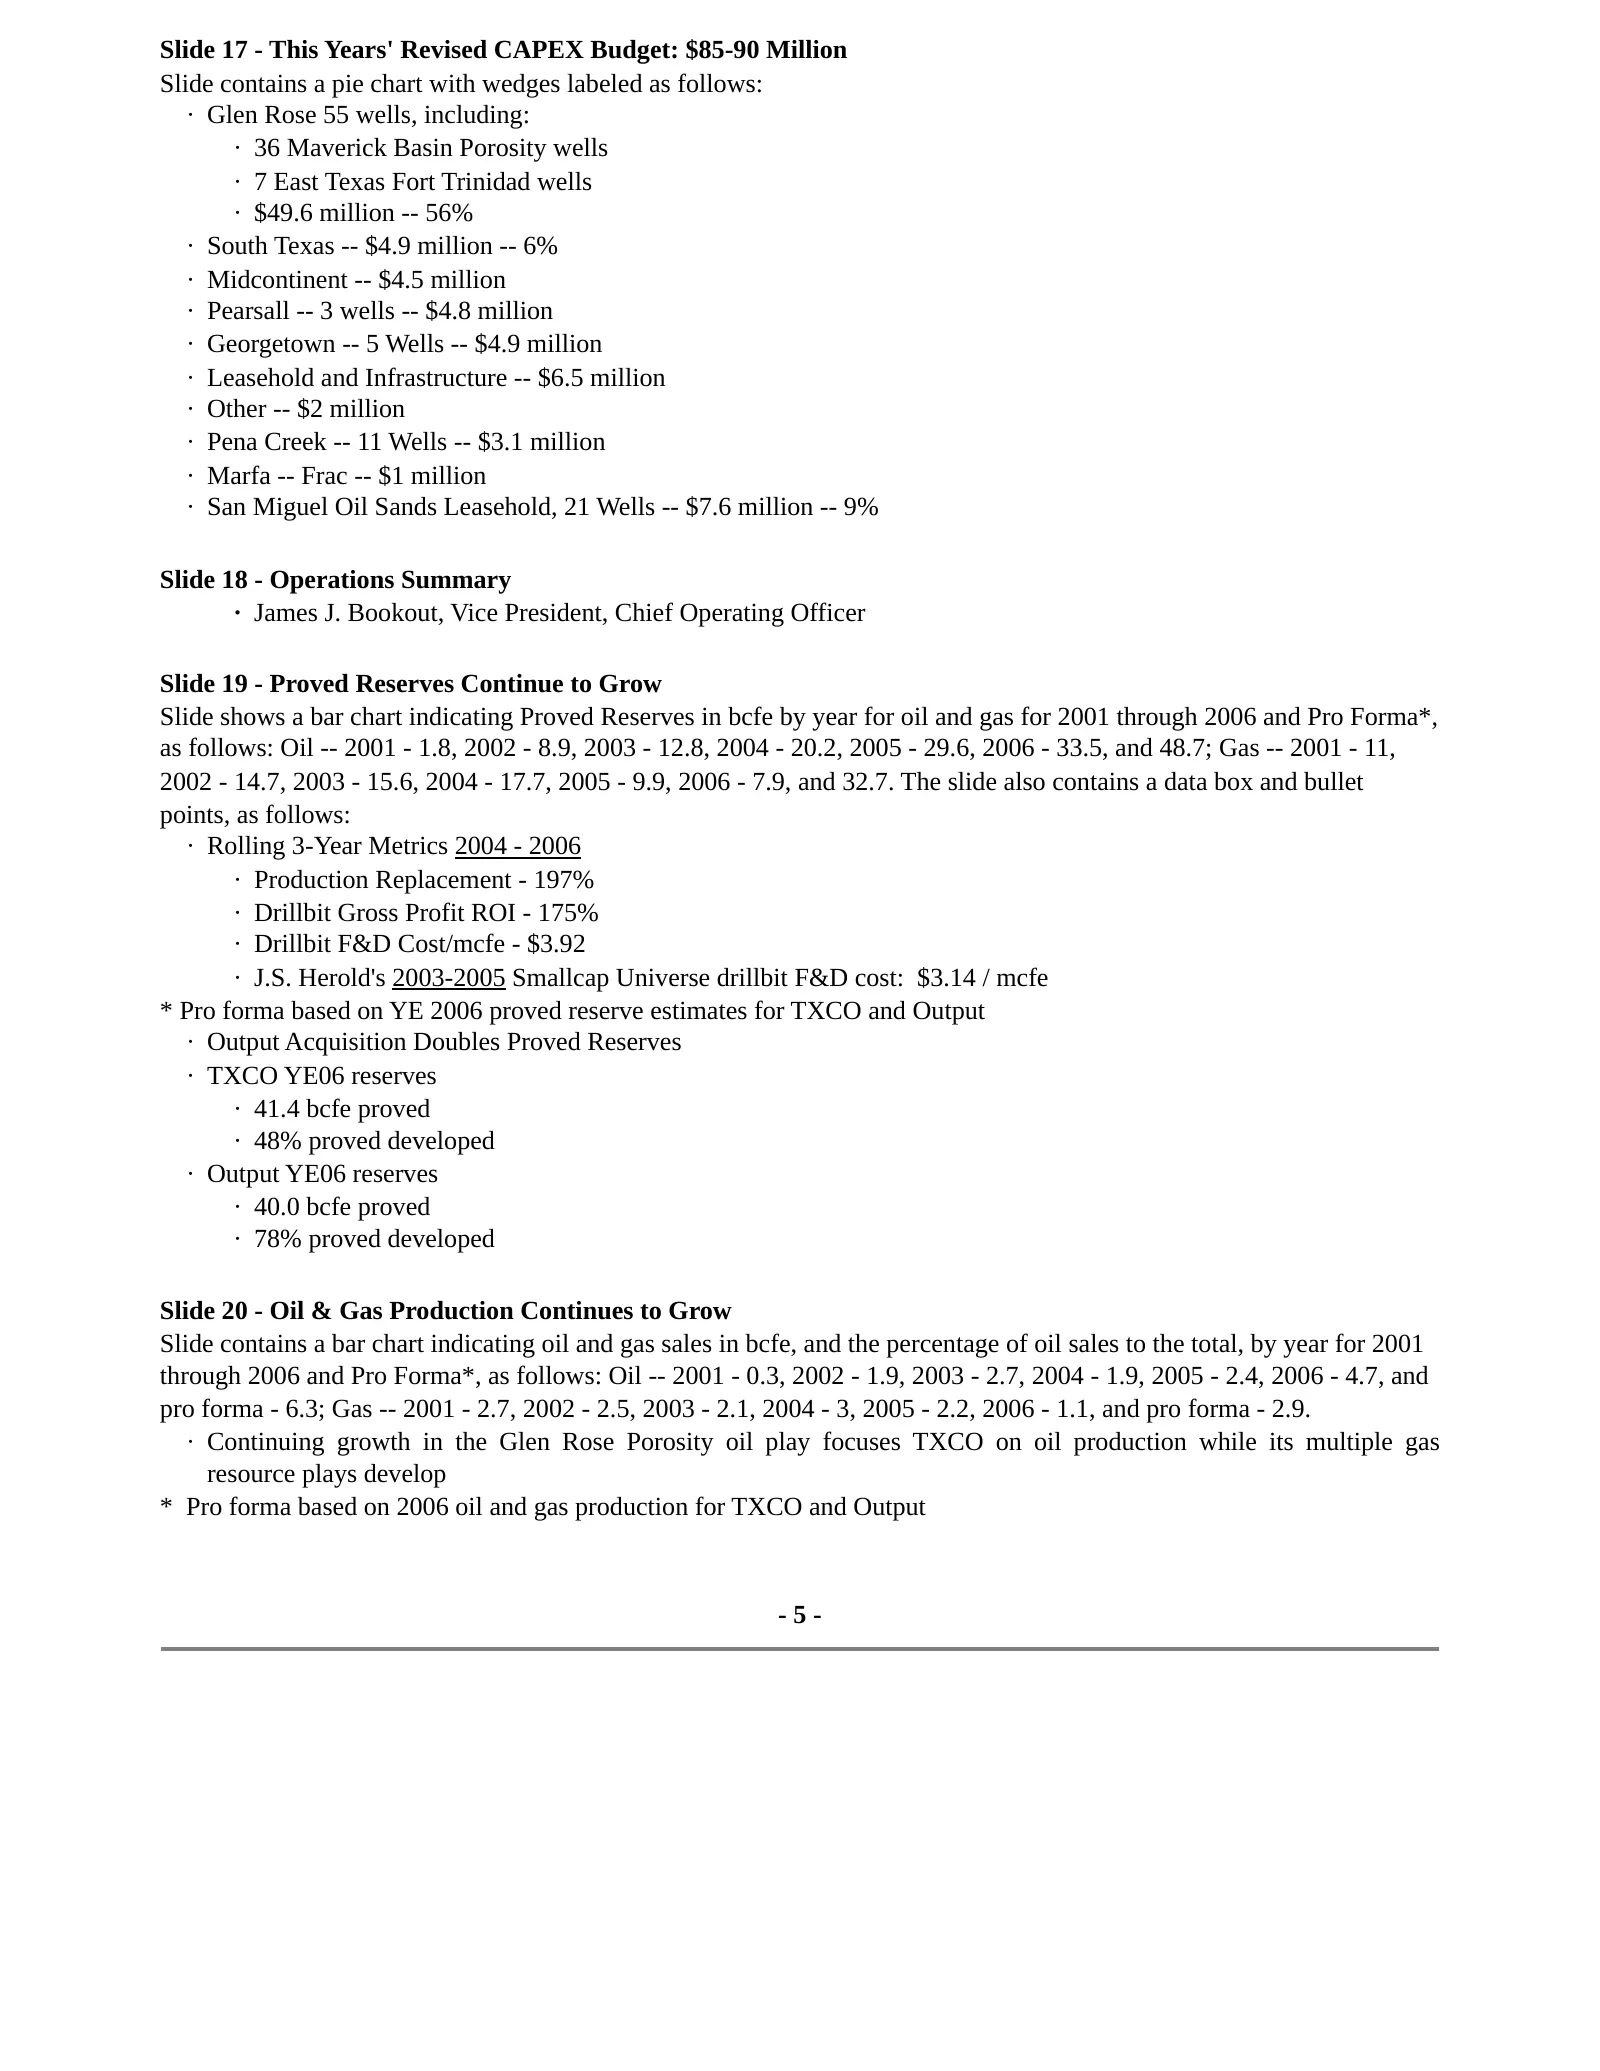
Slide 5: This Year's Revised CAPEX Budget: $85-90 Million
Slide 17 - This Years' Revised CAPEX Budget: $85-90 Million Slide contains a pie chart with wedges labeled as follows: · Glen Rose 55 wells, including: · 36 Maverick Basin Porosity wells · 7 East Texas Fort Trinidad wells · $49.6 million -- 56% · South Texas -- $4.9 million -- 6% · Midcontinent -- $
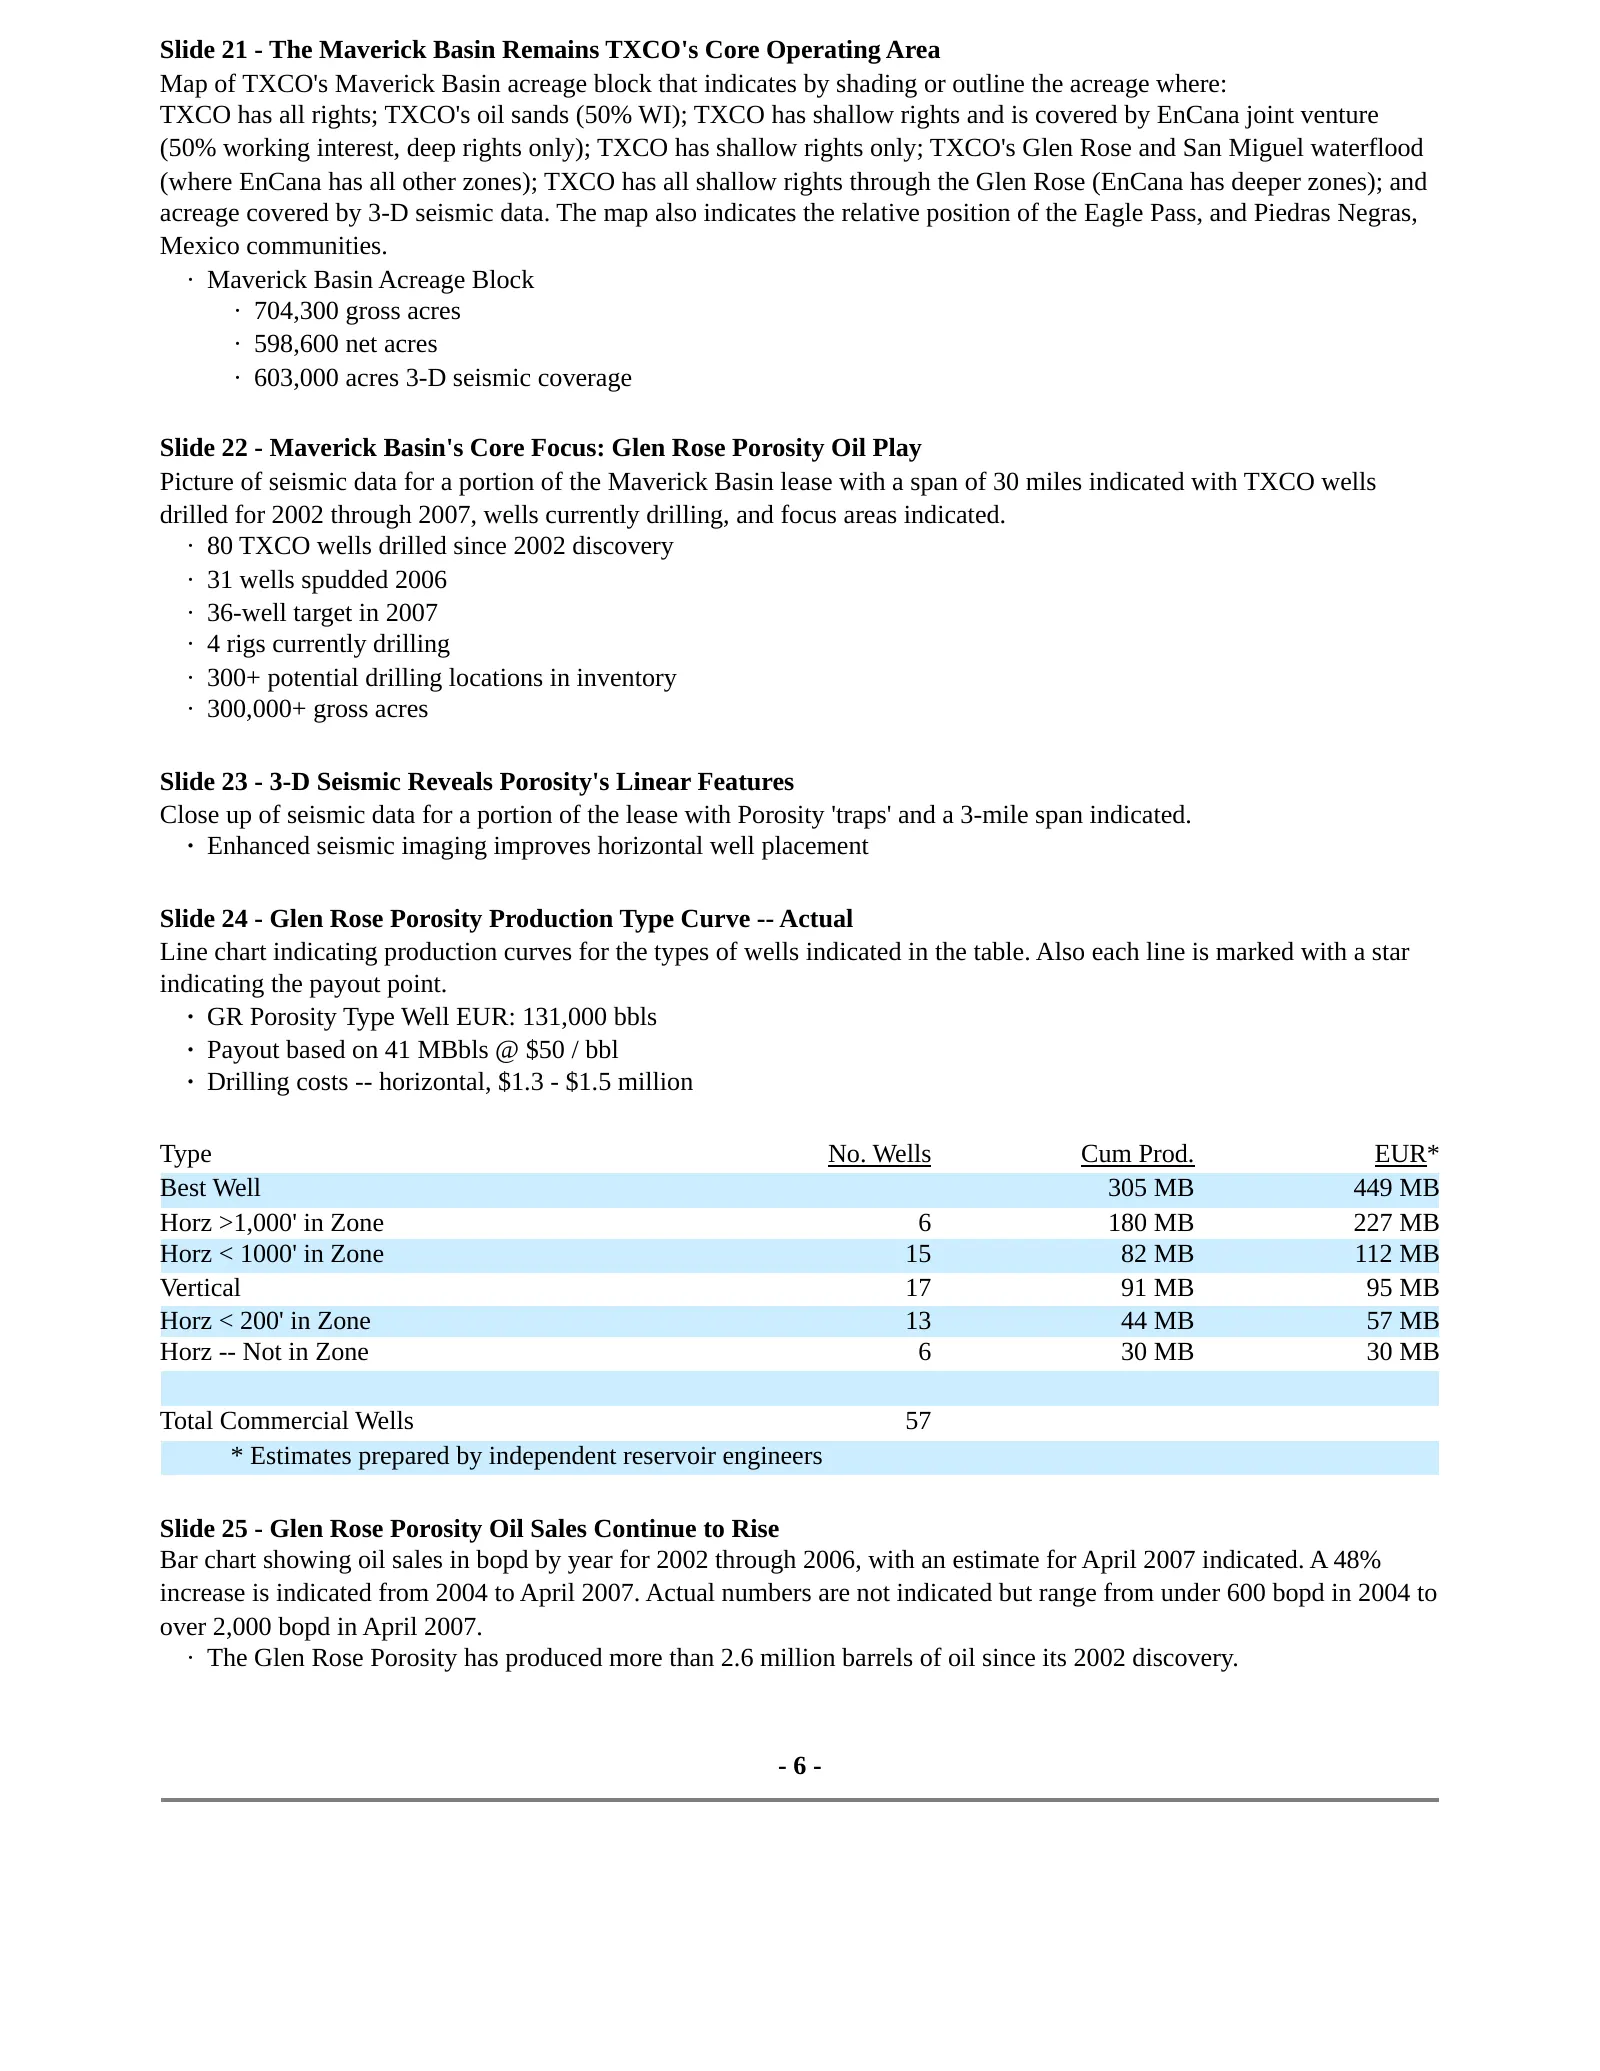
Slide 6: The Maverick Basin Remains TXCO's Core Operating Area
Slide 21 - The Maverick Basin Remains TXCO's Core Operating Area Map of TXCO's Maverick Basin acreage block that indicates by shading or outline the acreage where: TXCO has all rights; TXCO's oil sands (50% WI); TXCO has shallow rights and is covered by EnCana joint venture (50% working interest, de
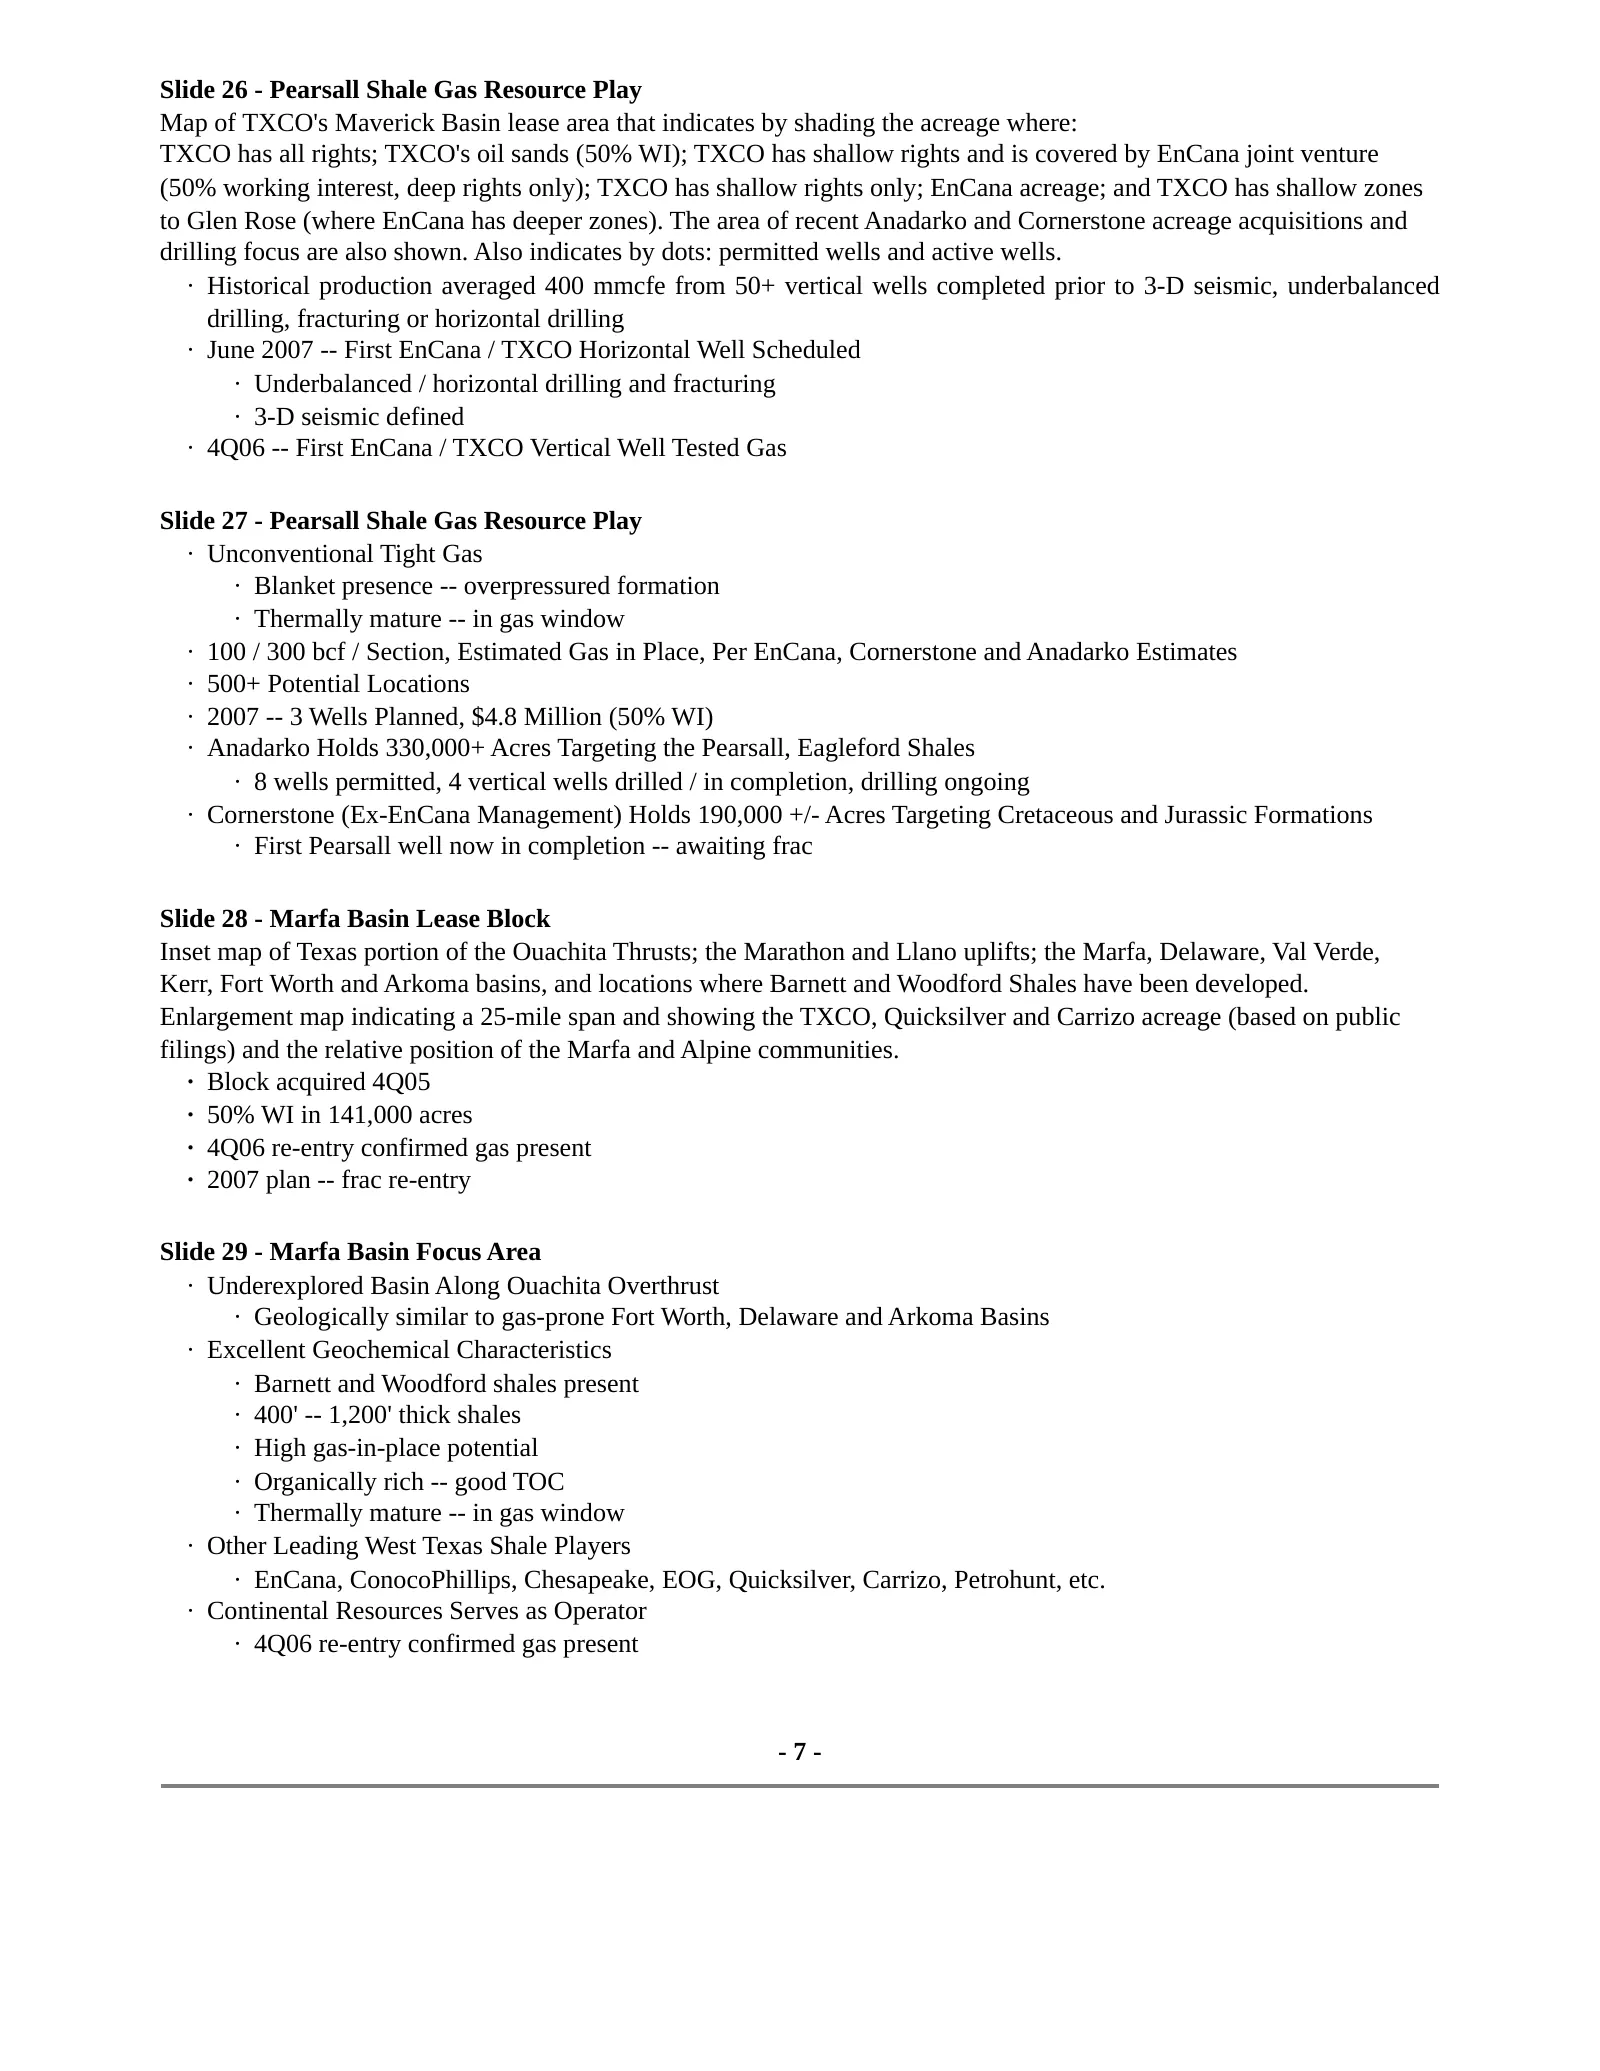
Slide 7: Pearsall Shale Gas Resource Play
Slide 26 - Pearsall Shale Gas Resource Play Map of TXCO's Maverick Basin lease area that indicates by shading the acreage where: TXCO has all rights; TXCO's oil sands (50% WI); TXCO has shallow rights and is covered by EnCana joint venture (50% working interest, deep rights only); TXCO has shallow r
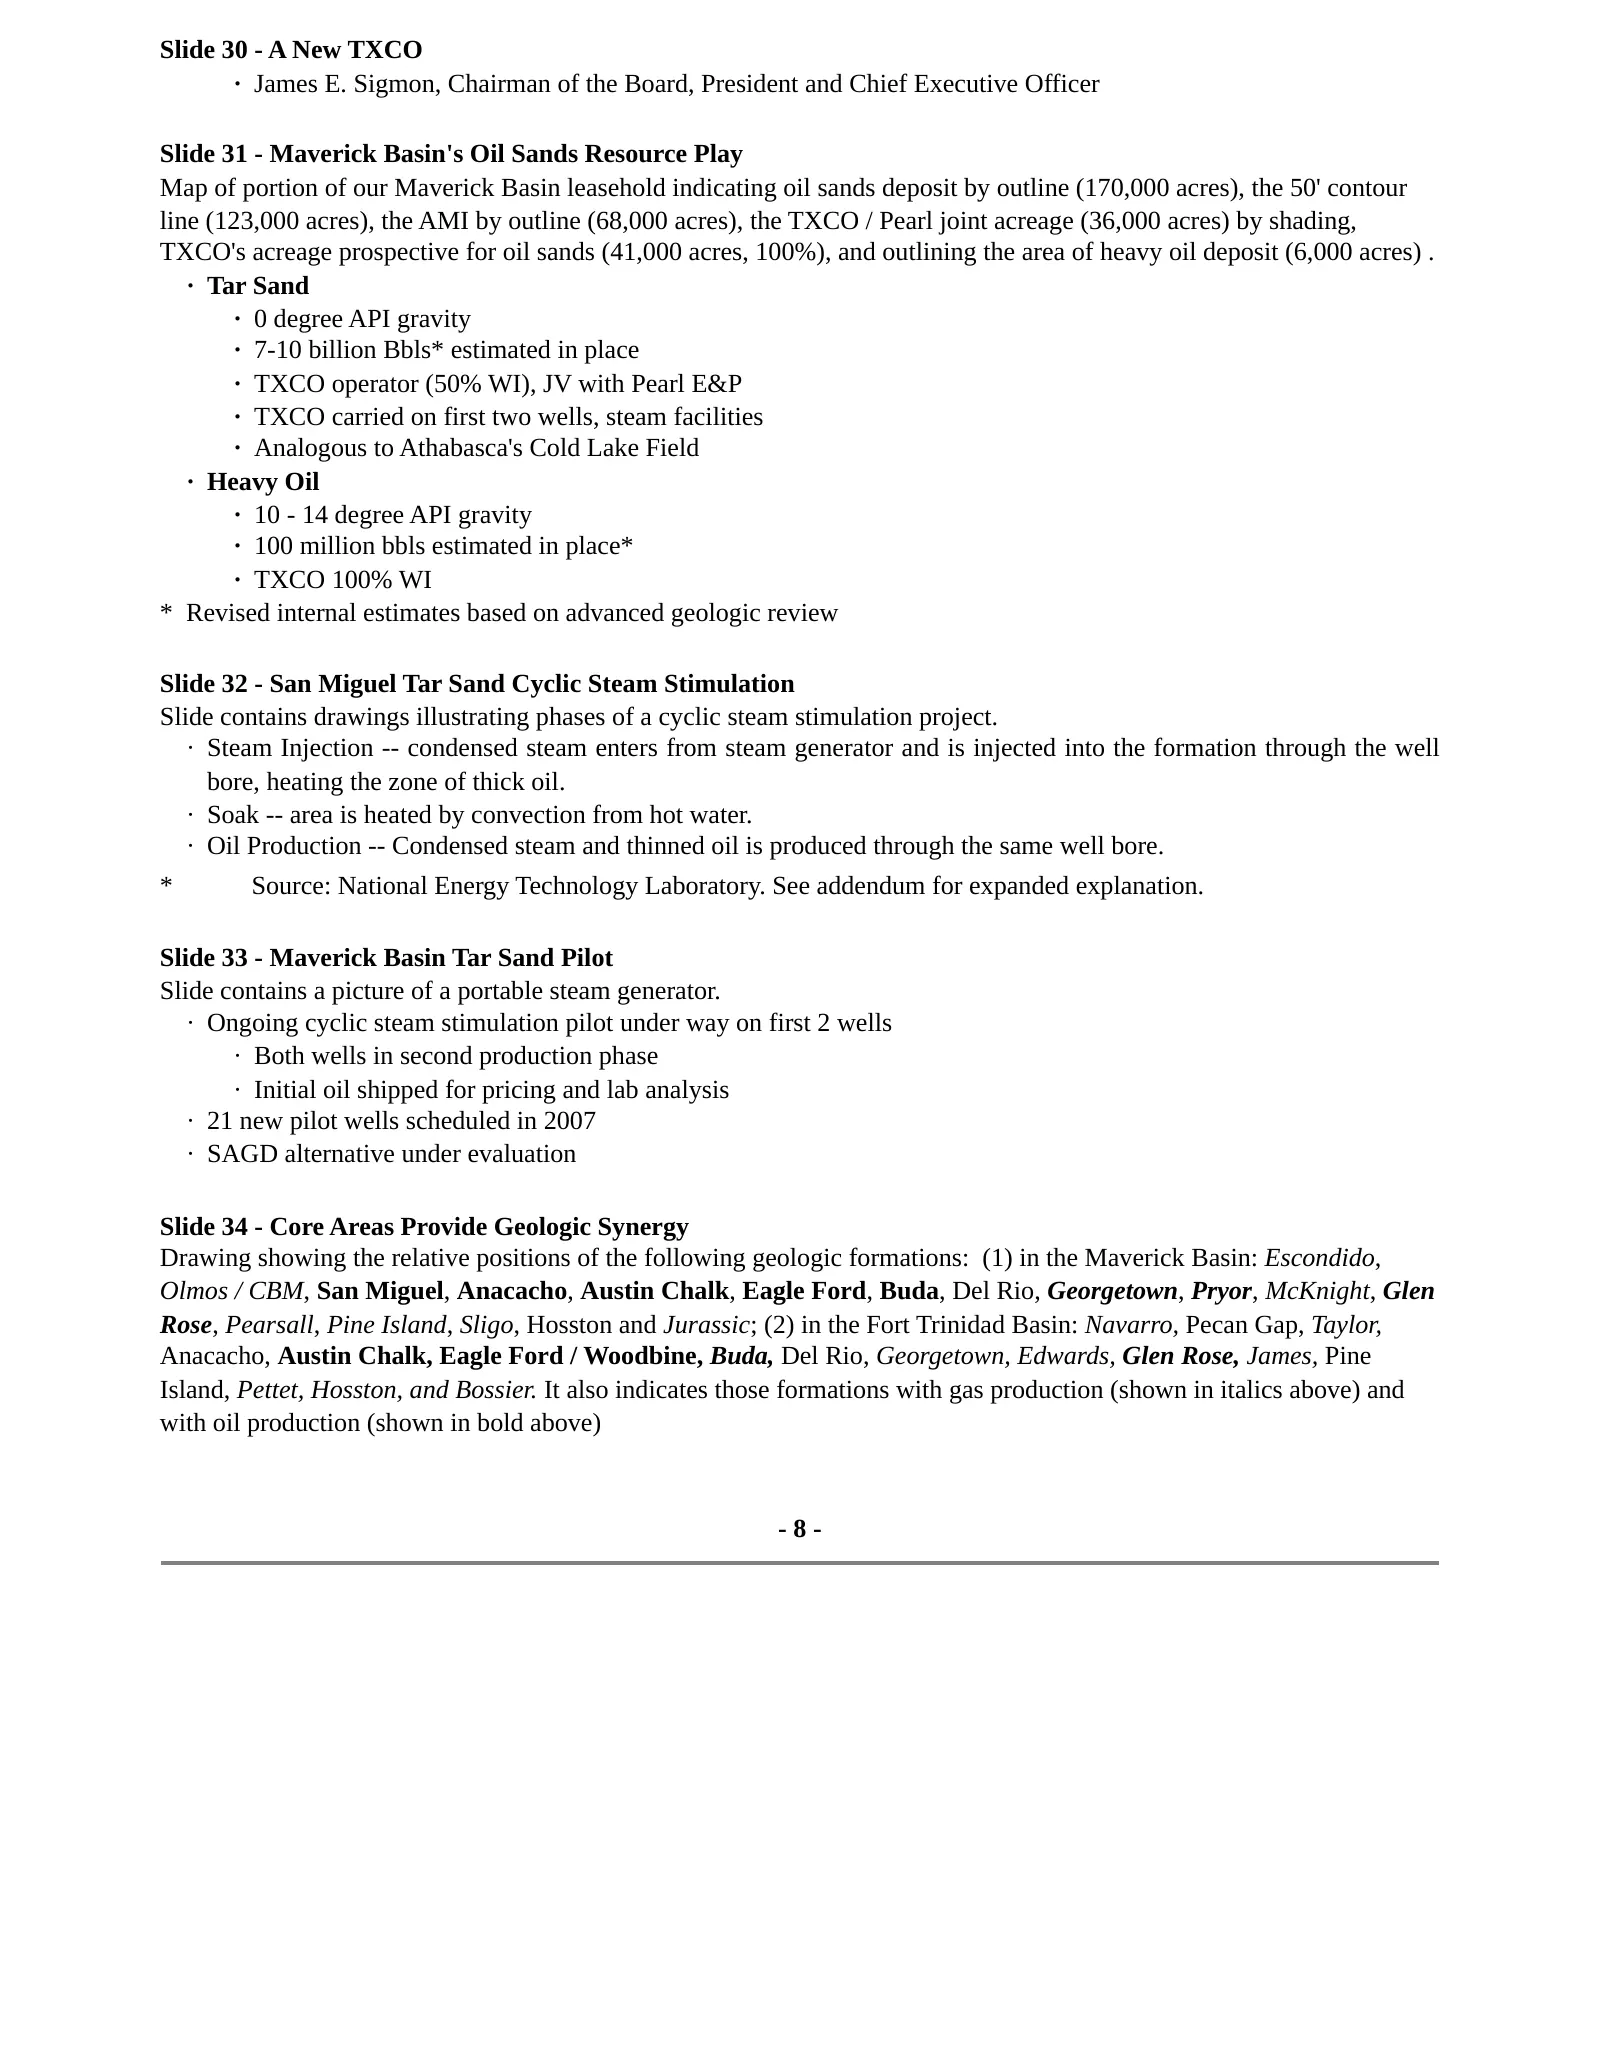
Slide 8: A New TXCO; Maverick Basin's Oil Sands Resource Play
Slide 30 - A New TXCO · James E. Sigmon, Chairman of the Board, President and Chief Executive Officer Slide 31 - Maverick Basin's Oil Sands Resource Play Map of portion of our Maverick Basin leasehold indicating oil sands deposit by outline (170,000 acres), the 50' contour line (123,000 acres), the
Slide 9: Fort Trinidad Area Geologically Similar to Maverick Basin
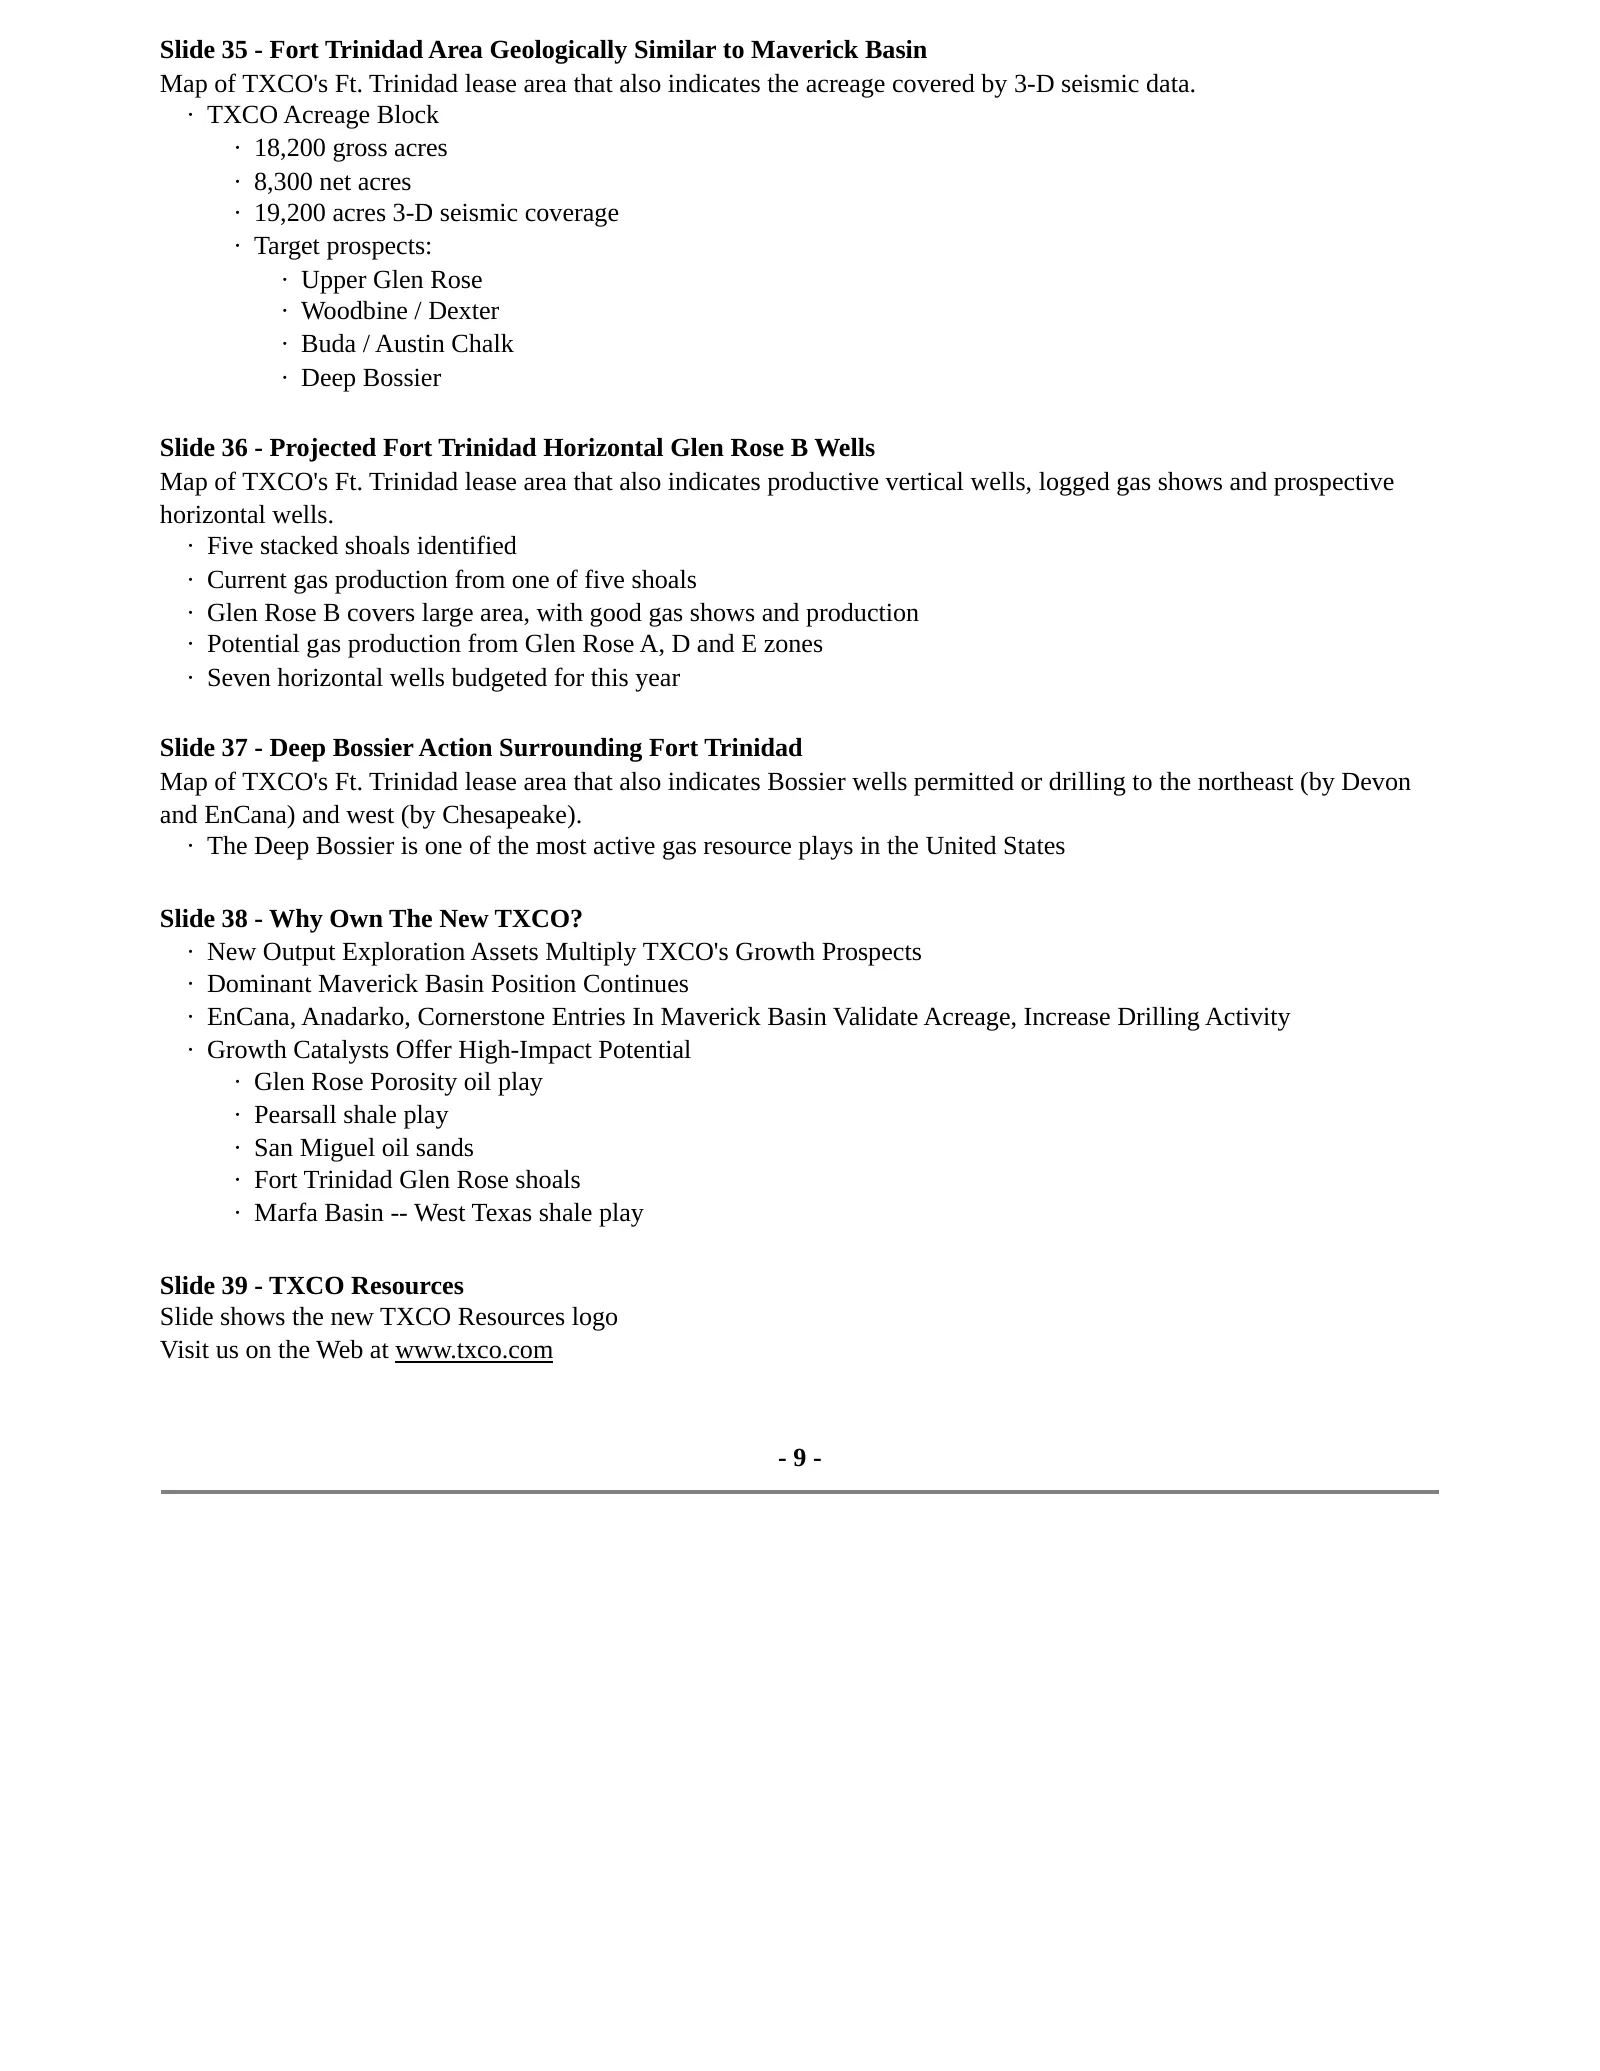
Slide 35 - Fort Trinidad Area Geologically Similar to Maverick Basin Map of TXCO's Ft. Trinidad lease area that also indicates the acreage covered by 3-D seismic data. · TXCO Acreage Block · 18,200 gross acres · 8,300 net acres · 19,200 acres 3-D seismic coverage · Target prospects: · Upper Glen Ros
Slide 10: Appendix: Glossary
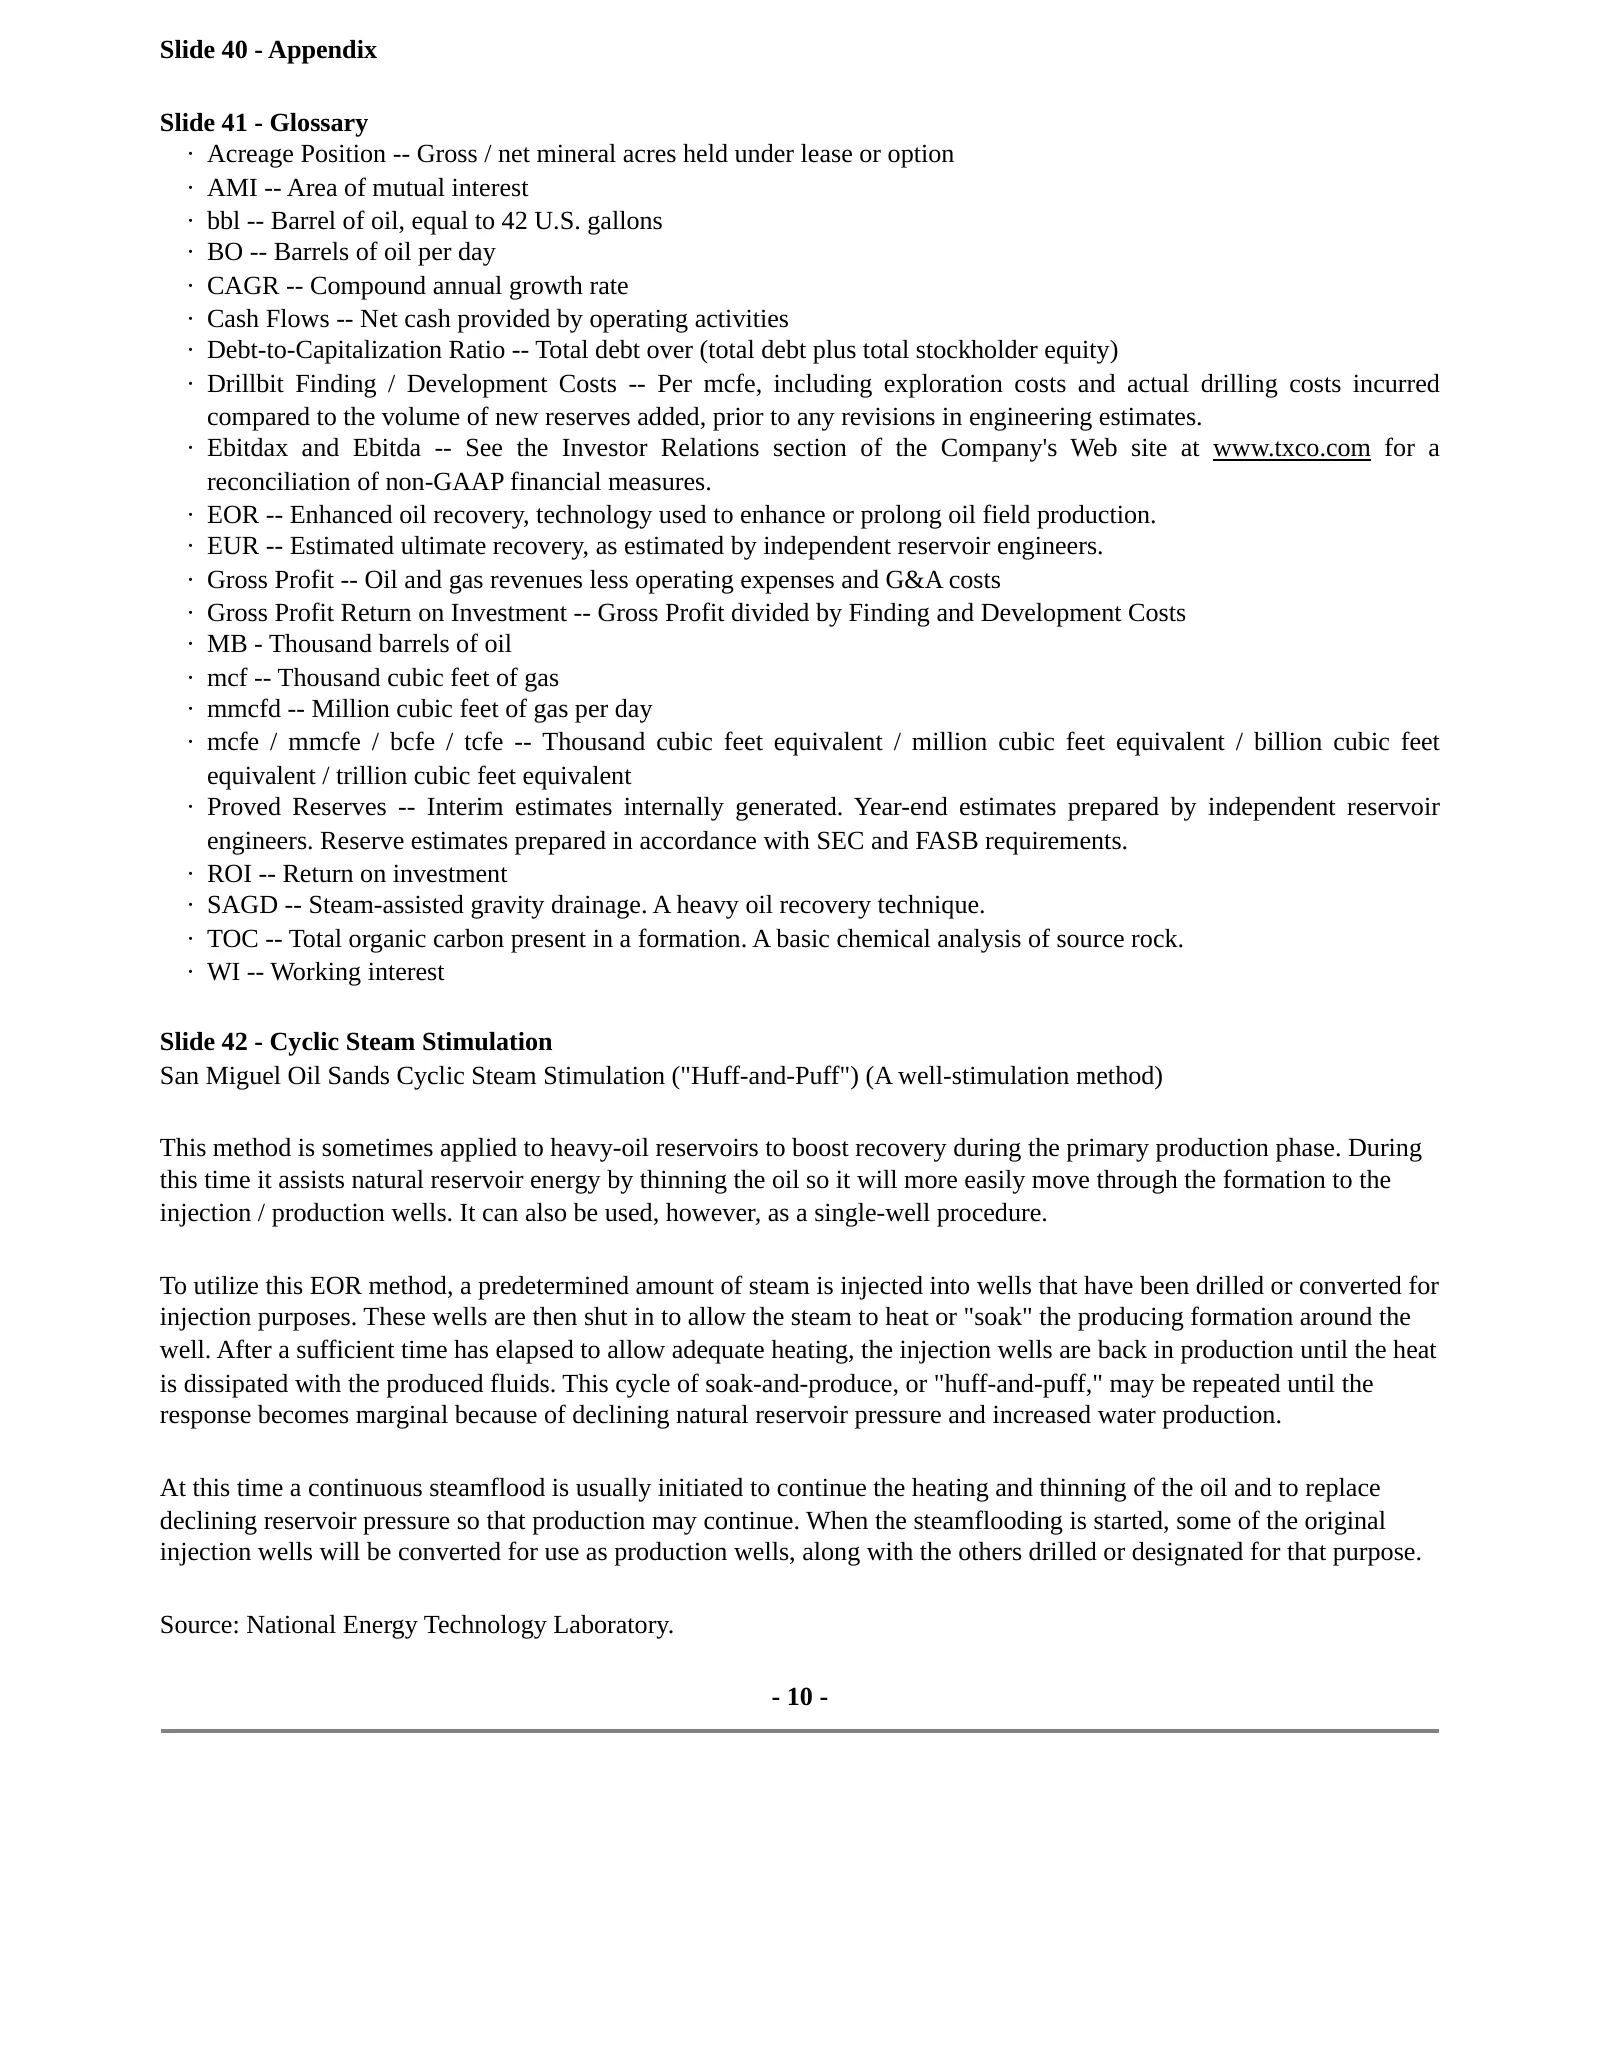
Slide 40 - Appendix Slide 41 - Glossary · Acreage Position -- Gross / net mineral acres held under lease or option · AMI -- Area of mutual interest · bbl -- Barrel of oil, equal to 42 U.S. gallons · BO -- Barrels of oil per day · CAGR -- Compound annual growth rate · Cash Flows -- Net cash provided

Slide 11
Source: SEC EDGAR · 8-K filed May 16, 2007
More decks from TXCO Resources Inc
 IPAA Oil and Gas Investment Symposium 200710 slides · Oct 1, 2007
 Investor Presentation (June 2007)15 slides · Jun 20, 2007
 Exploration Co of Delaware — IPAA Oil and Gas Investment Symposium April 200710 slides · Apr 23, 2007
 Exploration Co of Delaware — Howard Weil 35th Annual Energy Conference 200711 slides · Apr 9, 2007
 Exploration Co of Delaware — A.G. Edwards Energy Conference 200712 slides · Mar 20, 2007
 Exploration Co of Delaware — 2007 OGIS Small Cap Conference10 slides · Feb 7, 2007