TXCO Resources — Exploration Co of Delaware — 2007 OGIS Small Cap Conference
10 slides from TXCO Resources's conference presentation, Feb 7, 2007
Slide 1: Continuing Growth / Corporate Information
Presentation Outline for Presentation at 2007 OGIS Small Cap February 6-8, 2007 Slide 1 - Continuing Growth 2007 OGIS Small Cap February 6-8 -- Boca Raton, Florida Roberto R. Thomae, Vice President-Capital Markets Slide 2 - Corporate Information · Headquarters: The Exploration Company; 777 E. Sonter
Slide 2: TXCO's Profile: Focused Growth; Maverick Basin Focus Area; Pipeline
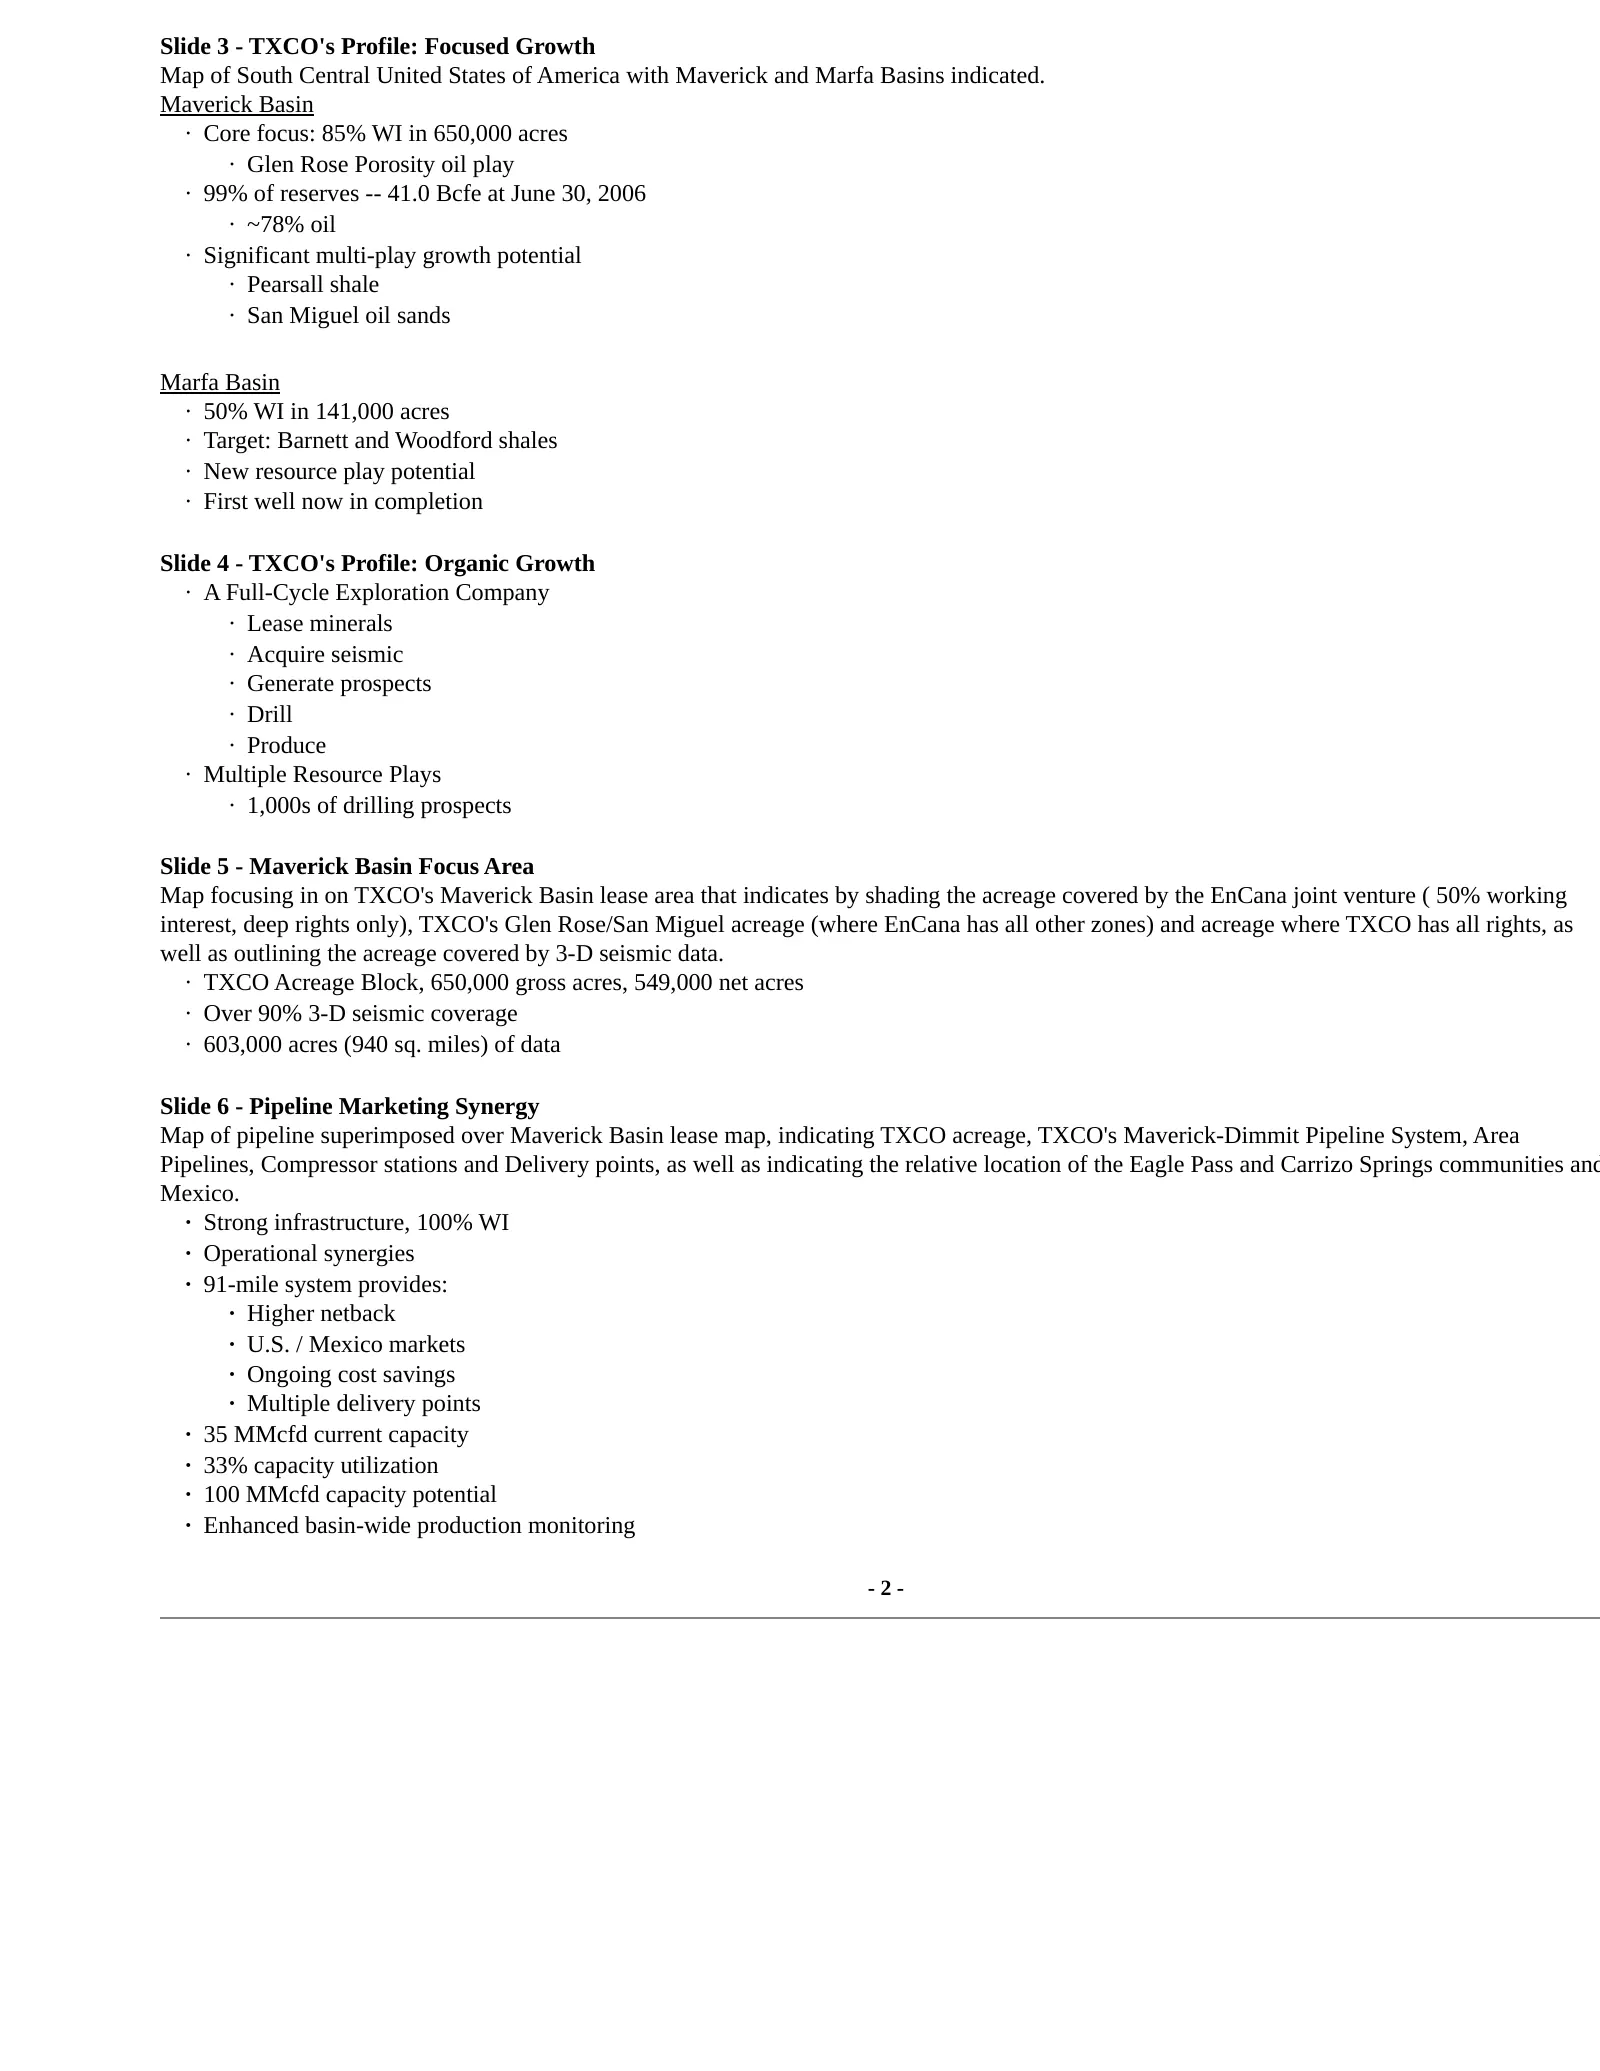
Slide 3 - TXCO's Profile: Focused Growth Map of South Central United States of America with Maverick and Marfa Basins indicated. Maverick Basin · Core focus: 85% WI in 650,000 acres · Glen Rose Porosity oil play · 99% of reserves -- 41.0 Bcfe at June 30, 2006 · ~78% oil · Significant multi-play grow
Slide 3: Maverick Basin Cross Section; Initial 2007 CAPEX Targets
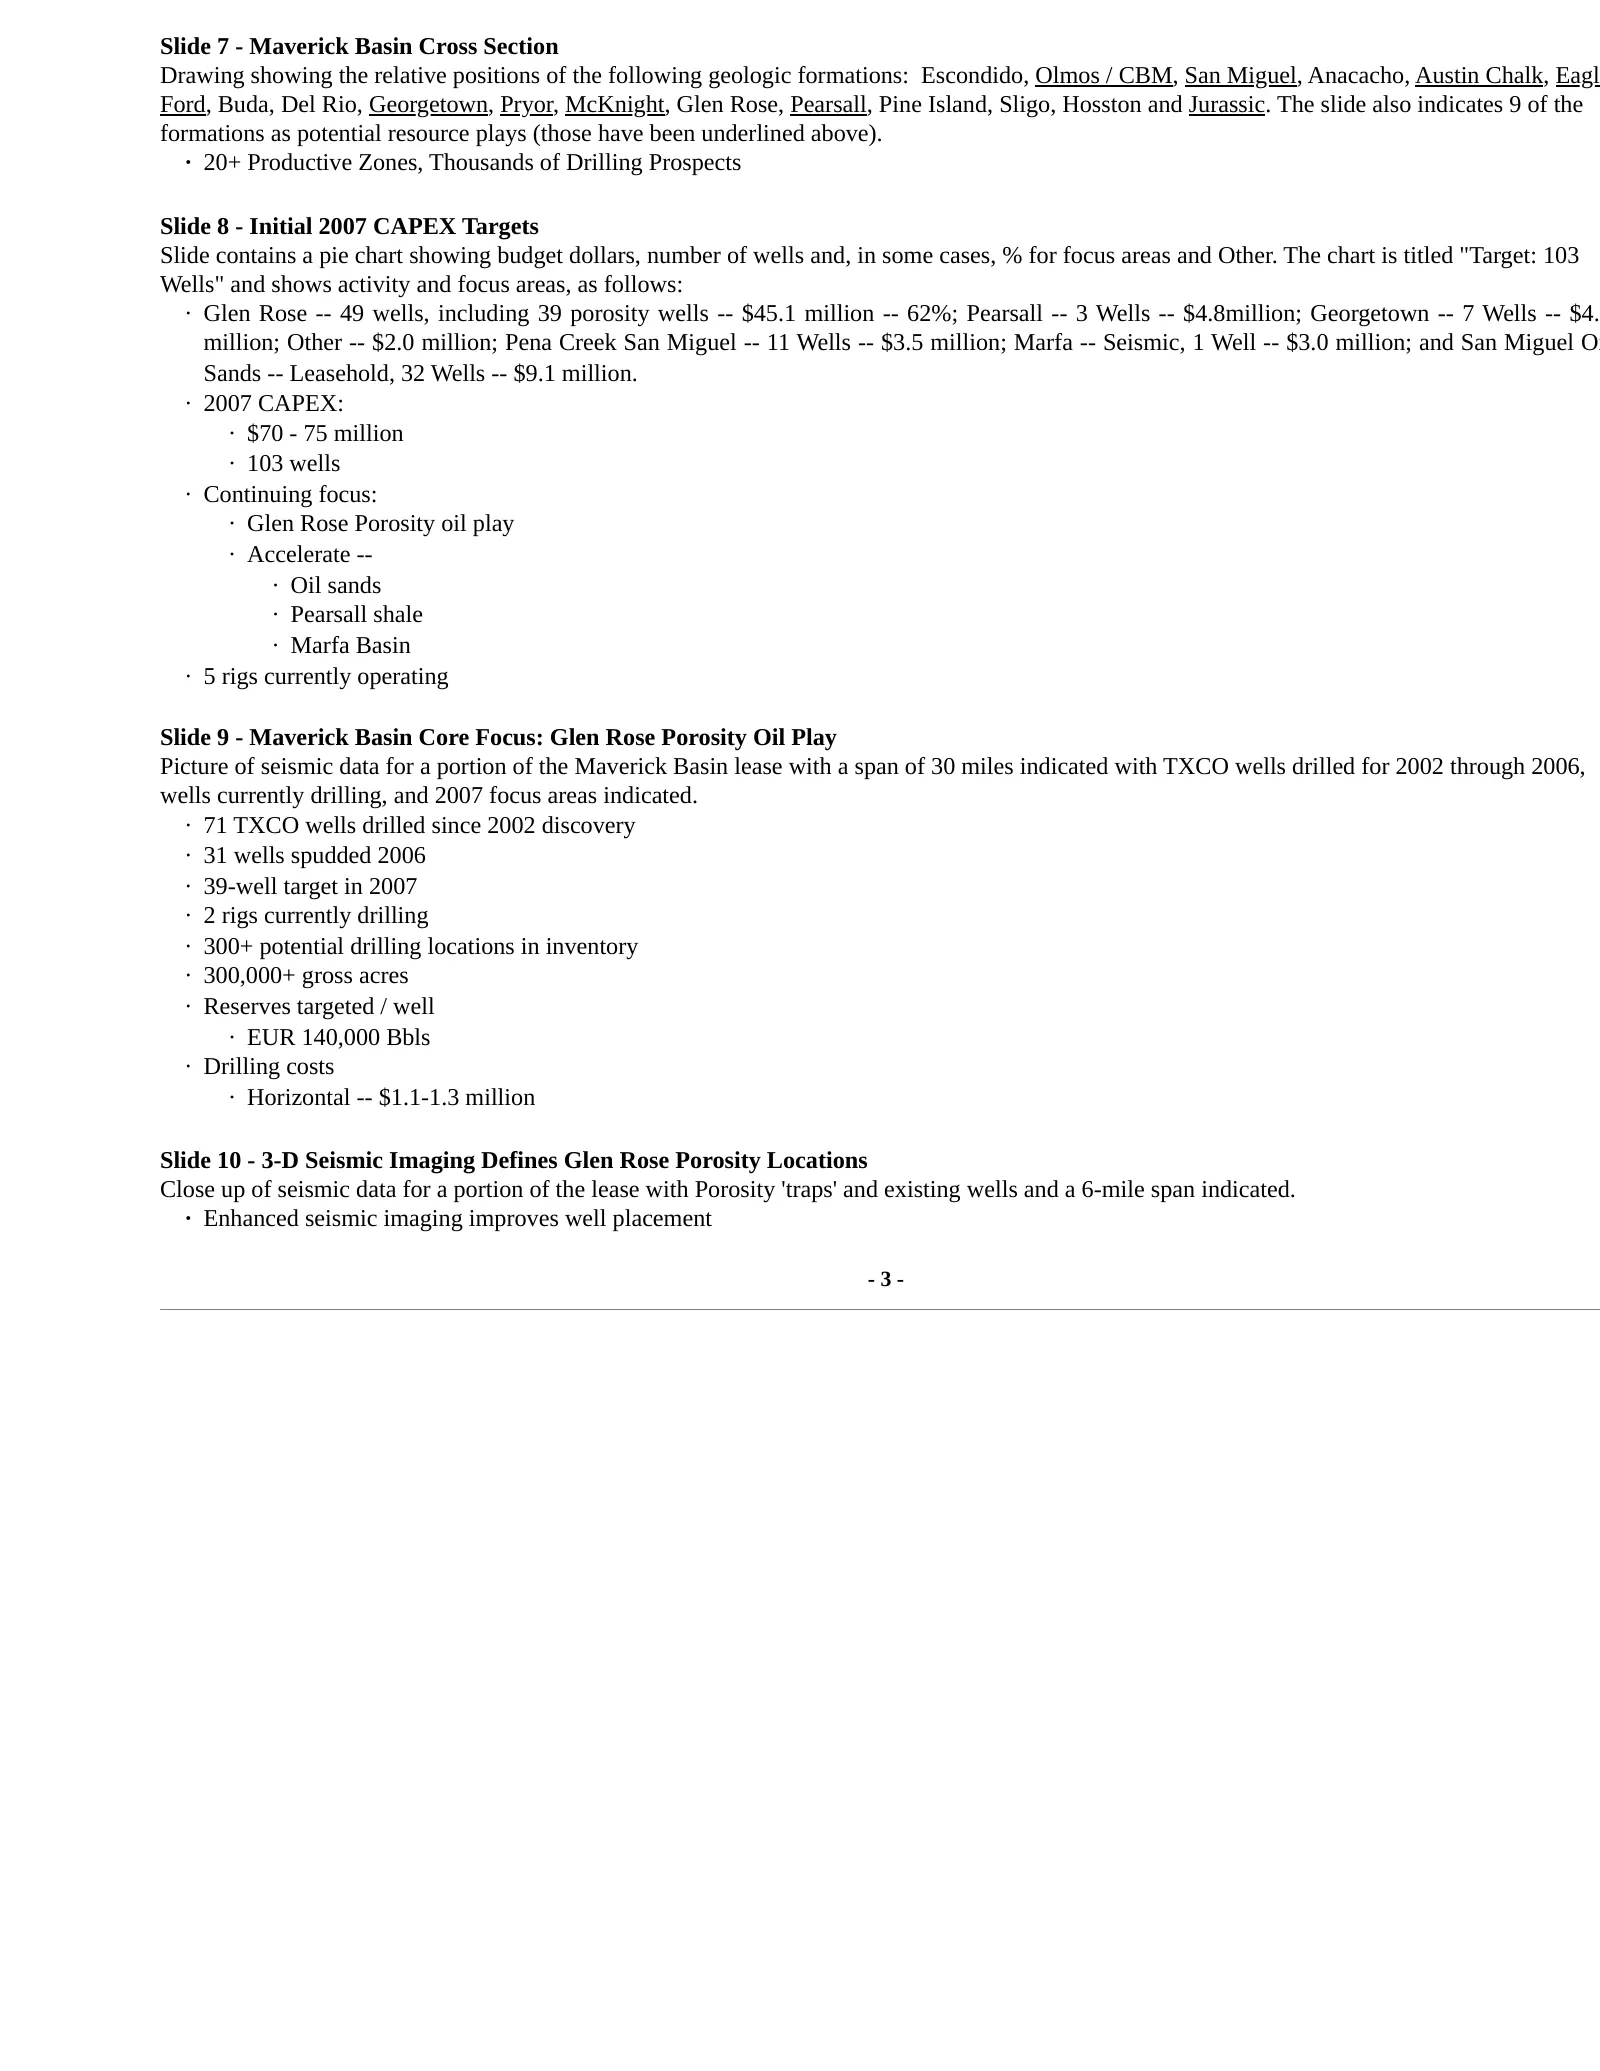
Slide 7 - Maverick Basin Cross Section Drawing showing the relative positions of the following geologic formations: Escondido, Olmos / CBM, San Miguel, Anacacho, Austin Chalk, Eagl Ford, Buda, Del Rio, Georgetown, Pryor, McKnight, Glen Rose, Pearsall, Pine Island, Sligo, Hosston and Jurassic. The sl
Slide 4: Glen Rose Porosity Production Type Curve; Oil & Gas Sales
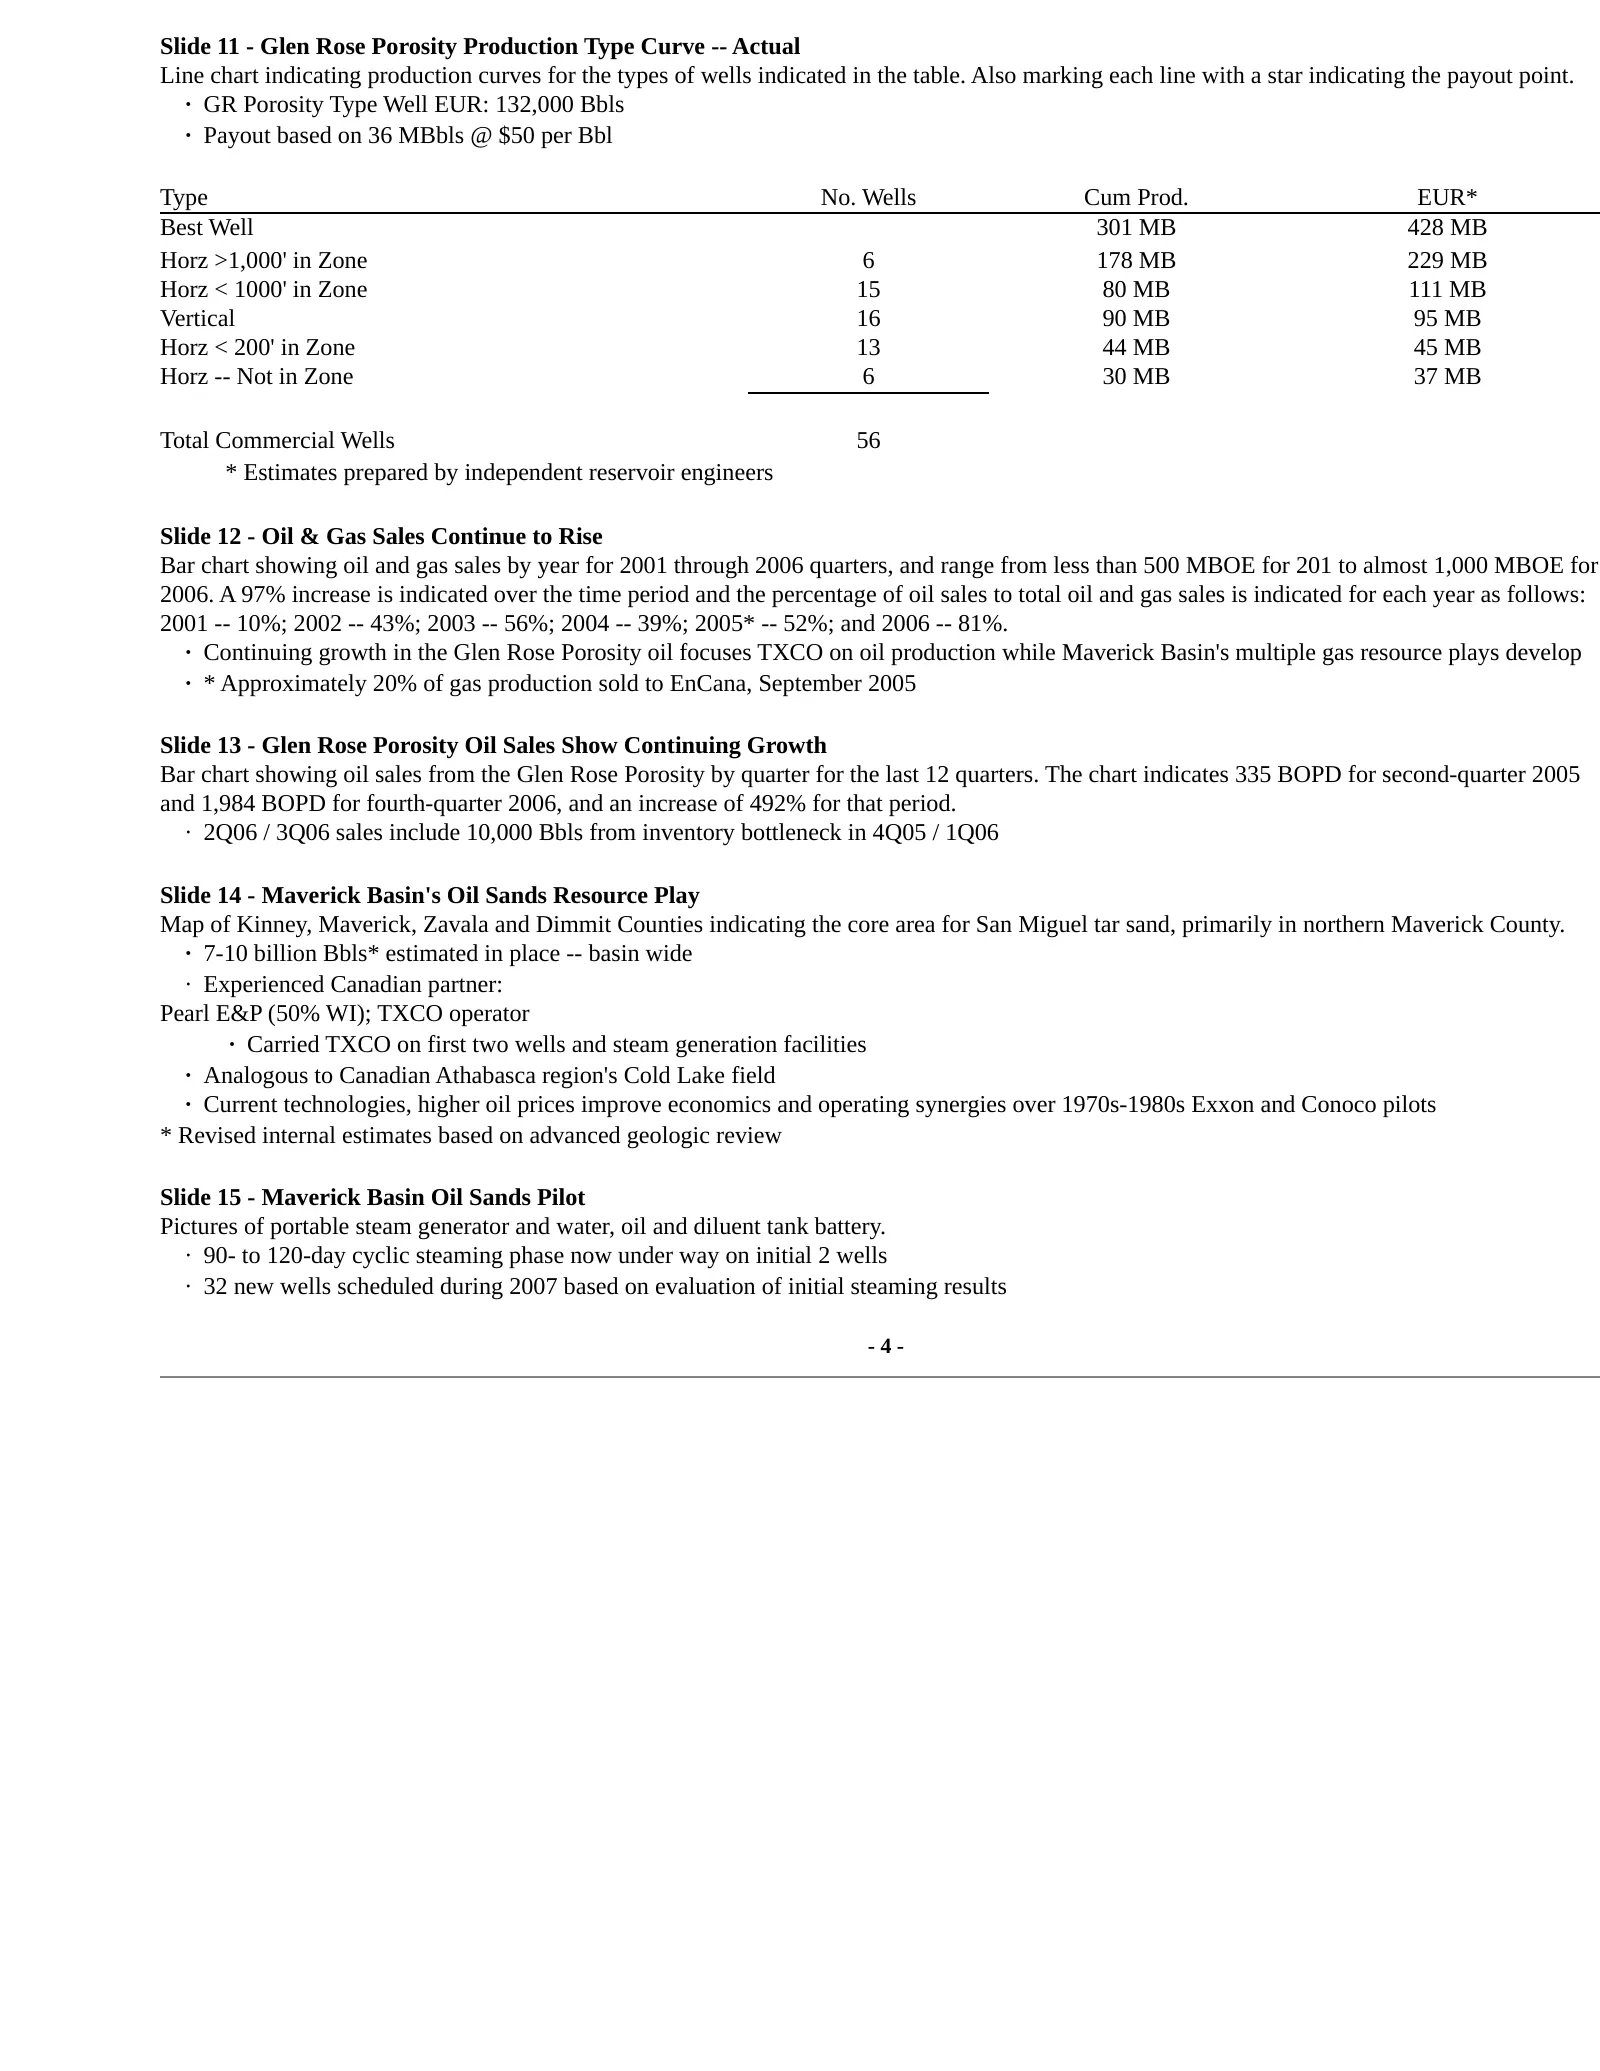
Slide 11 - Glen Rose Porosity Production Type Curve -- Actual Line chart indicating production curves for the types of wells indicated in the table. Also marking each line with a star indicating the payout point. · GR Porosity Type Well EUR: 132,000 Bbls · Payout based on 36 MBbls @ $50 per Bbl Type
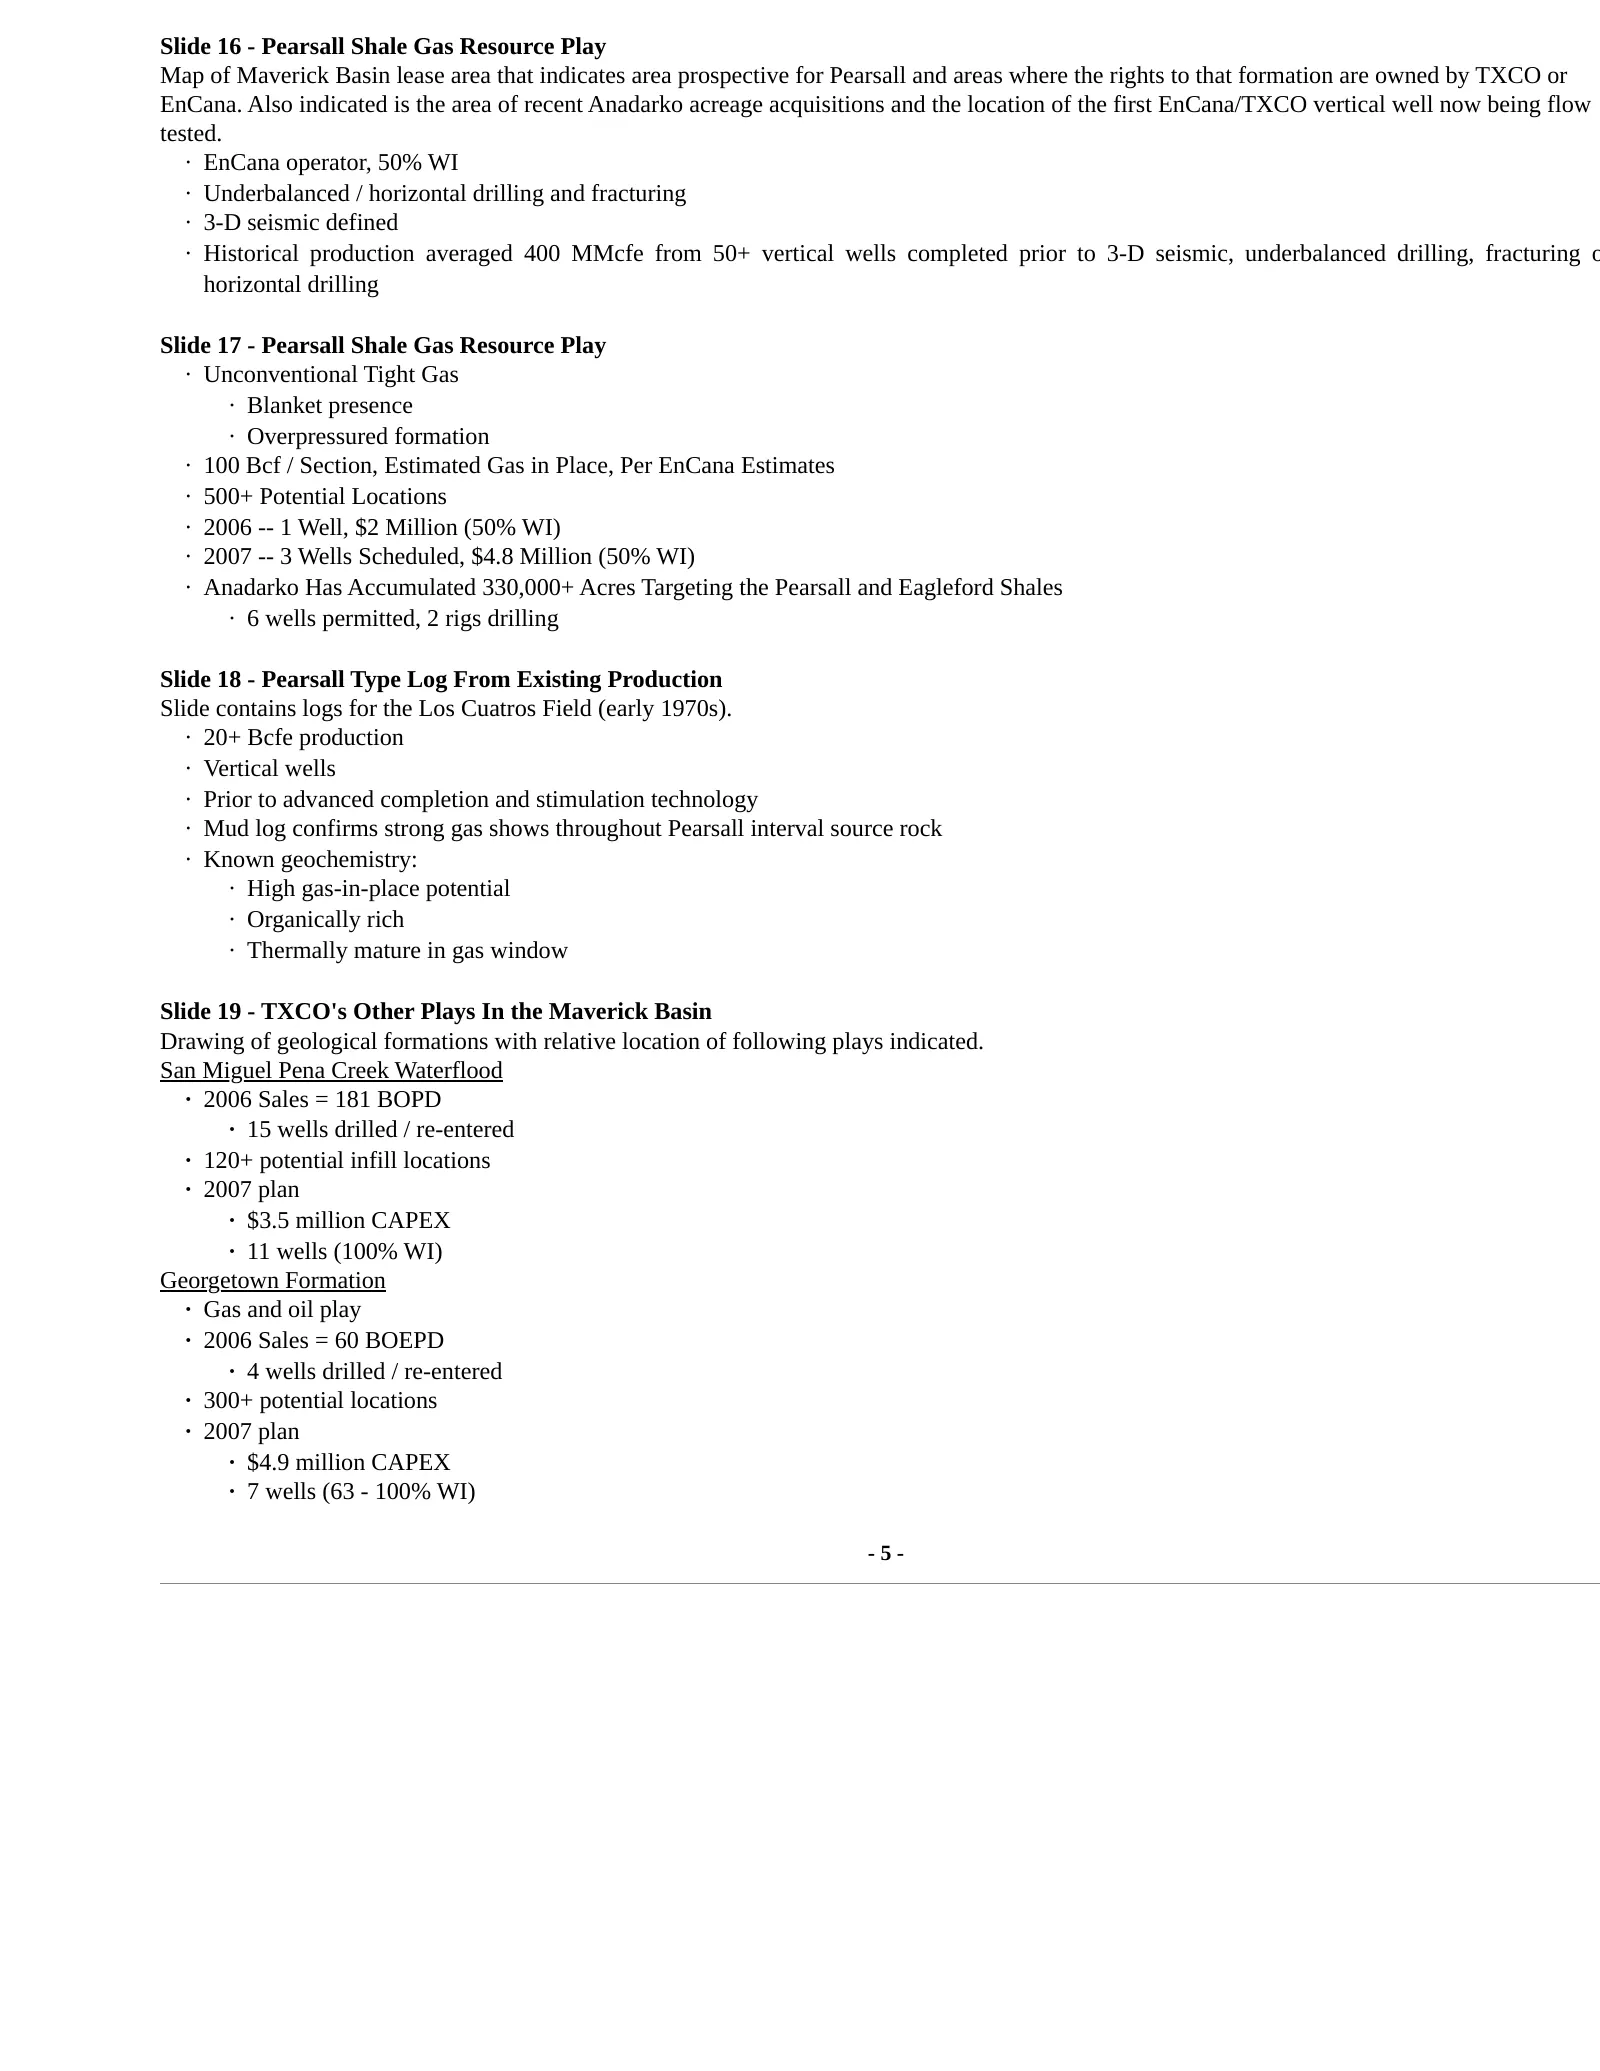
Slide 5: Pearsall Shale Gas Resource Play
Slide 16 - Pearsall Shale Gas Resource Play Map of Maverick Basin lease area that indicates area prospective for Pearsall and areas where the rights to that formation are owned by TXCO or EnCana. Also indicated is the area of recent Anadarko acreage acquisitions and the location of the first EnCana/
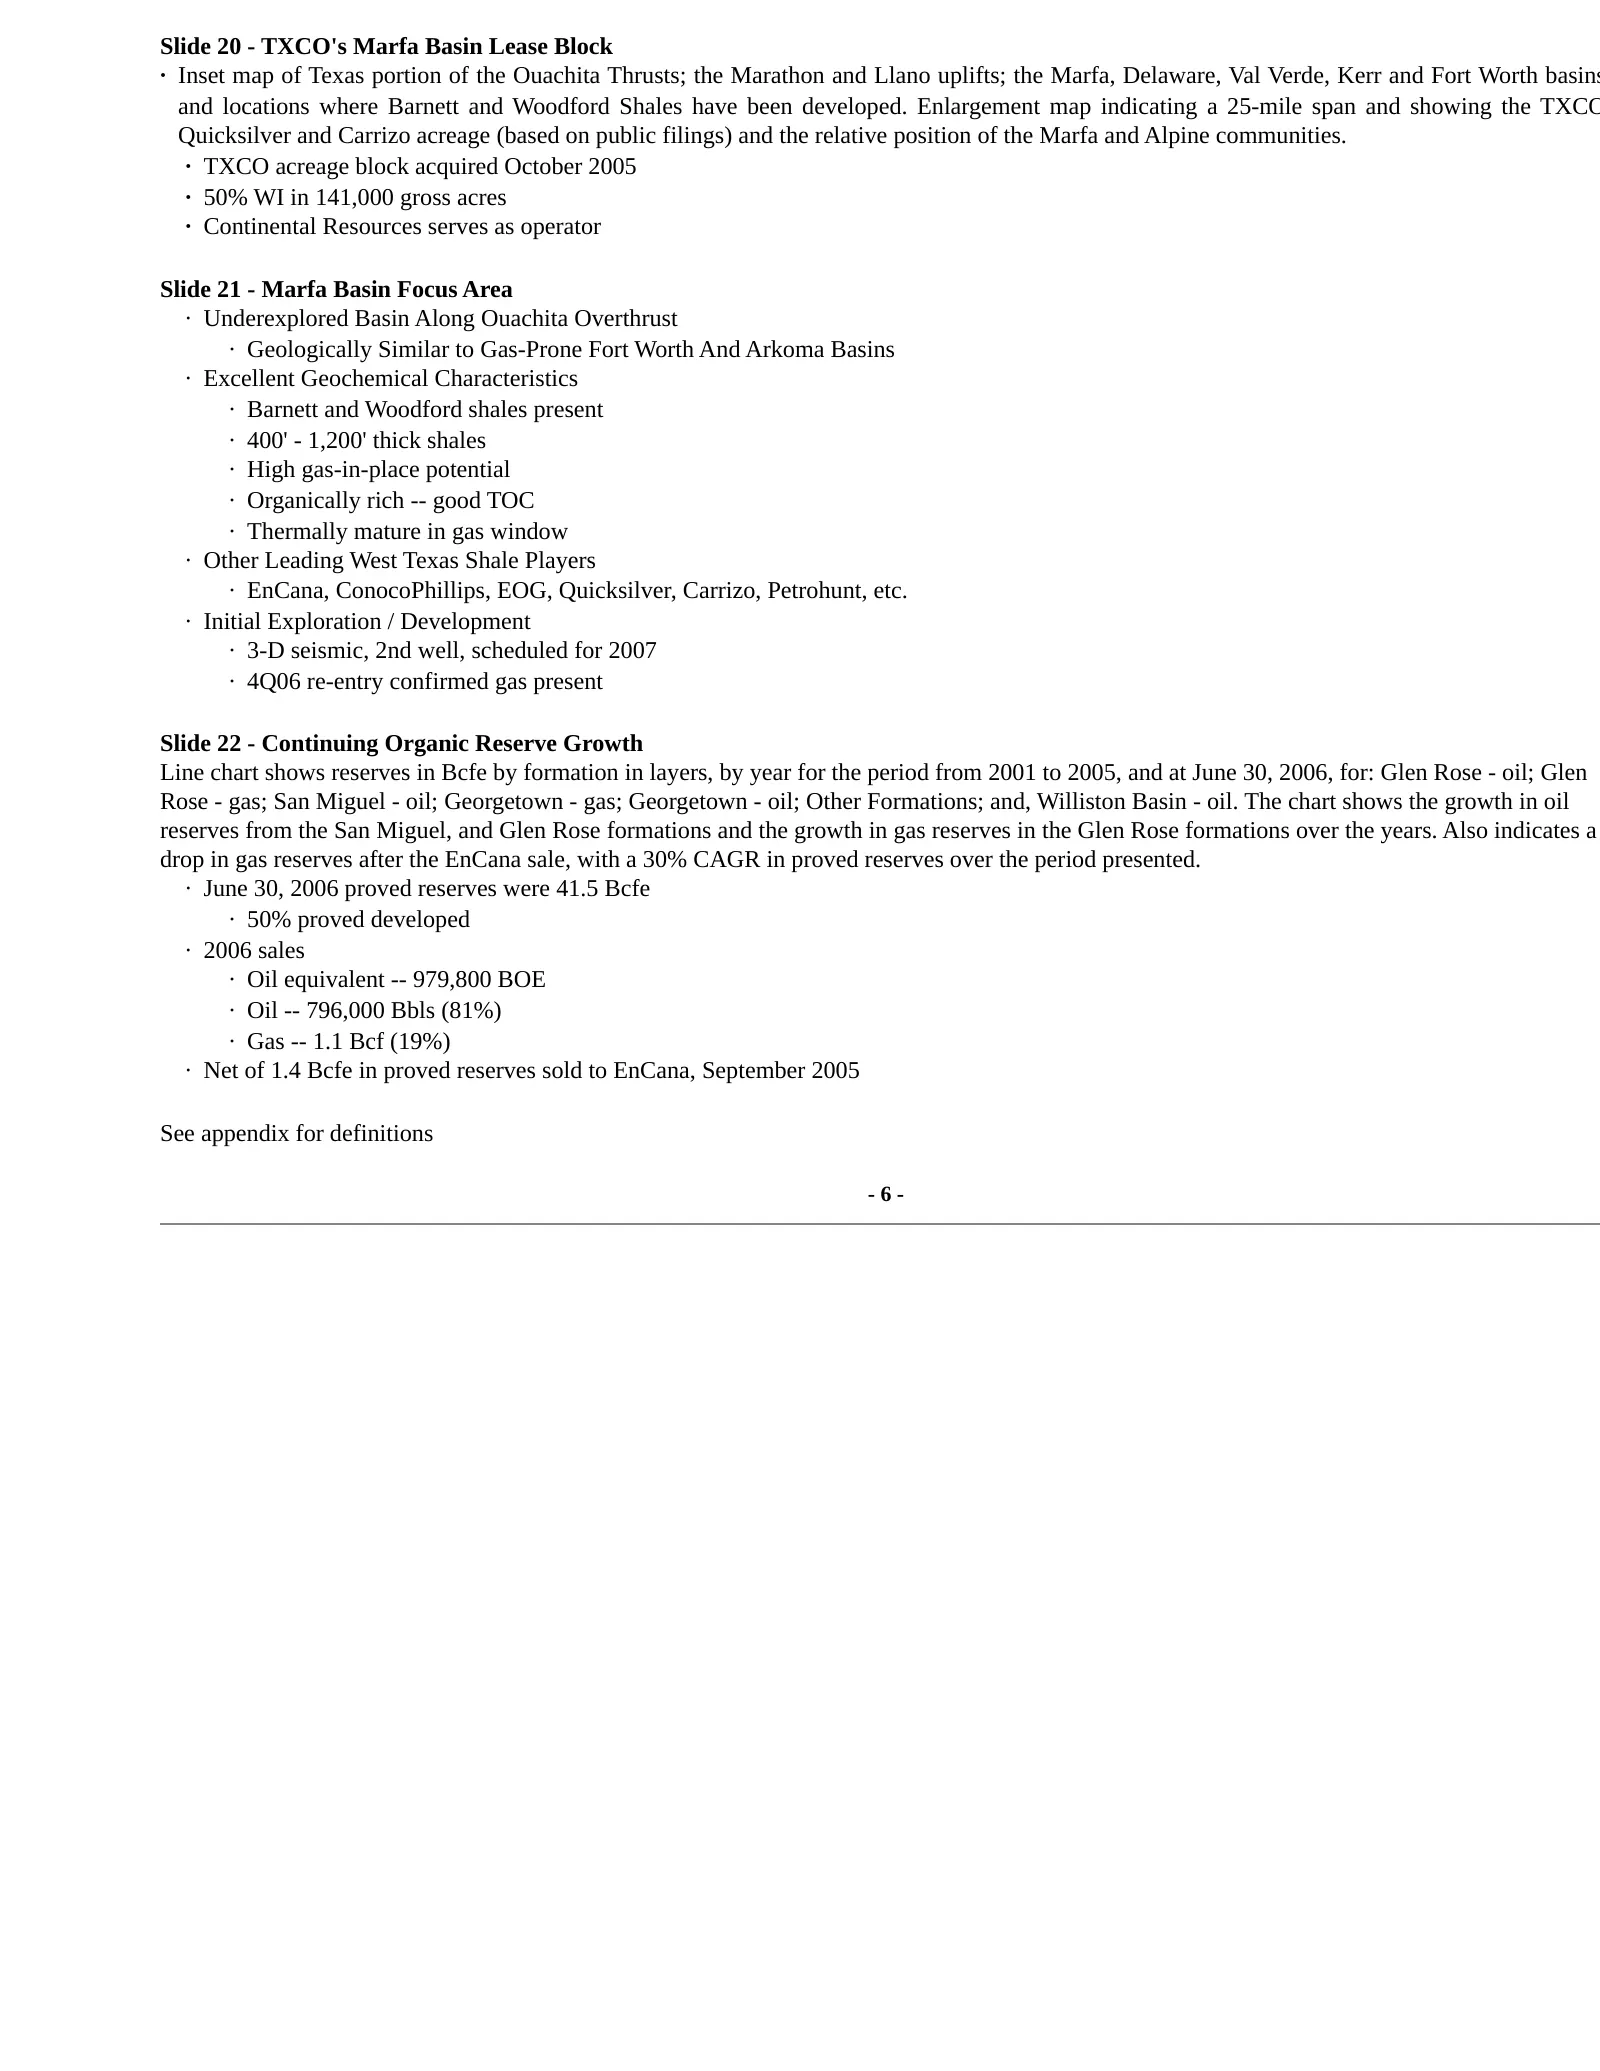
Slide 6: TXCO's Marfa Basin Lease Block
Slide 20 - TXCO's Marfa Basin Lease Block · Inset map of Texas portion of the Ouachita Thrusts; the Marathon and Llano uplifts; the Marfa, Delaware, Val Verde, Kerr and Fort Worth basins and locations where Barnett and Woodford Shales have been developed. Enlargement map indicating a 25-mile span an
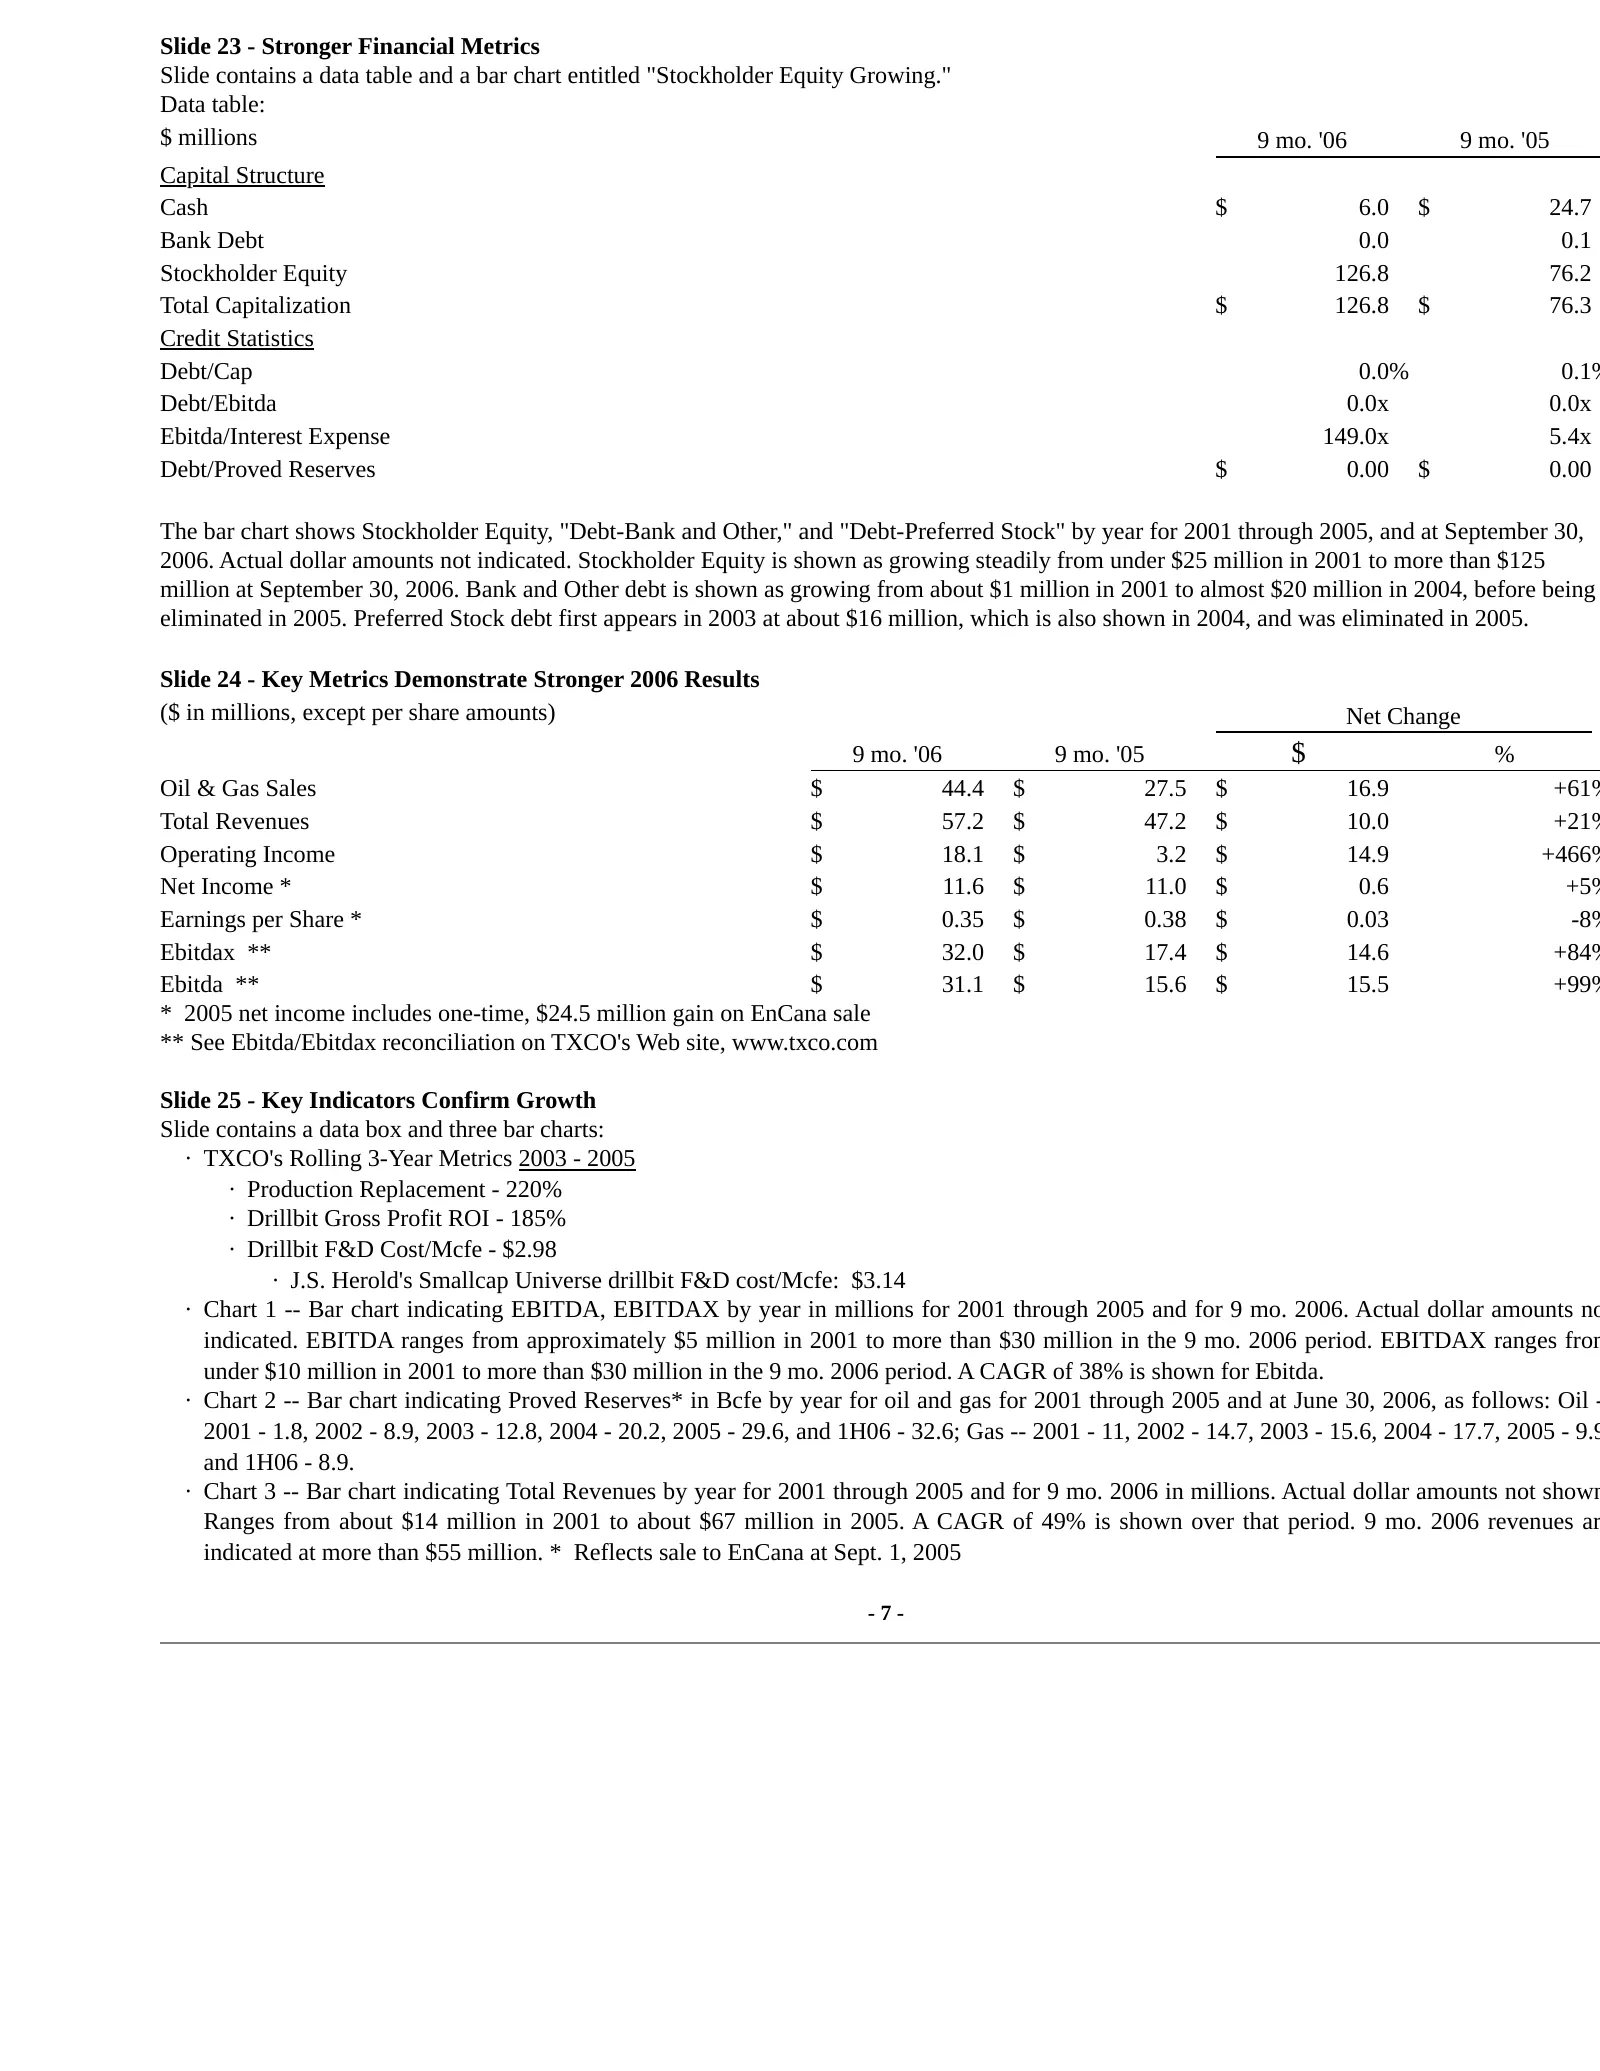
Slide 7: Stronger Financial Metrics
Slide 23 - Stronger Financial Metrics Slide contains a data table and a bar chart entitled "Stockholder Equity Growing." Data table: $ millions 9 mo. '06 9 mo. '05 Capital Structure Cash $ 6.0 $ 24.7 Bank Debt 0.0 0.1 Stockholder Equity 126.8 76.2 Total Capitalization $ 126.8 $ 76.3 Credit Statistic
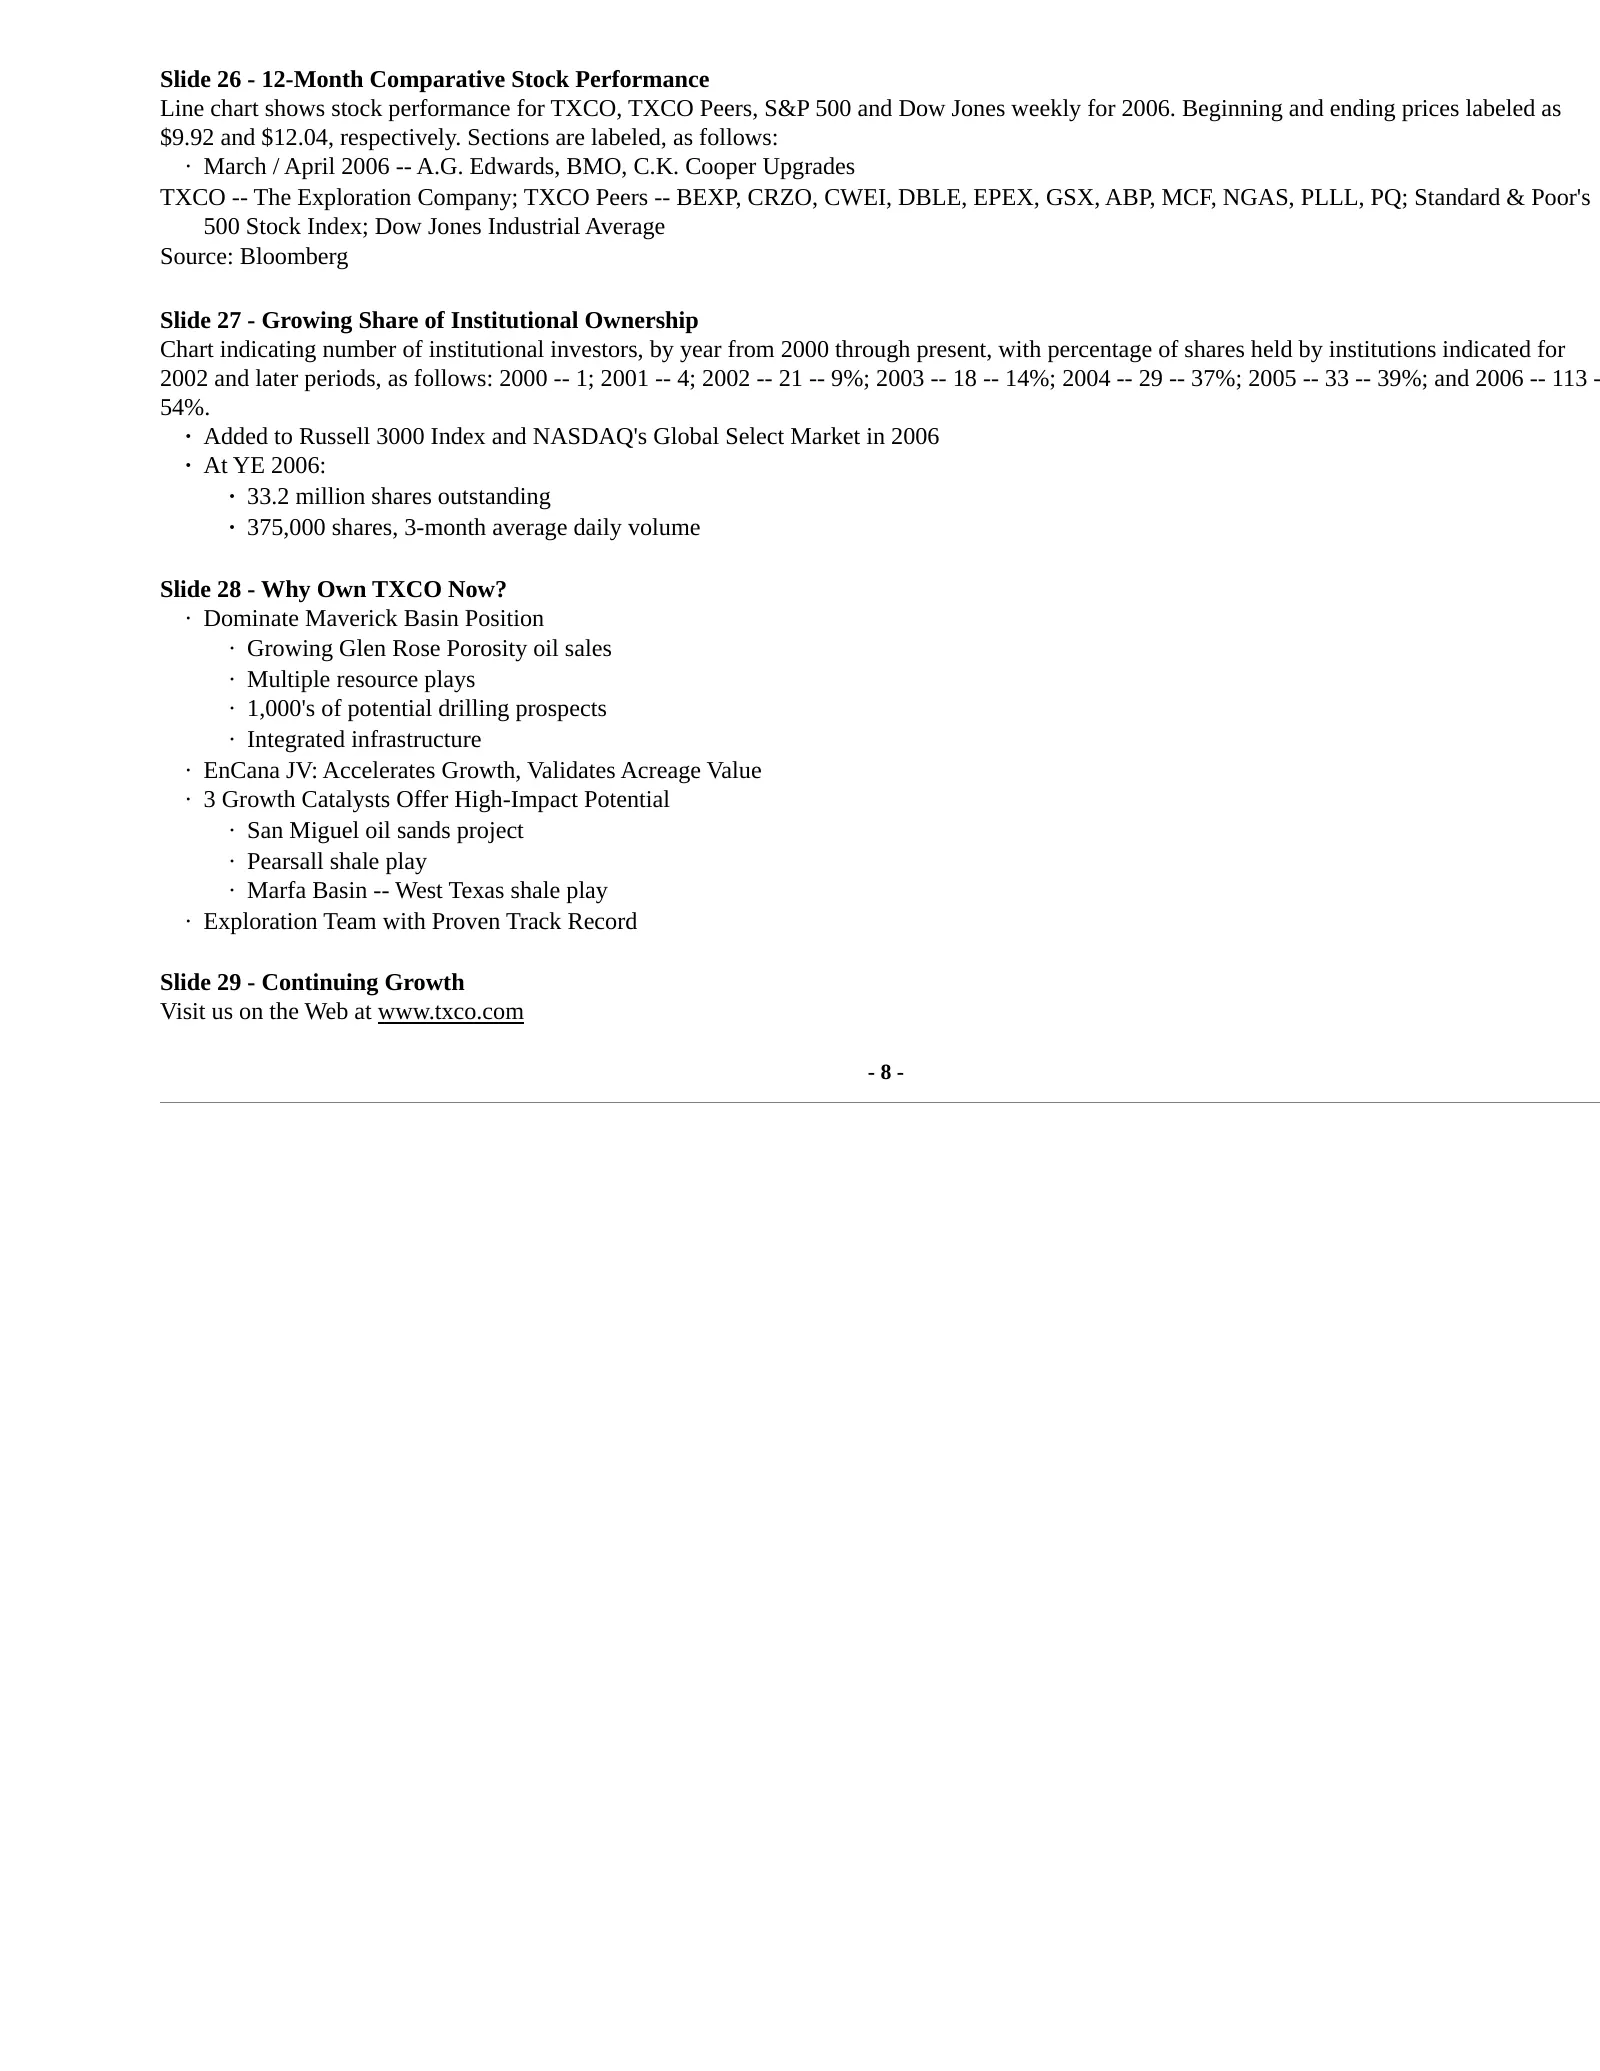
Slide 8: 12-Month Comparative Stock Performance
Slide 26 - 12-Month Comparative Stock Performance Line chart shows stock performance for TXCO, TXCO Peers, S&P 500 and Dow Jones weekly for 2006. Beginning and ending prices labeled as $9.92 and $12.04, respectively. Sections are labeled, as follows: · March / April 2006 -- A.G. Edwards, BMO, C.K. C
Slide 9: Appendix
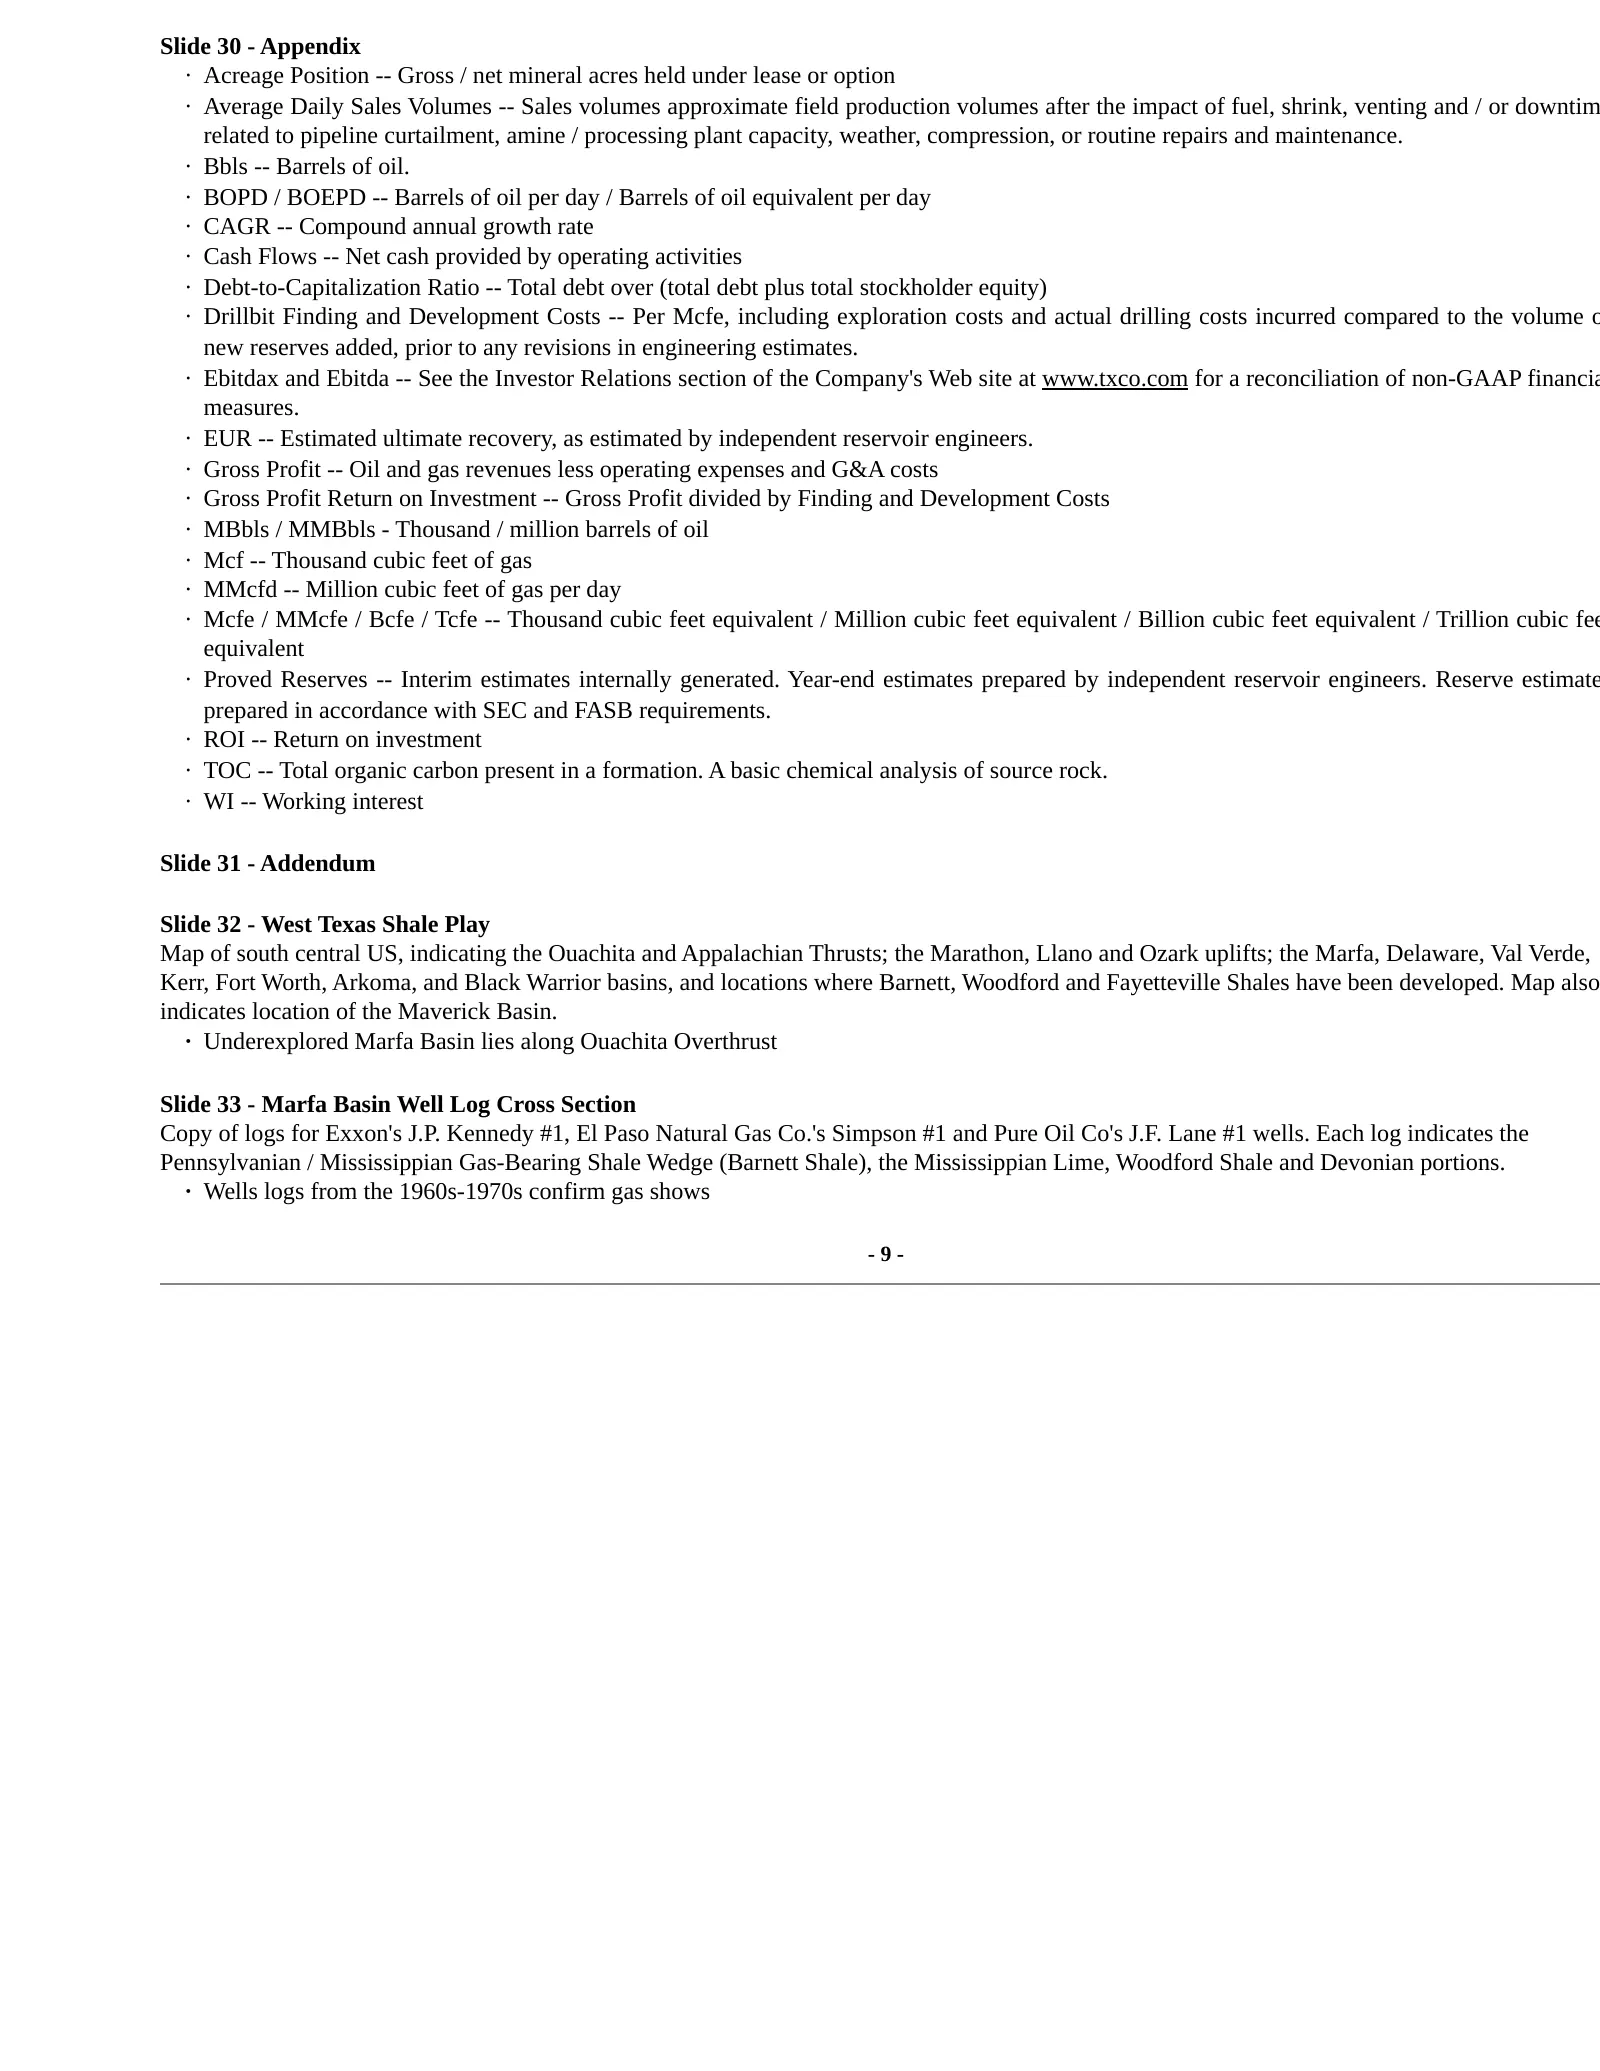
Slide 30 - Appendix · Acreage Position -- Gross / net mineral acres held under lease or option · Average Daily Sales Volumes -- Sales volumes approximate field production volumes after the impact of fuel, shrink, venting and / or downtim related to pipeline curtailment, amine / processing plant capa

Slide 10
Source: SEC EDGAR · 8-K filed Feb 7, 2007
More decks from TXCO Resources Inc
 IPAA Oil and Gas Investment Symposium 200710 slides · Oct 1, 2007
 Investor Presentation (June 2007)15 slides · Jun 20, 2007
 Exploration Co of Delaware — Shareholder Meeting (May 2007)11 slides · May 16, 2007
 Exploration Co of Delaware — IPAA Oil and Gas Investment Symposium April 200710 slides · Apr 23, 2007
 Exploration Co of Delaware — Howard Weil 35th Annual Energy Conference 200711 slides · Apr 9, 2007
 Exploration Co of Delaware — A.G. Edwards Energy Conference 200712 slides · Mar 20, 2007