Aspen Insurance Holdings Ltd · NYSE:AHL/PE
Aspen Insurance — Investor Presentation (May 2010)
32 slides from Aspen Insurance's investor presentation, May 5, 2010

Slide 1: Aspen Insurance Holdings Limited Investor Presentation
Aspen Insurance Holdings Limited Investor Presentation Chris O'Kane Chief Executive Officer Richard Houghton Chief Financial Officer May 2010
Slide 2: Safe Harbor Disclosure
Safe Harbor Disclosure 2 This slide presentation is for information purposes only. It should be read in conjunction with our financial supplement posted on our website on the Investor Relations page and with other documents filed or to be filed shortly by Aspen Insurance Holdings Limited (the "Compa
Slide 3: Summary
Summary Who we are What we do Industry challenges The Aspen approach Appendix 3
Slide 4: Who We Are
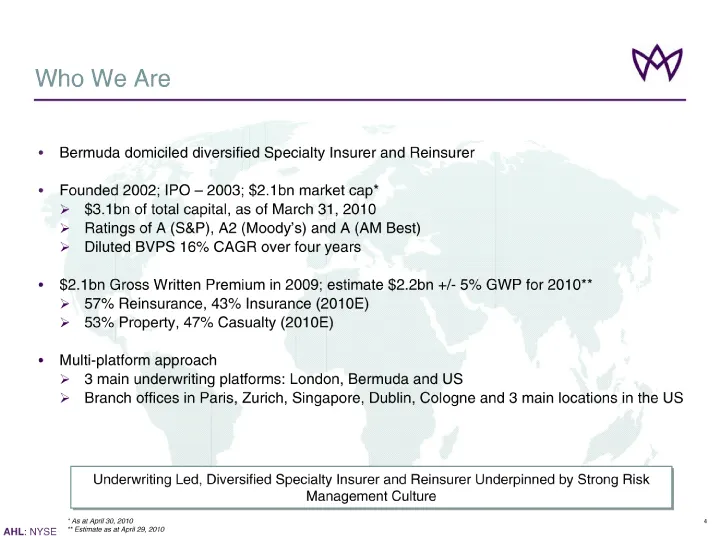
Who We Are Underwriting Led, Diversified Specialty Insurer and Reinsurer Underpinned by Strong Risk Management Culture Bermuda domiciled diversified Specialty Insurer and Reinsurer Founded 2002; IPO - 2003; $2.1bn market cap* $3.1bn of total capital, as of March 31, 2010 Ratings of A (S&P), A2 (Mood
Slide 5: What We Do
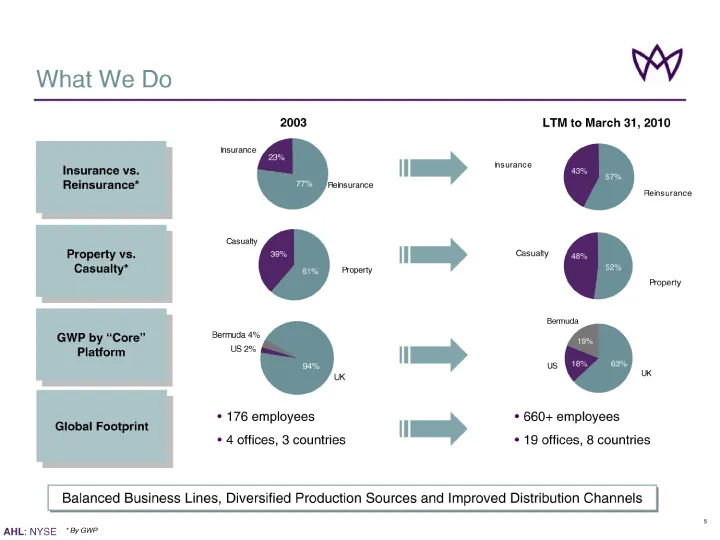
What We Do Insurance vs. Reinsurance* Property vs. Casualty* GWP by "Core" Platform Global Footprint 176 employees 4 offices, 3 countries Balanced Business Lines, Diversified Production Sources and Increased Global Presence * By GWP 42% 19% 43% 5 2003 LTM to March 31, 2010 660+ employees 19 offices,
Slide 6: What We Do: Strategy - Key Elements
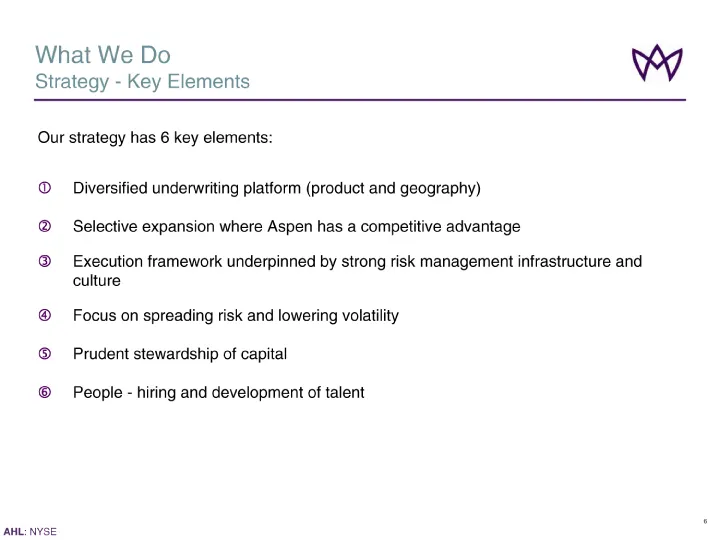
What We Do Strategy - Key Elements 6 Targeting Consistent Quality Returns with Low Volatility Our strategy has 6 key elements: ? Diversified underwriting platform (product and geography) ? Selective expansion where Aspen has a competitive advantage ? Execution framework underpinned by strong risk ma
Slide 7: What We Do: Insurance Overview and Strategy
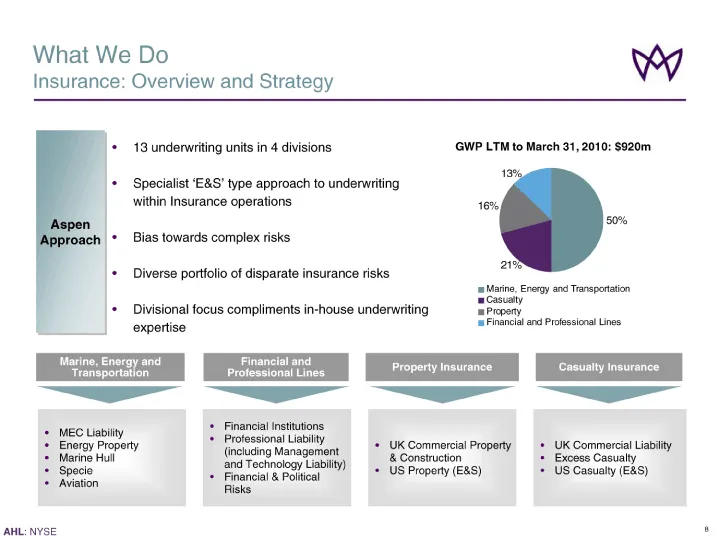
Marine, Energy and Transportation Financial and Professional Lines Property Insurance Casualty Insurance MEC Liability Energy Property Marine Hull Specie Aviation Financial Institutions Professional Liability (including Management and Technology Liability) Financial & Political Risks UK Commercial P
Slide 8: Progressive Diversification of Strategic Footprint
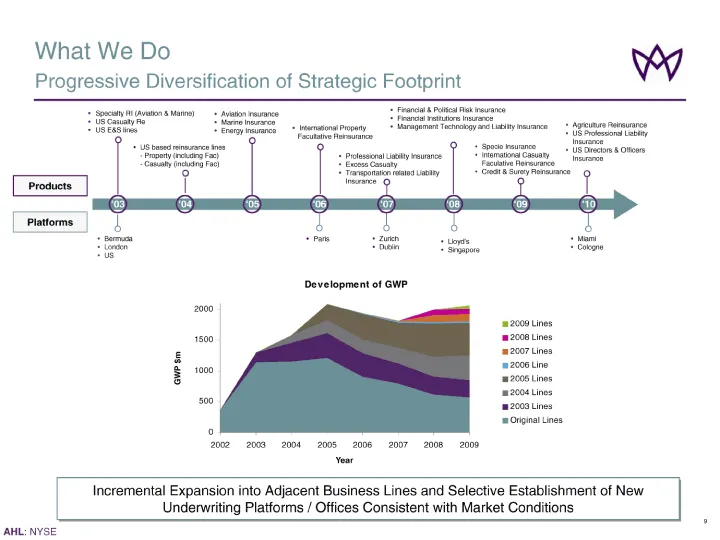
'06 '07 '08 '09 '10 What We Do Progressive Diversification of Strategic Footprint '03 '04 '05 Specialty RI (Aviation & Marine) US Casualty Re US E&S lines Aviation Insurance Marine Insurance Energy Insurance International Property Facultative Reinsurance Professional Liability Insurance Excess Casua
Slide 9: Focus on Growth in BVPS
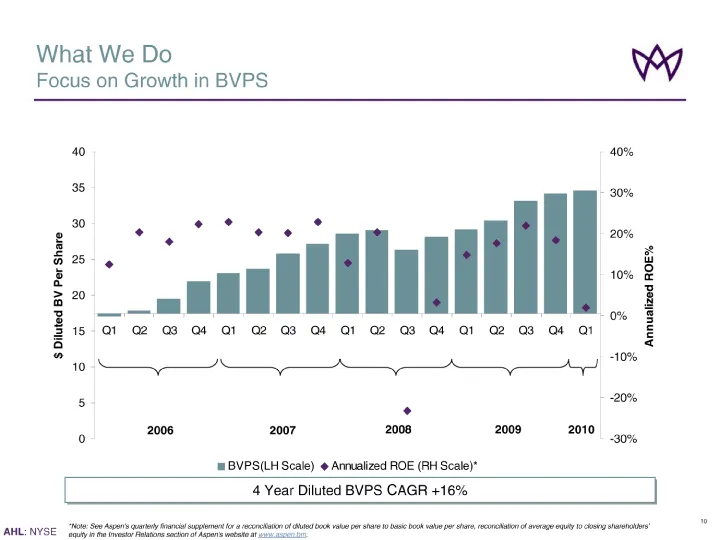
What We Do Focus on Growth in BVPS Diluted Book Value per Share up 19% since March 31, 2009 10 *Note: See Aspen's quarterly financial supplement for a reconciliation of diluted book value per share to basic book value per share, reconciliation of average equity to closing shareholders' equity in the
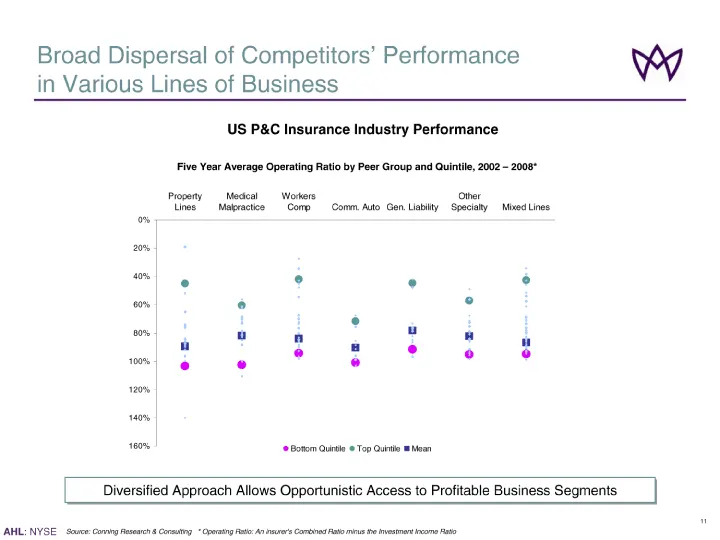
Slide 10: Combined ratios by line: quintile comparison
Top Quintile Mean Bottom Quintile Property Lines 0.452 0.896 1.034 0.187333285 0.190991801 0.516492643 0.518938748 0.649131934 0.64932174 0.741539845 0.746511025 0.754776674 0.765736084 0.837747896 0.840870487 0.842409887 0.84796013 0.863267672 0.863318512 0.870203061 0.873929105 0.879399029 0.87985
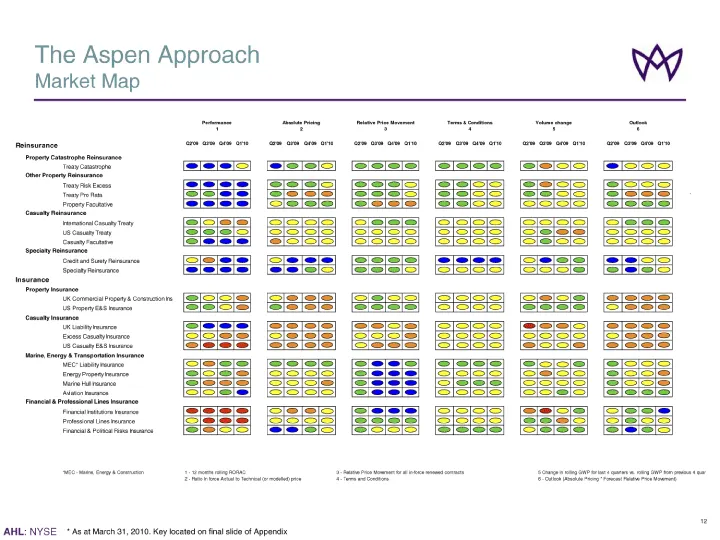
Slide 11: The Aspen Approach: Market Map
* As at March 31, 2010. Key located on final slide of Appendix The Aspen Approach Market Map 13
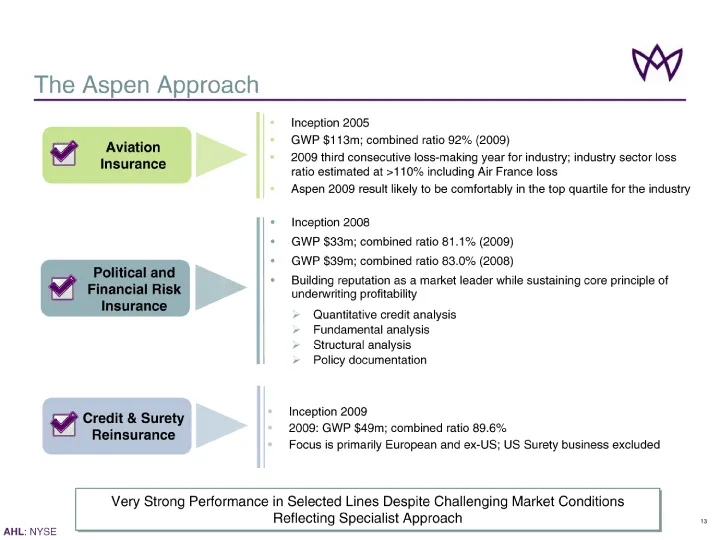
Slide 12: The Aspen Approach: Testing Conventional Wisdom
The Aspen Approach "Testing Conventional Wisdom" Political and Financial Risk Insurance Credit & Surety Reinsurance Inception 2008 GWP $33m; combined ratio 81.1% (2009) GWP $39m; combined ratio 83.0% (2008) Building reputation as a market leader while sustaining core principle of underwriting profit
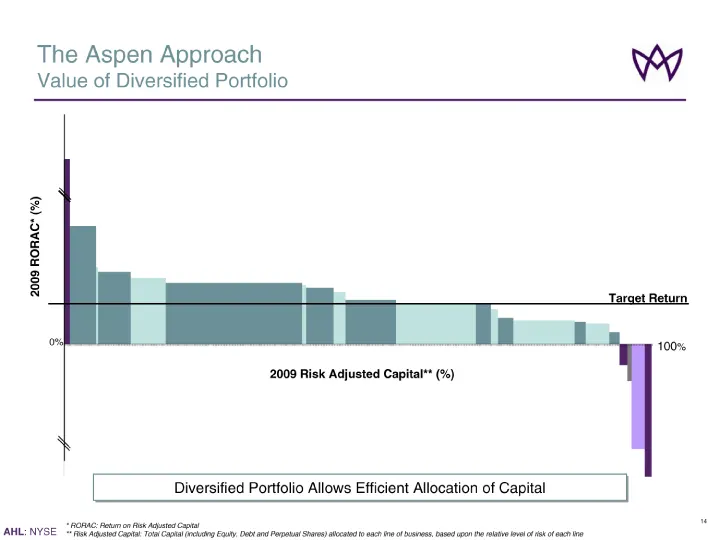
Slide 13: Value of Diversified Portfolio
2009 Risk Adjusted Capital** (%) The Aspen Approach Value of Diversified Portfolio 16 0% Diversified Portfolio Allows Efficient Allocation of Capital Target Return 2009 RORAC* (%) 100% * RORAC: Return on Risk Adjusted Capital ** Risk Adjusted Capital: Total Capital (including Equity, Debt and Perpet
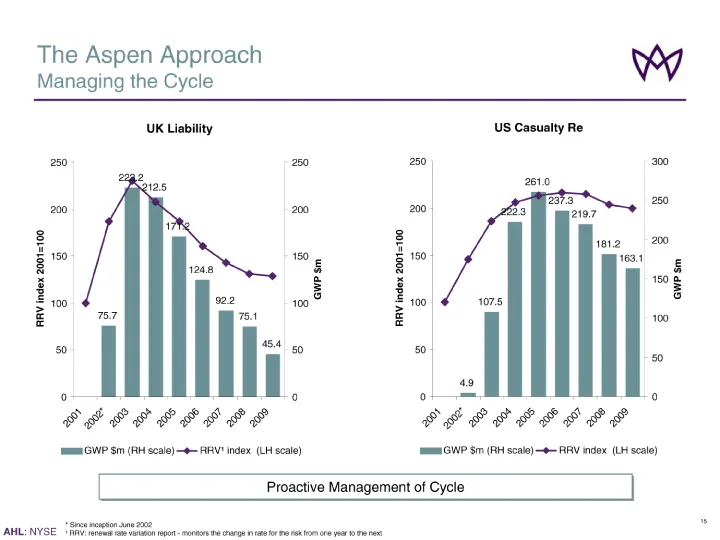
Slide 14: Managing the Cycle
The Aspen Approach Managing the Cycle * Since inception June 2002 1 RRV: renewal rate variation report - monitors the change in rate for the risk from one year to the next 17 Proactive Management of Cycle UK Employers' / Public Liability UK Liability 75.7 223.2 212.5 171.2 124.8 92.2 75.1 45.4 0 50
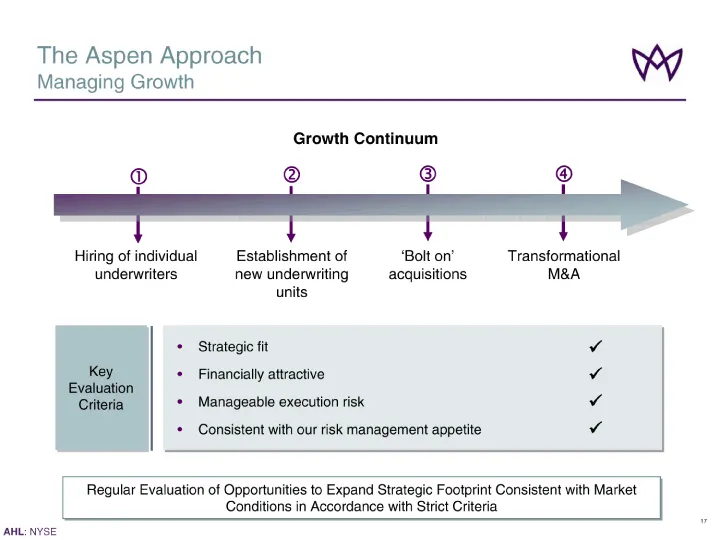
Slide 15: Managing Growth
The Aspen Approach Managing Growth 19 Regular Evaluation of Opportunities to Expand Strategic Footprint Consistent with Market Conditions in Accordance with Strict Criteria Hiring of individual underwriters Establishment of new underwriting units 'Bolt on' acquisitions Transformational M&A Growth Co
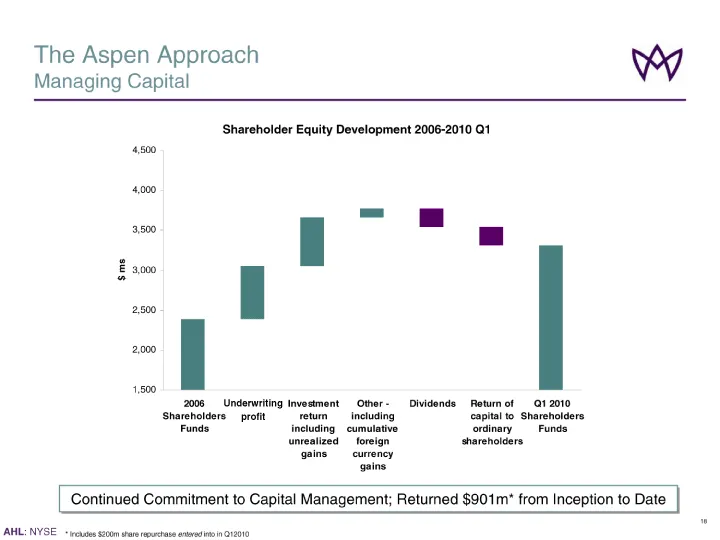
Slide 16: Managing Capital
Premium income Declines Adequate Return on Capital Inadequate Return on Capital Capital Scarcity Excess Capital Capital Declines HARD MARKET SOFT MARKET Premium income Rises Capital Growth Continued Commitment to Capital Management; Returned $901m* from Inception to Date The Aspen Approach Managing
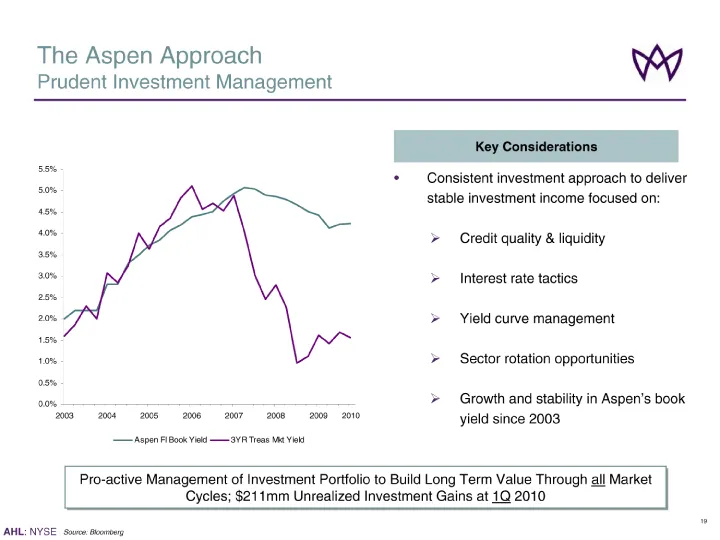
Slide 17: Prudent Investment Management
The Aspen Approach Prudent Investment Management Consistent investment approach to deliver stable investment income focused on: Credit quality & liquidity Interest rate tactics Yield curve management Sector rotation opportunities Growth and stability in Aspen's book yield since 2003 21 Source: Bloom
Slide 18: Delivering Strong Investment Returns
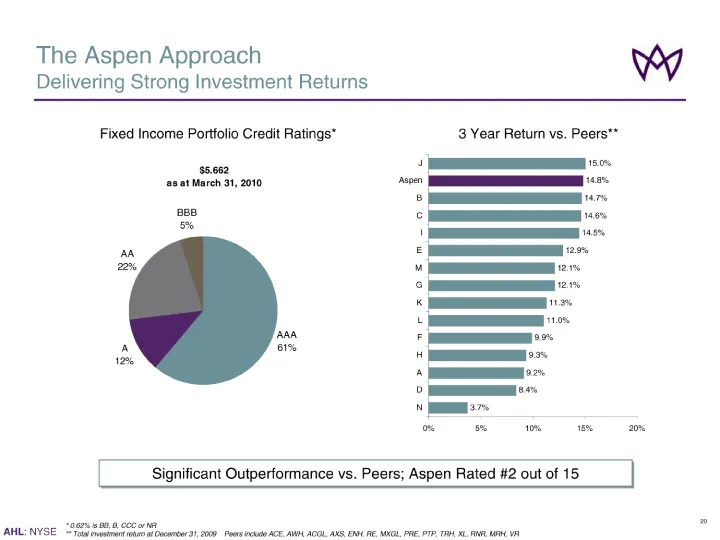
The Aspen Approach Delivering Strong Investment Returns 3 Year Return vs. Peers** Fixed Income Portfolio Credit Ratings* 22 * 0.62% is BB, B, CCC or NR ** Total investment return at December 31, 2009 Peers include ACE, AWH, ACGL, AXS, ENH, RE, MXGL, PRE, PTP, TRH, XL, RNR, MRH, VR Significant Outper
Slide 19: Delivering Growth in Diluted BVPS
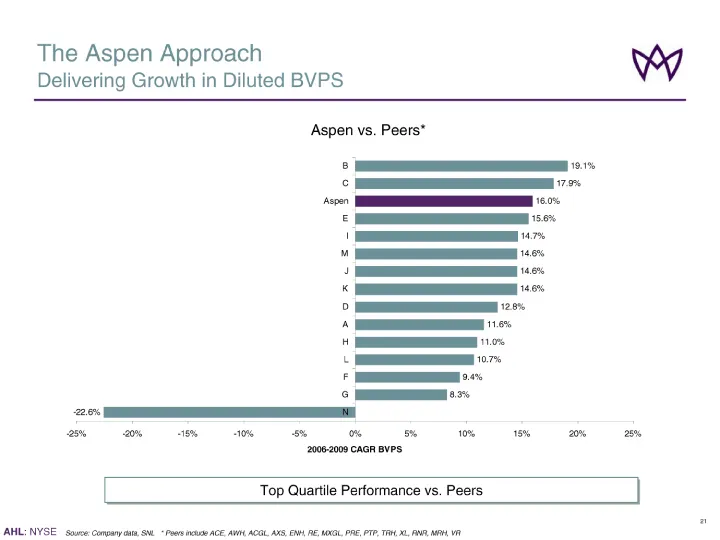
The Aspen Approach Delivering Growth in Diluted BVPS Source: Company data, SNL * Peers include ACE, AWH, ACGL, AXS, ENH, RE, MXGL, PRE, PTP, TRH, XL, RNR, MRH, VR 23 Aspen vs. Peers* Top Quartile Performance vs. Peers
Slide 20: Delivering Growth with Low Volatility
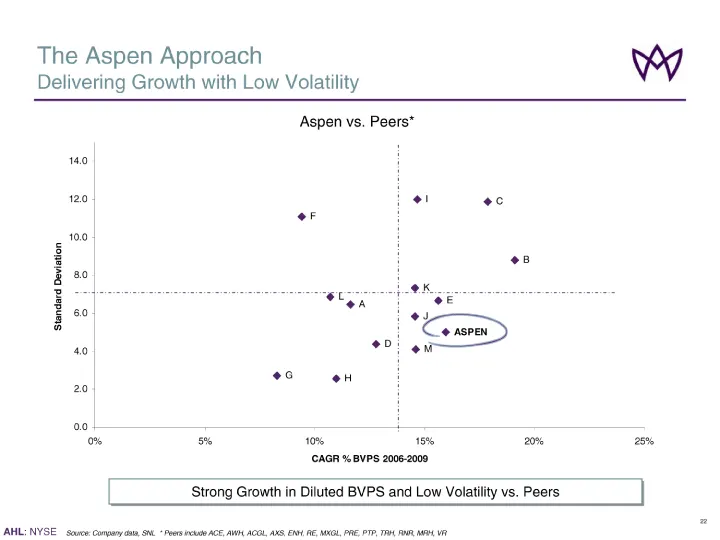
The Aspen Approach Delivering Growth with Low Volatility Source: Company data, SNL * Peers include ACE, AWH, ACGL, AXS, ENH, RE, MXGL, PRE, PTP, TRH, RNR, MRH, VR 24 Aspen vs. Peers* Strong Growth in Diluted BVPS and Low Volatility vs. Peers
Slide 21: 2010 Guidance
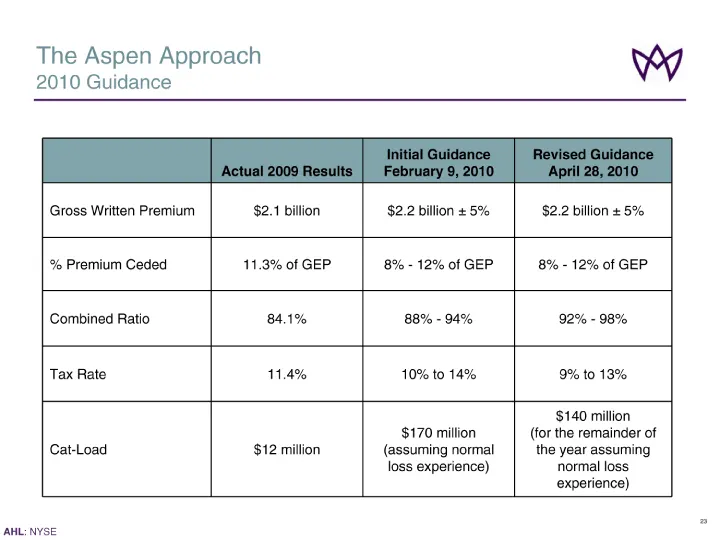
The Aspen Approach 2010 Guidance Actual 2009 Results Initial Guidance February 9, 2010 Revised Guidance April 28, 2010 Gross Written Premium $2.1 billion $2.2 billion +- 5% $2.2 billion +- 5% % Premium Ceded 11.3% of GEP 8% - 12% of GEP 8% - 12% of GEP Combined Ratio 84.1% 88% - 94% 92% - 98% Tax Ra
Slide 22: Conclusions
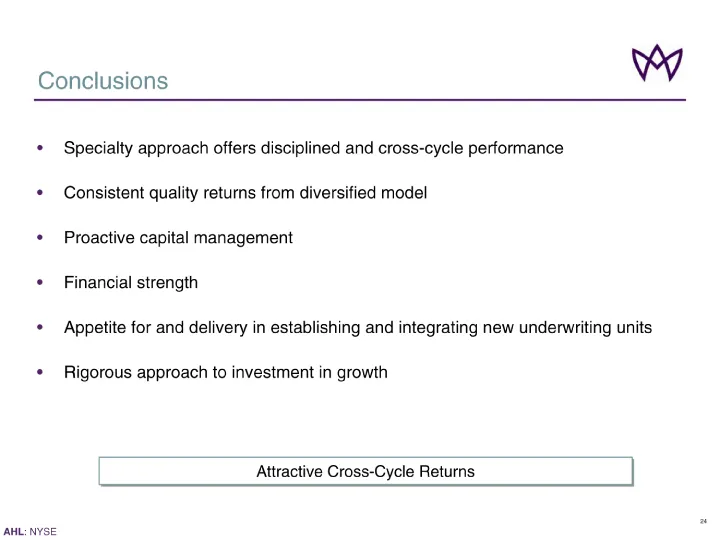
Conclusions Specialty approach offers disciplined and cross-cycle performance Consistent quality returns from diversified model Proactive capital management Financial strength Appetite for and delivery in establishing and integrating new underwriting units Rigorous approach to investment in growth 2
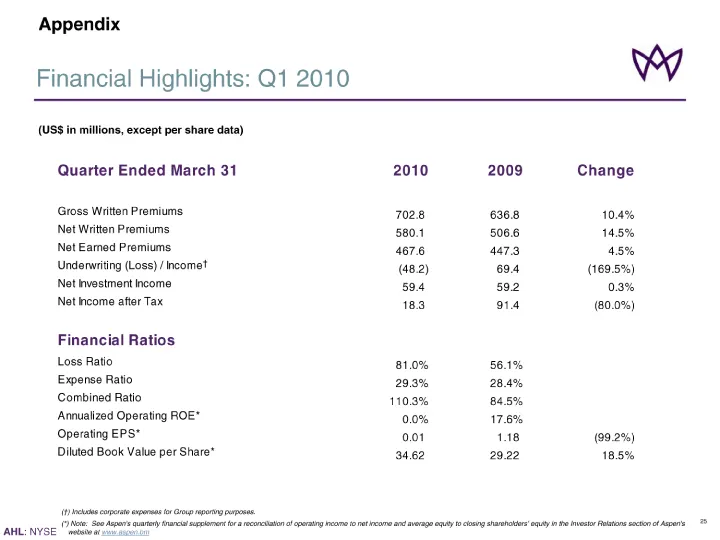
Slide 23: Financial Highlights: Q1 2010
Financial Highlights: Q1 2010 (US$ in millions, except per share data) (*) Note: See Aspen's quarterly financial supplement for a reconciliation of operating income to net income and average equity to closing shareholders' equity in the Investor Relations section of Aspen's website at www.aspen.bm †
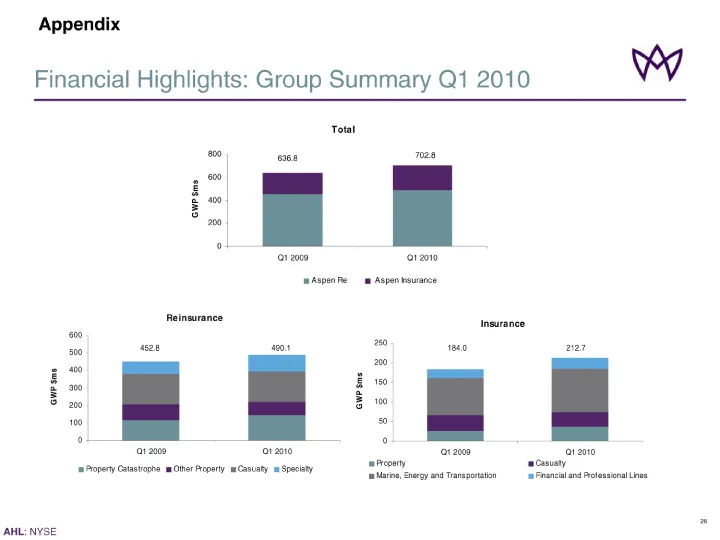
Slide 24: Financial Highlights: Group Summary Q1 2010
Financial Highlights: Group Summary Q1 2010 Financial Highlights: Group Summary Q1 2010 Financial Highlights: Group Summary Q1 2010 Appendix
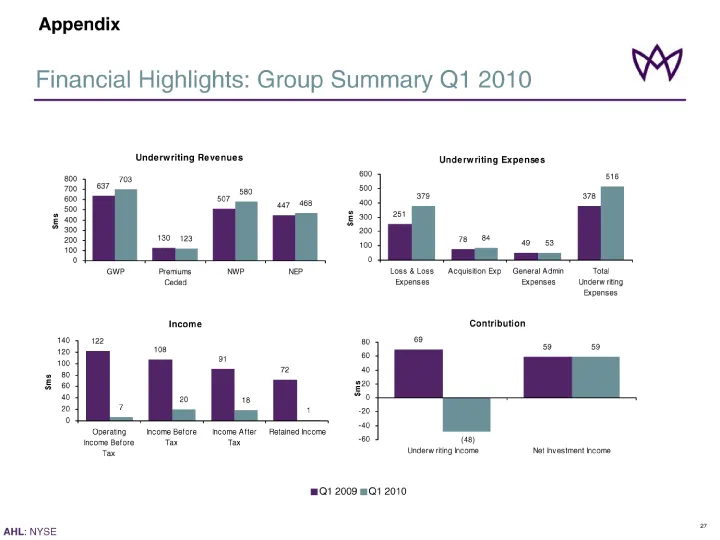
Slide 25: Financial Highlights: Group Summary Q1 2010
Financial Highlights: Group Summary Q1 2010 Q1 2009 Q1 2010 Appendix 29
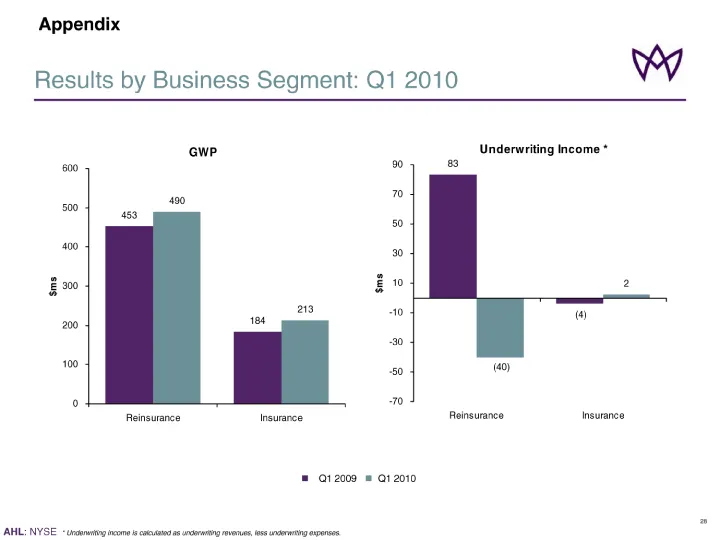
Slide 26: Results by Business Segment: Q1 2010
Results by Business Segment: Q1 2010 * Underwriting income is calculated as underwriting revenues, less underwriting expenses. n Q1 2009 n Q1 2010 Appendix 30
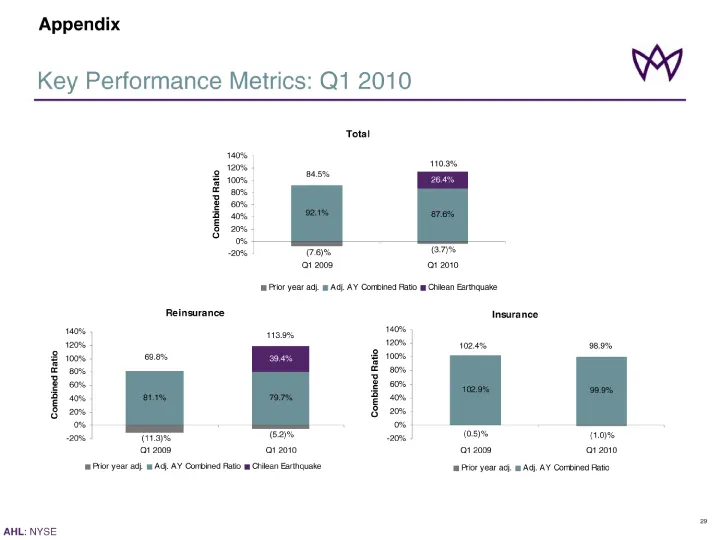
Slide 27: Key Performance Metrics: Q1 2010
Key Performance Metrics: Q1 2010 * * Appendix
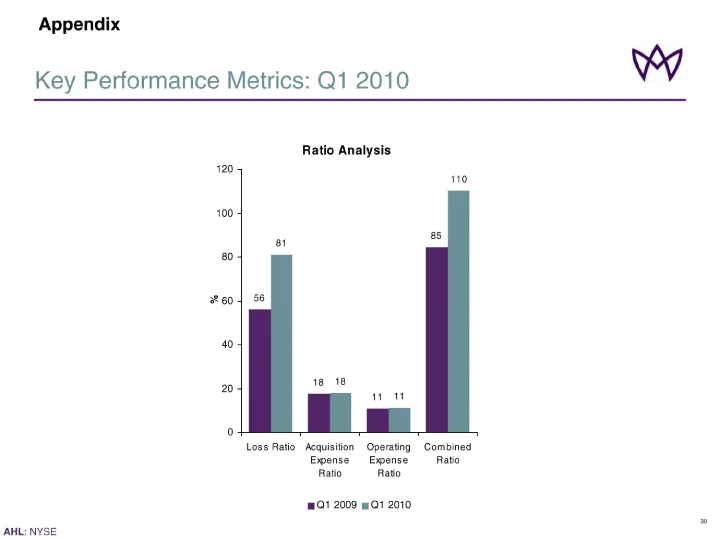
Slide 28: Key Performance Metrics: Q1 2010
Key Performance Metrics: Q1 2010 * Appendix 32
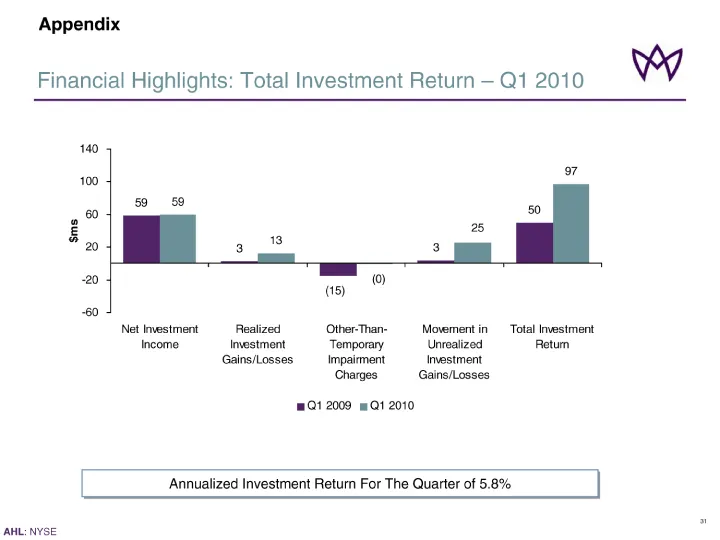
Slide 29: Financial Highlights: Total Investment Return - Q1 2010
Financial Highlights: Total Investment Return - Q1 2010 Annualized Investment Return For The Quarter of 5.8% Appendix 33
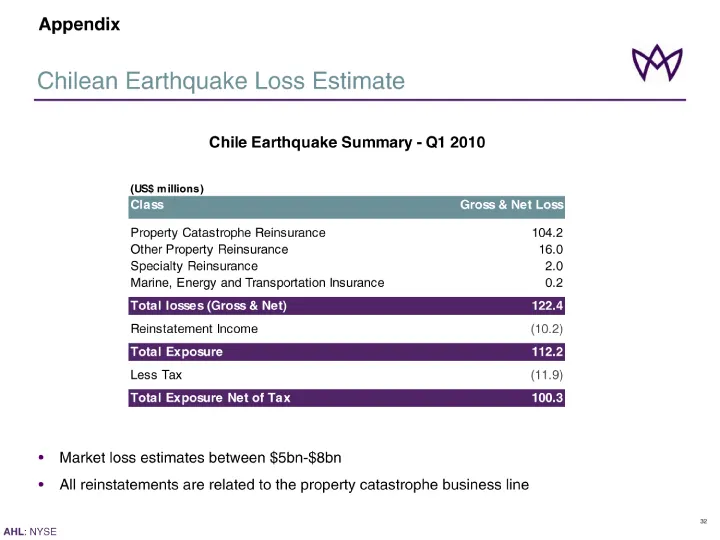
Slide 30: Chilean Earthquake Loss Estimate
Chilean Earthquake Loss Estimate Market loss estimates between $5bn-$8bn All reinstatements are related to the property catastrophe business line Appendix
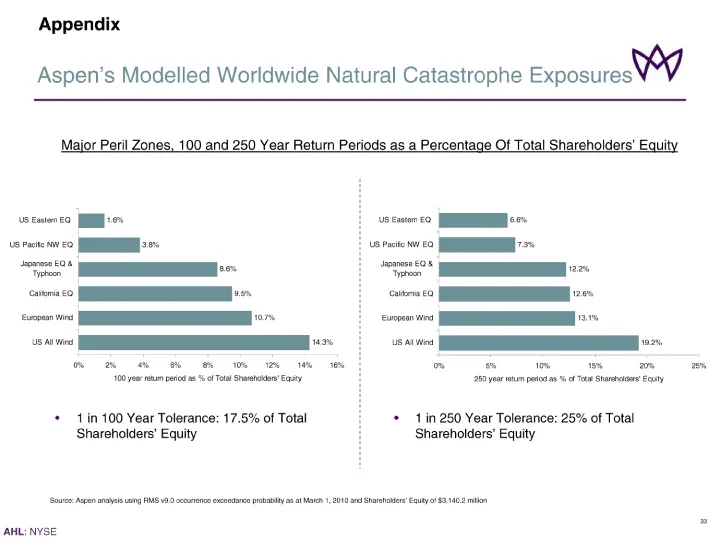
Slide 31: Aspen's Modelled Worldwide Natural Catastrophe Exposures
Aspen's Modelled Worldwide Natural Catastrophe Exposures Source: Aspen analysis using RMS v9.0 occurrence exceedance probability as at April 1, 2010 and Shareholders' Equity of $3,140.2 million Major Peril Zones, 100 and 250 Year Return Periods as a Percentage Of Total Shareholders' Equity 1 in 100
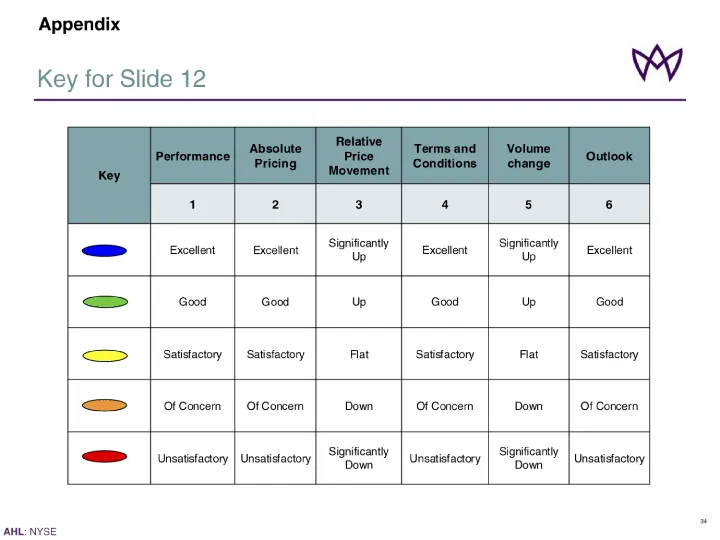
Slide 32: Appendix: Key for Slide
Appendix Key for Slide 12 AHL; NYSE —_> Excellent Sonieanty Excellent Sonica Excellent = Good Good Up Good Up Good <> J satisactory | satistectory | Fat Satstactory | Flat | Satisfactory B® J crconem | orconcem | down | ofconcem | Down | Of Concern BD insoistactory | Unsatistactoy| S8NHCAMY | Uncati
Source: SEC EDGAR · 8-K filed May 5, 2010
More decks from Aspen Insurance Holdings Ltd
 Q1 2018 Earnings Presentation13 slides · May 2, 2018
 Q3 2017 Earnings Presentation20 slides · Nov 15, 2017
 Q2 2017 Earnings Presentation20 slides · Jul 26, 2017
 Q1 2017 Earnings Presentation20 slides · Apr 26, 2017
 Q4 2016 Earnings Presentation16 slides · Feb 14, 2017
 Q3 2016 Earnings Presentation16 slides · Oct 26, 2016