Southern Union — American Gas Association Financial Forum 2005
26 slides from Southern Union's conference presentation, May 2, 2005
Slide 1: American Gas Association Financial Forum
NYSE: SUG American Gas Association Financial Forum May 2, 2005
Slide 2: Safe Harbor for Forward-Looking Statements
Safe Harbor for Forward-Looking Statements This presentation and other Company reports and statements issued or made from time to time contain certain “forward-looking statements” concerning projected financial performance, expected plans or future operations. Southern Union Company cautions that ac
Slide 3: SUG Management Team
SUG Management Team Thomas F. Karam President & COO, Southern Union Company David J. Kvapil Executive Vice President & CFO, Southern Union Company Robert O. Bond President & COO, Panhandle Energy & CrossCountry Energy John F. Walsh Director of Investor Relations, Southern Union Company 3
Slide 4: SUG Operations
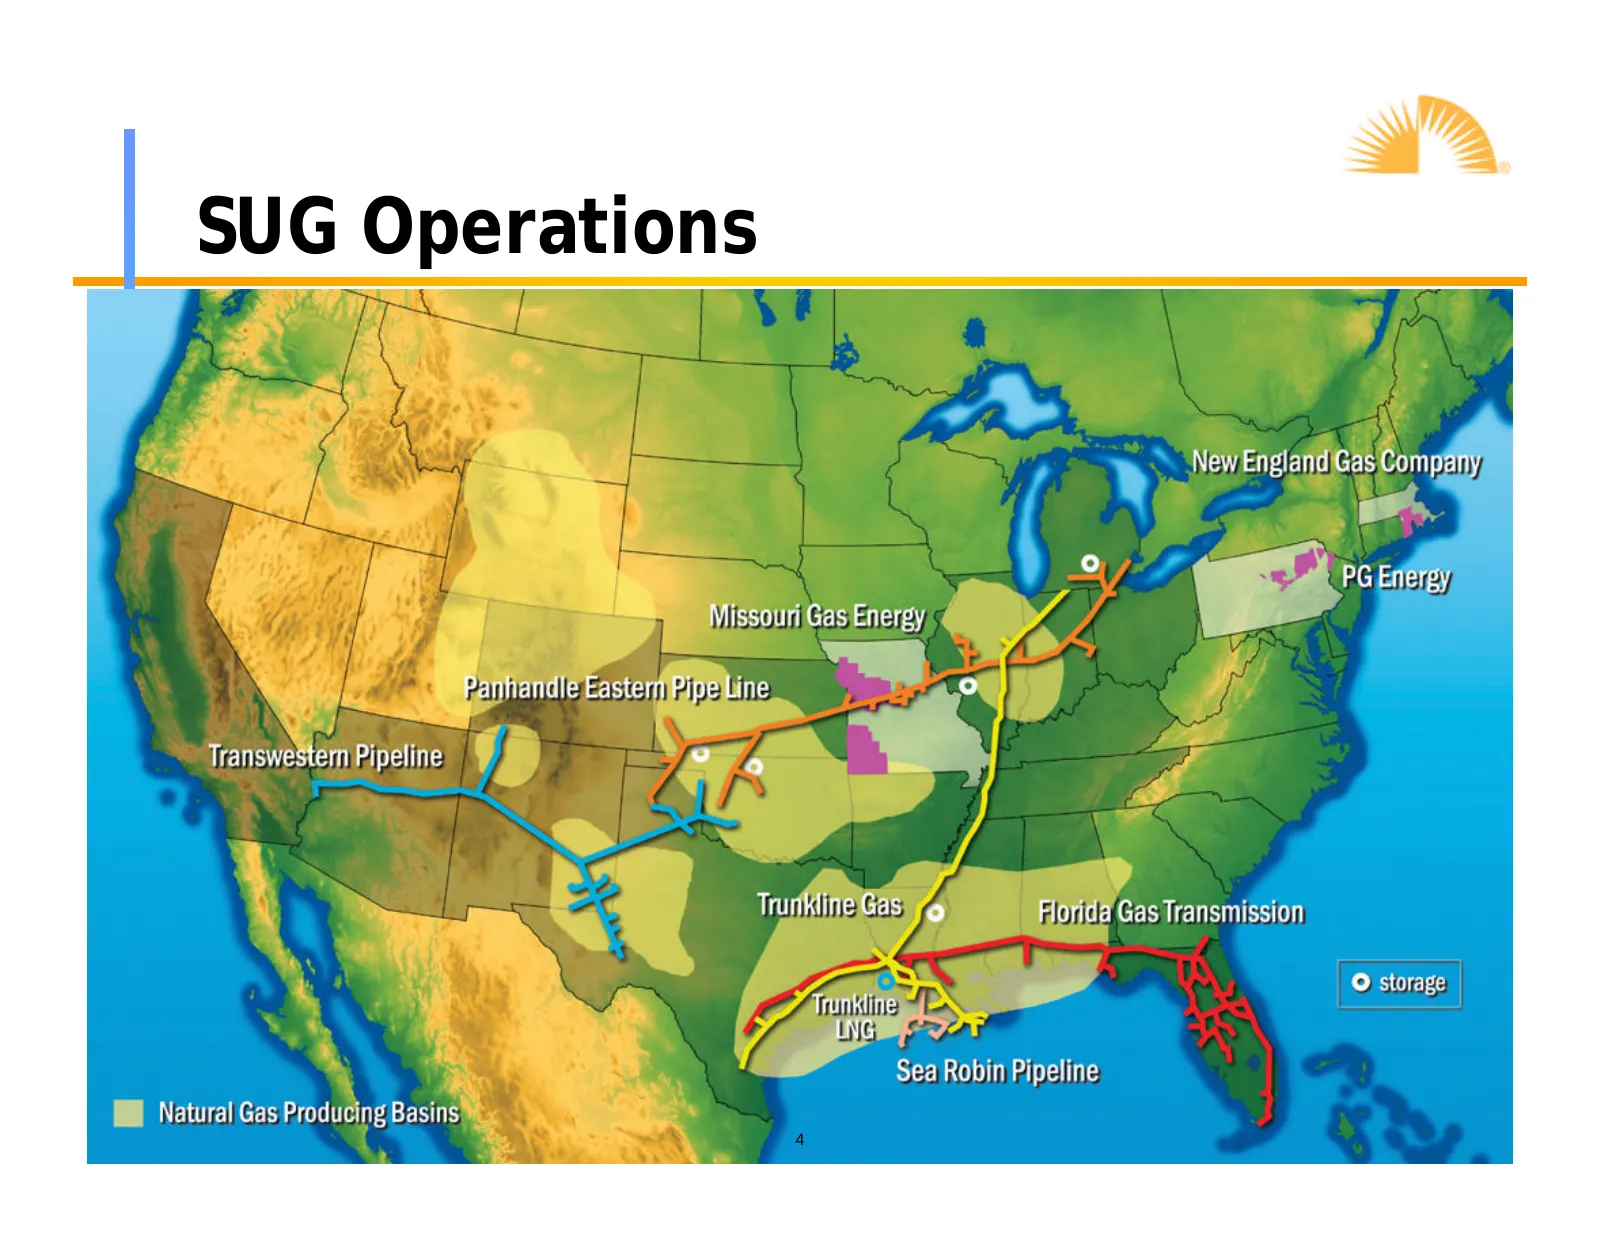
SUG Operations ee | Ne Englan a “a as PG Energy Missotn Gas Energy Handle Eastern pe 0 ¥ 4 Q \ Zz Trunkiine Gas) Horida Gas Transmission oN YS © stora Be 1H Ginnie ON A NCR e Sea Robin Pipeline 4 4 Natural Gas Producing Basins ;

Slide 5: The CrossCountry Acquisition
The CrossCountry Acquisition 5
Slide 6: Transaction Highlights
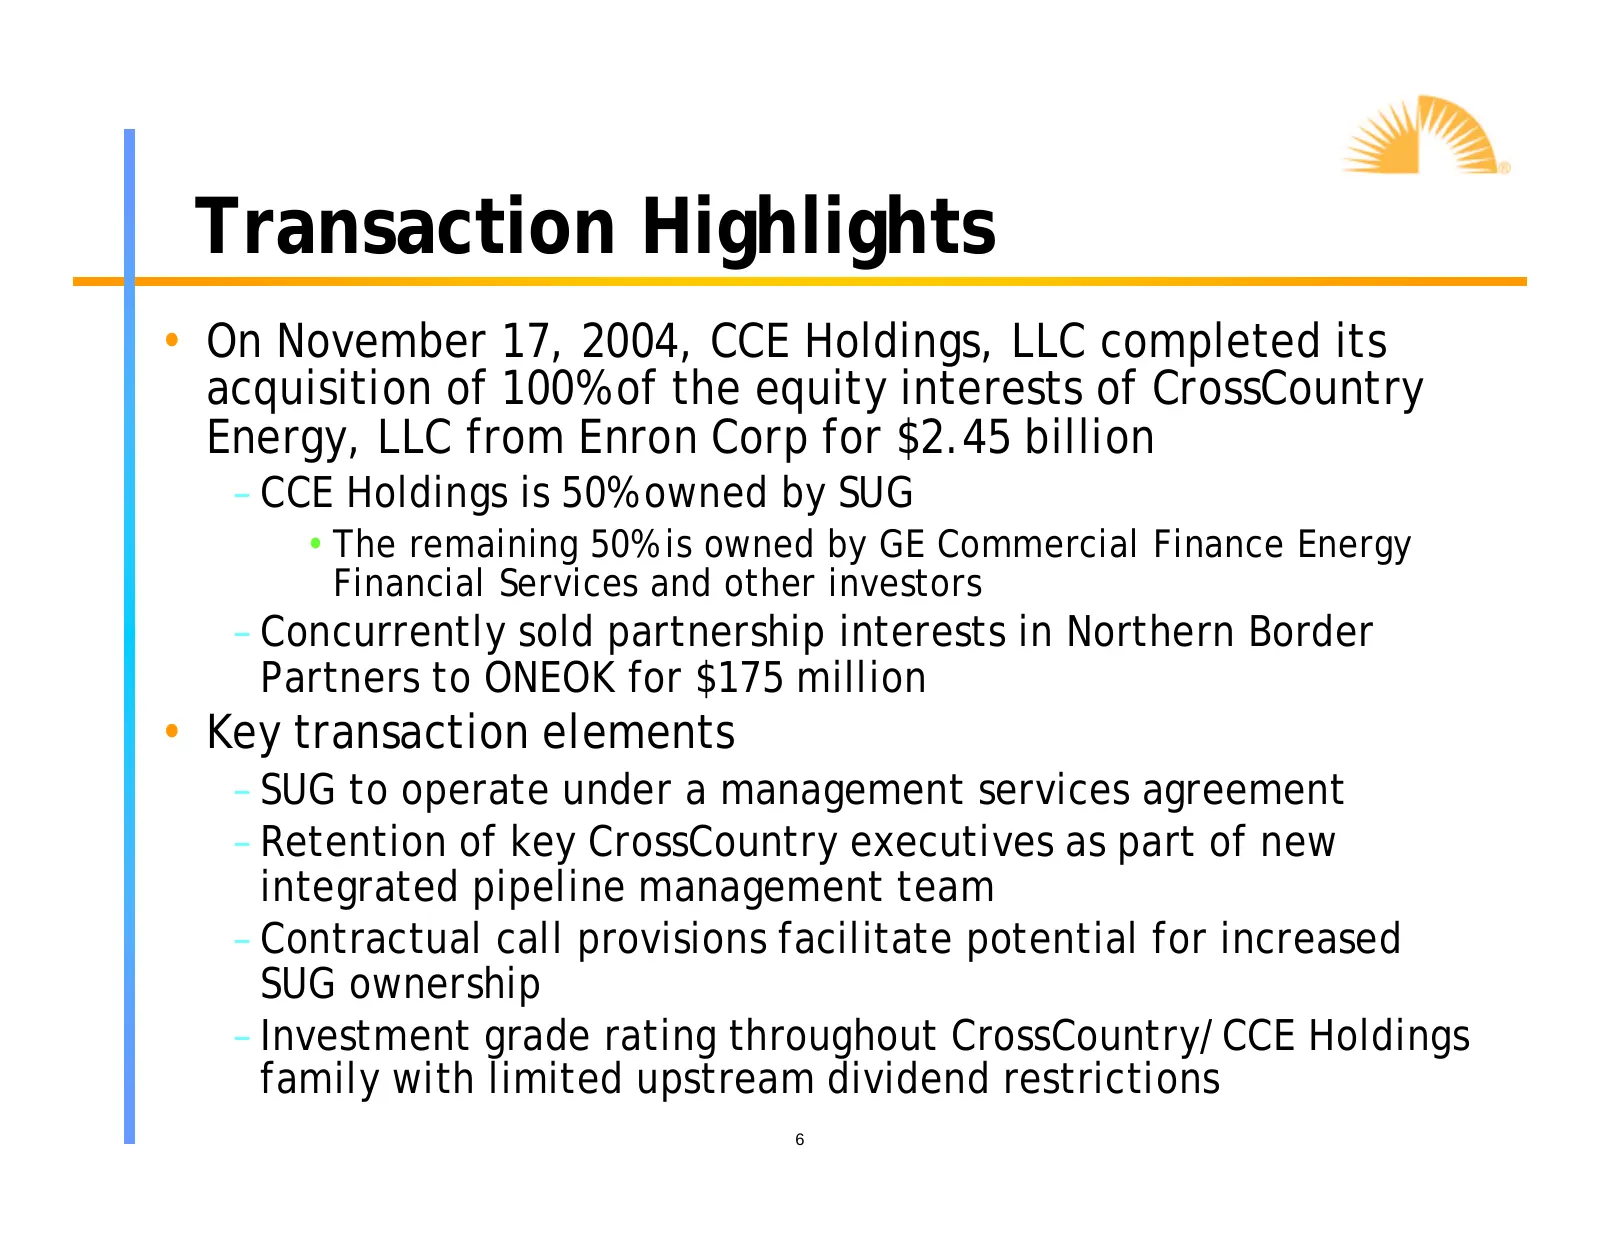
Transaction Highlights • On November 17, 2004, CCE Holdings, LLC completed its acquisition of 100% of the equity interests of CrossCountry Energy, LLC from Enron Corp for $2.45 billion – CCE Holdings is 50% owned by SUG • The remaining 50% is owned by GE Commercial Finance Energy Financial Services
Slide 7: CrossCountry Acquisition Structure
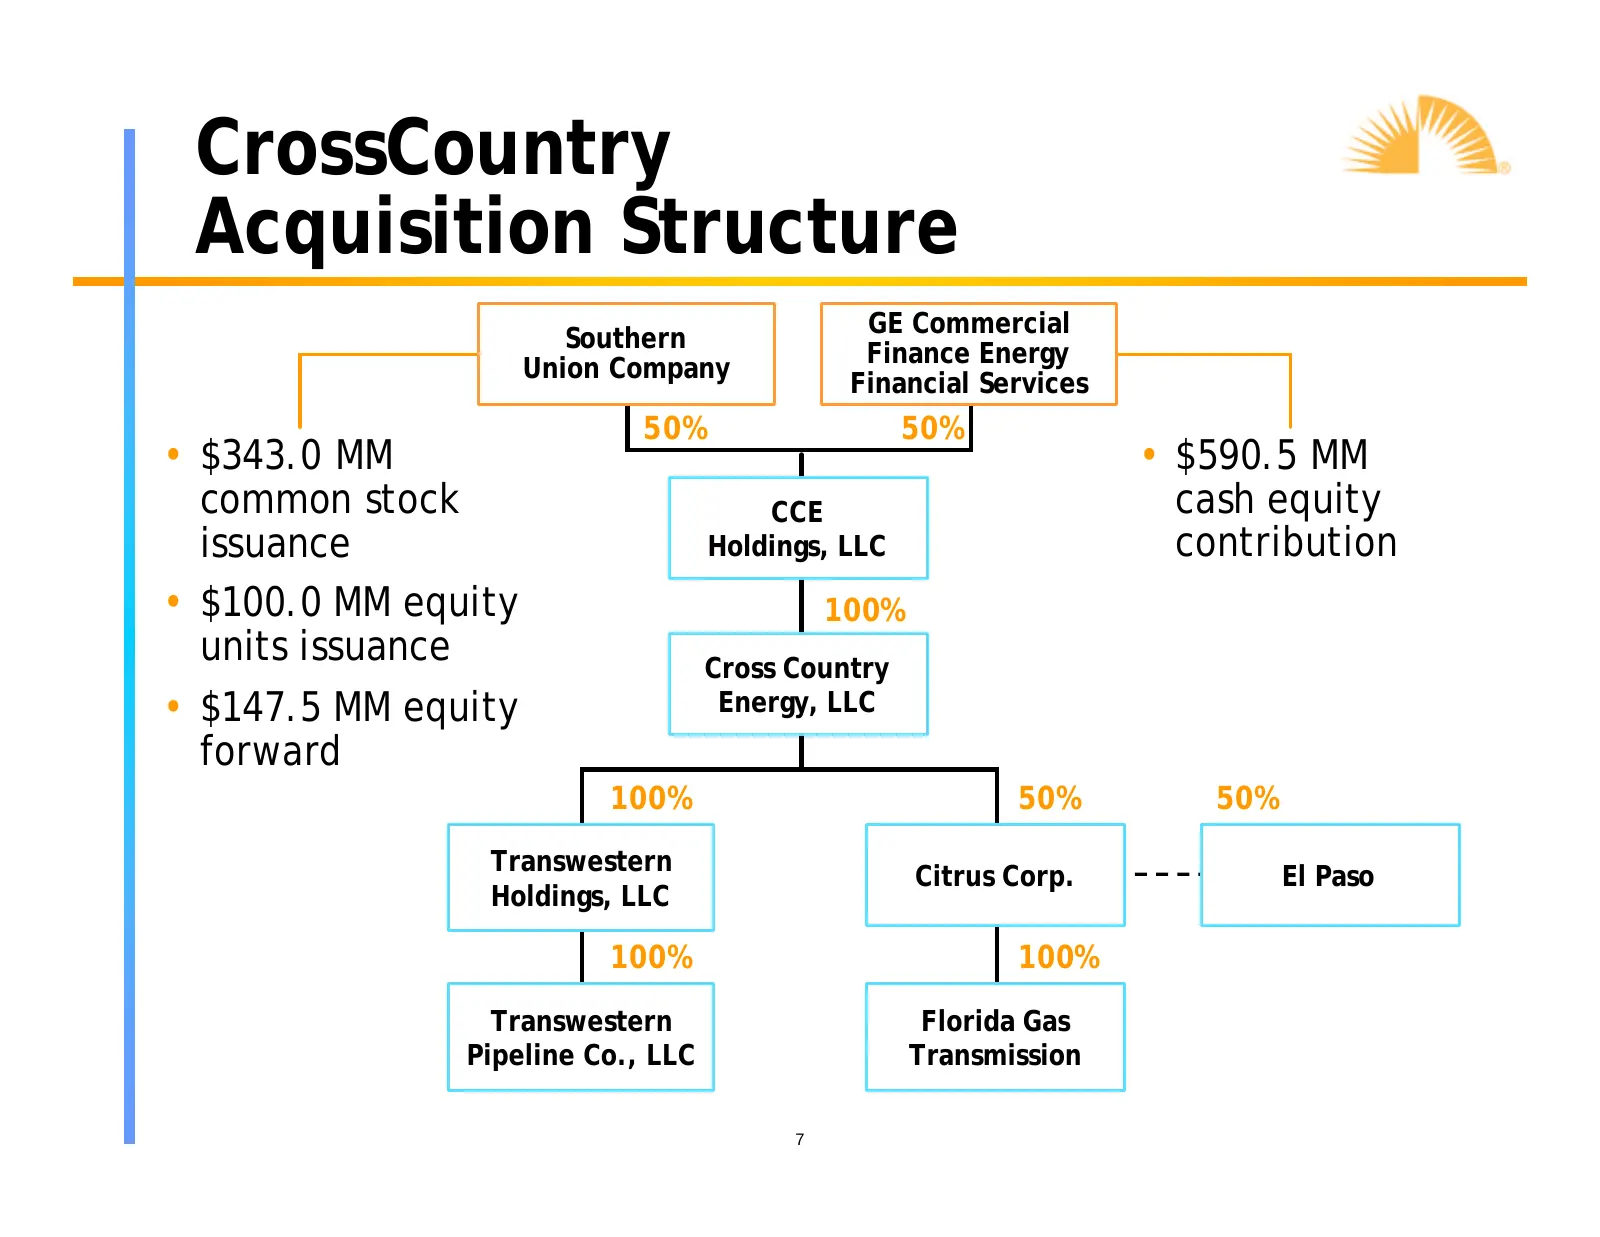
CrossCountry Acquisition Structure GE Commercial Southern Finance Energy Union Company Financial Services 50% 50% • $343.0 MM • $590.5 MM common stock CCE cash equity issuance Holdings, LLC contribution • $100.0 MM equity 100% units issuance Cross Country • $147.5 MM equity Energy, LLC forward 100%
Slide 8: Strategic Rationale
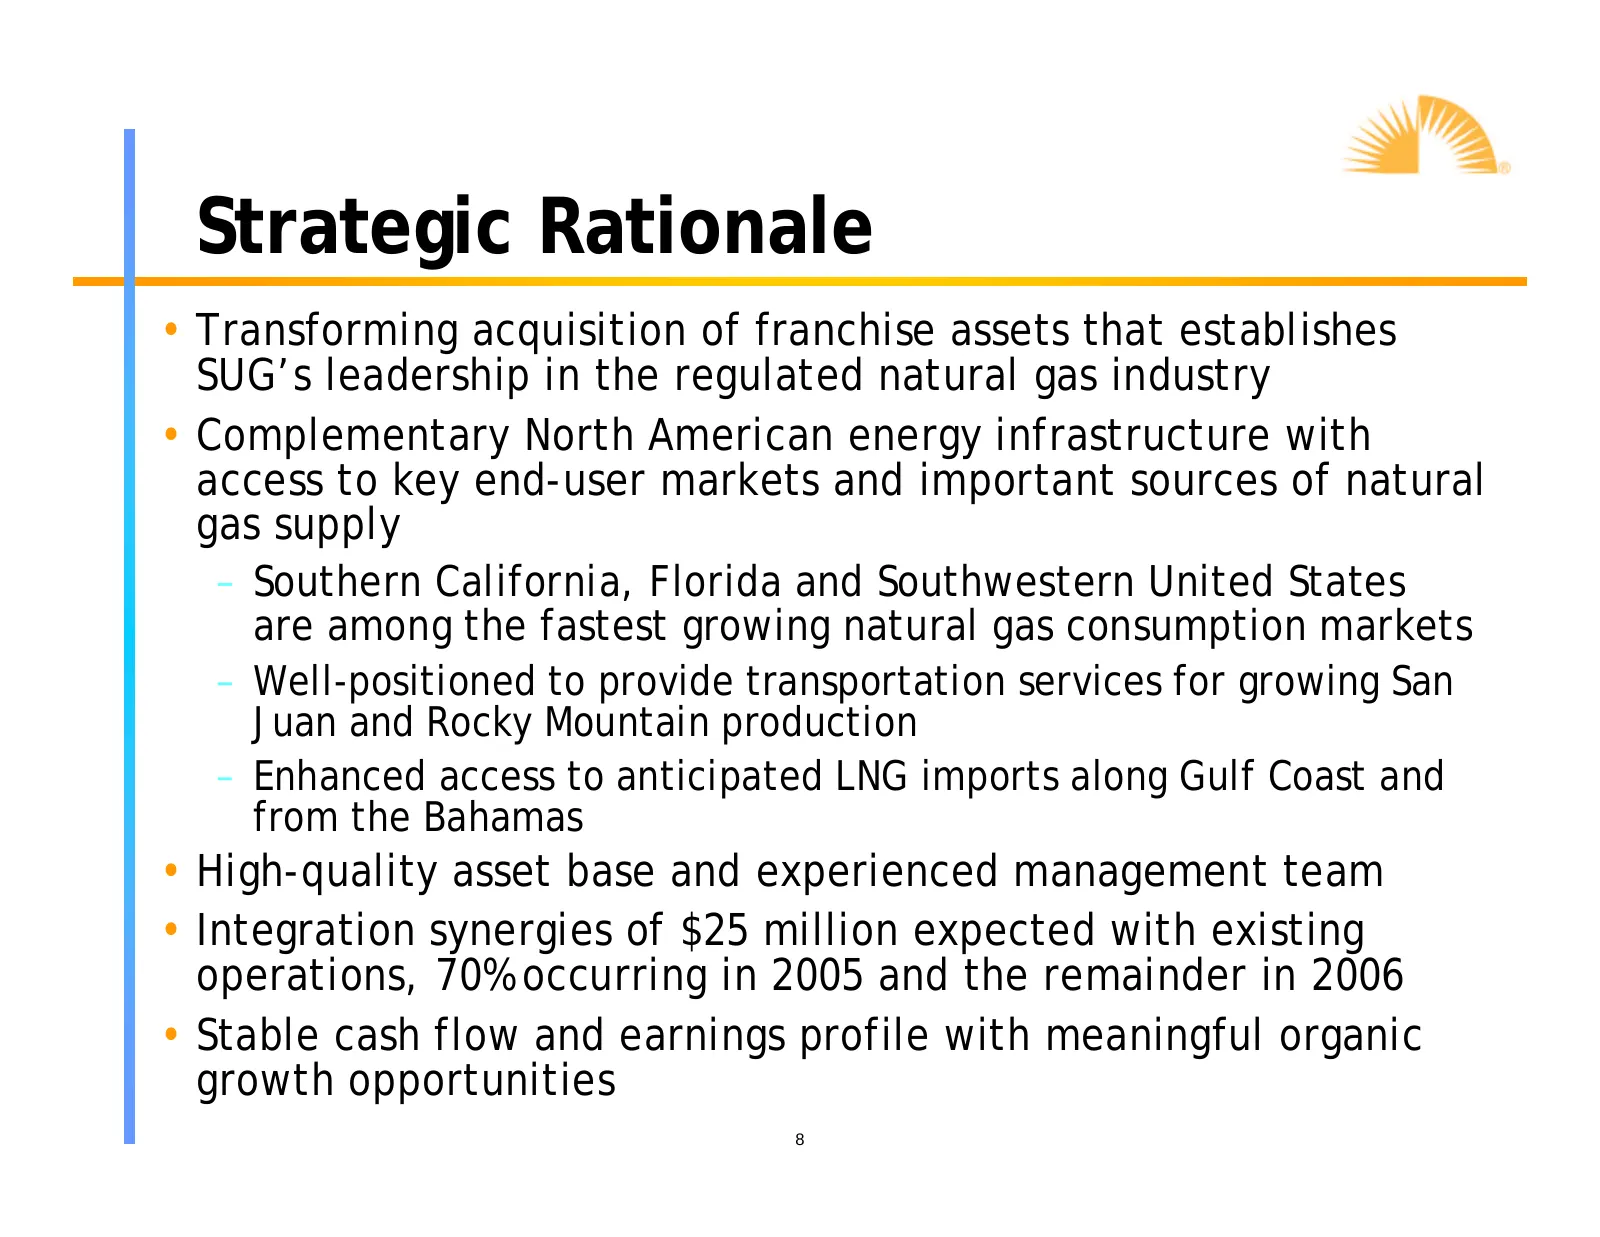
Strategic Rationale • Transforming acquisition of franchise assets that establishes SUG’s leadership in the regulated natural gas industry • Complementary North American energy infrastructure with access to key end-user markets and important sources of natural gas supply – Southern California, Flori
Slide 9: CrossCountry Energy
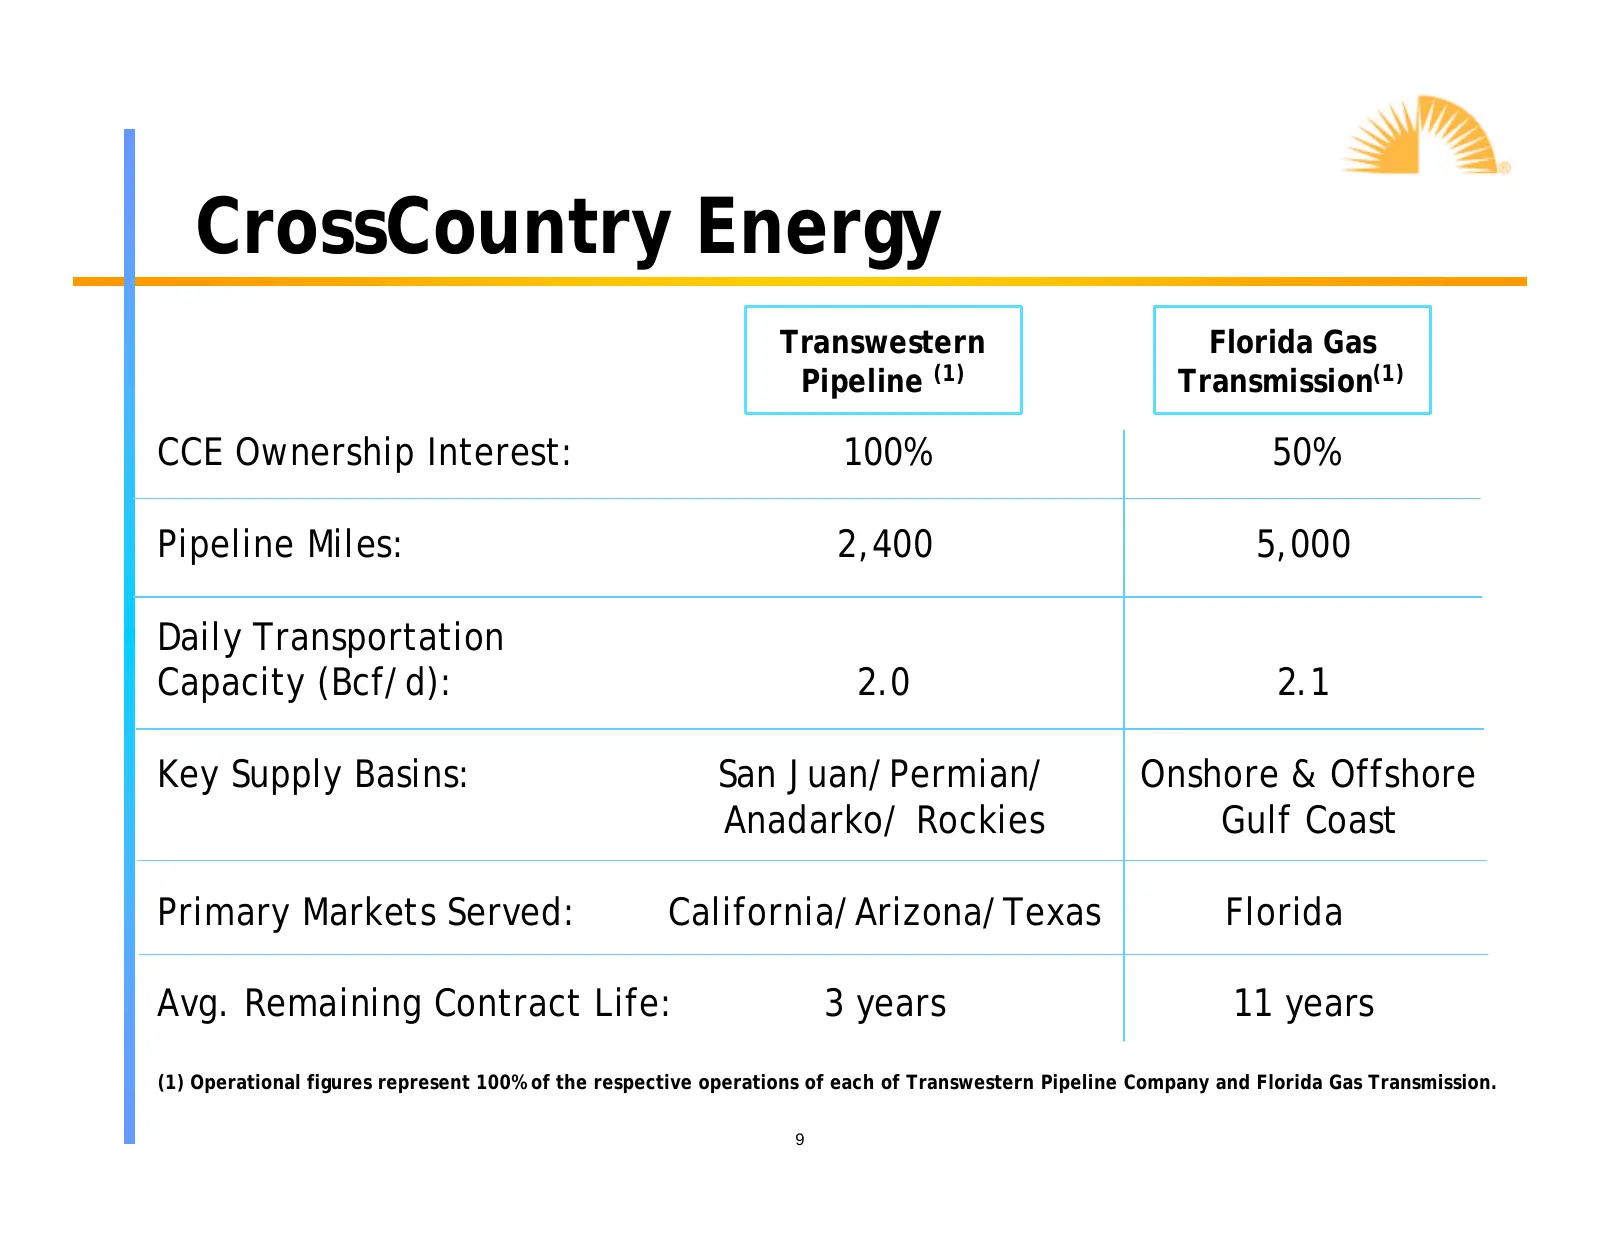
CrossCountry Energy Transwestern Florida Gas Pipeline (1) Transmission(1) CCE Ownership Interest: 100% 50% Pipeline Miles: 2,400 5,000 Daily Transportation Capacity (Bcf/d): 2.0 2.1 Key Supply Basins: San Juan/Permian/ Onshore & Offshore Anadarko/ Rockies Gulf Coast Primary Markets Served: Californi
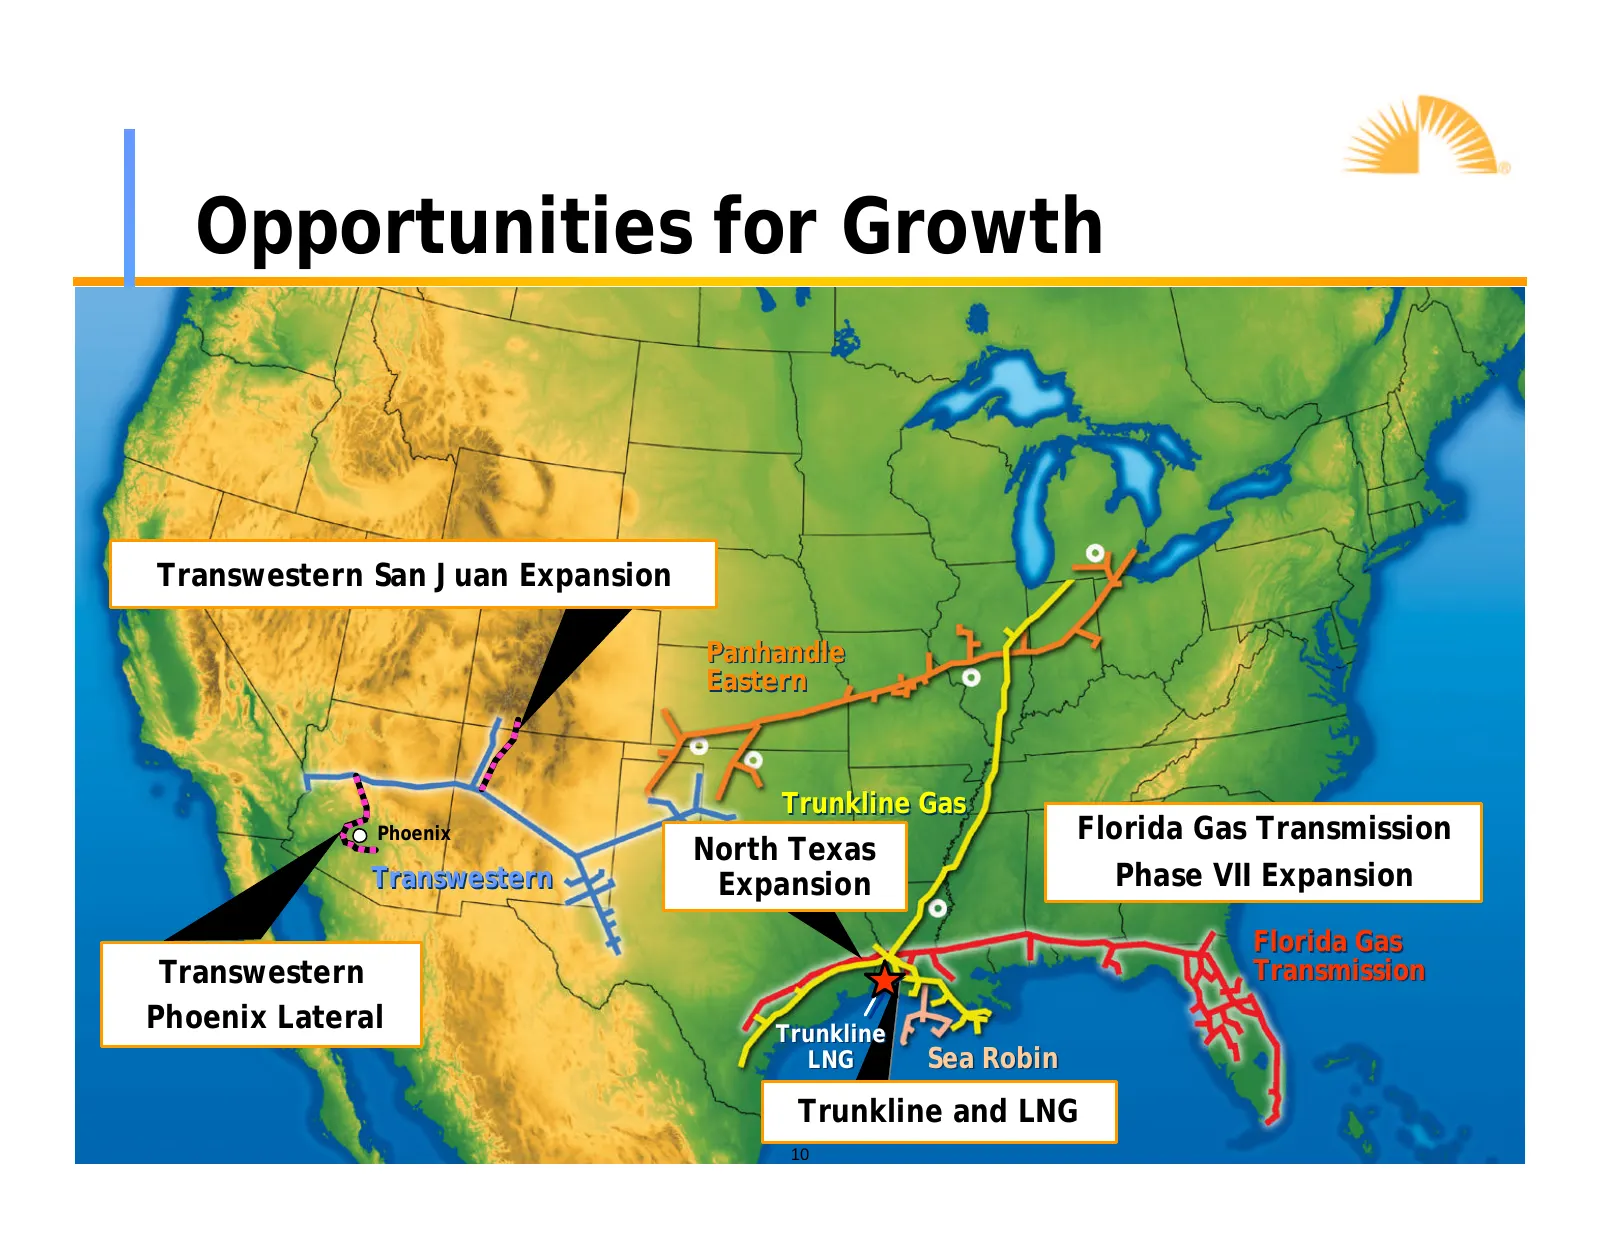
Slide 10: Opportunities for Growth
Opportunities for Growth Transwestern San Juan Expansion Panhandle Eastern Trunkline Gas Phoenix Florida Gas Transmission North Texas Transwestern Expansion Phase VII Expansion Florida Gas Transwestern Transmission Phoenix Lateral Trunkline LNG Sea Robin Trunkline and LNG 10 10
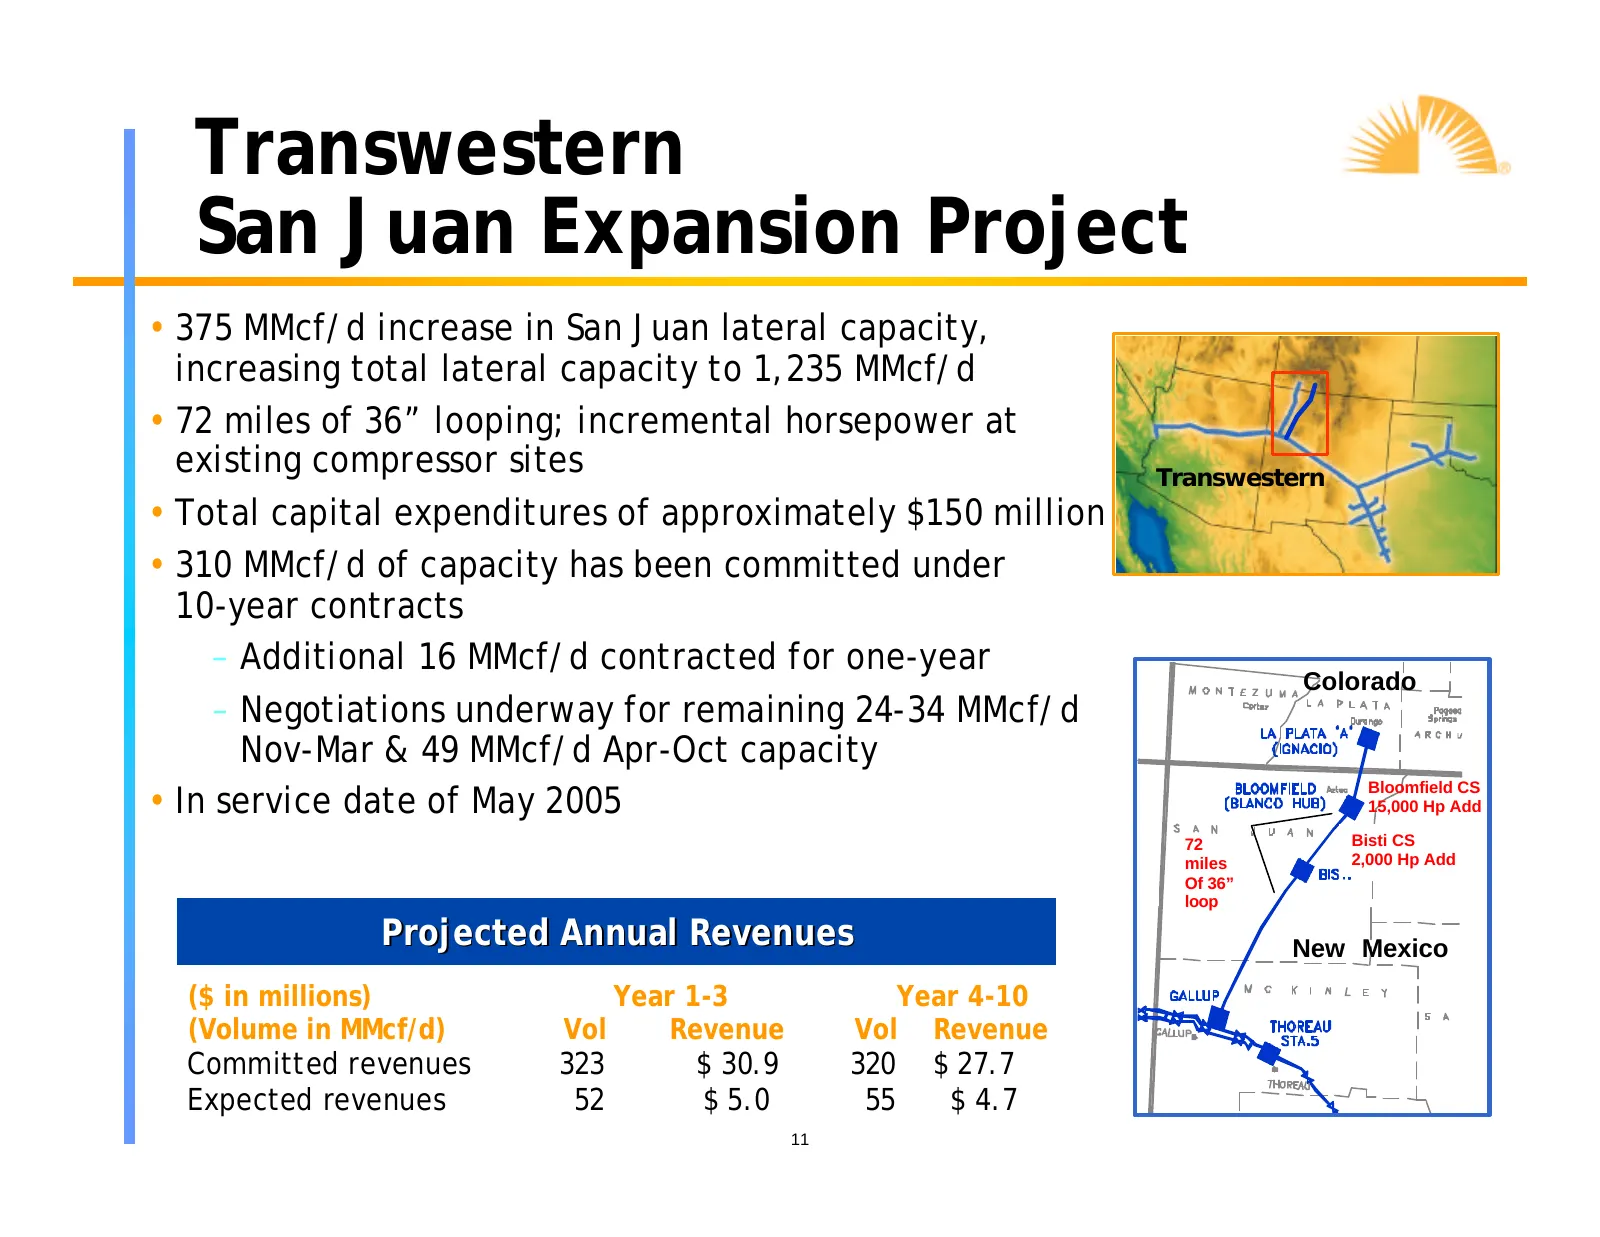
Slide 11: Transwestern San Juan Expansion Project
Transwestern San Juan Expansion Project • 375 MMcf/d increase in San Juan lateral capacity, increasing total lateral capacity to 1,235 MMcf/d • 72 miles of 36” looping; incremental horsepower at existing compressor sites Transwestern • Total capital expenditures of approximately $150 million • 310 M
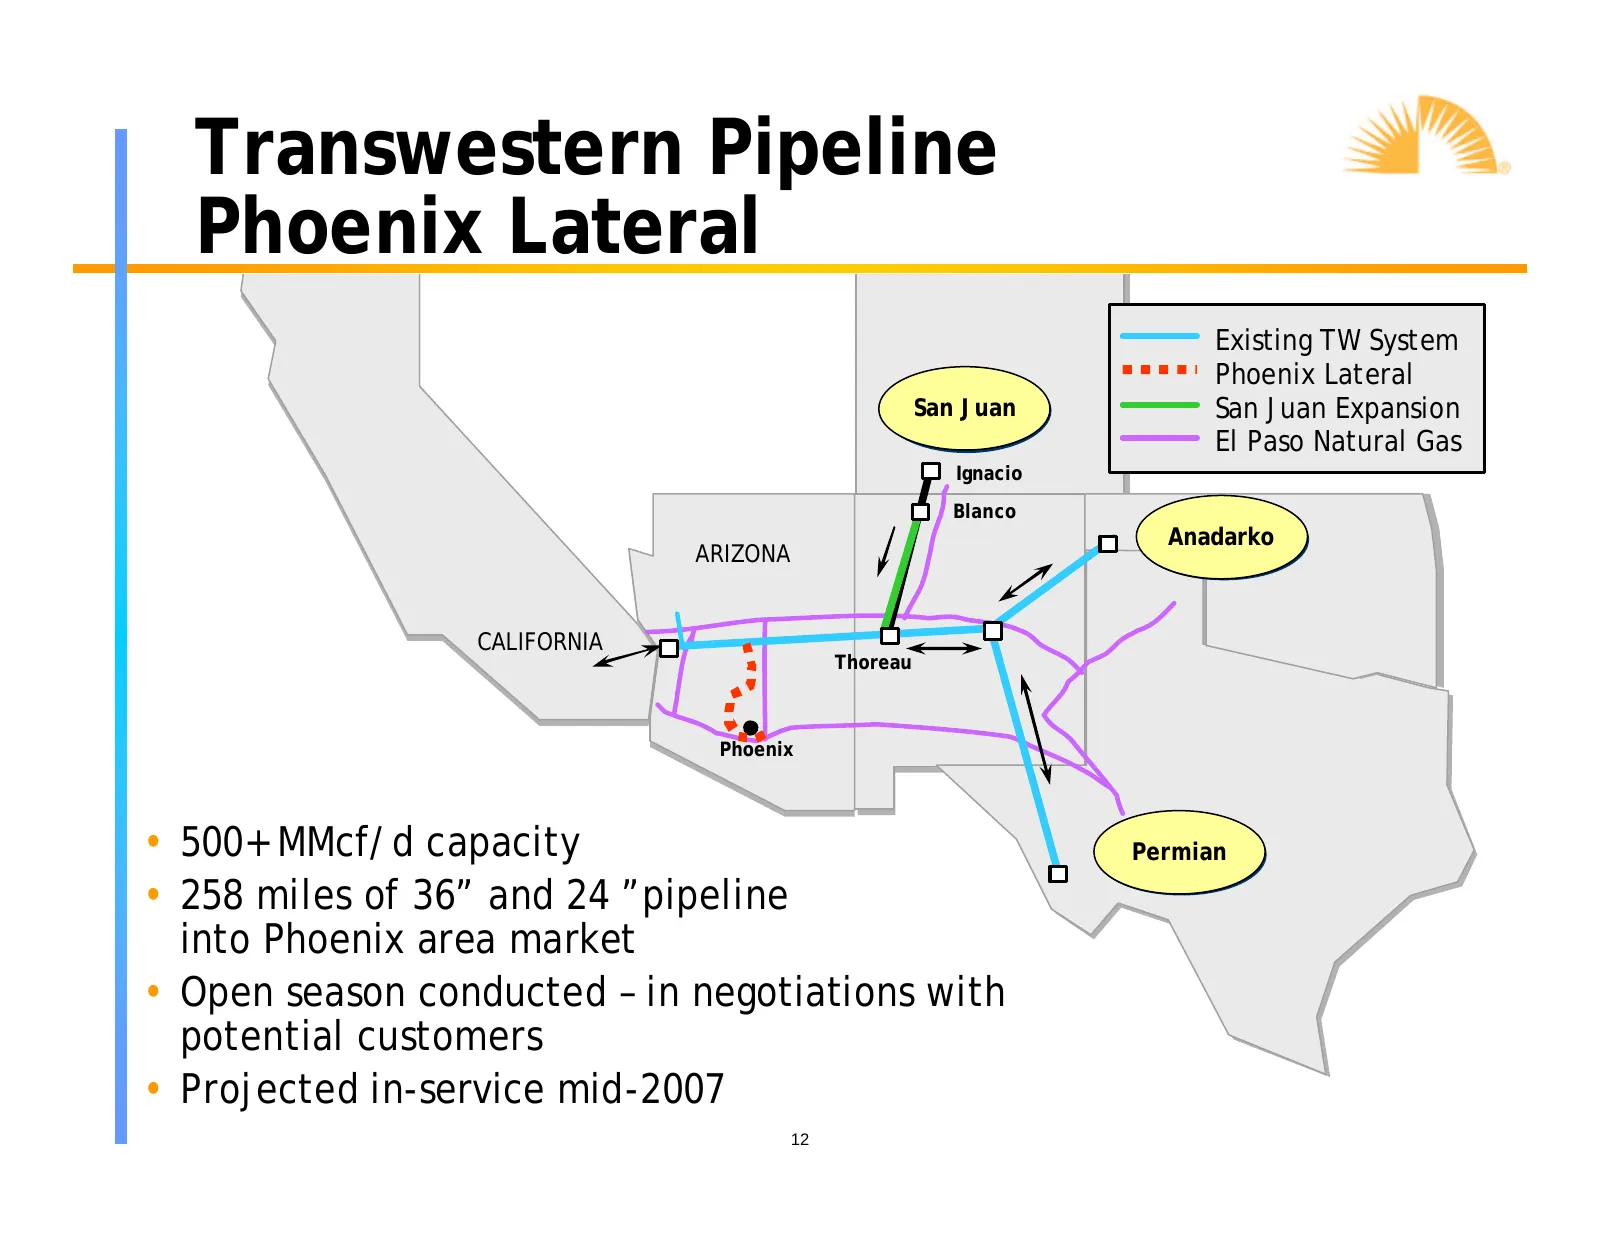
Slide 12: Transwestern Pipeline Phoenix Lateral
Transwestern Pipeline Phoenix Lateral Existing TW System Phoenix Lateral San Juan San Juan Expansion El Paso Natural Gas Ignacio Blanco Anadarko ARIZONA CALIFORNIA Thoreau Phoenix • 500+ MMcf/d capacity Permian • 258 miles of 36” and 24 ”pipeline into Phoenix area market • Open season conducted – in
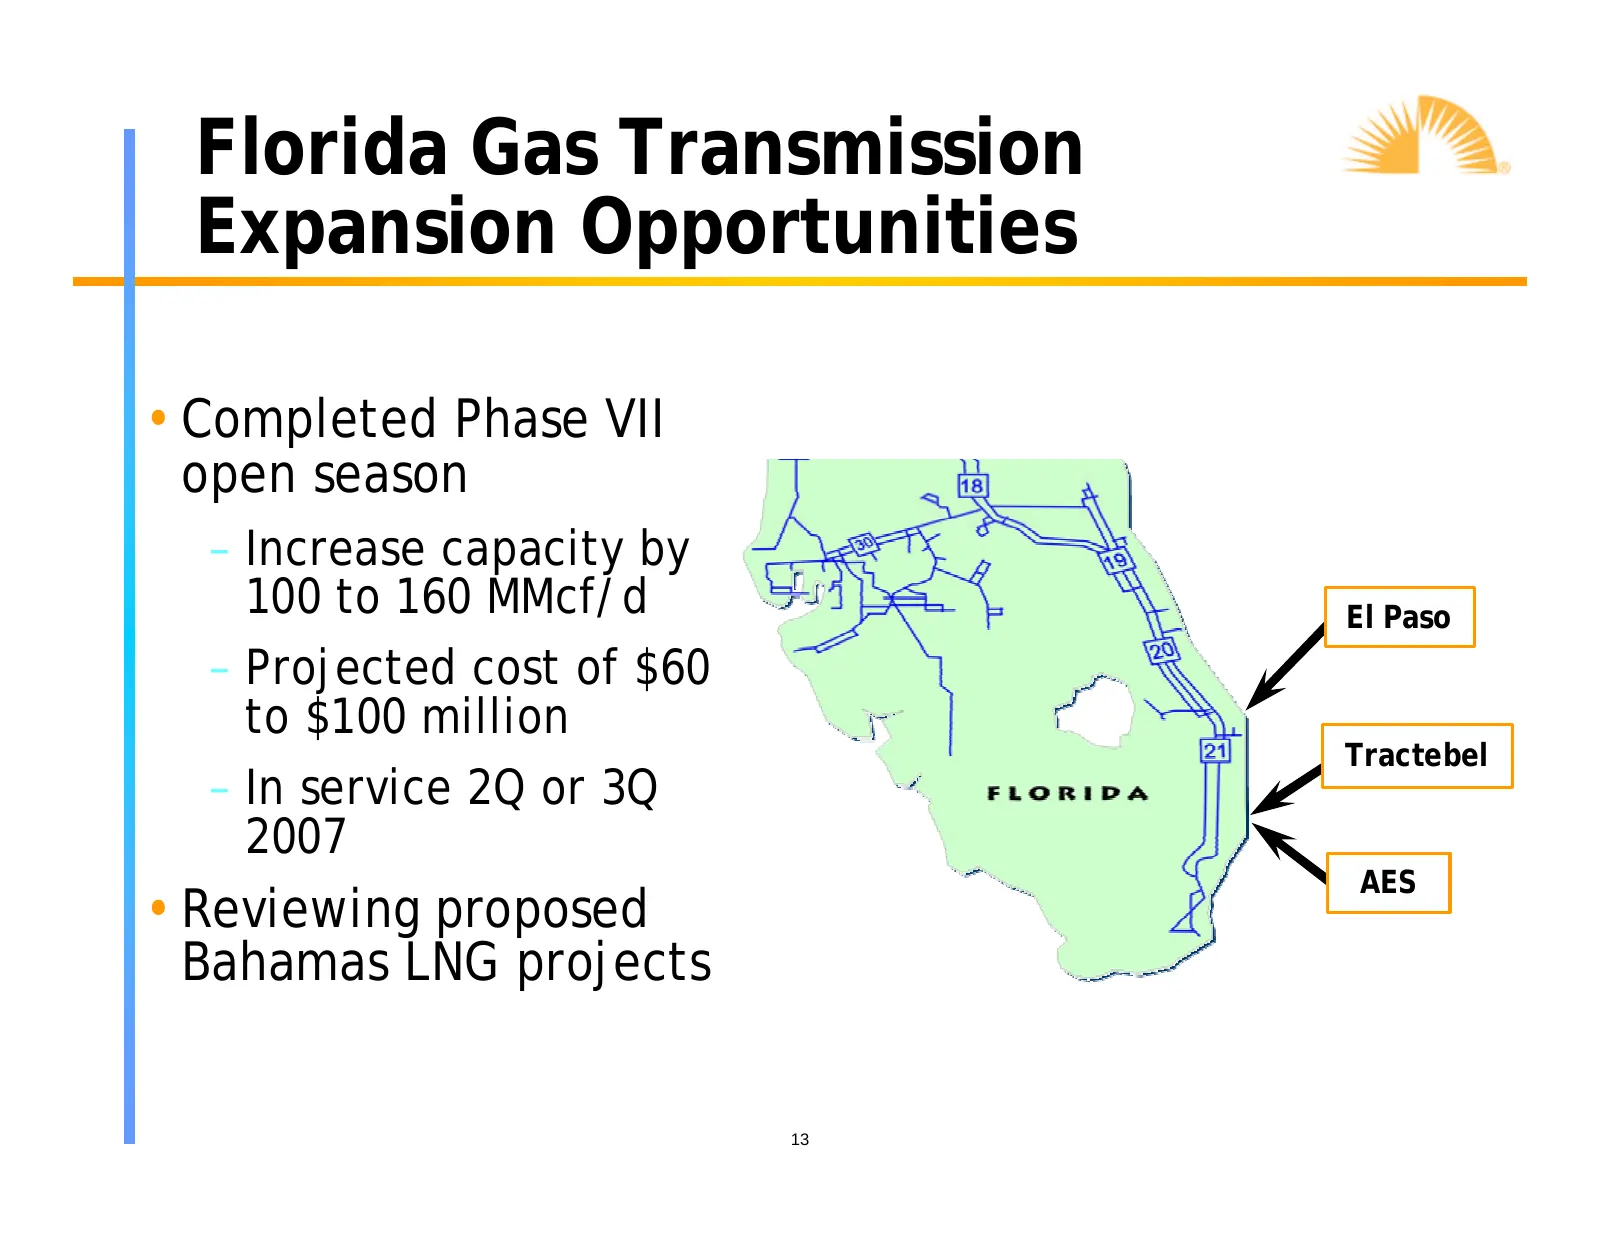
Slide 13: Florida Gas Transmission Expansion Opportunities
Florida Gas Transmission Expansion Opportunities • Completed Phase VII open season – Increase capacity by 100 to 160 MMcf/d El Paso – Projected cost of $60 to $100 million Tractebel – In service 2Q or 3Q 2007 AES • Reviewing proposed Bahamas LNG projects 13
Slide 14: Panhandle Energy
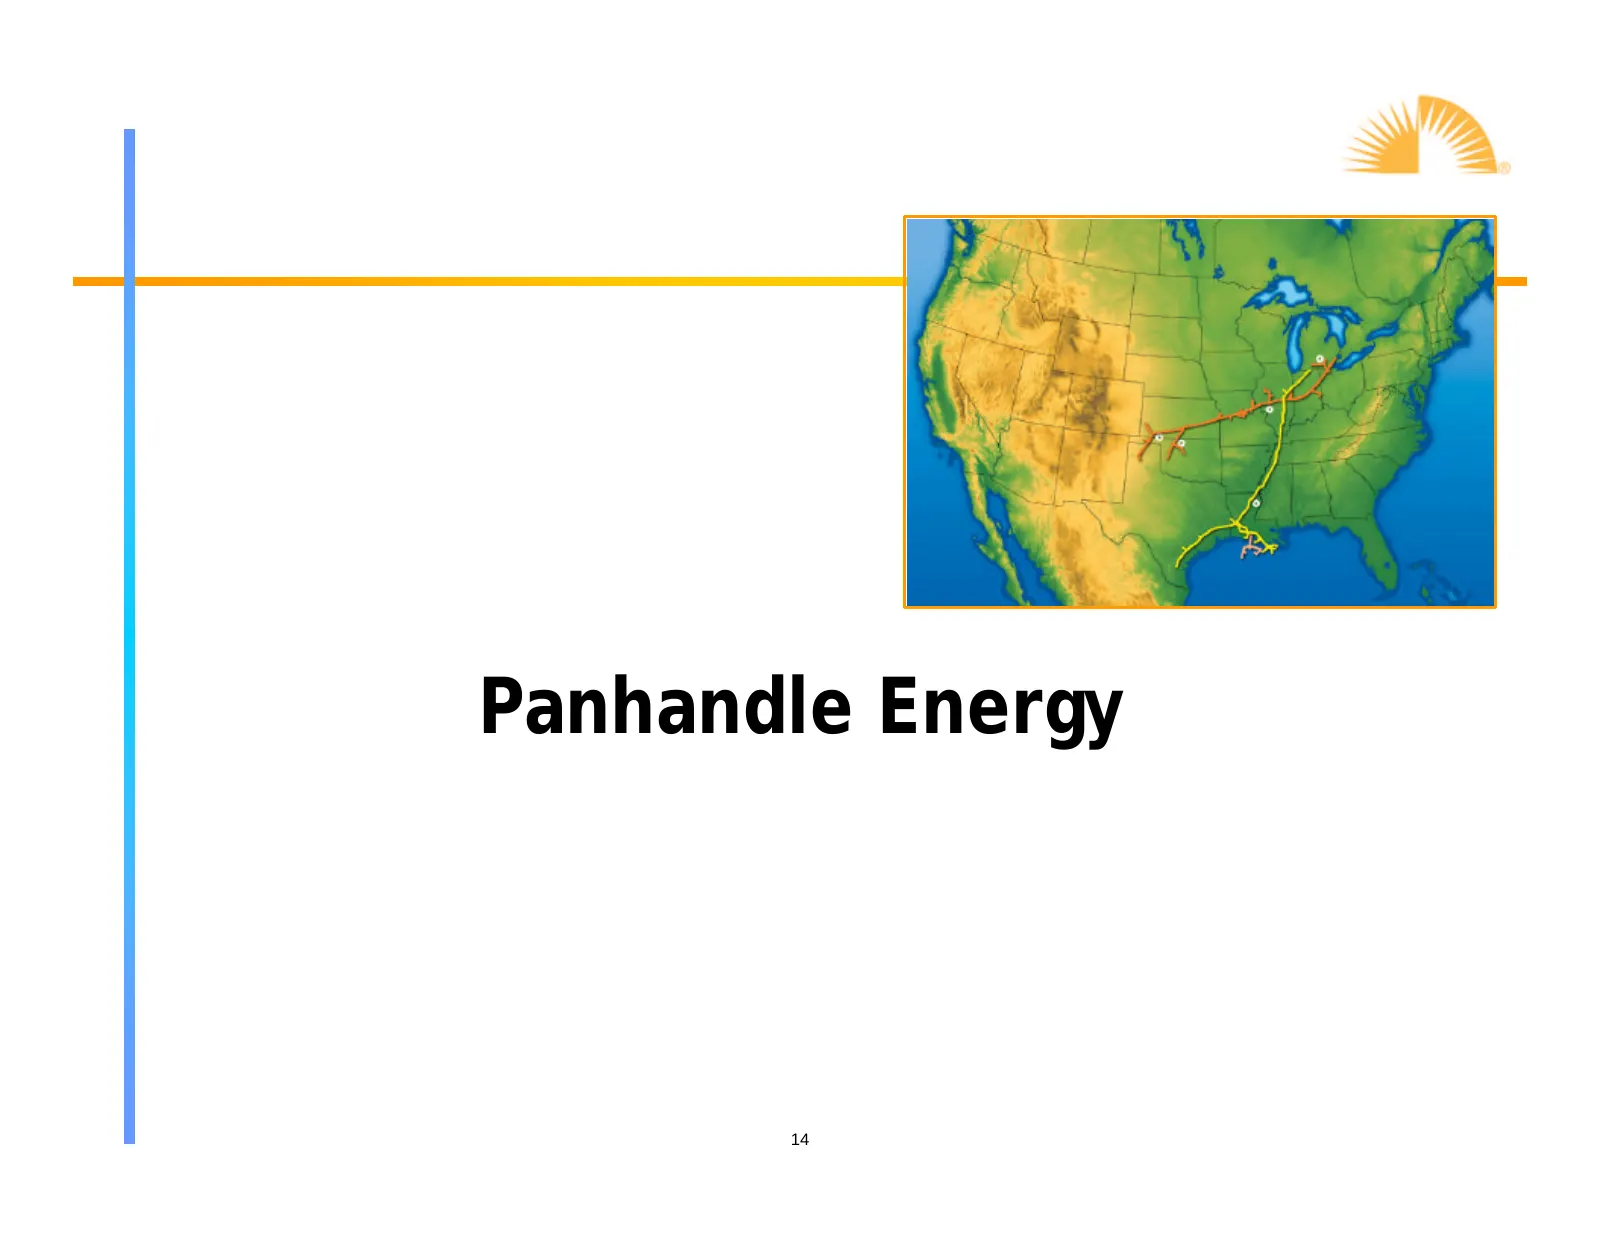
Panhandle Energy 14
Slide 15: Panhandle Energy
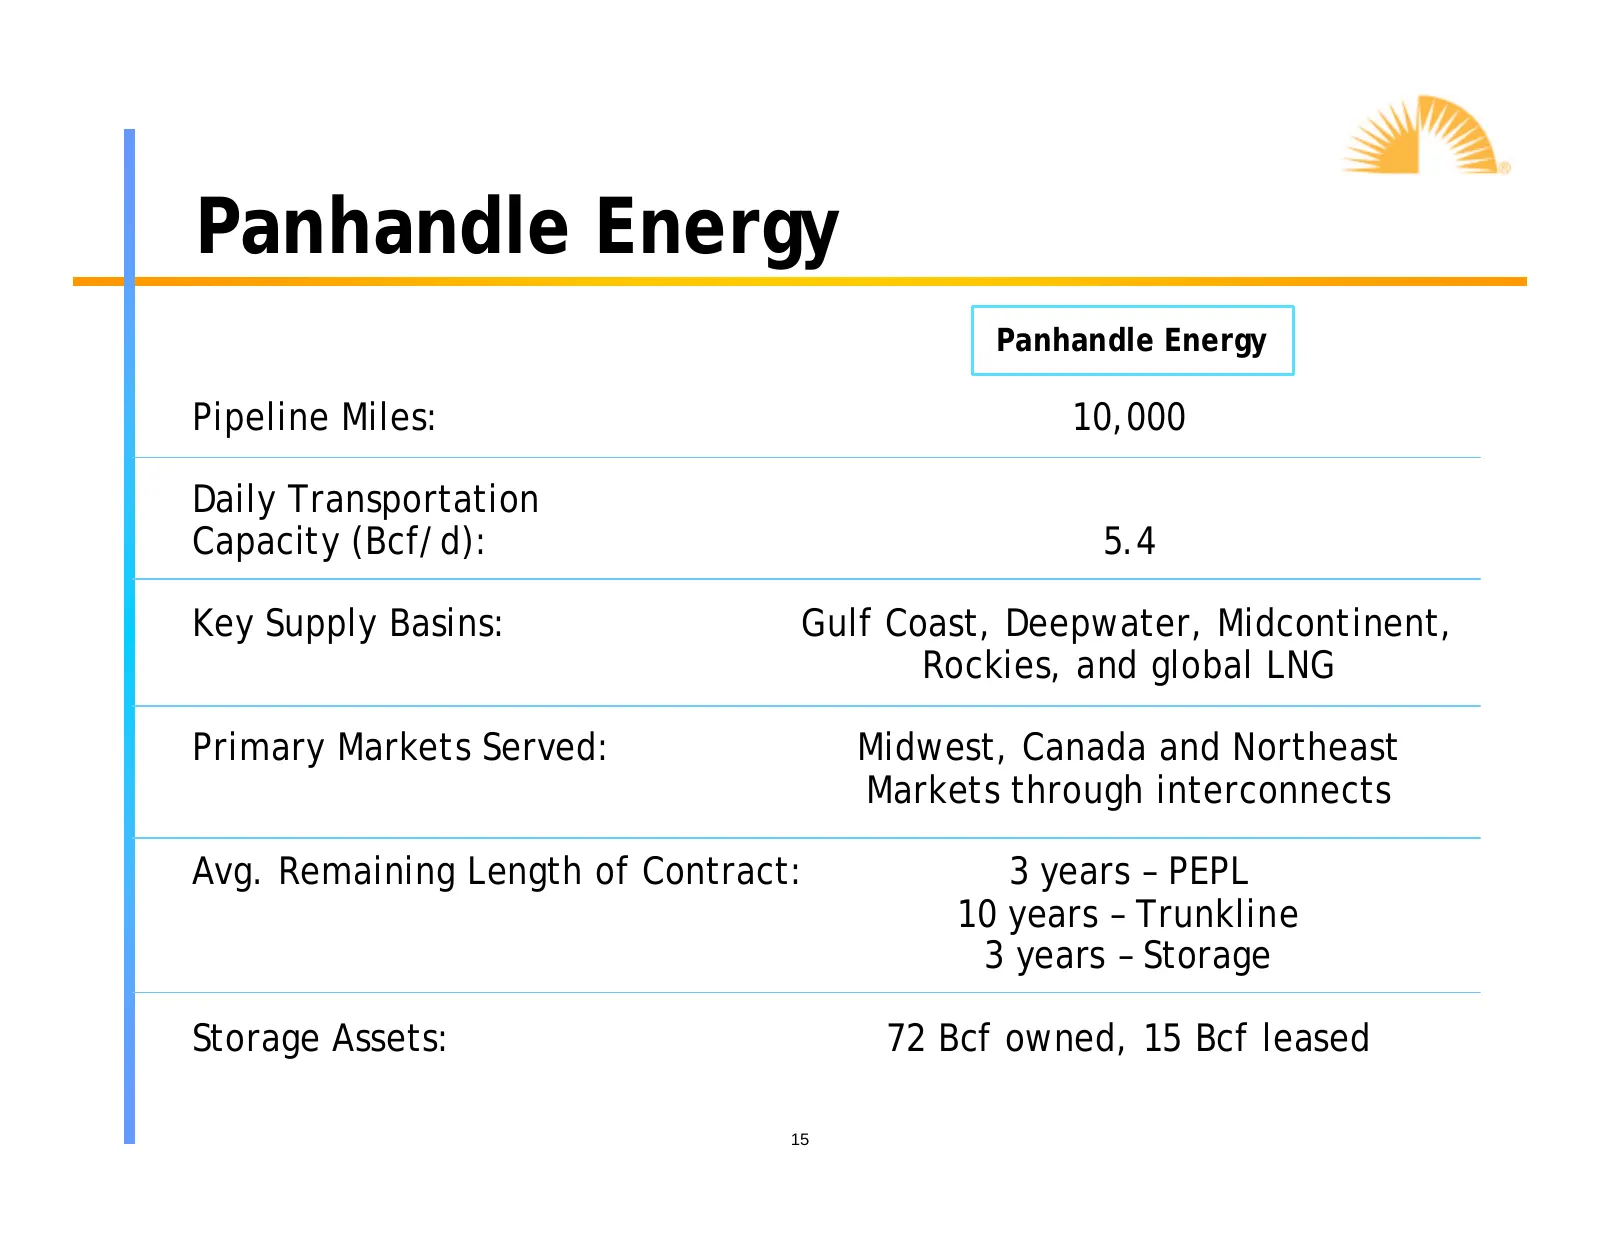
Panhandle Energy Panhandle Energy Pipeline Miles: 10,000 Daily Transportation Capacity (Bcf/d): 5.4 Key Supply Basins: Gulf Coast, Deepwater, Midcontinent, Rockies, and global LNG Primary Markets Served: Midwest, Canada and Northeast Markets through interconnects Avg. Remaining Length of Contract: 3
Slide 16: North Texas Expansion
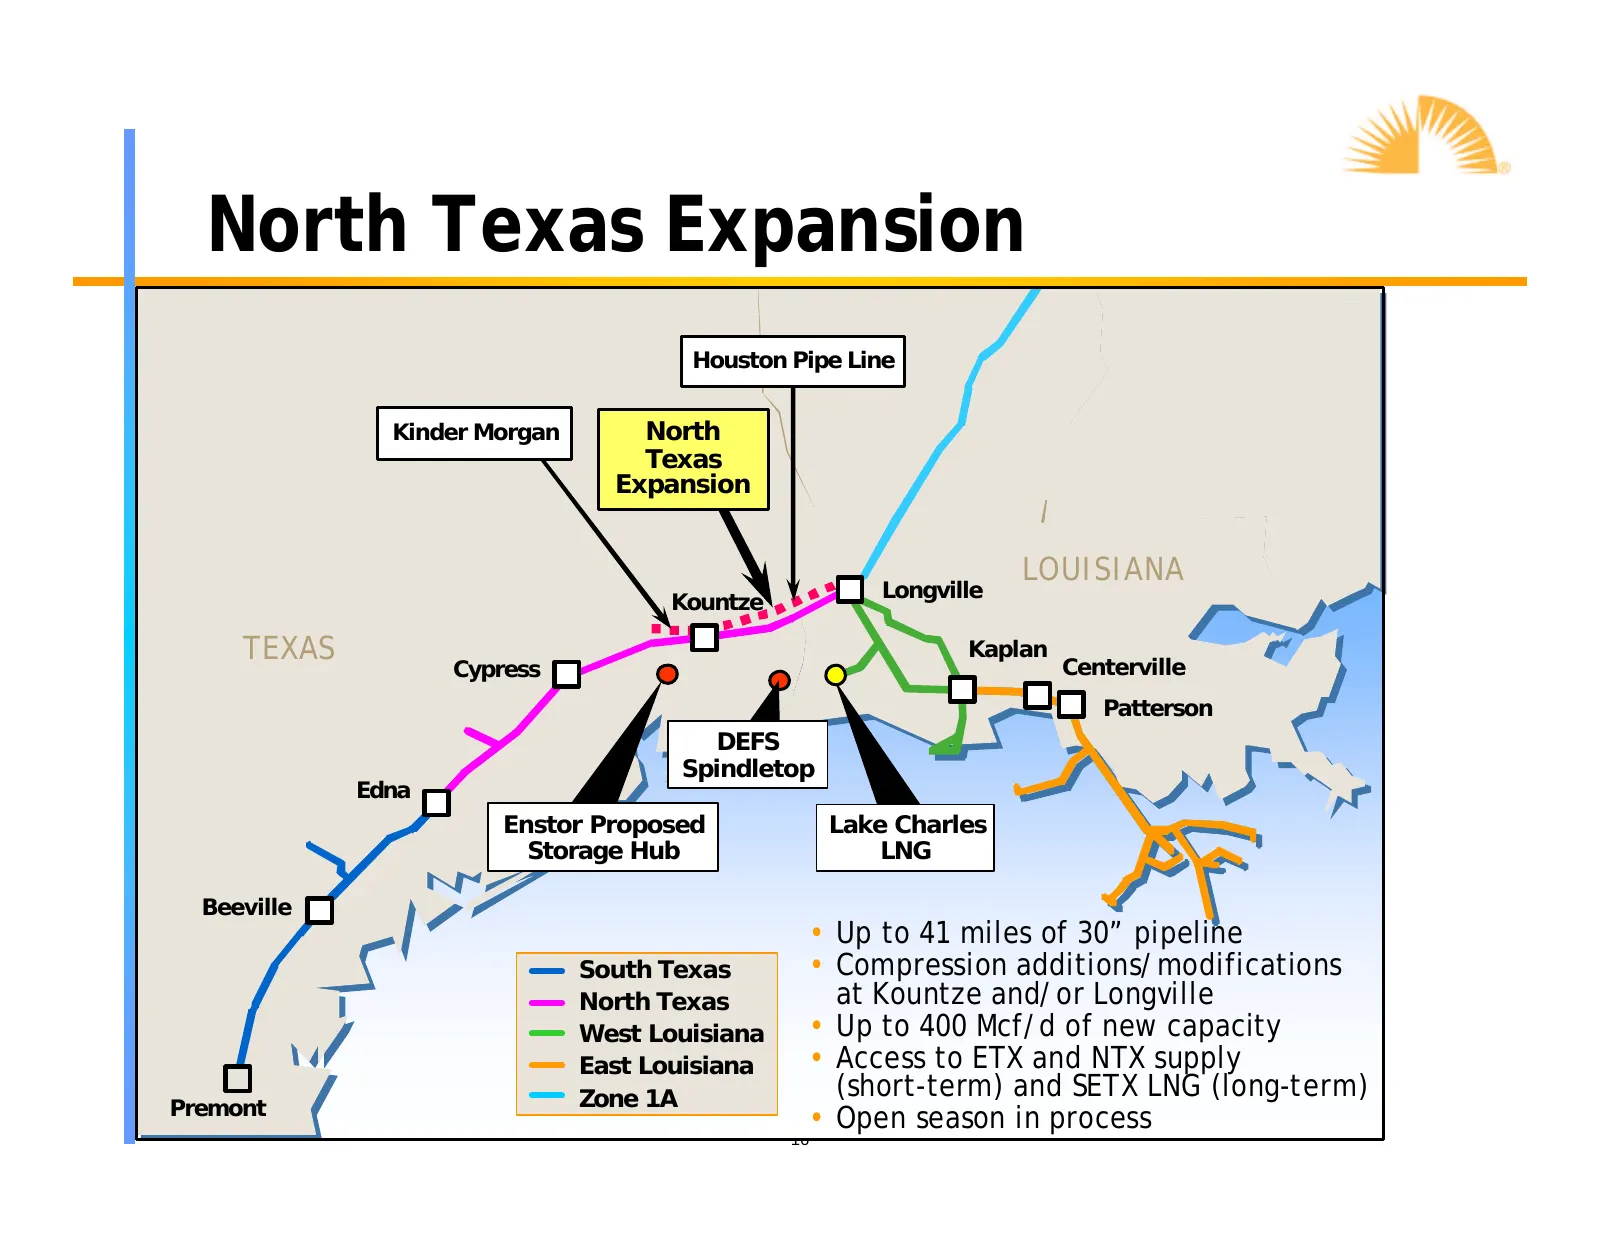
North Texas Expansion Houston Pipe Line Kinder Morgan North Texas Expansion LOUISIANA Longville Kountze TEXAS Kaplan Cypress Centerville Patterson DEFS Spindletop Edna Enstor Proposed Lake Charles Storage Hub LNG Beeville • Up to 41 miles of 30” pipeline South SouthTexas Texas • Compression addition
Slide 17: Trunkline LNG Company
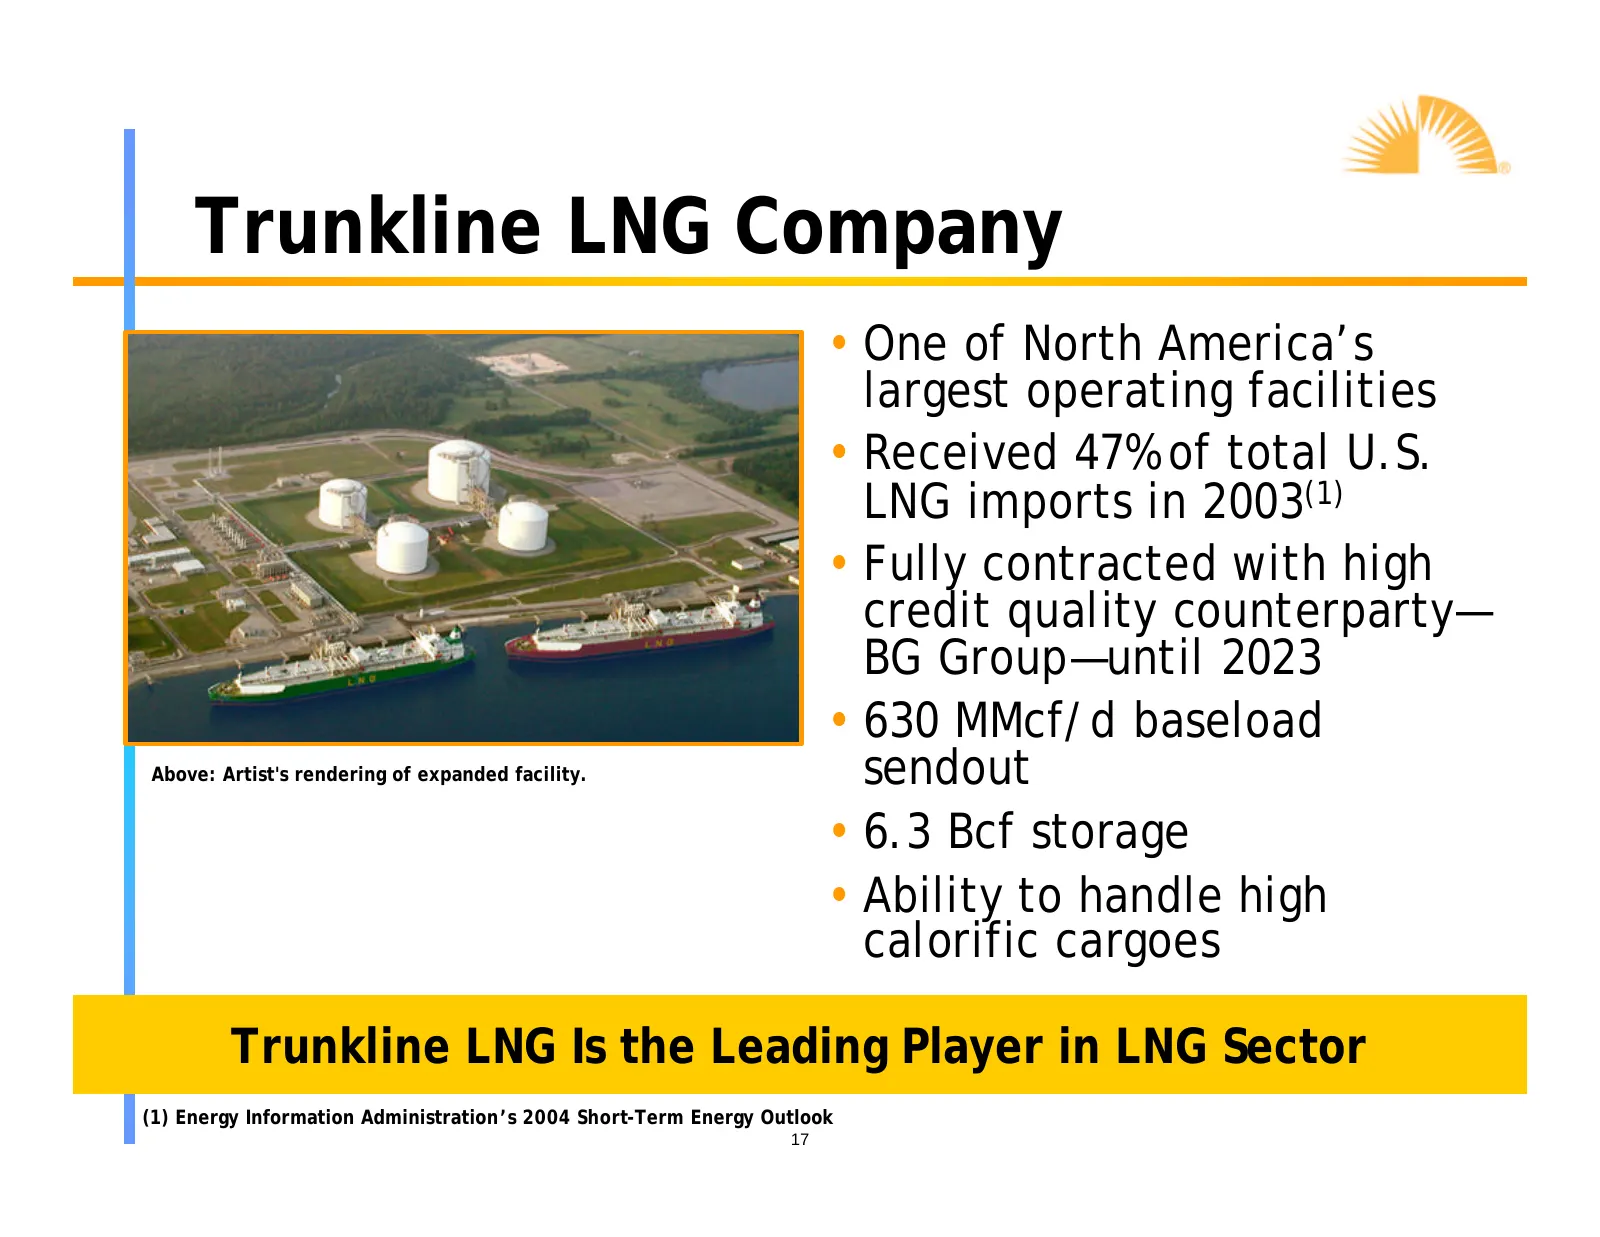
Trunkline LNG Company • One of North America’s largest operating facilities • Received 47% of total U.S. LNG imports in 2003(1) • Fully contracted with high credit quality counterparty— BG Group—until 2023 • 630 MMcf/d baseload Above: Artist's rendering of expanded facility. sendout • 6.3 Bcf storag
Slide 18: LNG Expansion Projects
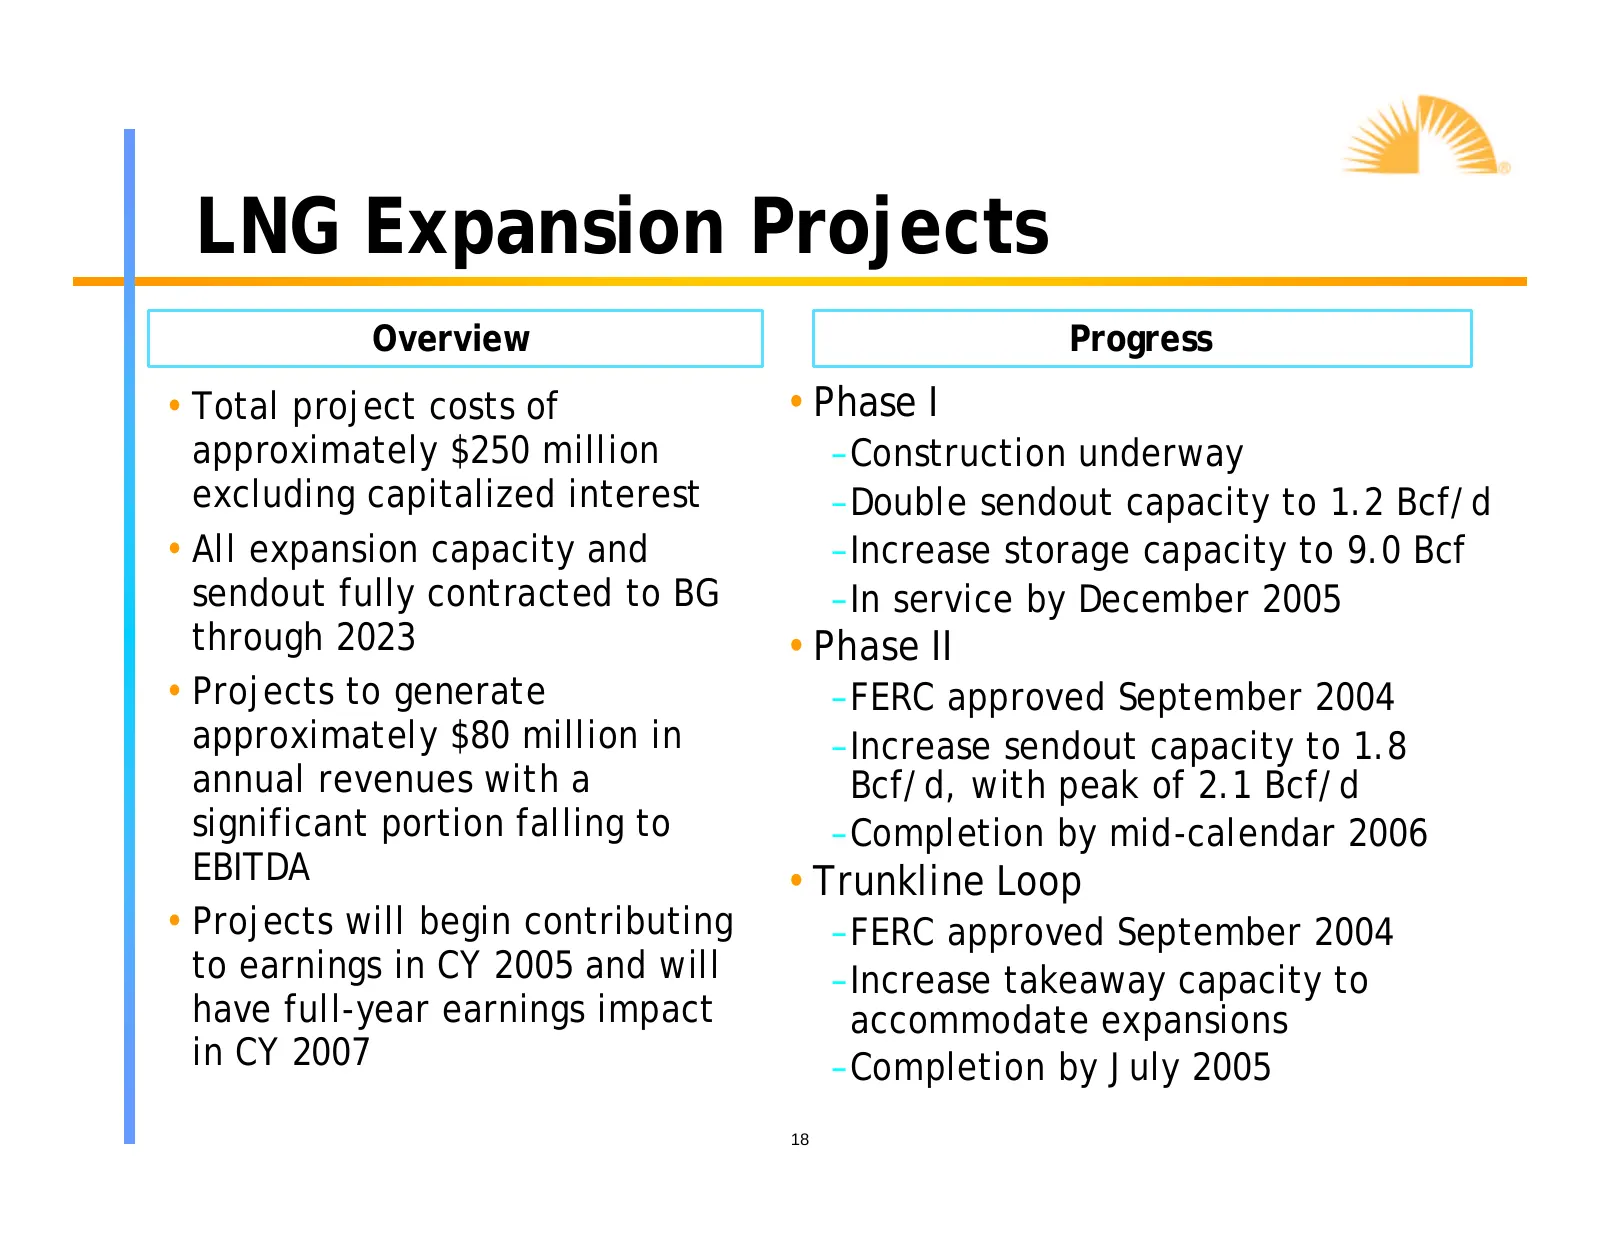
LNG Expansion Projects Overview Progress • Total project costs of • Phase I approximately $250 million – Construction underway excluding capitalized interest – Double sendout capacity to 1.2 Bcf/d • All expansion capacity and – Increase storage capacity to 9.0 Bcf sendout fully contracted to BG – In
Slide 19: Local Gas Distribution Divisions
Local Gas Distribution Divisions 19
Slide 20: Natural Gas Distribution Assets Overview
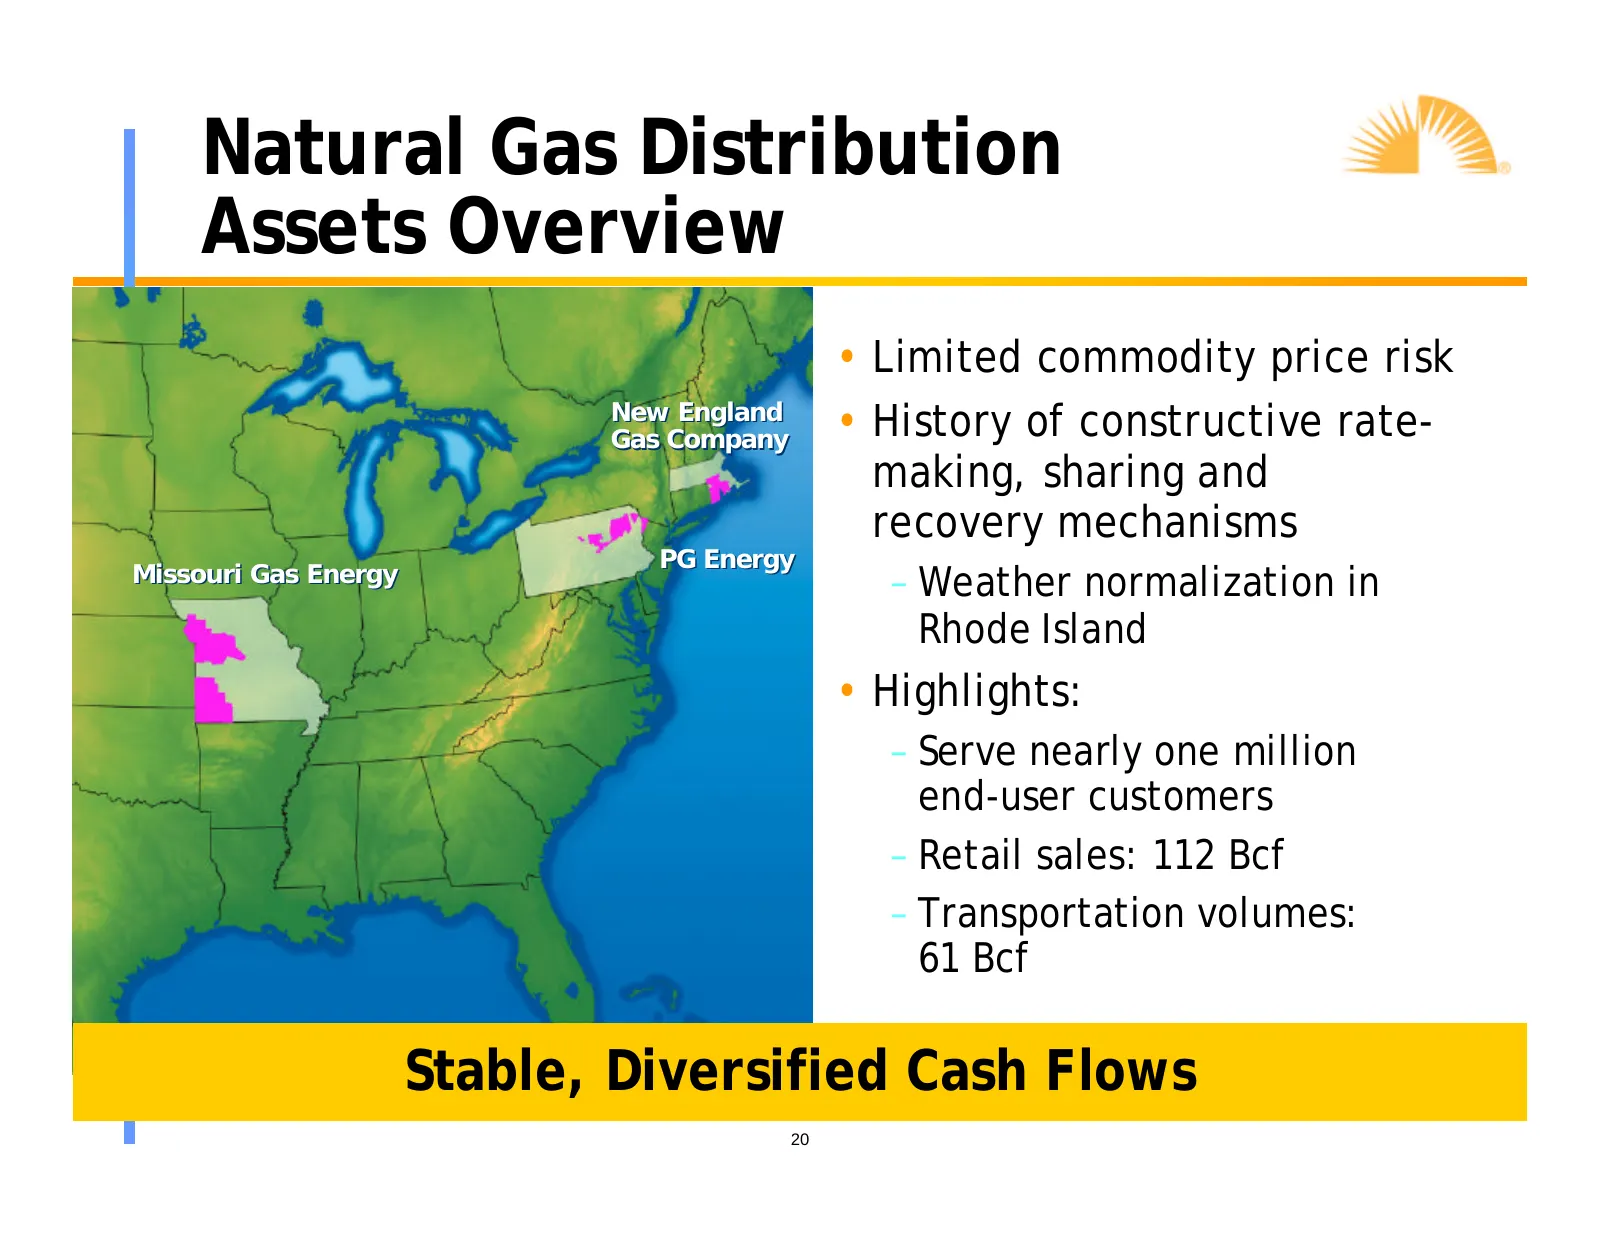
Natural Gas Distribution Assets Overview • Limited commodity price risk New England Gas Company • History of constructive rate- making, sharing and recovery mechanisms PG Energy Missouri Gas Energy – Weather normalization in Rhode Island • Highlights: – Serve nearly one million end-user customers –
Slide 21: Geographic Diversification Unified by Strong Operations
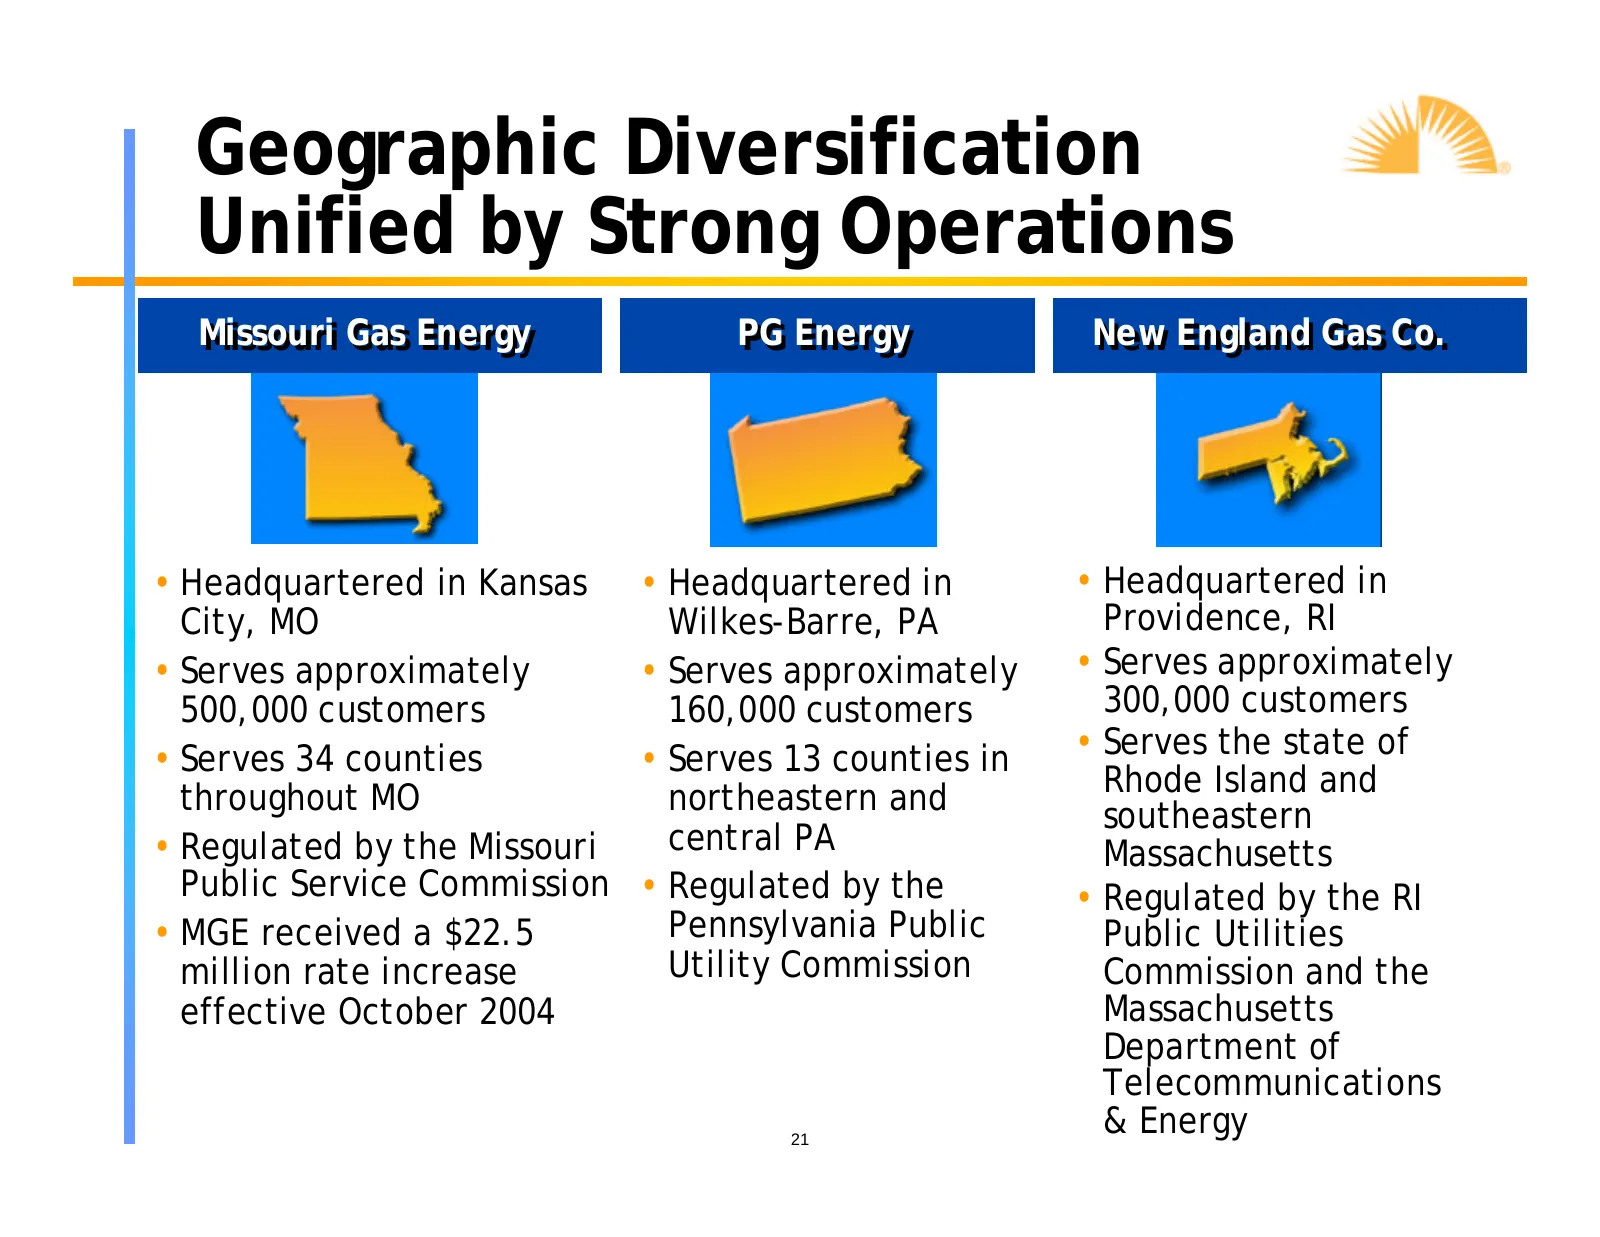
Geographic Diversification Unified by Strong Operations Missouri Missouri Gas Gas Energy Energy PG PG Energy Energy New New England England Gas Gas Co. Co. • Headquartered in Kansas • Headquartered in • Headquartered in City, MO Wilkes-Barre, PA Providence, RI • Serves approximately • Serves approxi

Slide 22: Financial Highlights
Financial Highlights 22
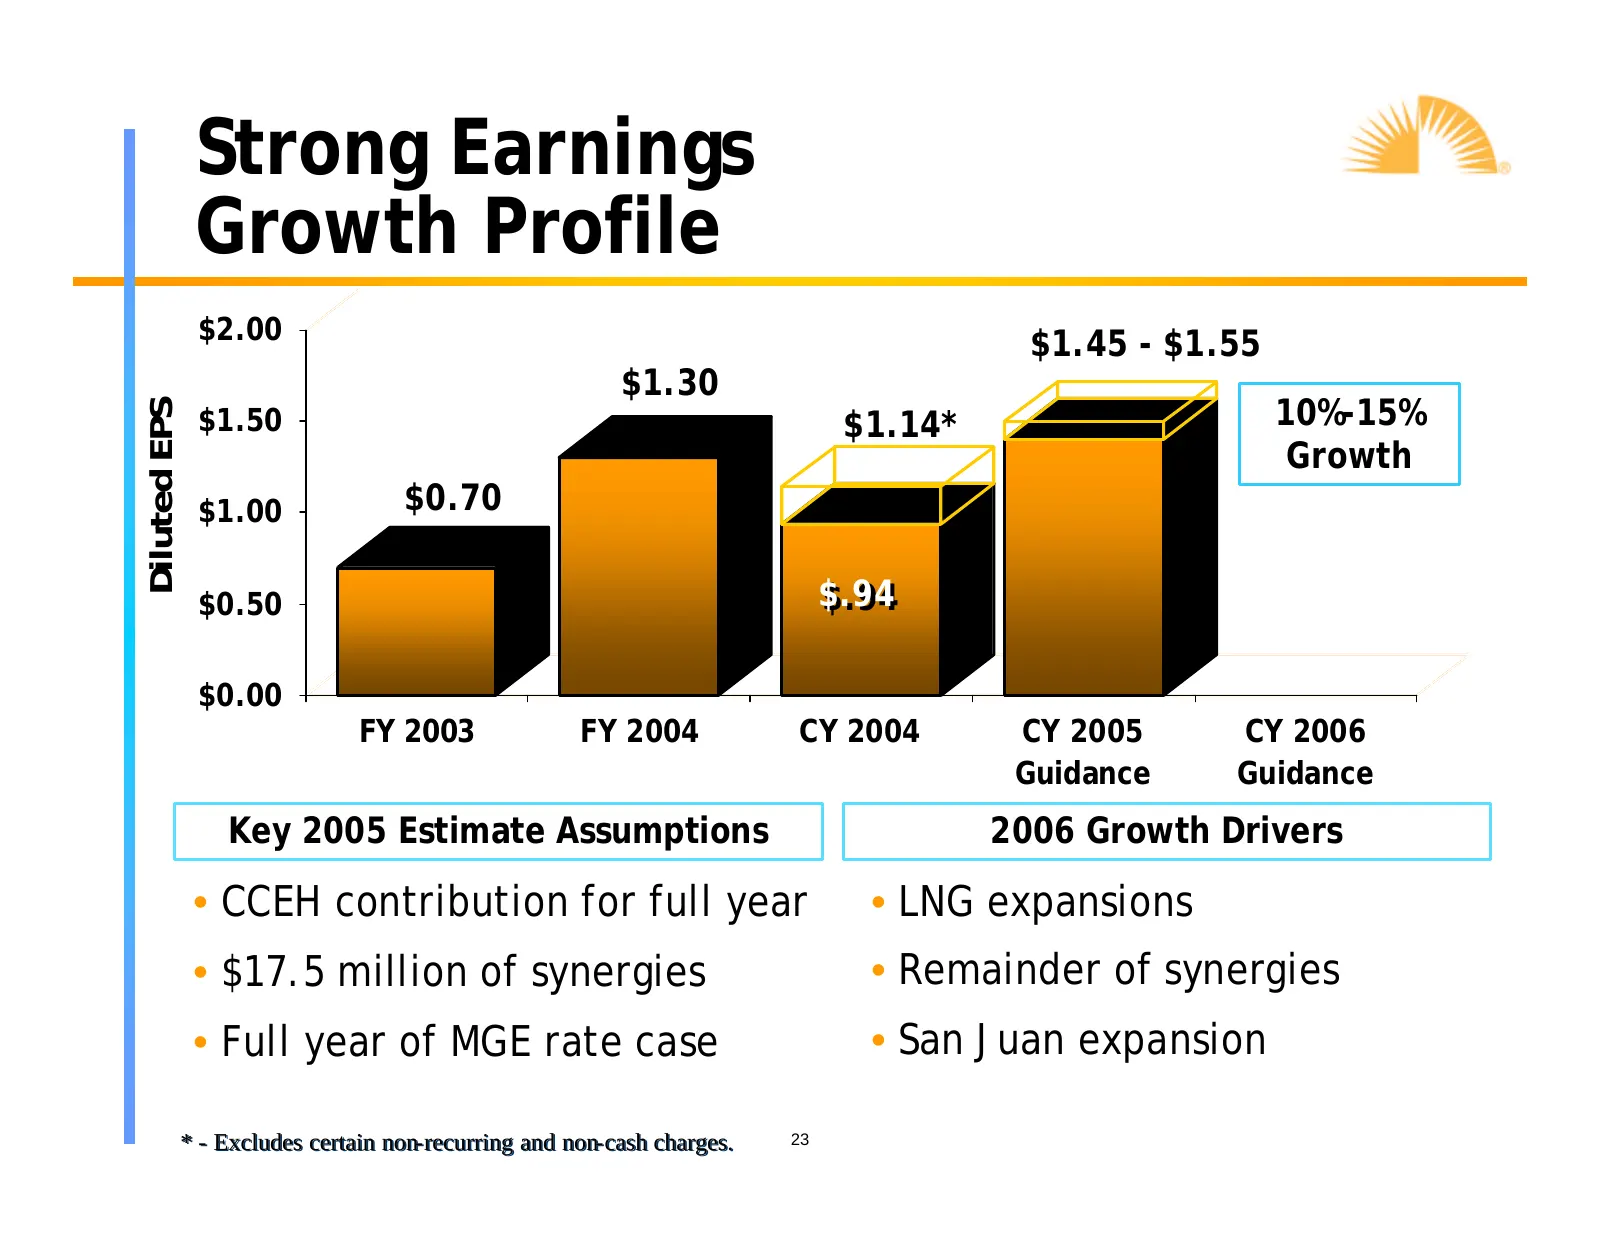
Slide 23: Strong Earnings Growth Profile
Strong Earnings Growth Profile $2.00 $1.45 - $1.55 $1.30 10%-15% Diluted EPS $1.50 $1.14* Growth $1.00 $0.70 $0.50 $.94 $.94 $0.00 FY 2003 FY 2004 CY 2004 CY 2005 CY 2006 Guidance Guidance Key 2005 Estimate Assumptions 2006 Growth Drivers • CCEH contribution for full year • LNG expansions • $17.5 mi
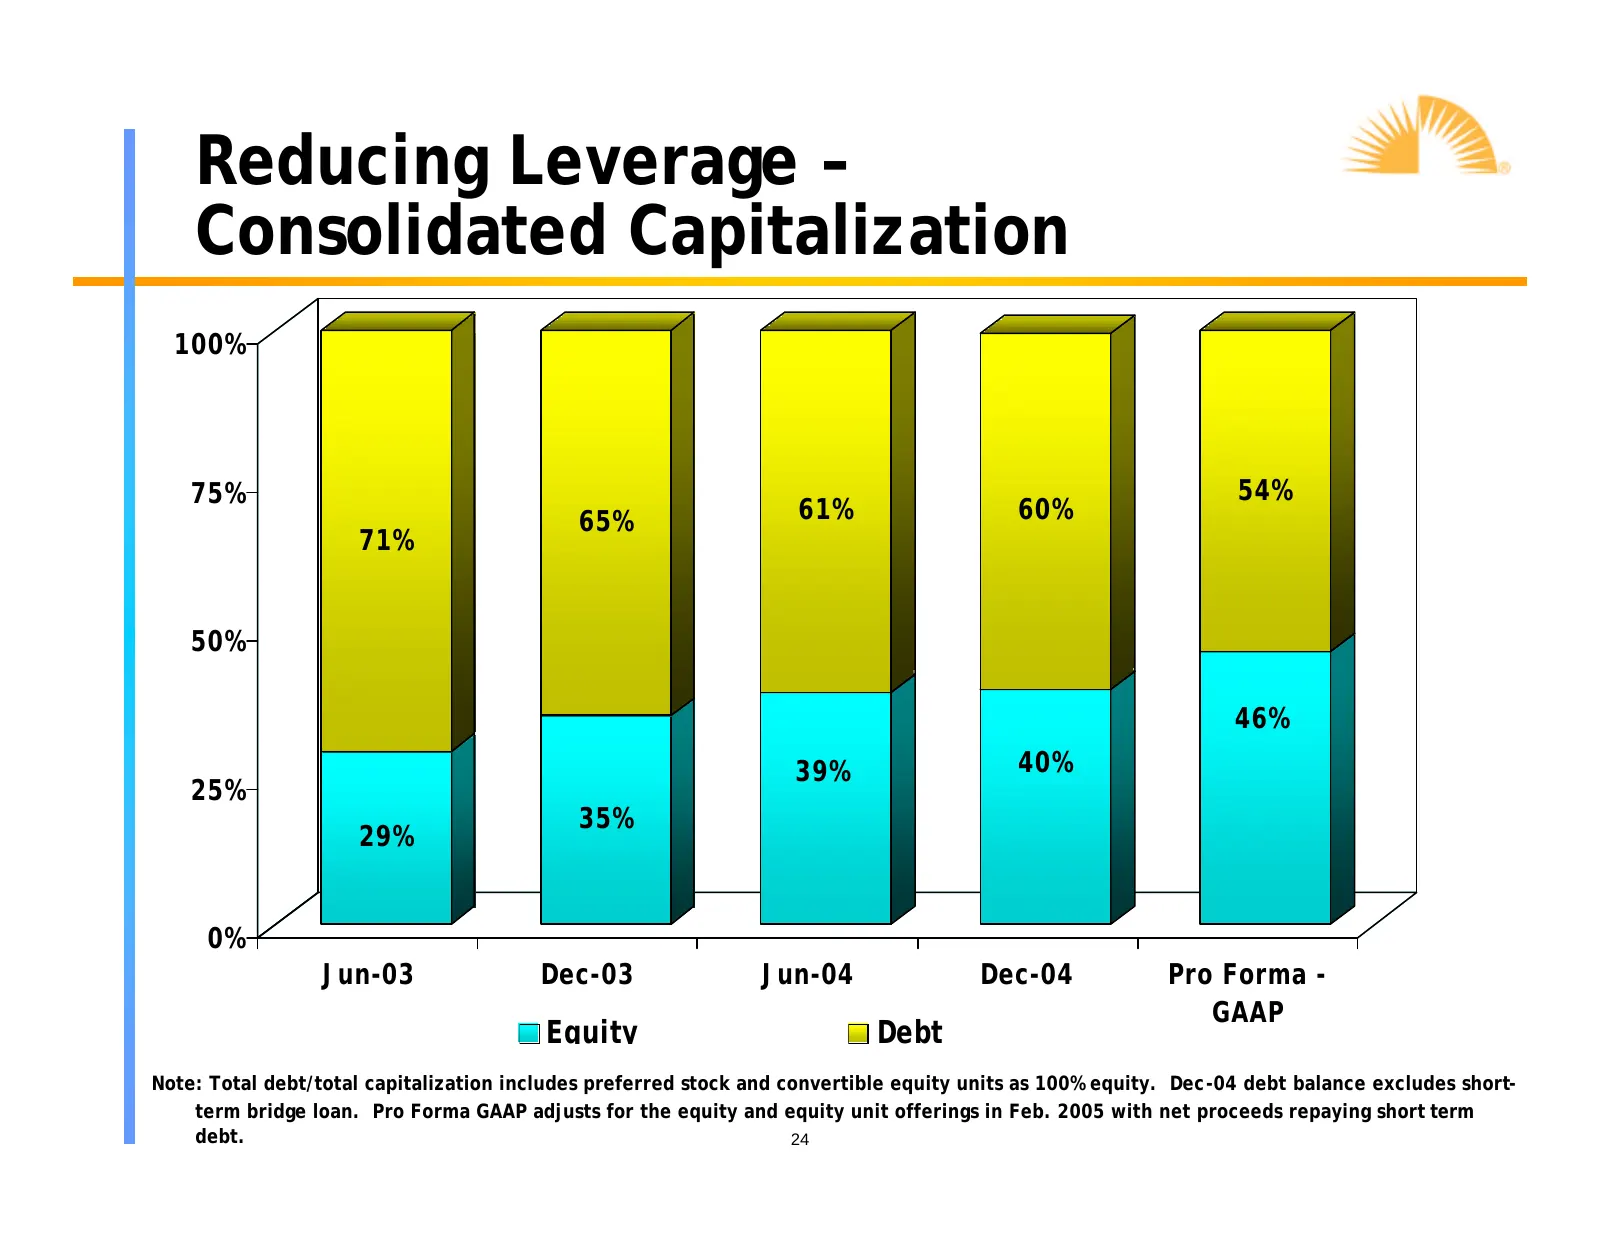
Slide 24: Reducing Leverage – Consolidated Capitalization
Reducing Leverage – Consolidated Capitalization 100% 75% 54% 65% 61% 60% 71% 50% 46% 39% 40% 25% 35% 29% 0% Jun-03 Dec-03 Jun-04 Dec-04 Pro Forma - GAAP Equity Debt Note: Total debt/total capitalization includes preferred stock and convertible equity units as 100% equity. Dec-04 debt balance exclude
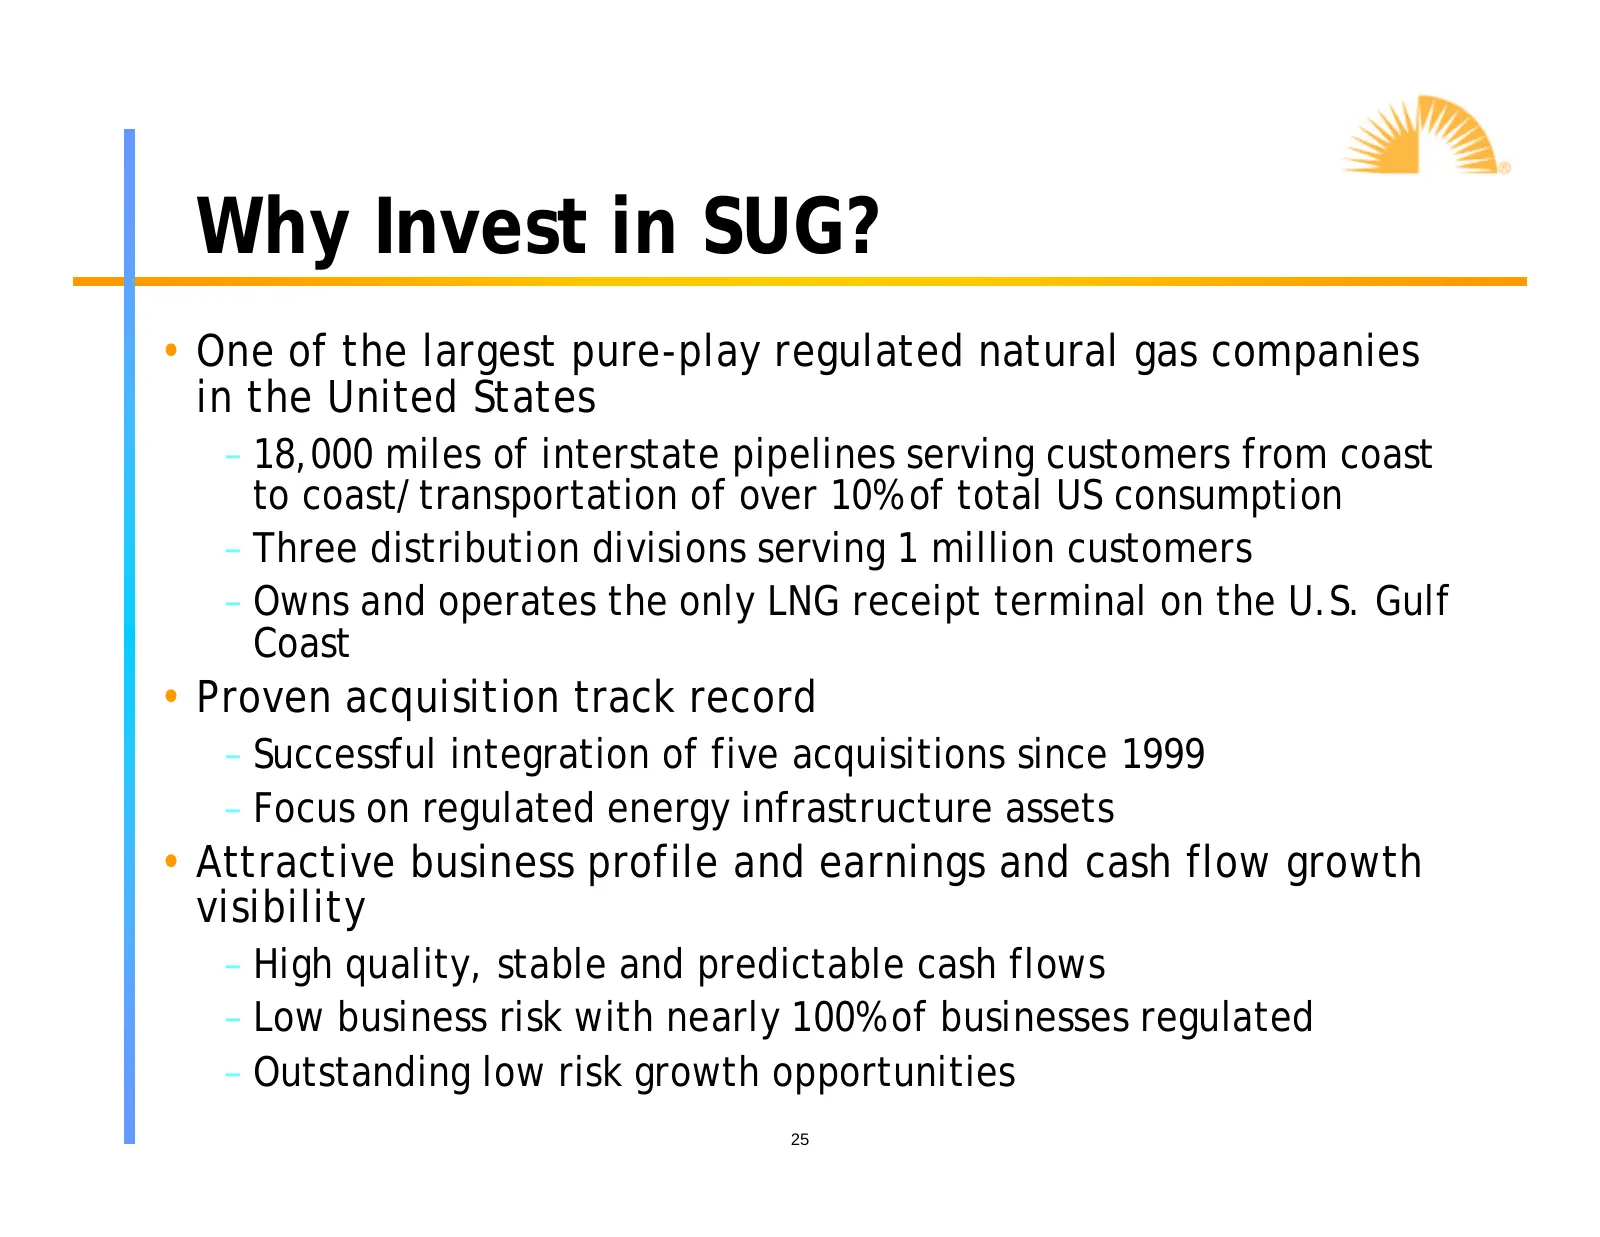
Slide 25: Why Invest in SUG?
Why Invest in SUG? • One of the largest pure-play regulated natural gas companies in the United States – 18,000 miles of interstate pipelines serving customers from coast to coast/transportation of over 10% of total US consumption – Three distribution divisions serving 1 million customers – Owns and

Slide 26: Questions & Answers
Questions & Answers 26
Source: SEC EDGAR · 8-K filed May 2, 2005
More decks from Southern Union Co
 Barclays Capital Investment Grade Energy and Pipeline Conference 201232 slides · Mar 8, 2012
 Debt Investor Presentation (February 2012)33 slides · Feb 22, 2012
 Merger or Acquisition (July 2011)11 slides · Jul 5, 2011
 Merger or Acquisition (June 2011)22 slides · Jun 16, 2011
 Investor Presentation (February 2011)37 slides · Feb 25, 2011
 BMO Capital Markets 2010 Utilities and Pipelines Day23 slides · Nov 30, 2010