Southern Union — Investor Presentation (February 2011)
37 slides from Southern Union's investor presentation, Feb 25, 2011

Slide 1: 2011 Financial Outlook
2011 Financial Outlook February 25, 2011
Slide 2: Contents
Contents • Company Overview • Business Segments • 2011 Financial Outlook • 2011 Growth Projects • Appendix 2
Slide 3: Company Overview
Company Overview Southern Union Company
Slide 4: Highlights
Highlights g g • Focus on natural gas infrastructure • Attractive industry outlook • Natural gas is key to America’s America s energy future • High-quality assets with diverse supply and strong markets • Principally regulated asset base • Provides earnings and cash flow stability through long-term c
Slide 5: Financial Highlights
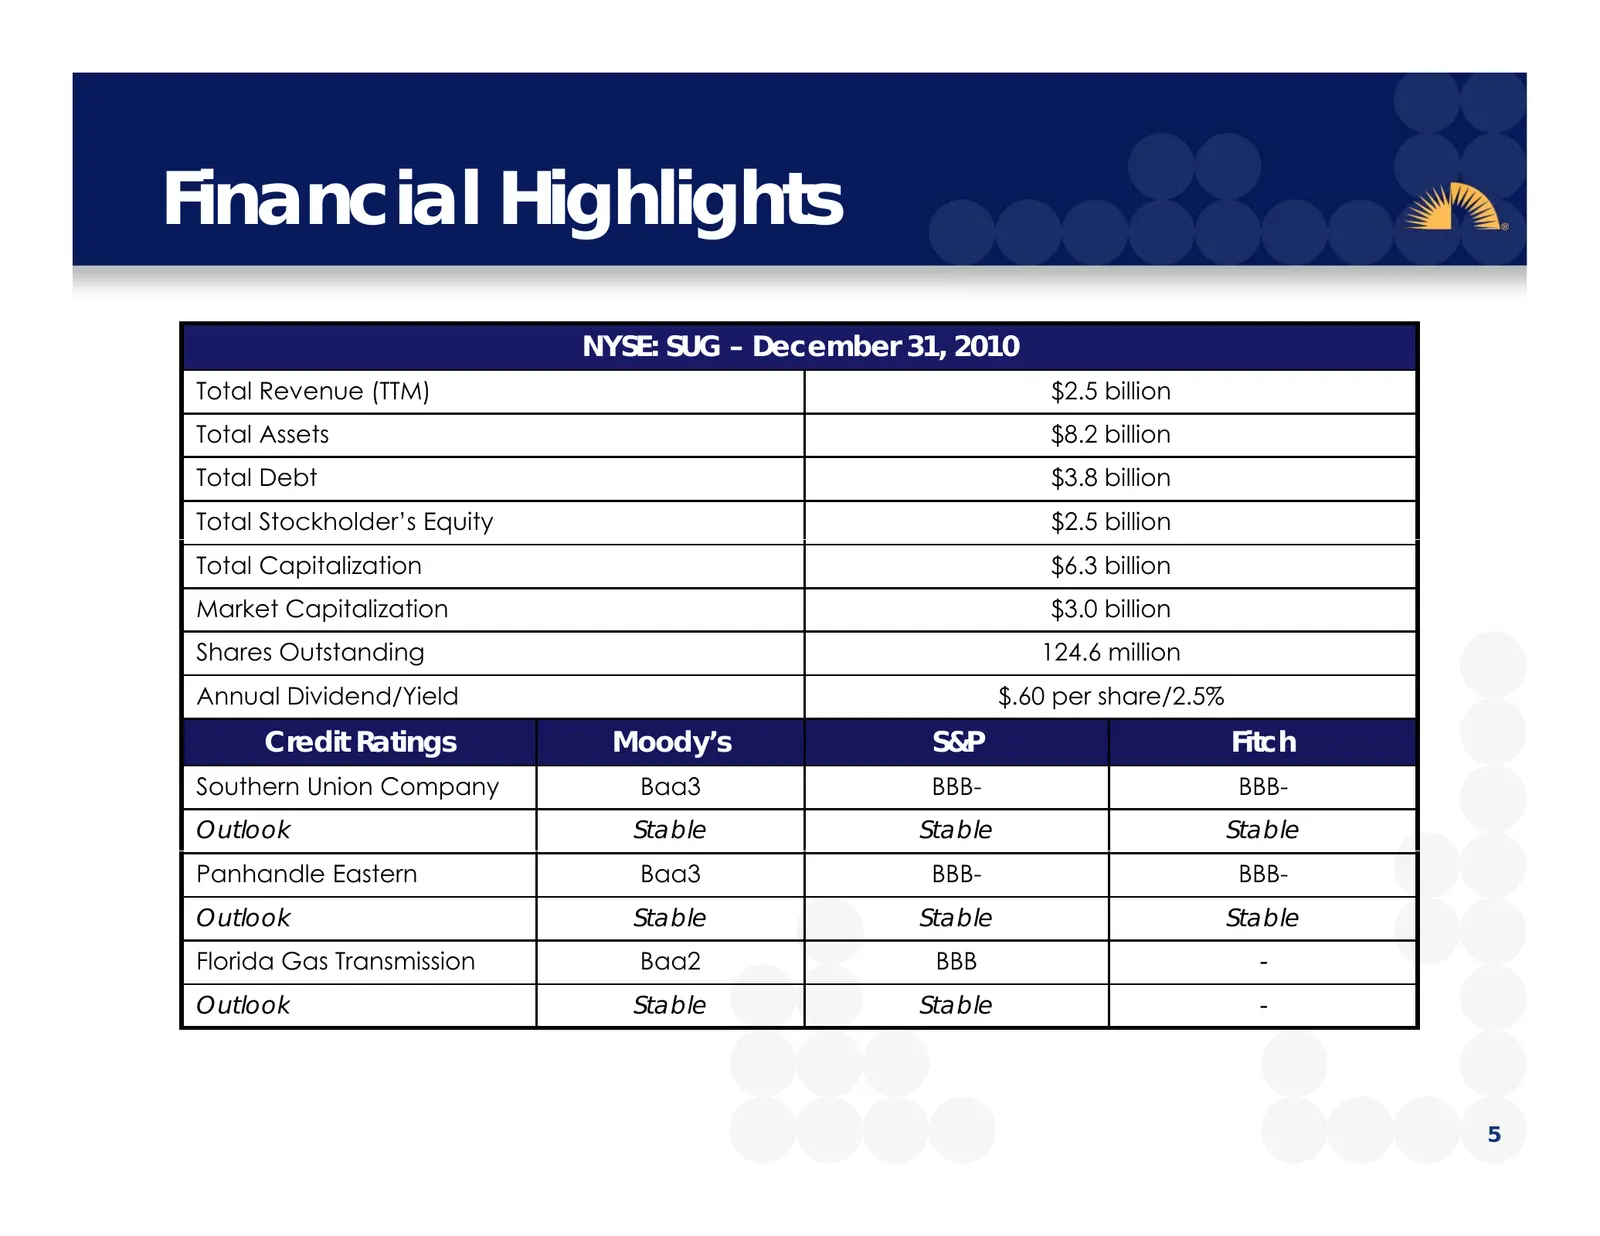
Financial Highlights g g NYSE: SUG – December 31, 2010 T t l Revenue Total R (TTM) $2 5 billi $2.5 billion Total Assets $8.2 billion Total Debt $3.8 billion Total Stockholder’s Equity $2.5 billion Total Capitalization $6.3 billion Market Capitalization $3.0 billion Shares Outstanding 124.6 million A
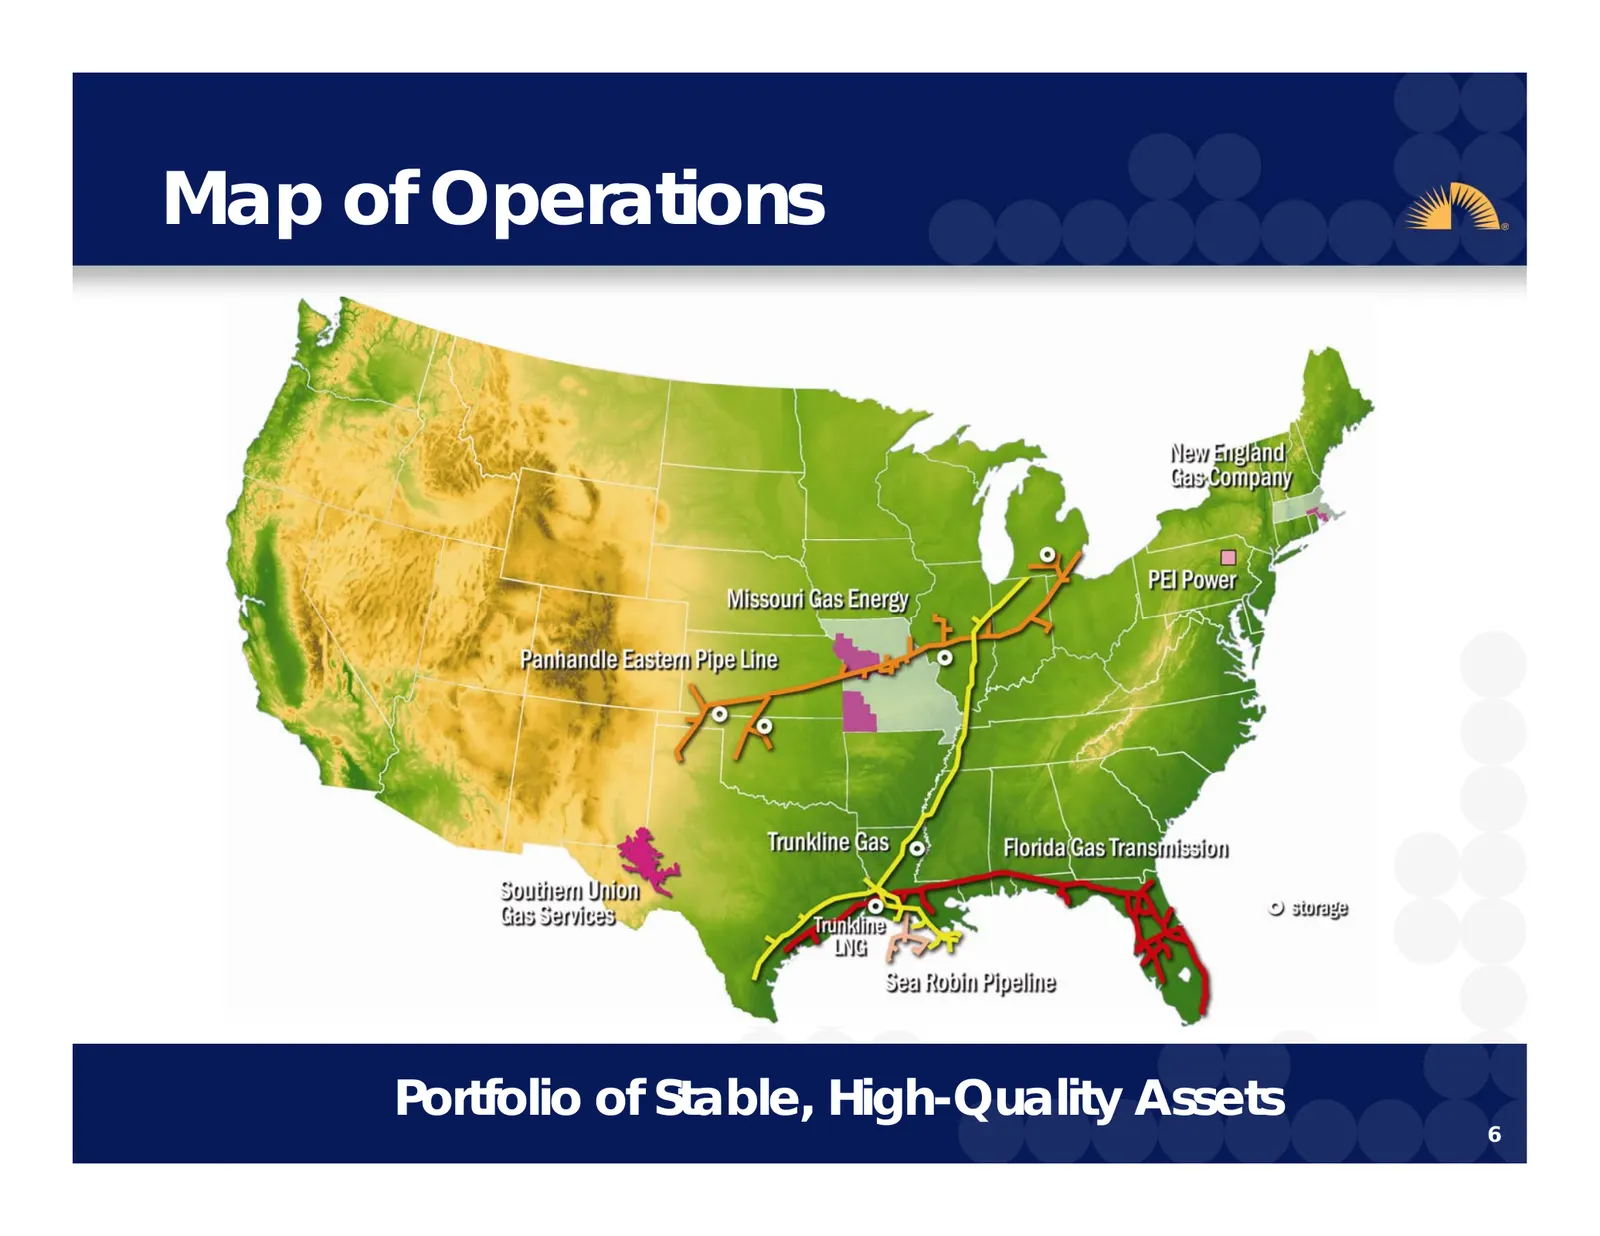
Slide 6: Map of Operations
Map p of Operations p Portfolio of Stable, High-Quality Assets 6
Slide 7: Business Segments
Business Segments Southern Union Company
Slide 8: Transportation & Storage Segment
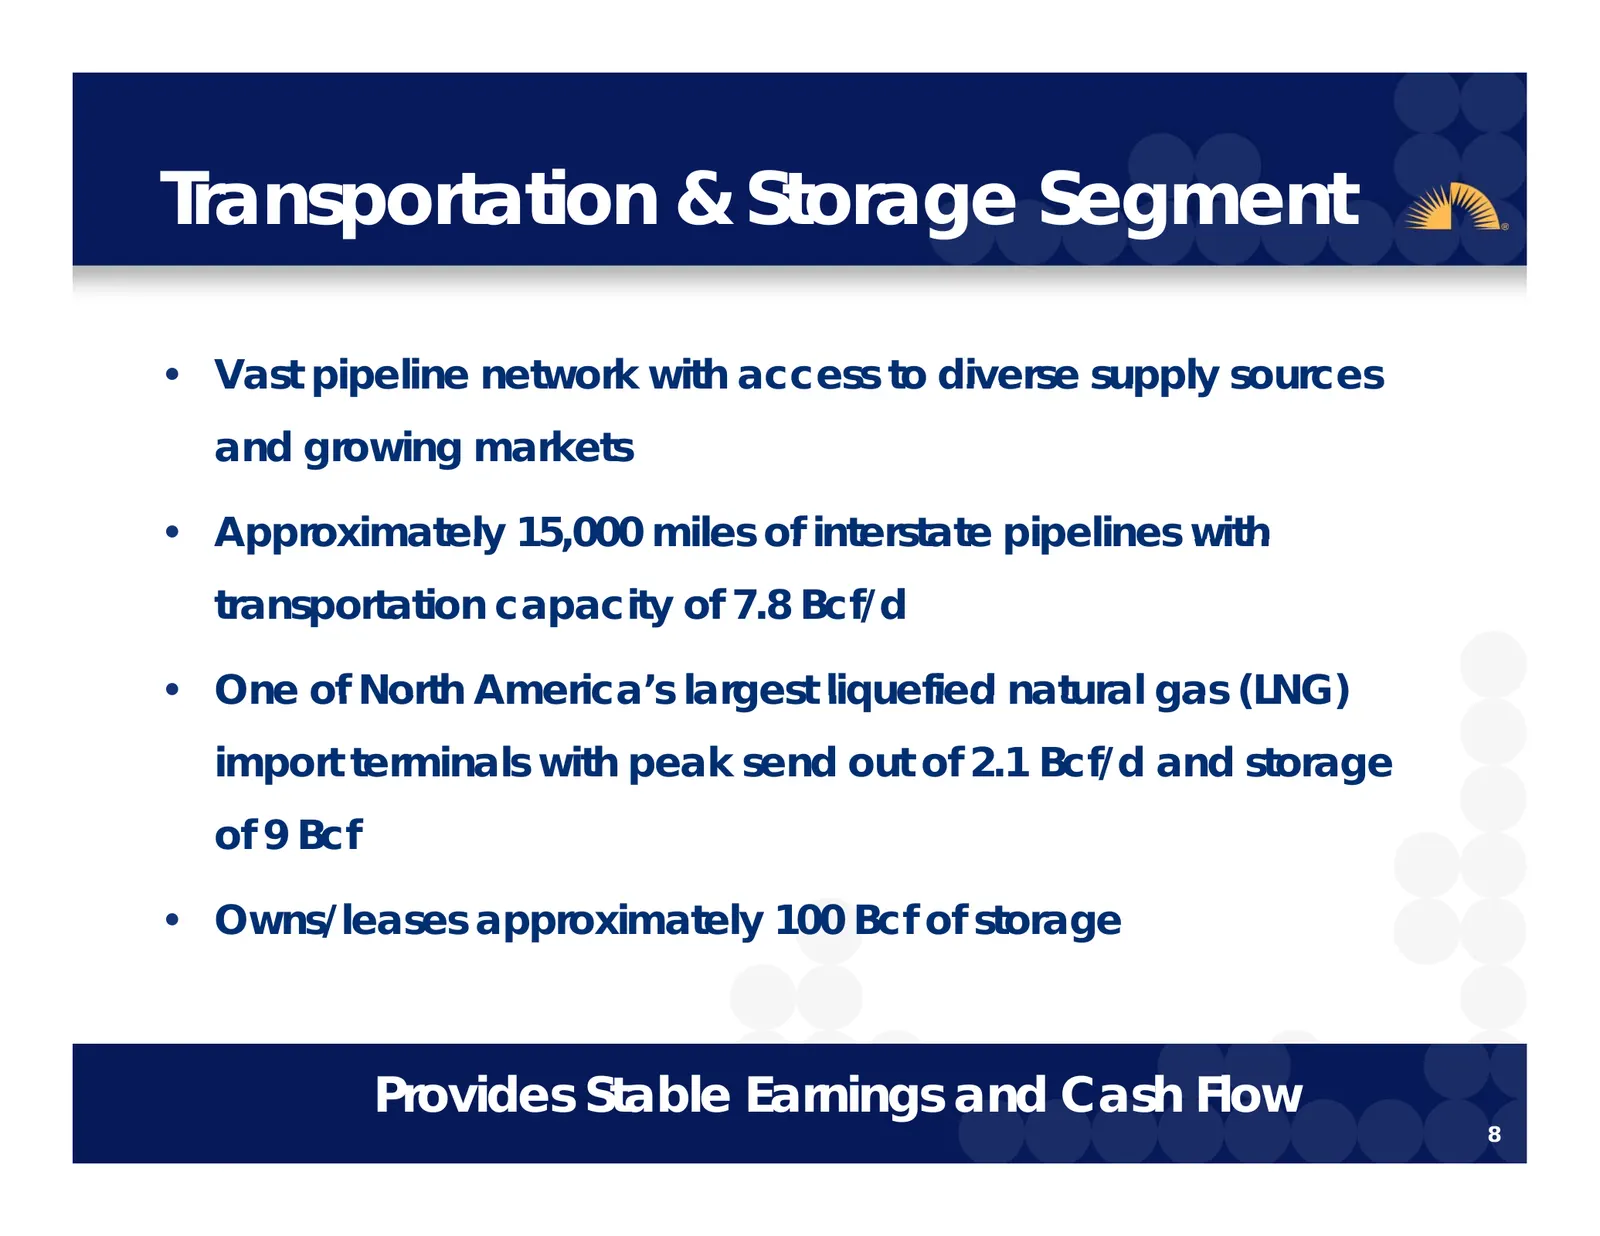
Transportation p & Storage g Segment g • Vast pipeline network with access to diverse supply sources and growing markets • Approximately 15,000 15 000 miles of interstate pipelines with transportation capacity of 7.8 Bcf/d • One of North America’s America s largest liquefied natural gas (LNG) import
Slide 9: Transportation & Storage Assets
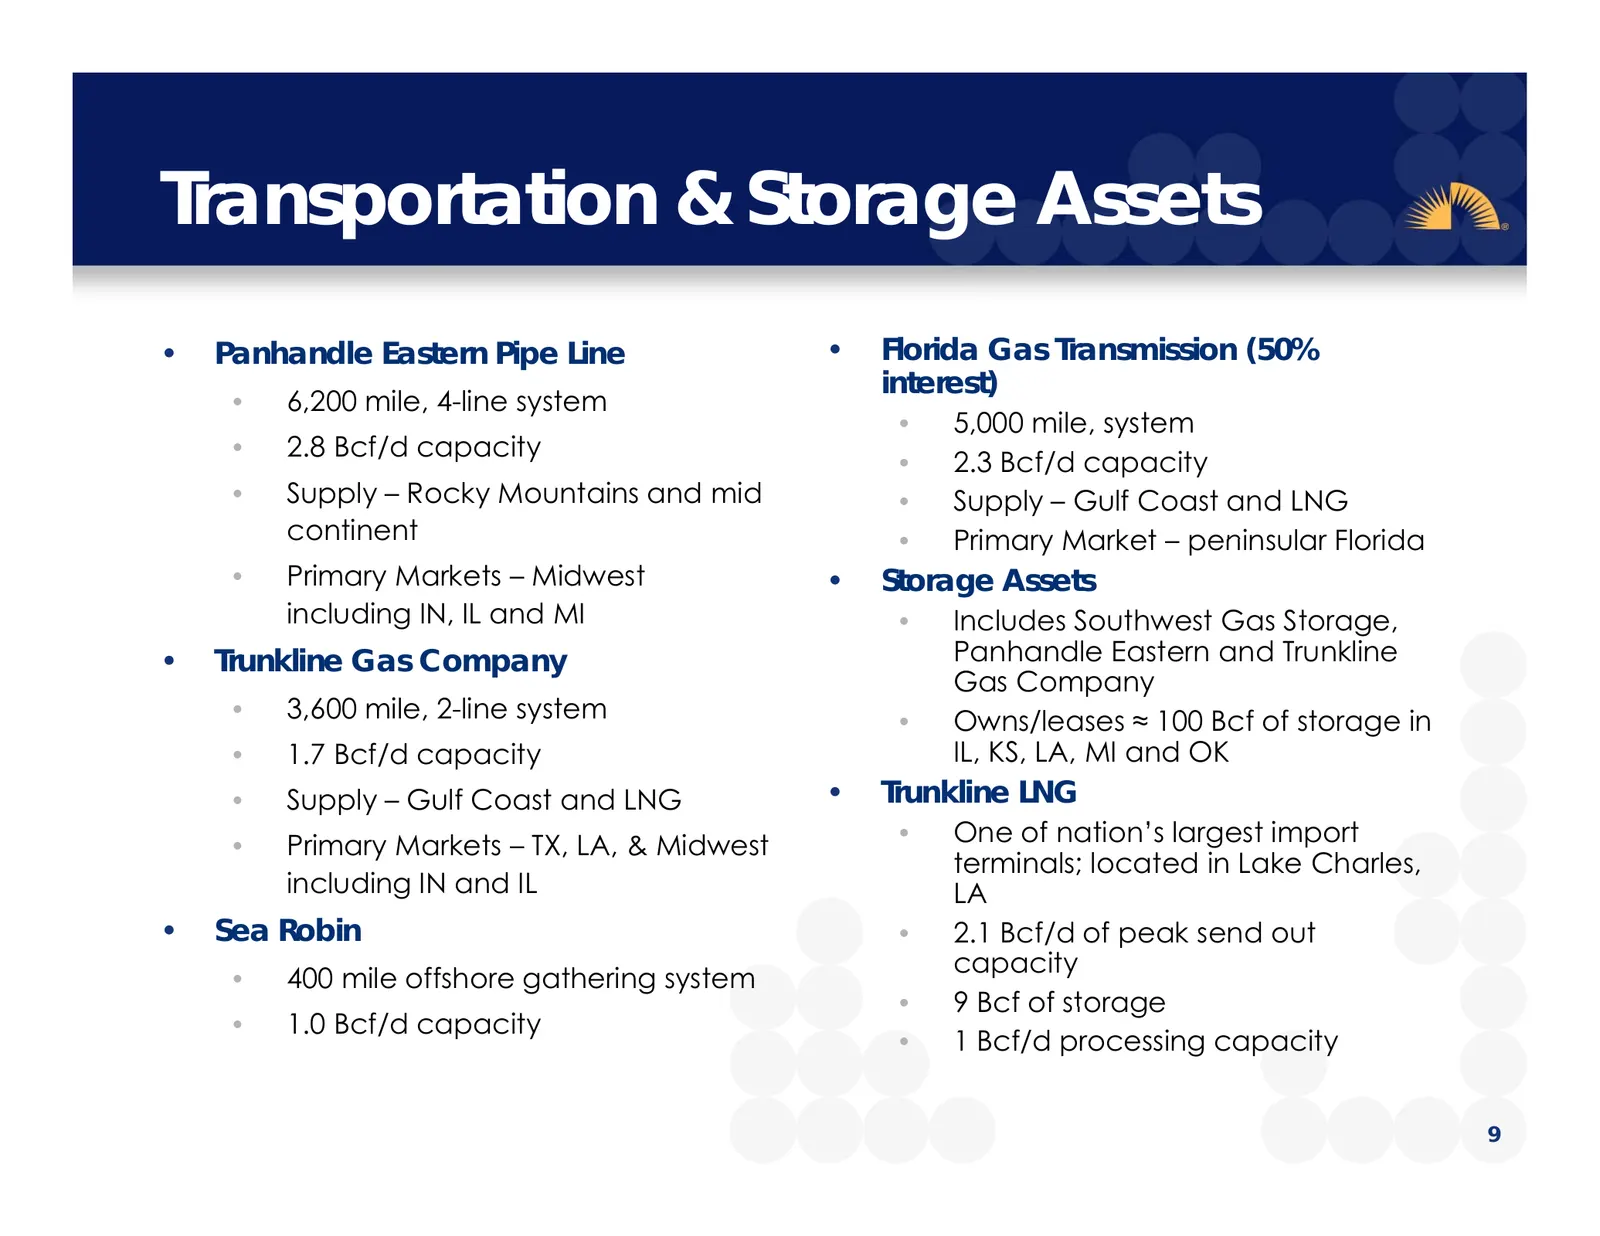
Transportation p & Storage g Assets • Panhandle Eastern Pipe Line • Florida Gas Transmission (50% interest) • 6,200 mile, 4-line system • 5,000 mile, system • 2.8 Bcf/d capacity • 2.3 Bcf/d capacity • Supply – Rocky Mountains and mid • Supply – Gulf Coast and LNG continent • Primary Market – peninsu
Slide 10: Gathering & Processing Segment
Gathering g & Processing g Segment g • Located in prolific, long-lived Permian Basin • Approximately 5,500 miles of natural gas and natural gas liquids pipelines covering 16 counties in West Texas/Southeast New Mexico • Fully-integrated midstream system interconnected via high-pressure transfer syst
Slide 11: Distribution Segment
Distribution Segment g • Missouri G Gas Energy gy • Provides natural gas to over 500,000 customers • Nearly y 13,000 miles of main and service lines • New England Gas Company • Provides natural g gas to 50,000 customers • Nearly 2,000 miles of main and service lines • Requested a $6.2 million annual
Slide 12: Corporate & Other Activities
Corporate p & Other Activities • Corporate segment provides administrative and support functions to business segments and allocates expenses as appropriate • Other segment g p primarily y consists of PEI Power Corporation which owns interests in and operates 75 MW of generating assets in the PJM ISO
Slide 13: 2011 Financial Outlook
2011 Financial Outlook Southern Union Company
Slide 14: 2011 Outlook
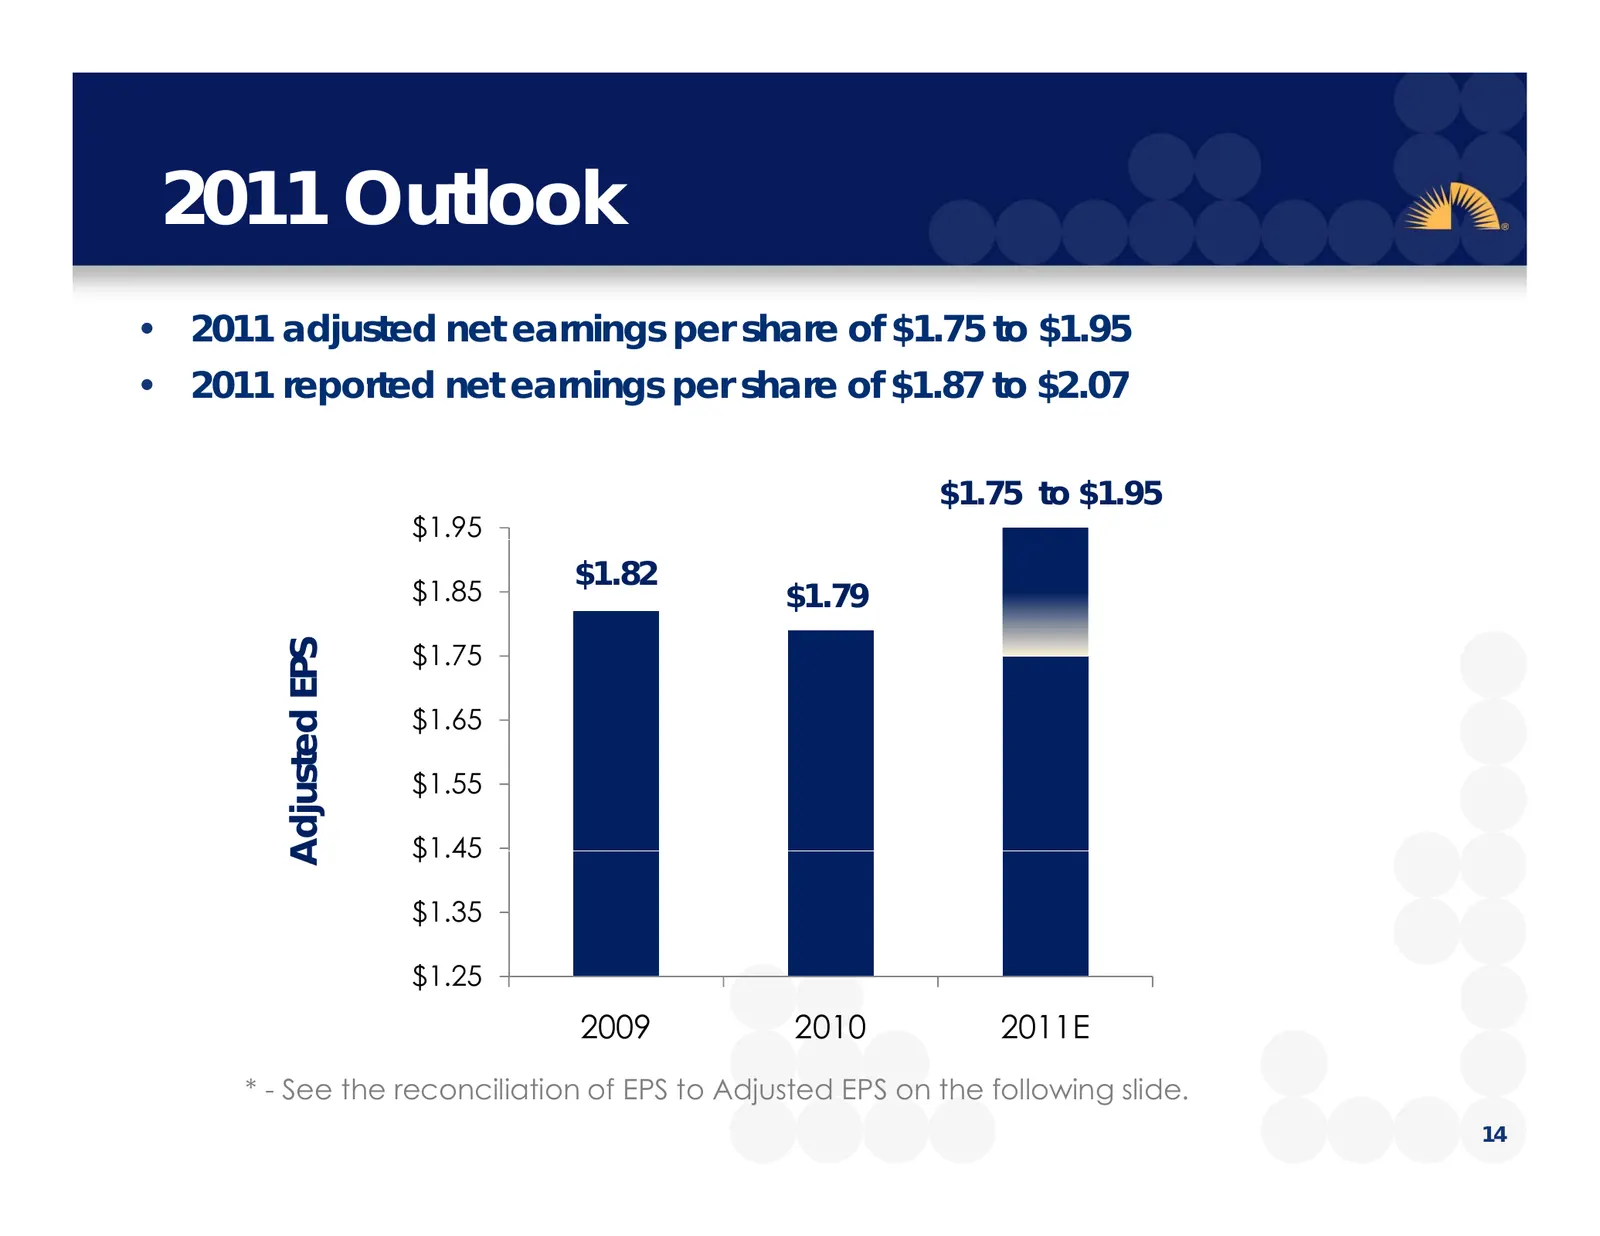
2011 Outlook • 2011 adjusted net earnings per share of $1.75 to $1.95 • 2011 reported net earnings per share of $1.87 $1 87 to $2.07 $2 07 $1.75 to $1.95 $1.95 $ $1.82 $1.85 $1.79 $1.75 EPS Adjusted E $1.65 $1.55 $1 45 $1.45 A $1.35 $1.25 2009 2010 2011E * - See the reconciliation of EPS to Adjusted
Slide 15: EPS Reconciliation
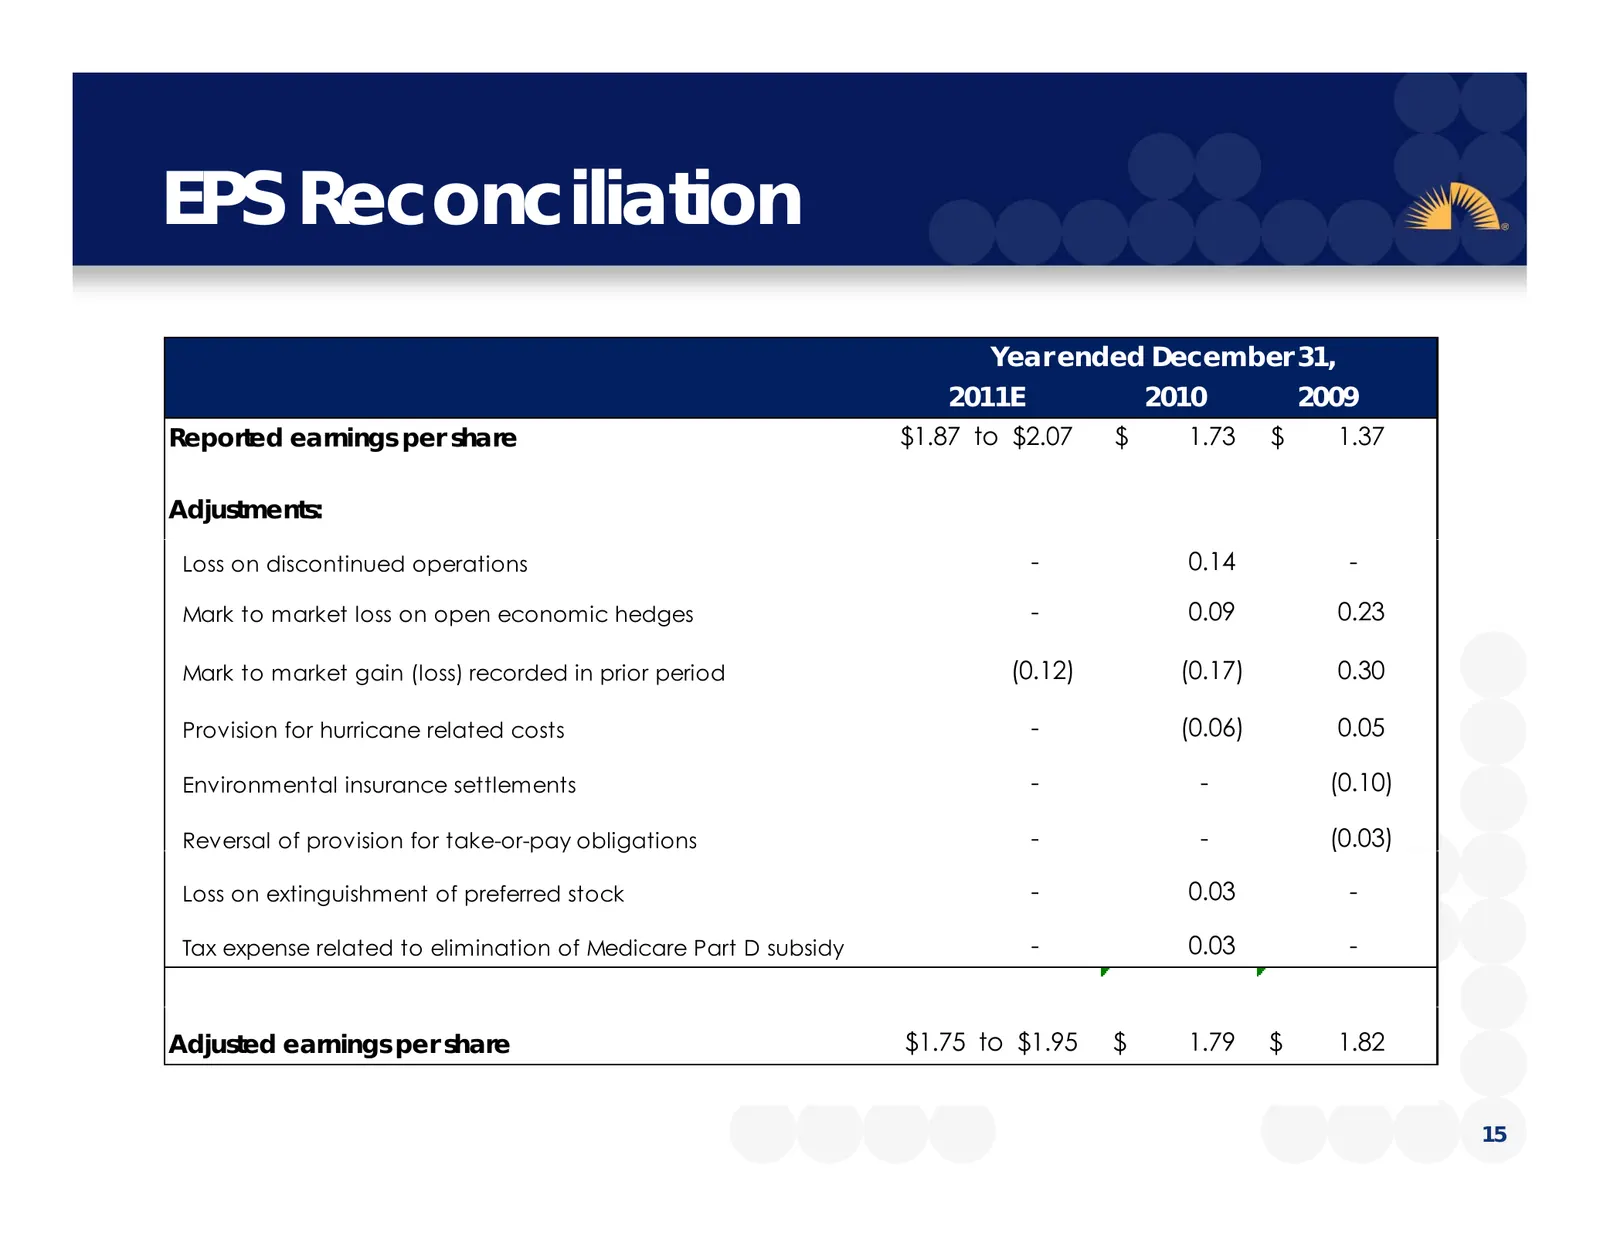
EPS Reconciliation Year ended December 31, 2011E 2010 2009 Reported earnings per share $1.87 to $2.07 $ 1.73 $ 1.37 Adjustments: Loss on discontinued operations - 0.14 - Mark to market loss on open economic hedges - 0.09 0.23 Mark to market gain (loss) recorded in prior period (0.12) (0.17) 0.30 Pro
Slide 16: 2011 Consolidated Adjusted EBITDA
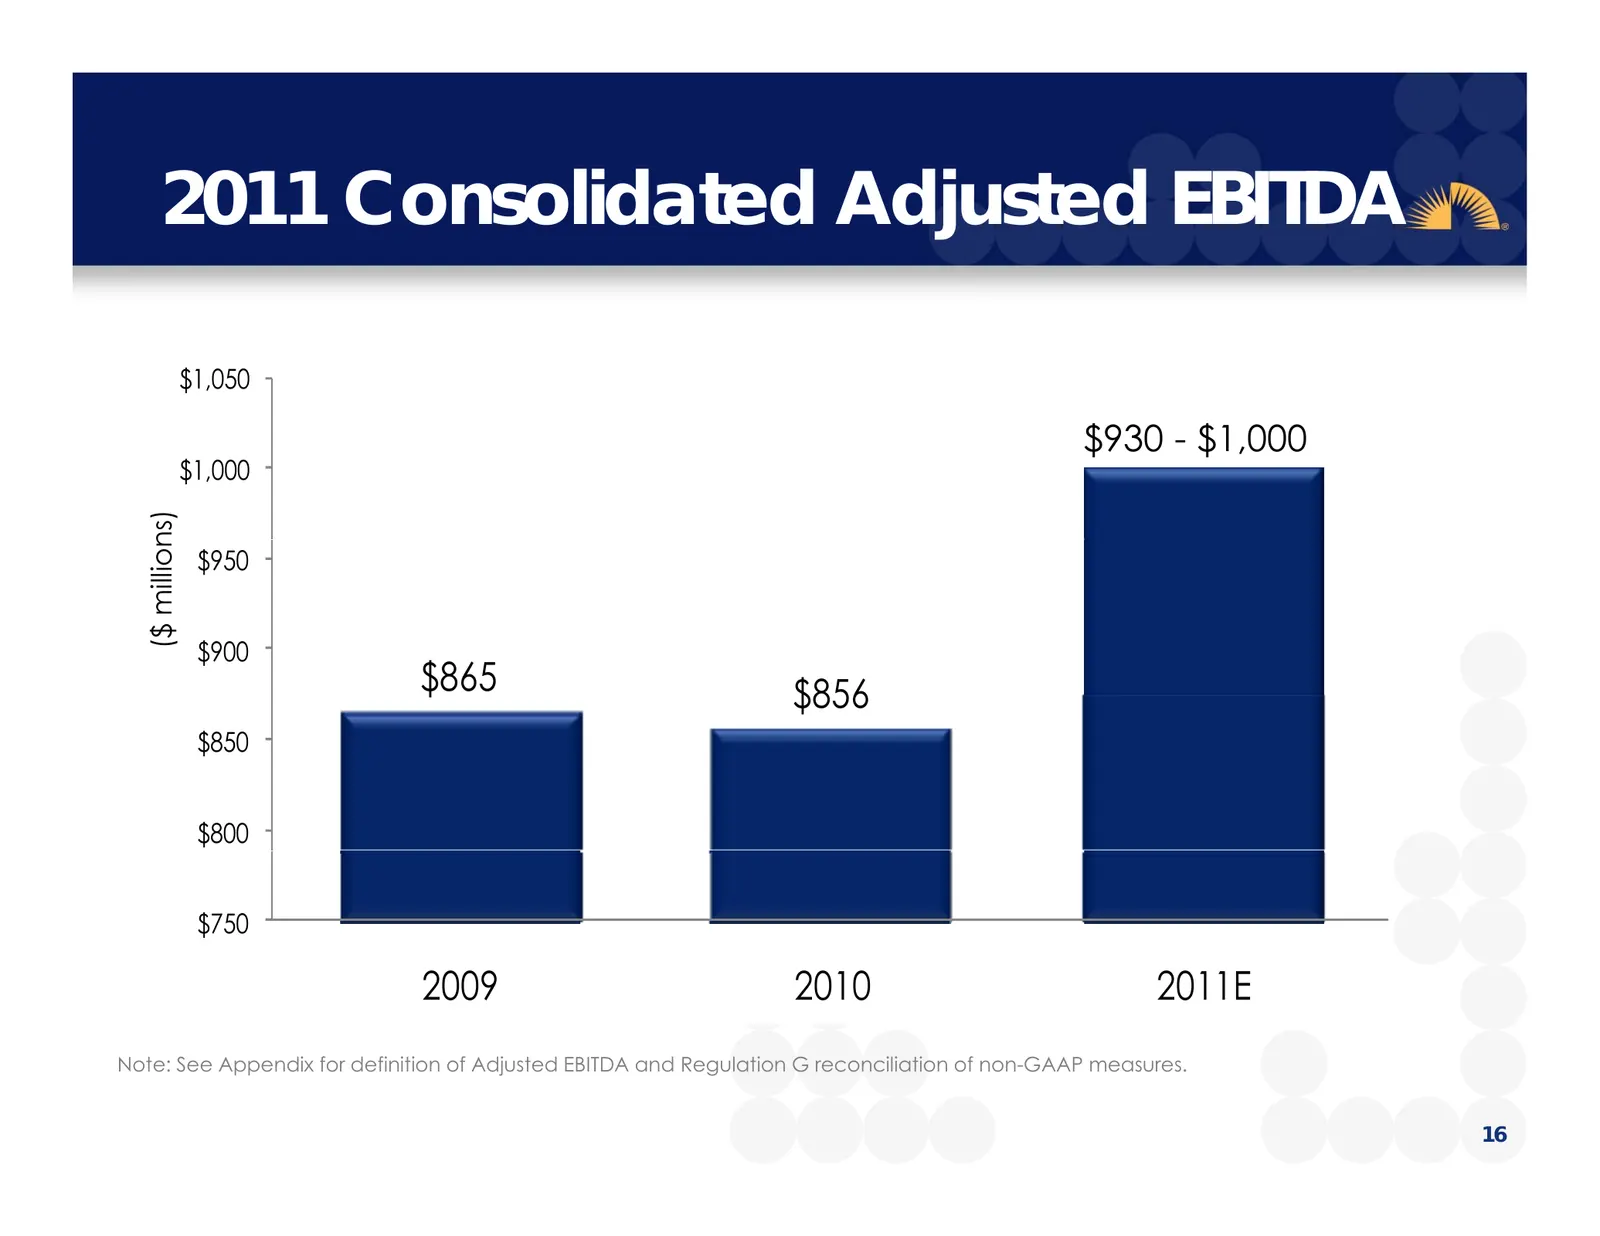
2011 Consolidated Adjusted j EBITDA $1 050 $1,050 $930 - $1,000 $1,000 ns) ($ million $950 $900 $$865 $856 $850 $800 $750 2009 2010 2011E Note: See Appendix for definition of Adjusted EBITDA and Regulation G reconciliation of non-GAAP measures. 16
Slide 17: 2011 Adjusted Segment EBITDA
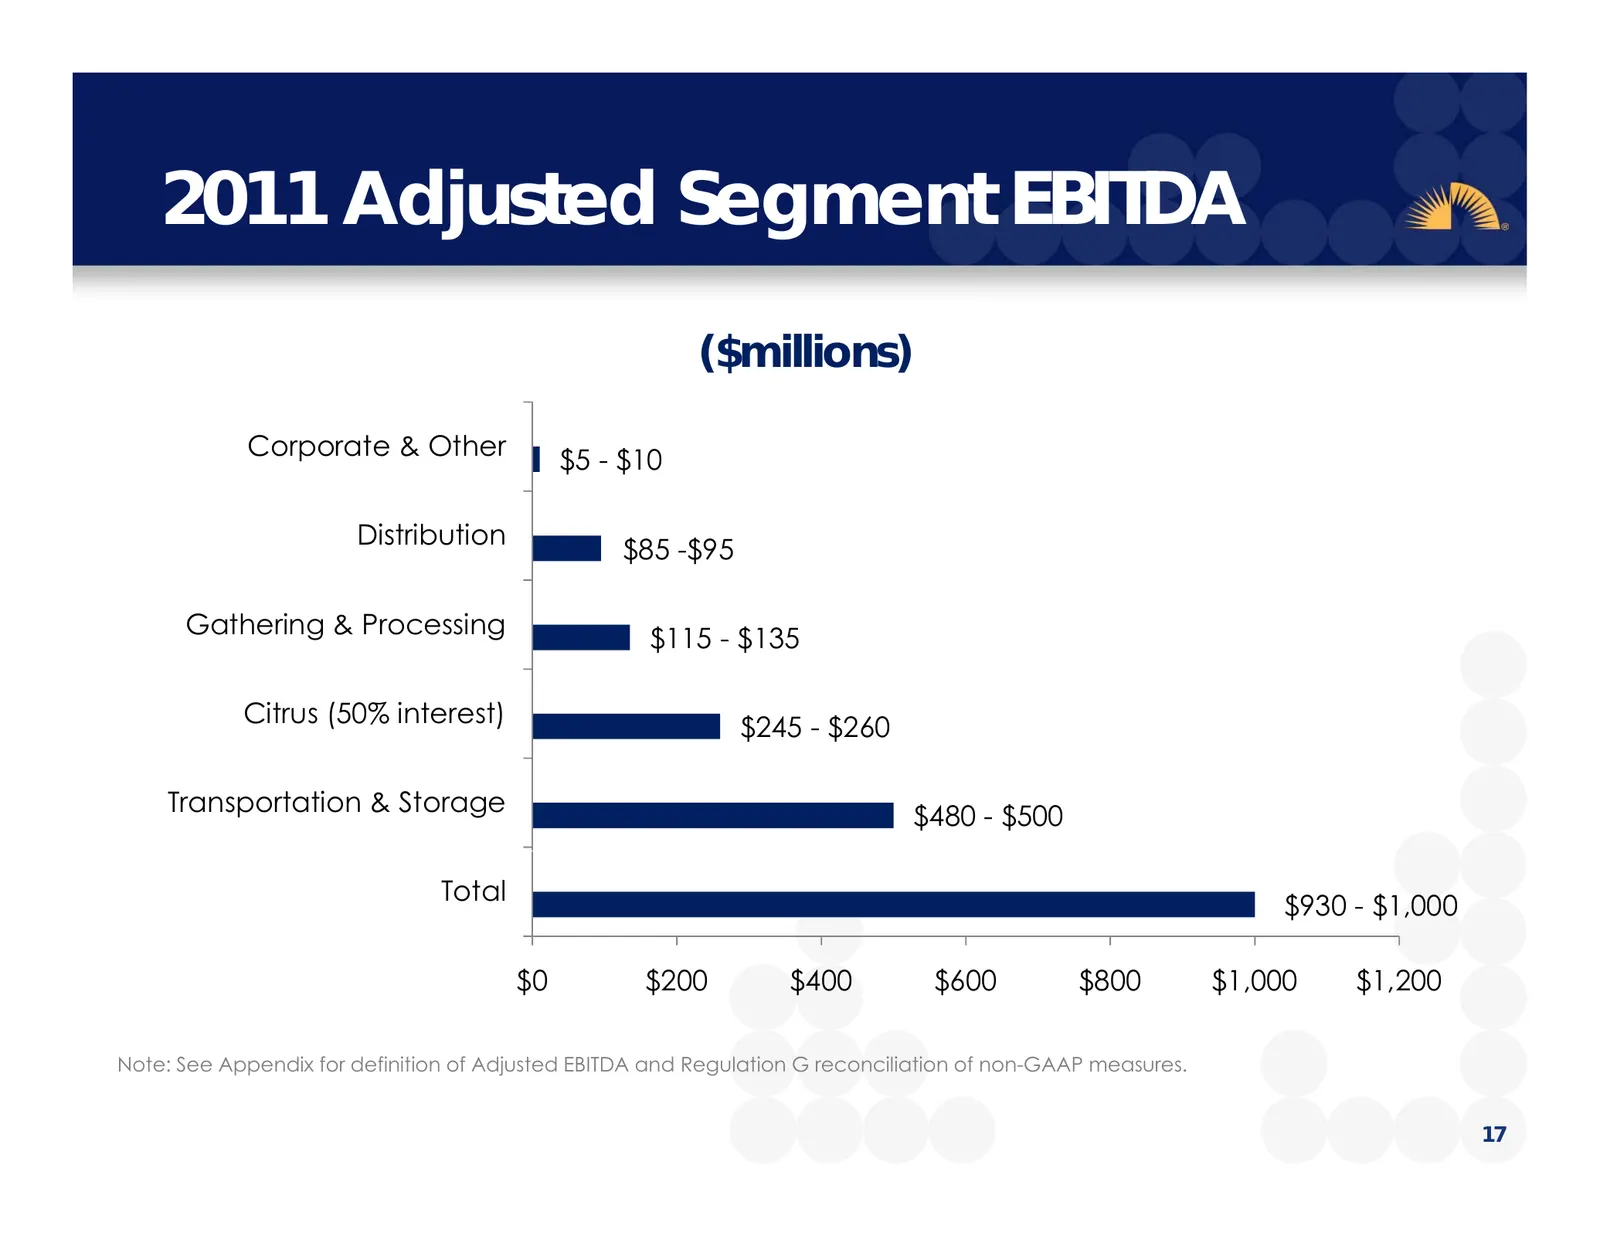
2011 Adjusted j Segment g EBITDA ($millions) Corporate & Other $5 - $10 Distribution $85 -$95 $95 Gathering & Processing $115 - $135 Citrus (50% interest) $245 - $260 Transportation & Storage $480 - $500 Total $930 - $1,000 $0 $200 $400 $600 $800 $1,000 $1,200 Note: See Appendix for definition of Ad
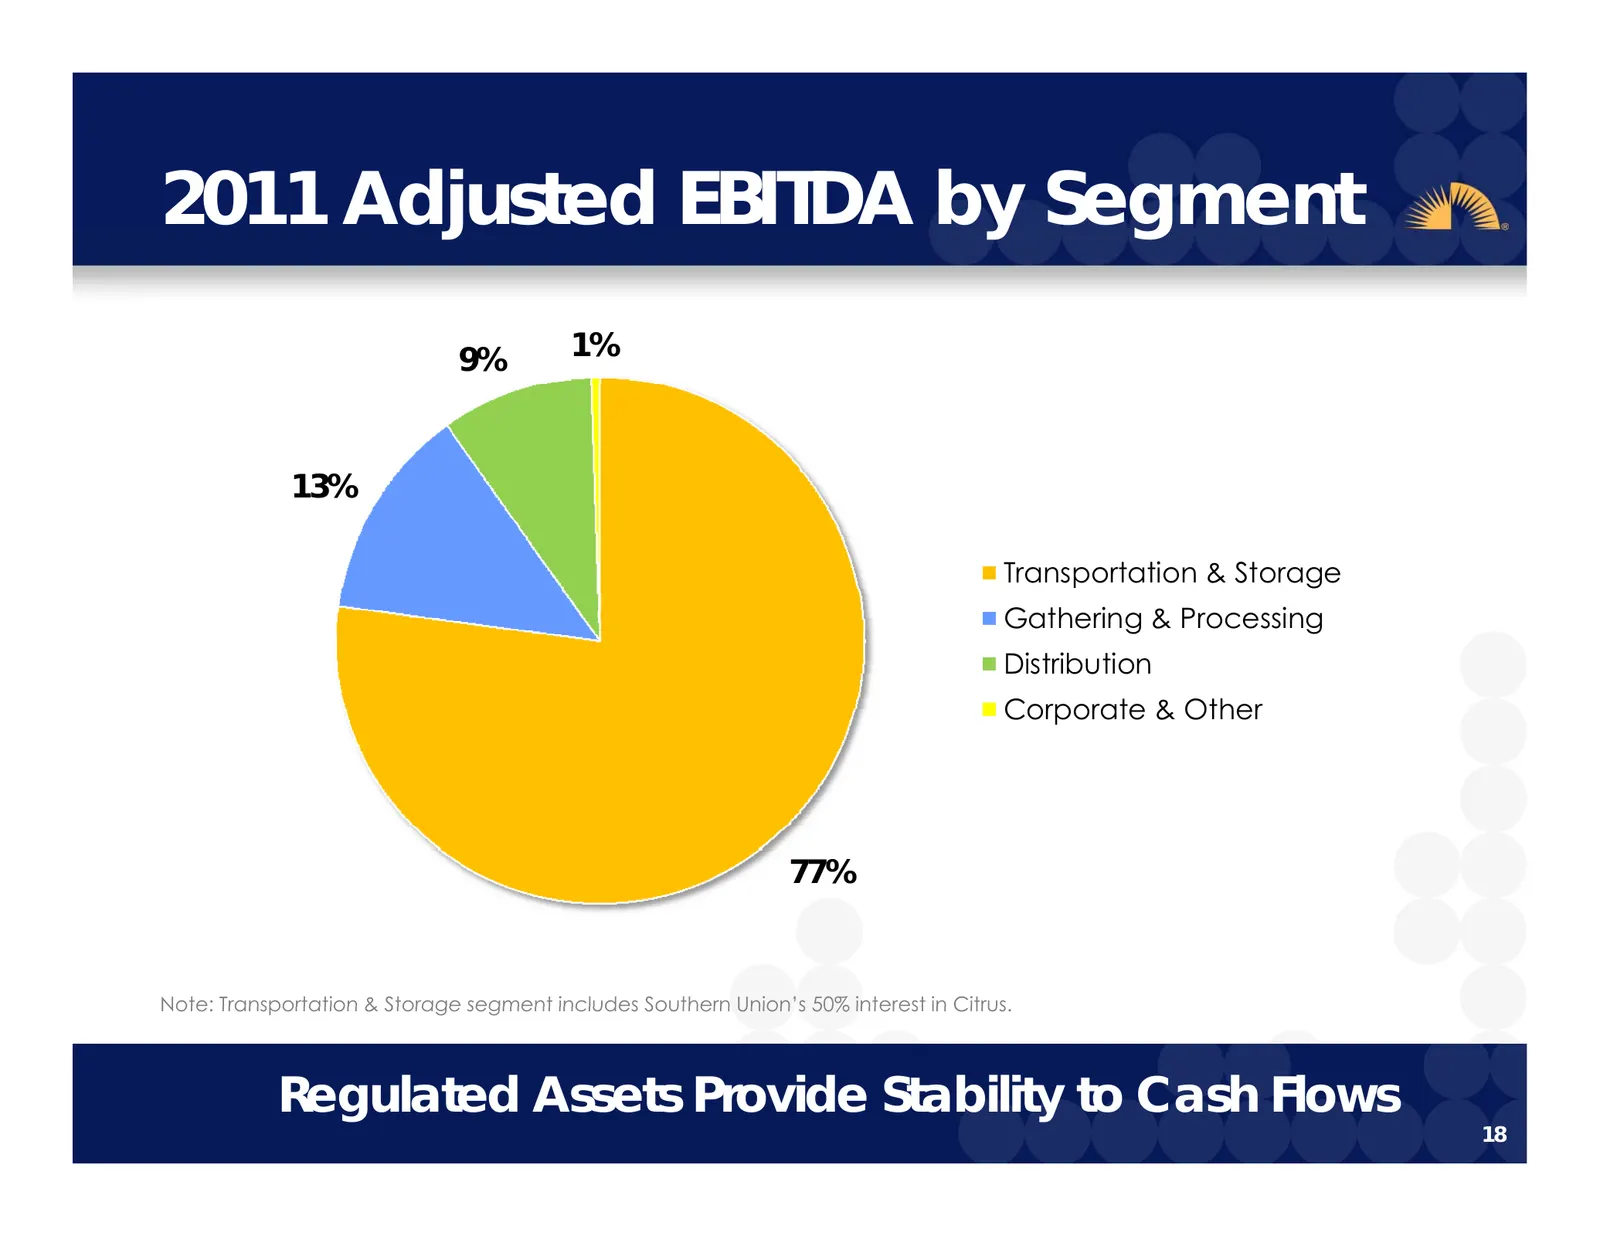
Slide 18: 2011 Adjusted EBITDA by Segment
2011 Adjusted j EBITDA by y Segment g 9% 1% 13% Transportation & Storage Gathering & Processing Distribution Corporate & Other 77% Note: Transportation & Storage segment includes Southern Union Union’ss 50% interest in Citrus. Citrus Regulated Assets Provide Stability to Cash Flows 18
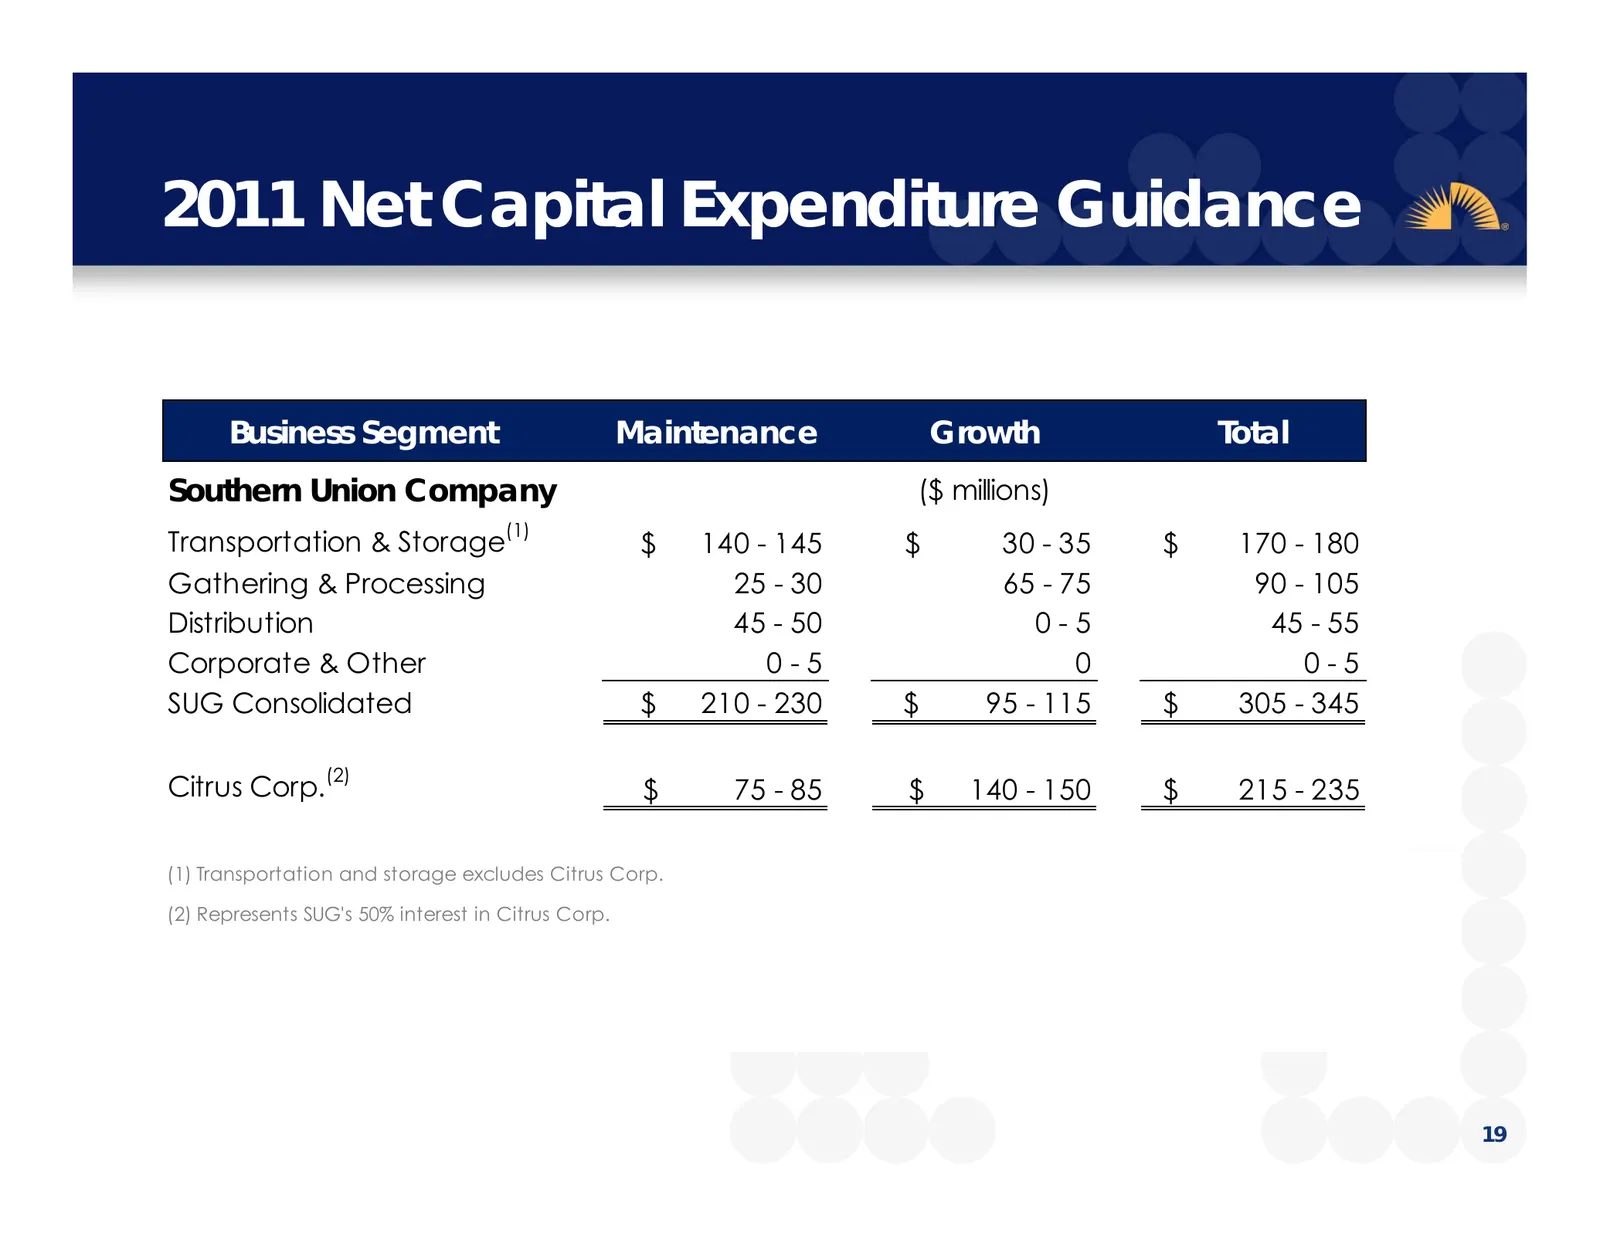
Slide 19: 2011 Net Capital Expenditure Guidance
2011 Net Capital p Expenditure p Guidance Business Segment Maintenance Growth Total Southern Union Company ($ millions) ((1)) Transportation & Storage $ 140 - 145 $ 30 - 35 $ 170 - 180 Gathering & Processing 25 - 30 65 - 75 90 - 105 Distribution 45 - 50 0-5 45 - 55 Corporate & Other 0-5 0 0-5 SUG Co
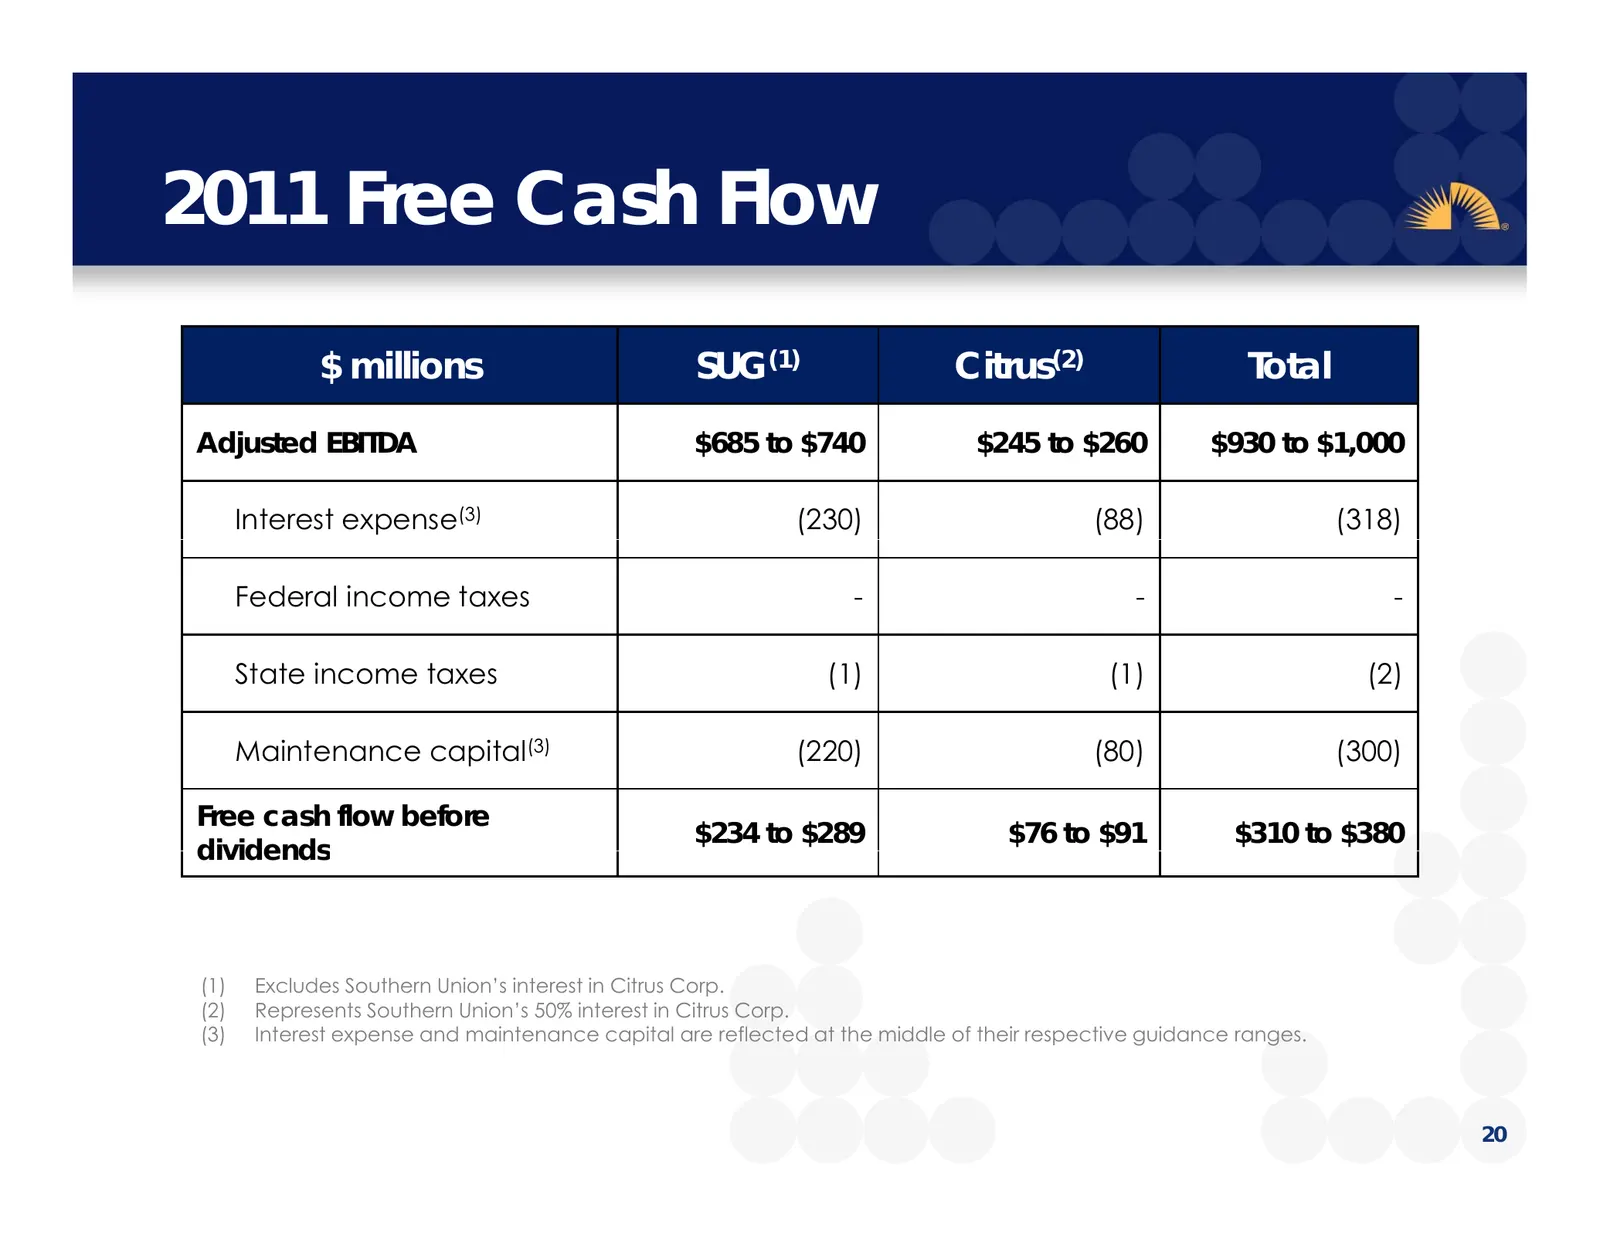
Slide 20: 2011 Free Cash Flow
2011 Free Cash Flow $ millions SUG(1) Citrus(2) Total Adjusted EBITDA $685 to $740 $245 to $260 $930 to $1,000 Interest expense(3) (230) (88) (318) Federal income taxes - - - State income taxes (1) (1) (2) Maintenance capital(3) (220) (80) (300) Free cash flow before $234 to $289 $76 to $91 $310 to
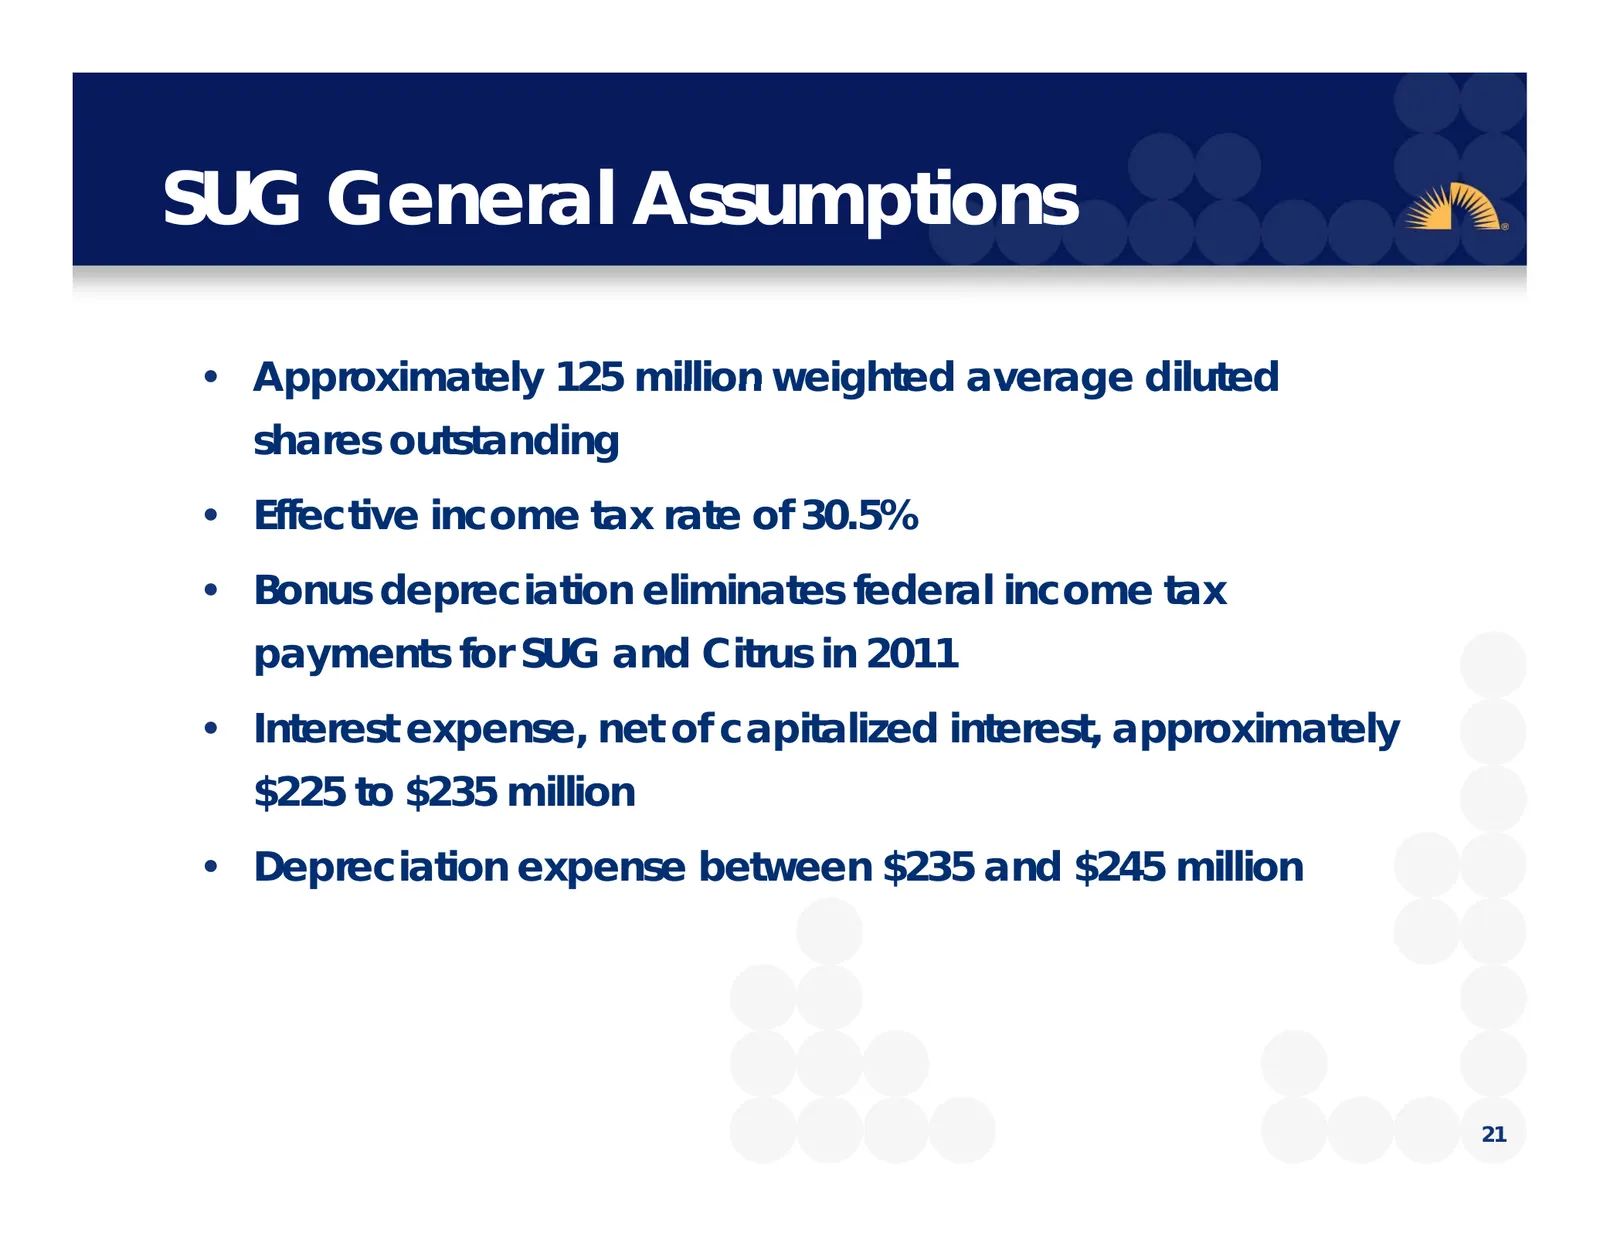
Slide 21: SUG General Assumptions
SUG General Assumptions p • Approximately 125 million weighted average diluted shares outstanding • Effective income tax rate of 30.5% • Bonus depreciation eliminates federal income tax payments for SUG and Citrus in 2011 • Interest expense, net of capitalized interest, approximately $225 to $235 mi
Slide 22: Gathering & Processing Assumptions
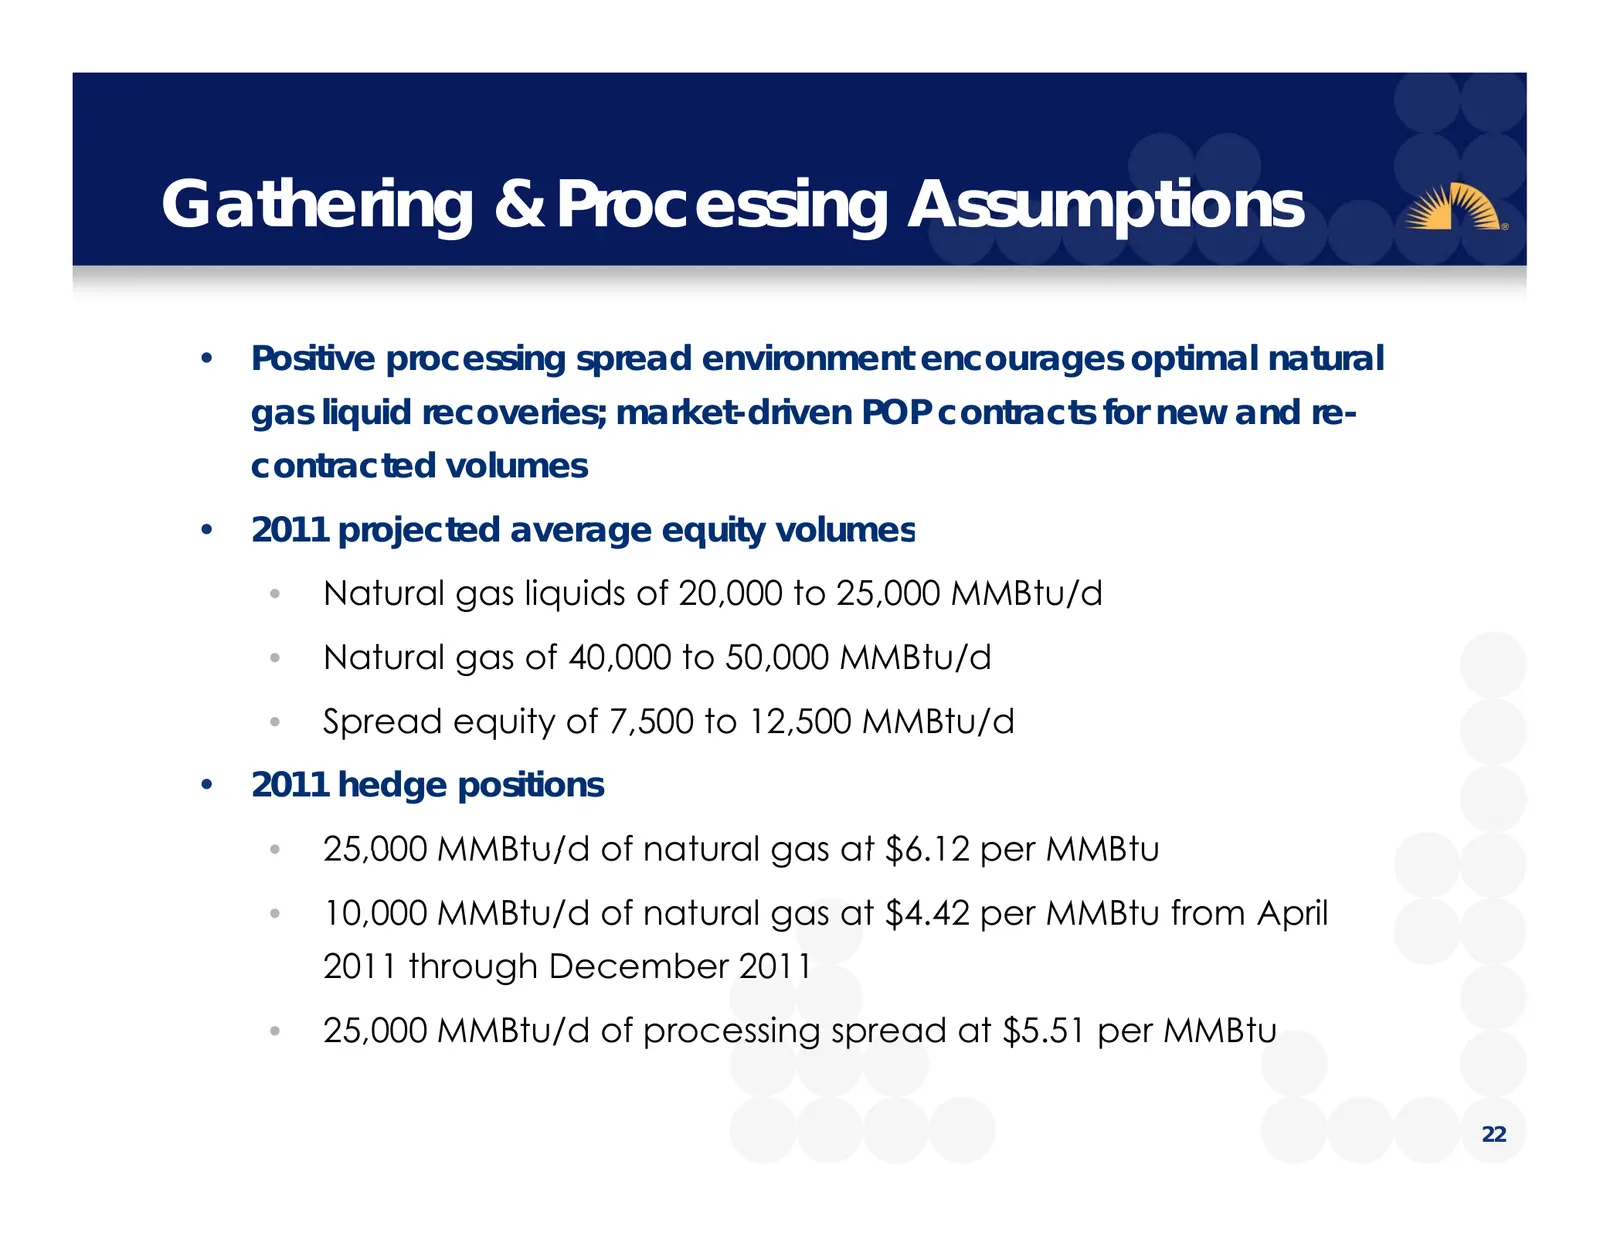
Gathering g & Processing g Assumptions p • Positive processing spread environment encourages optimal natural gas liquid recoveries; market-driven POP contracts for new and re- contracted volumes • 2011 projected average equity volumes • Natural gas liquids of 20,000 to 25,000 MMBtu/d • Natural gas o
Slide 23: 2010 SUGS Equity Volumes
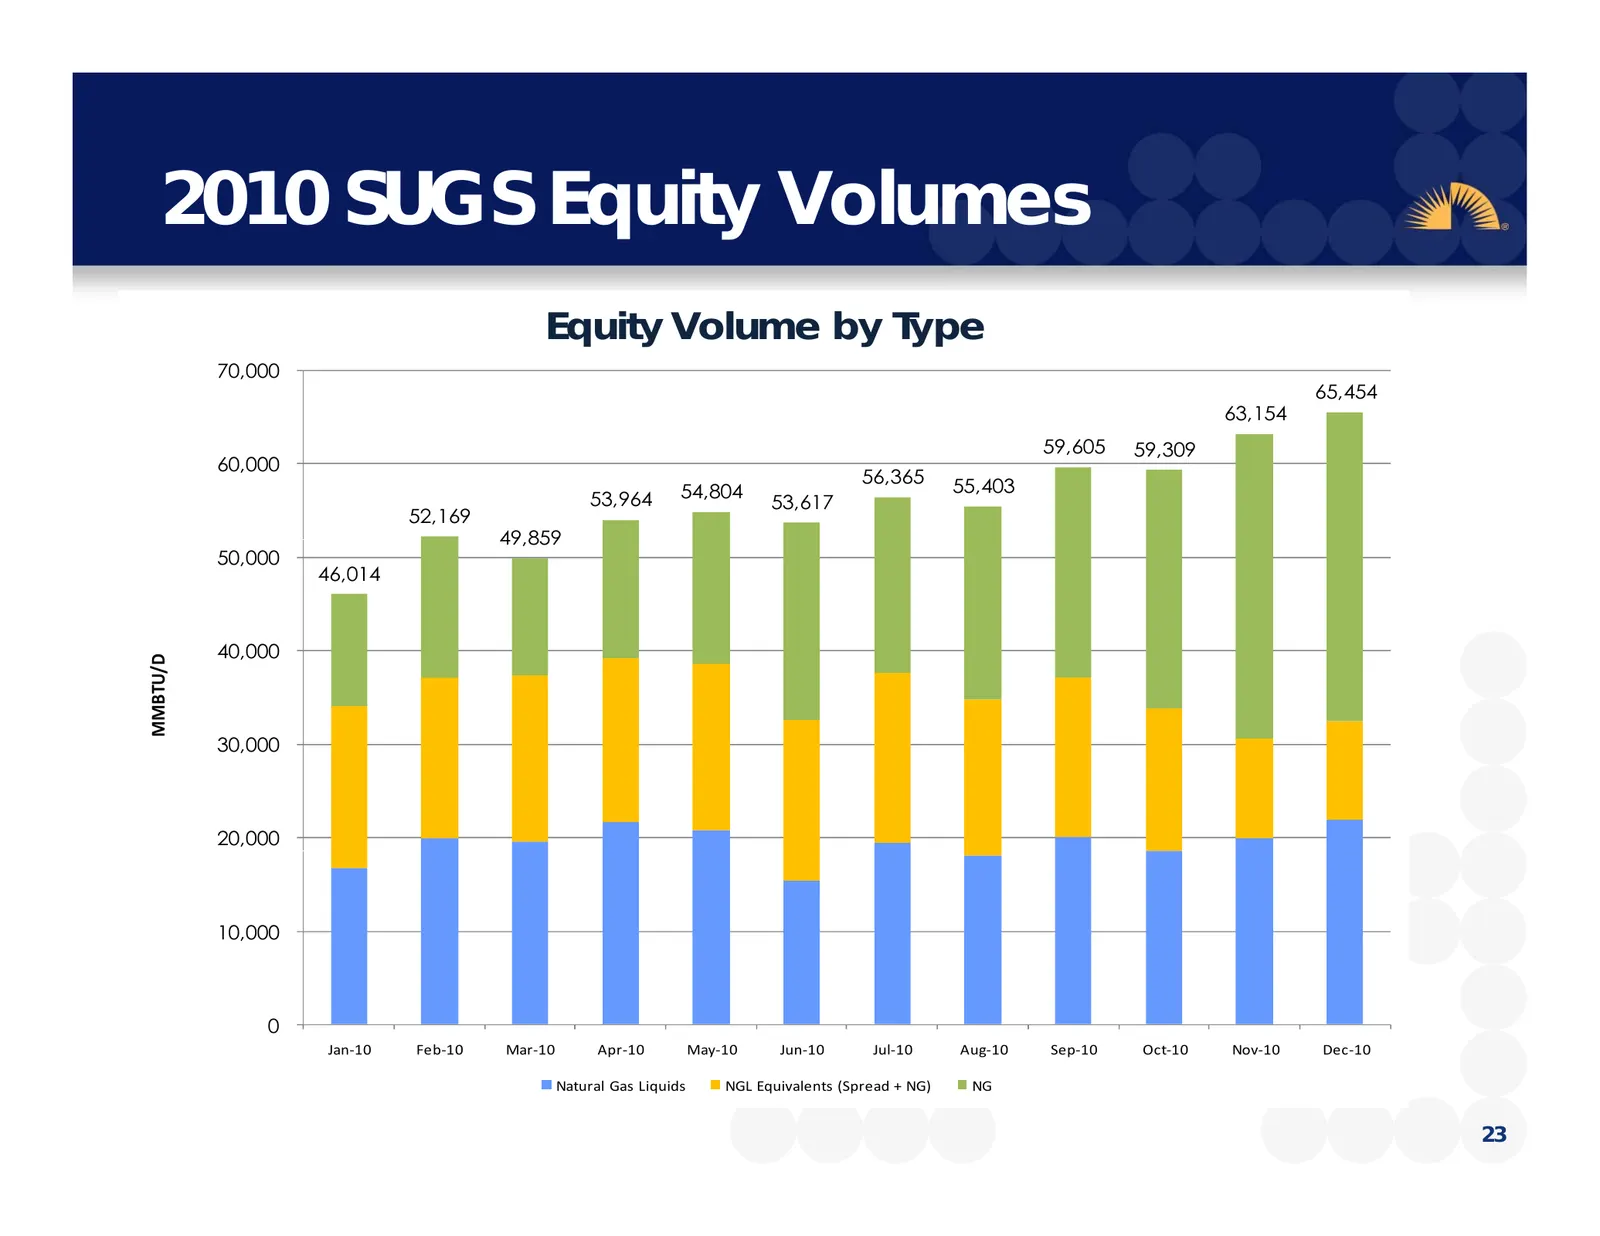
2010 SUGS Equity q y Volumes Equity Volume by Type 70,000 65,454 63,154 59,605 59,309 60,000 56,365 55,403 53,964 54,804 53,617 52,169 49 859 49,859 50,000 46,014 40,000 BTU/D MMB 30,000 20,000 10,000 0 Jan-10 Feb-10 Mar-10 Apr-10 May-10 Jun-10 Jul-10 Aug-10 Sep-10 Oct-10 Nov-10 Dec-10 Natural Gas L
Slide 24: Contract Mix – Wellhead Volumes
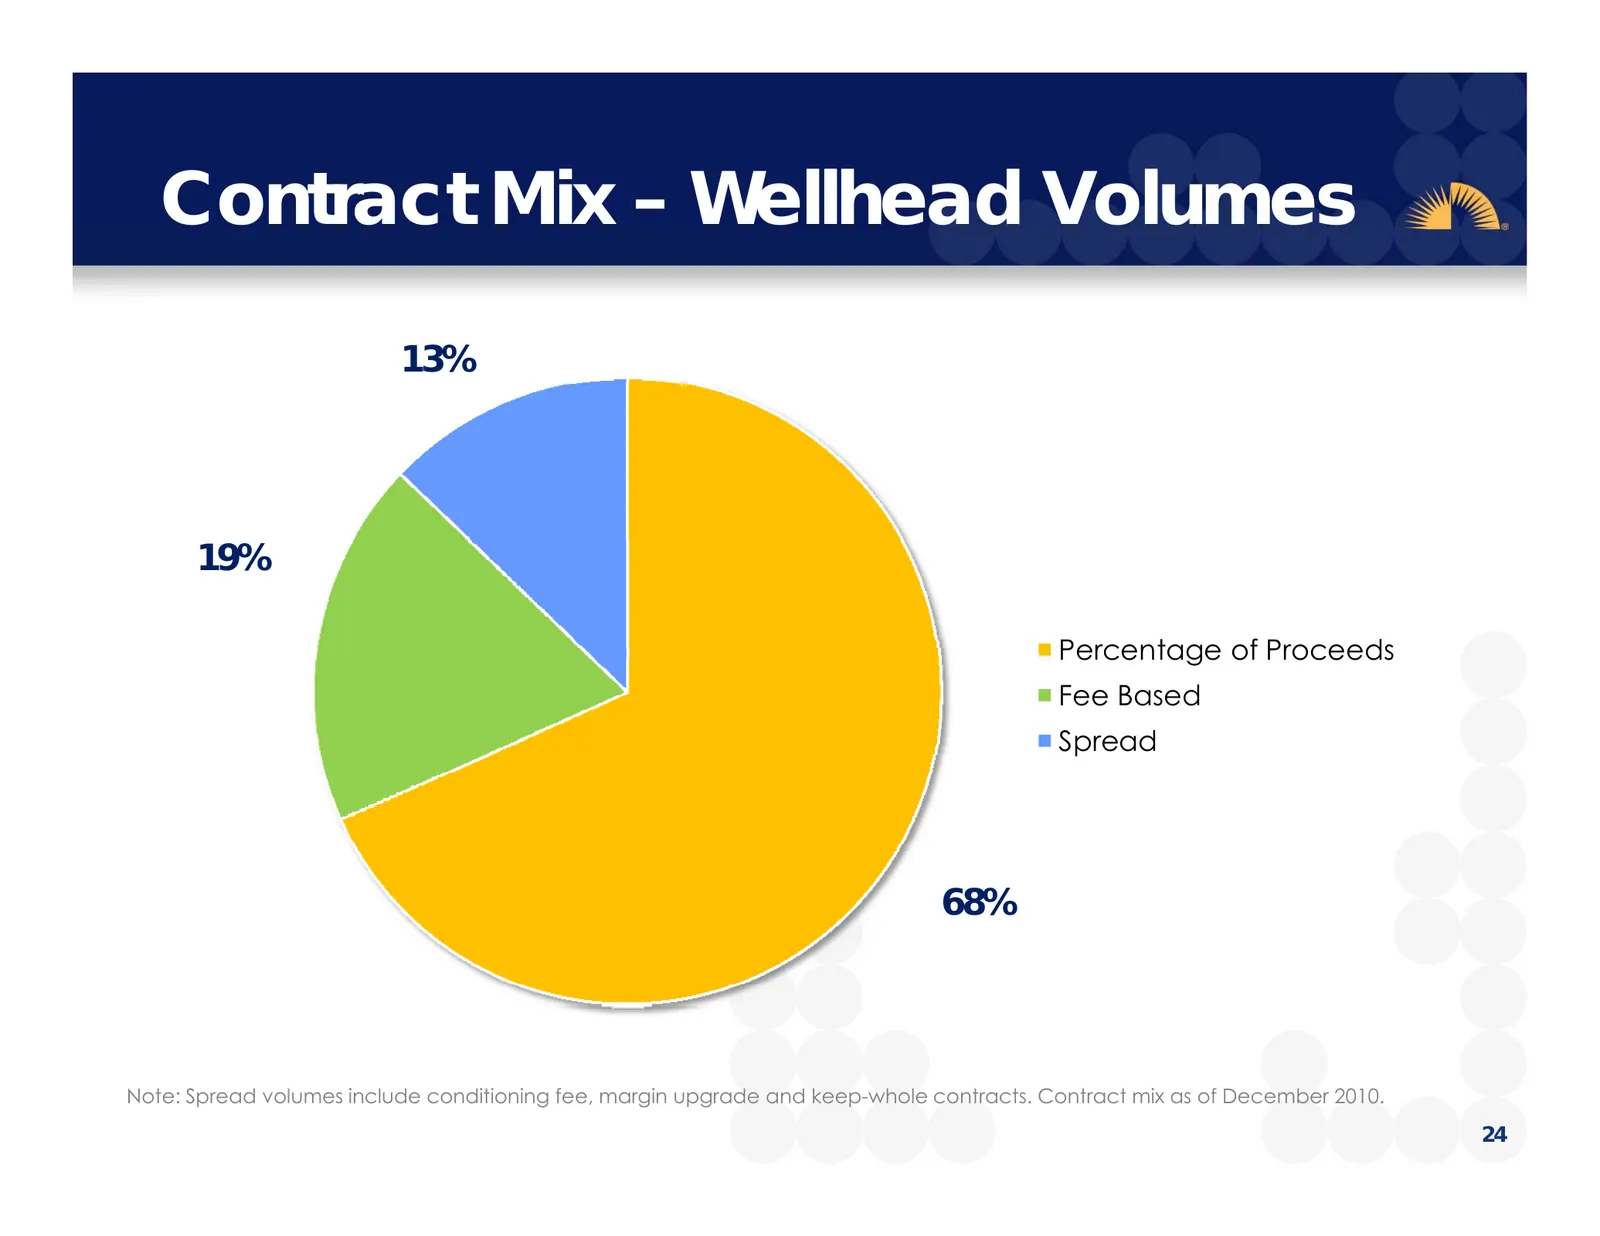
Contract Mix – Wellhead Volumes 13% 19% Percentage of Proceeds Fee Based Spread 68% Note: Spread volumes include conditioning fee, margin upgrade and keep-whole contracts. Contract mix as of December 2010. 24
Slide 25: 2011 Growth Projects
2011 Growth Projects Southern Union Company
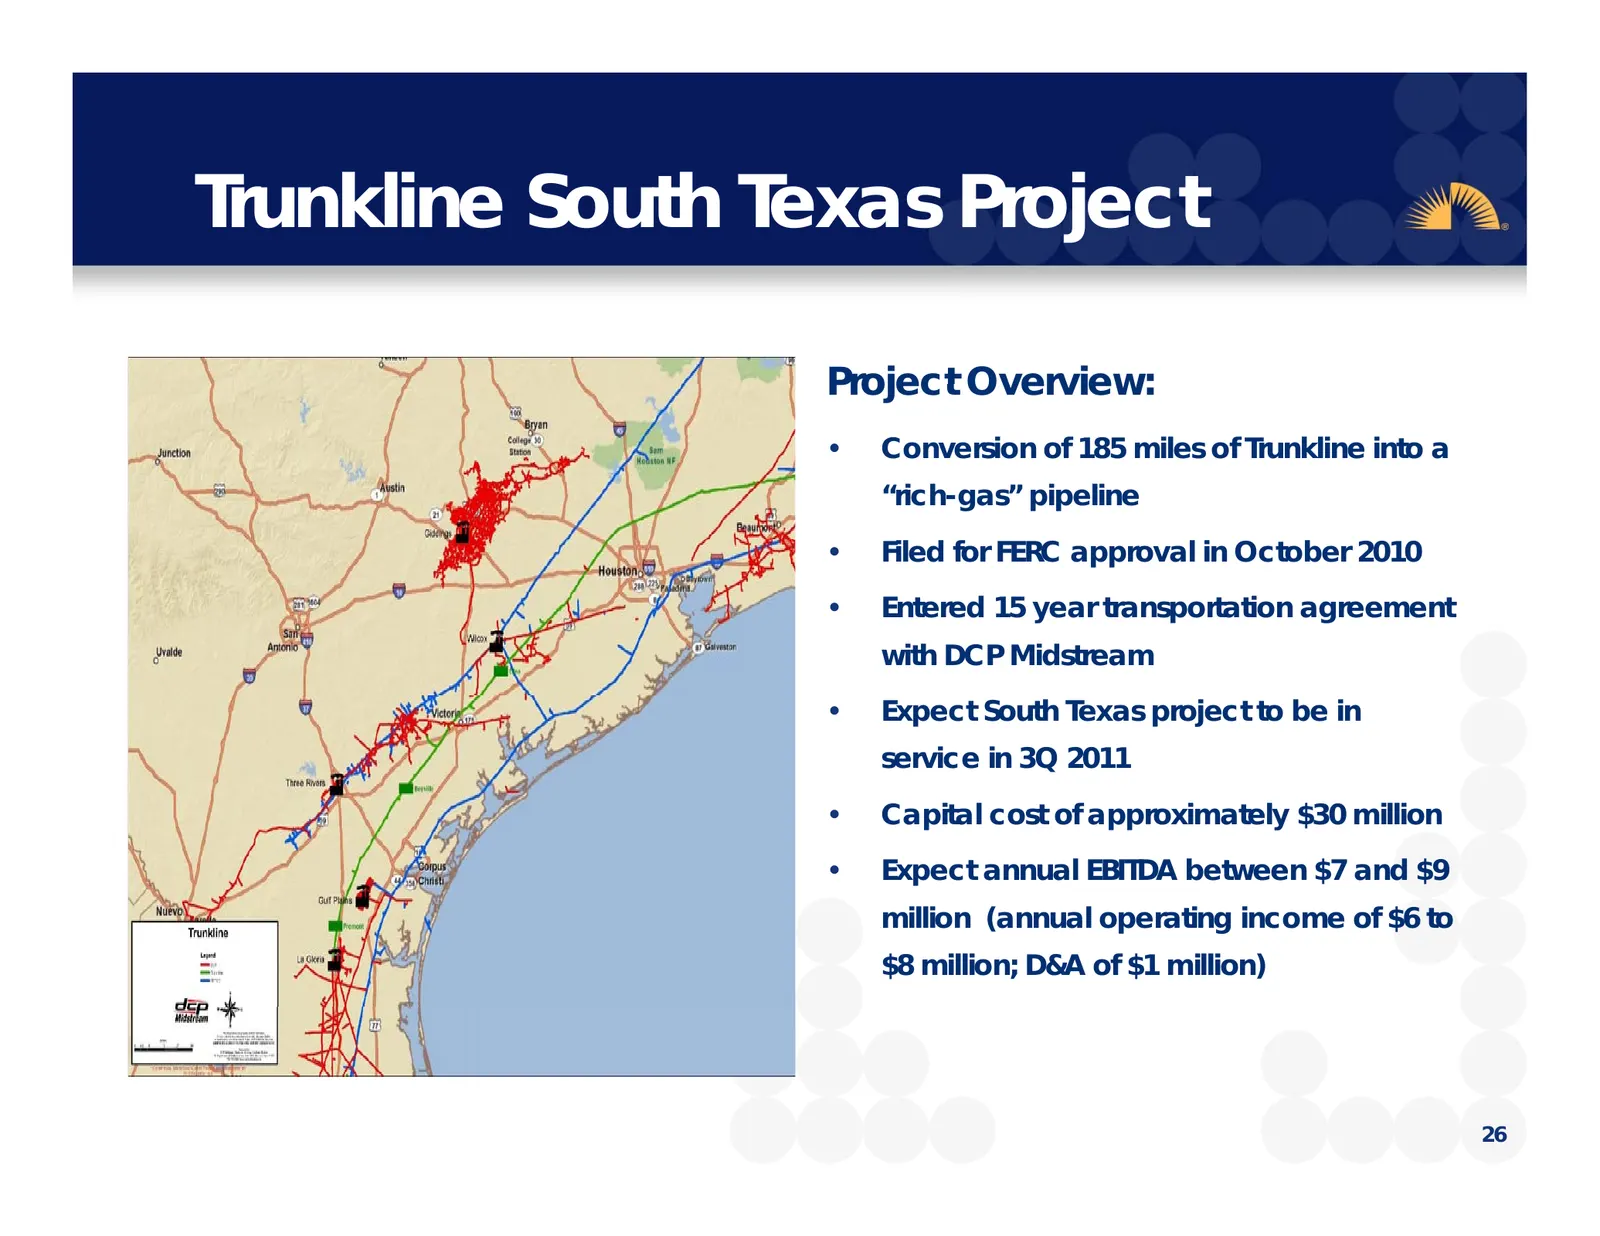
Slide 26: Trunkline South Texas Project
Trunkline u e Sou South Texas e as Project ojec Project Overview: • Precedent agreement signed to convert approximately 185 miles of • Conversion of 185 miles of Trunkline into a Trunkline into a “rich-gas” pipeline “rich-gas” pipeline • Filed for FERC approval in November • Filed for FERC approval
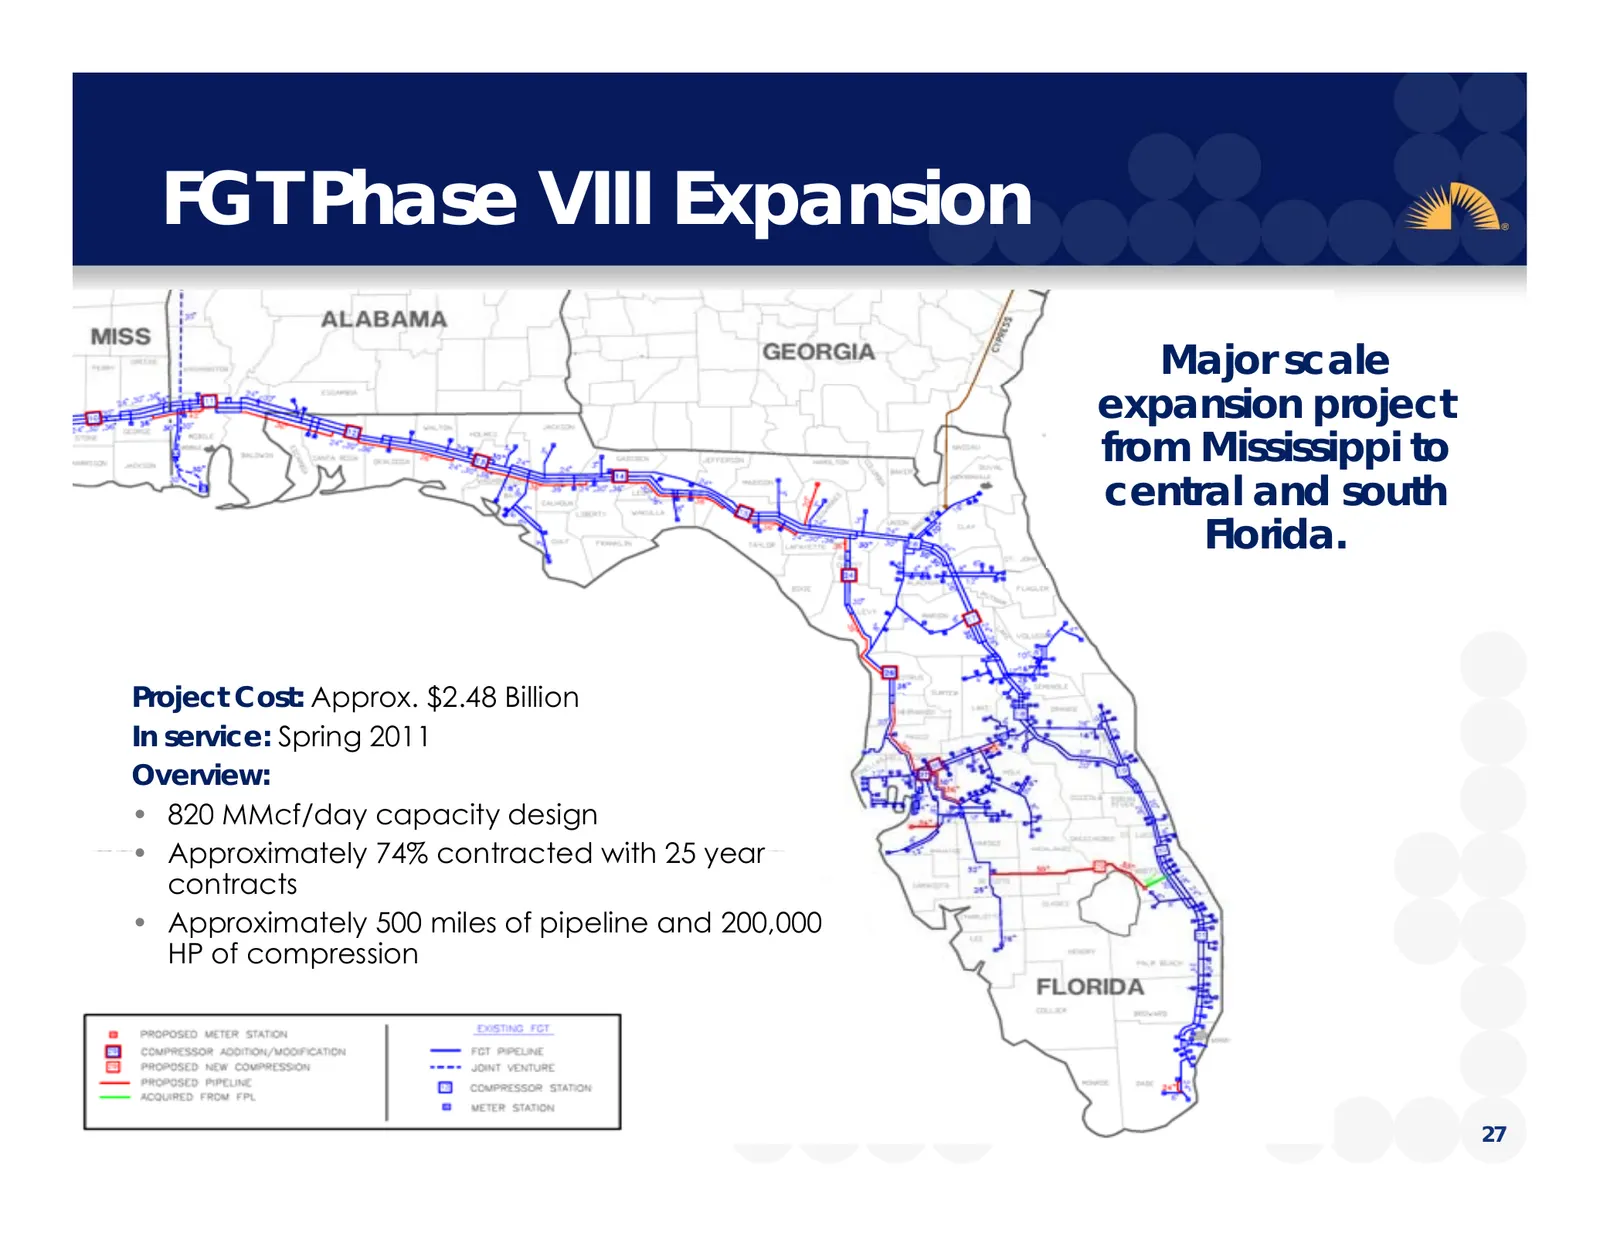
Slide 27: FGT Phase VIII Expansion
FGT Phase VIII Expansion p Major scale expansion project from Mississippi to central and south Florida. Florida Project Cost: Approx. Approx $2$2.48 48 Billion In service: Spring 2011 Overview: • 820 MMcf/day capacity design • Approximately 74% contracted with 25 year contracts • Approximately 500 m
Slide 28: FGT Phase VIII Expansion Timeline
FGT Phase VIII Expansion p Timeline • Construction commenced 1Q 2010 • Target In-Service Date – spring 2011 • Expect operating income of $240 to $260 million, depreciation of $50 million and EBITDA of approximately $290 to $310 million when fully subscribed • FPL Capital provided Citrus with a 20 ye
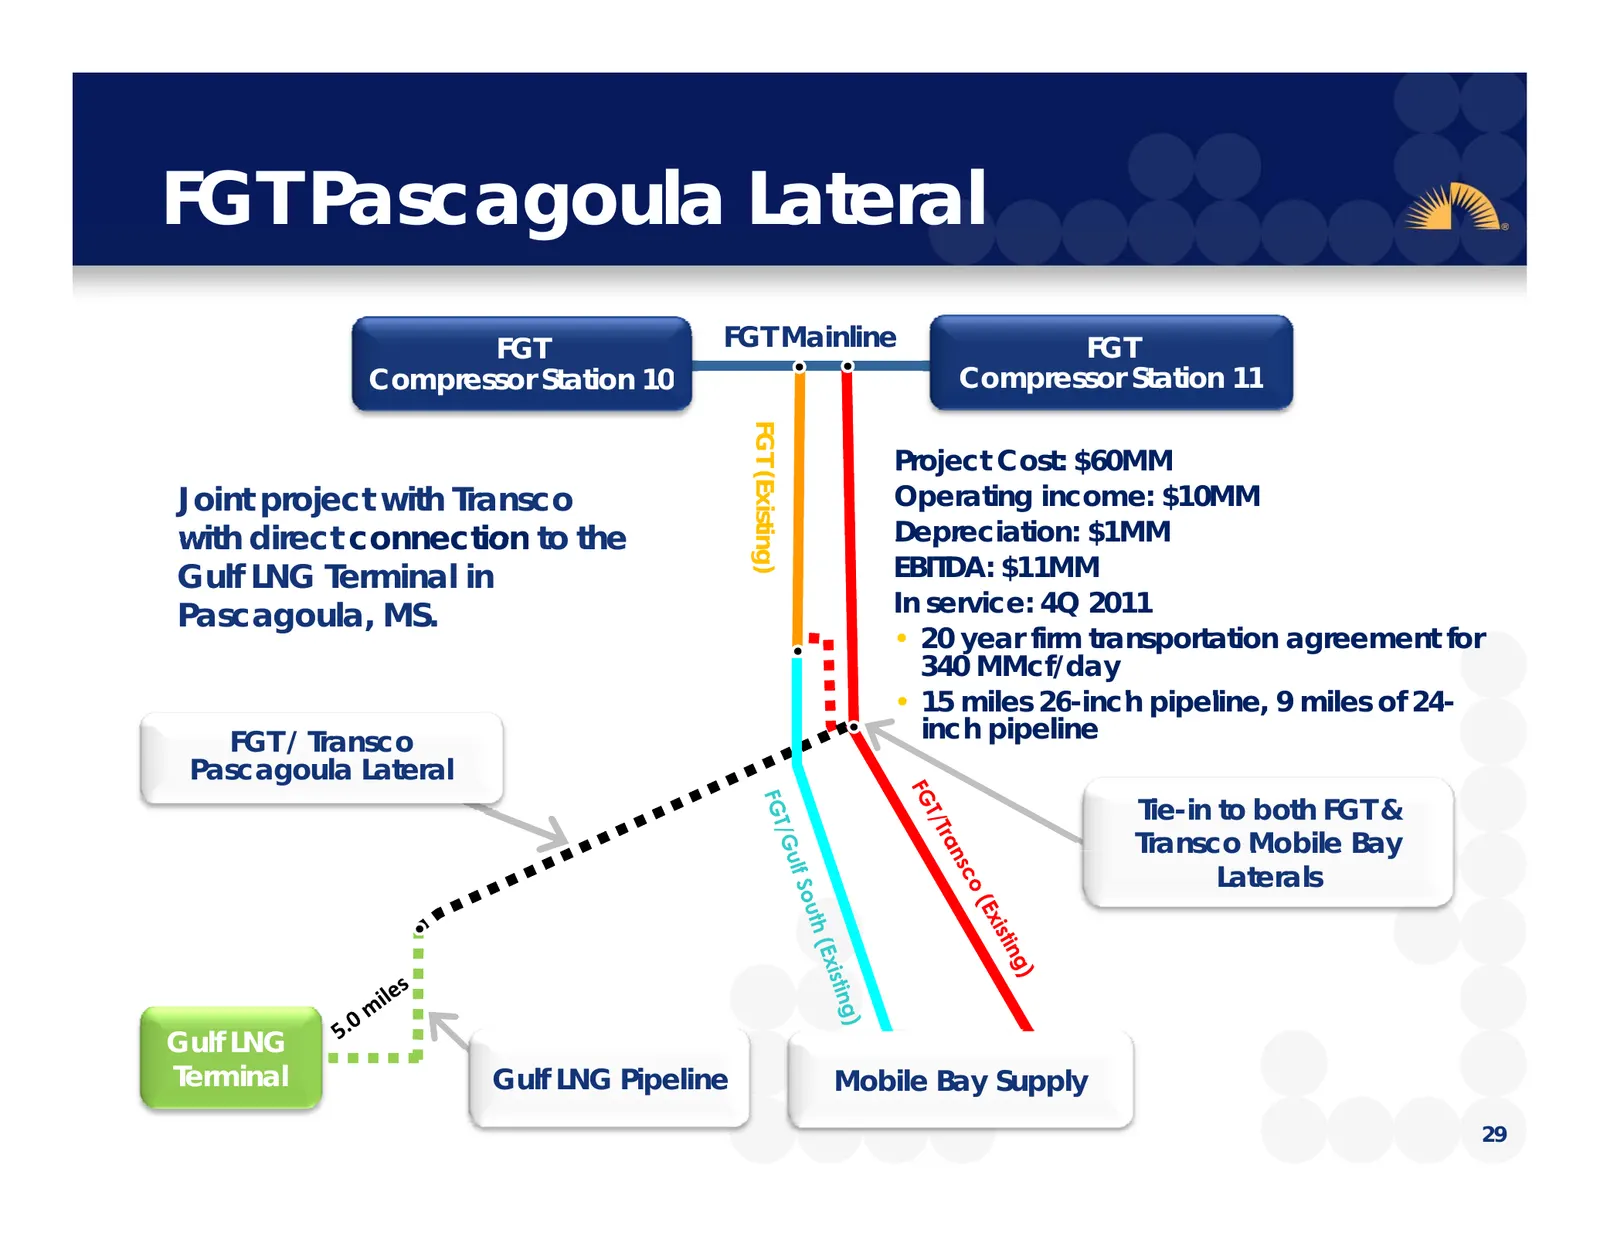
Slide 29: FGT Pascagoula Lateral
FGT Pascagoula g Lateral FGT FGT Mainline FGT Compressor Station 10 Compressor Station 11 FGT (Existin Project Cost: $60MM Joint project with Transco Operating income: $10MM with direct connection to the Depreciation: $1MM ng) Gulf LNG Terminal in EBITDA: $11MM Pascagoula, MS. In service: 4Q 2011 •
Slide 30: Midstream Growth Opportunities
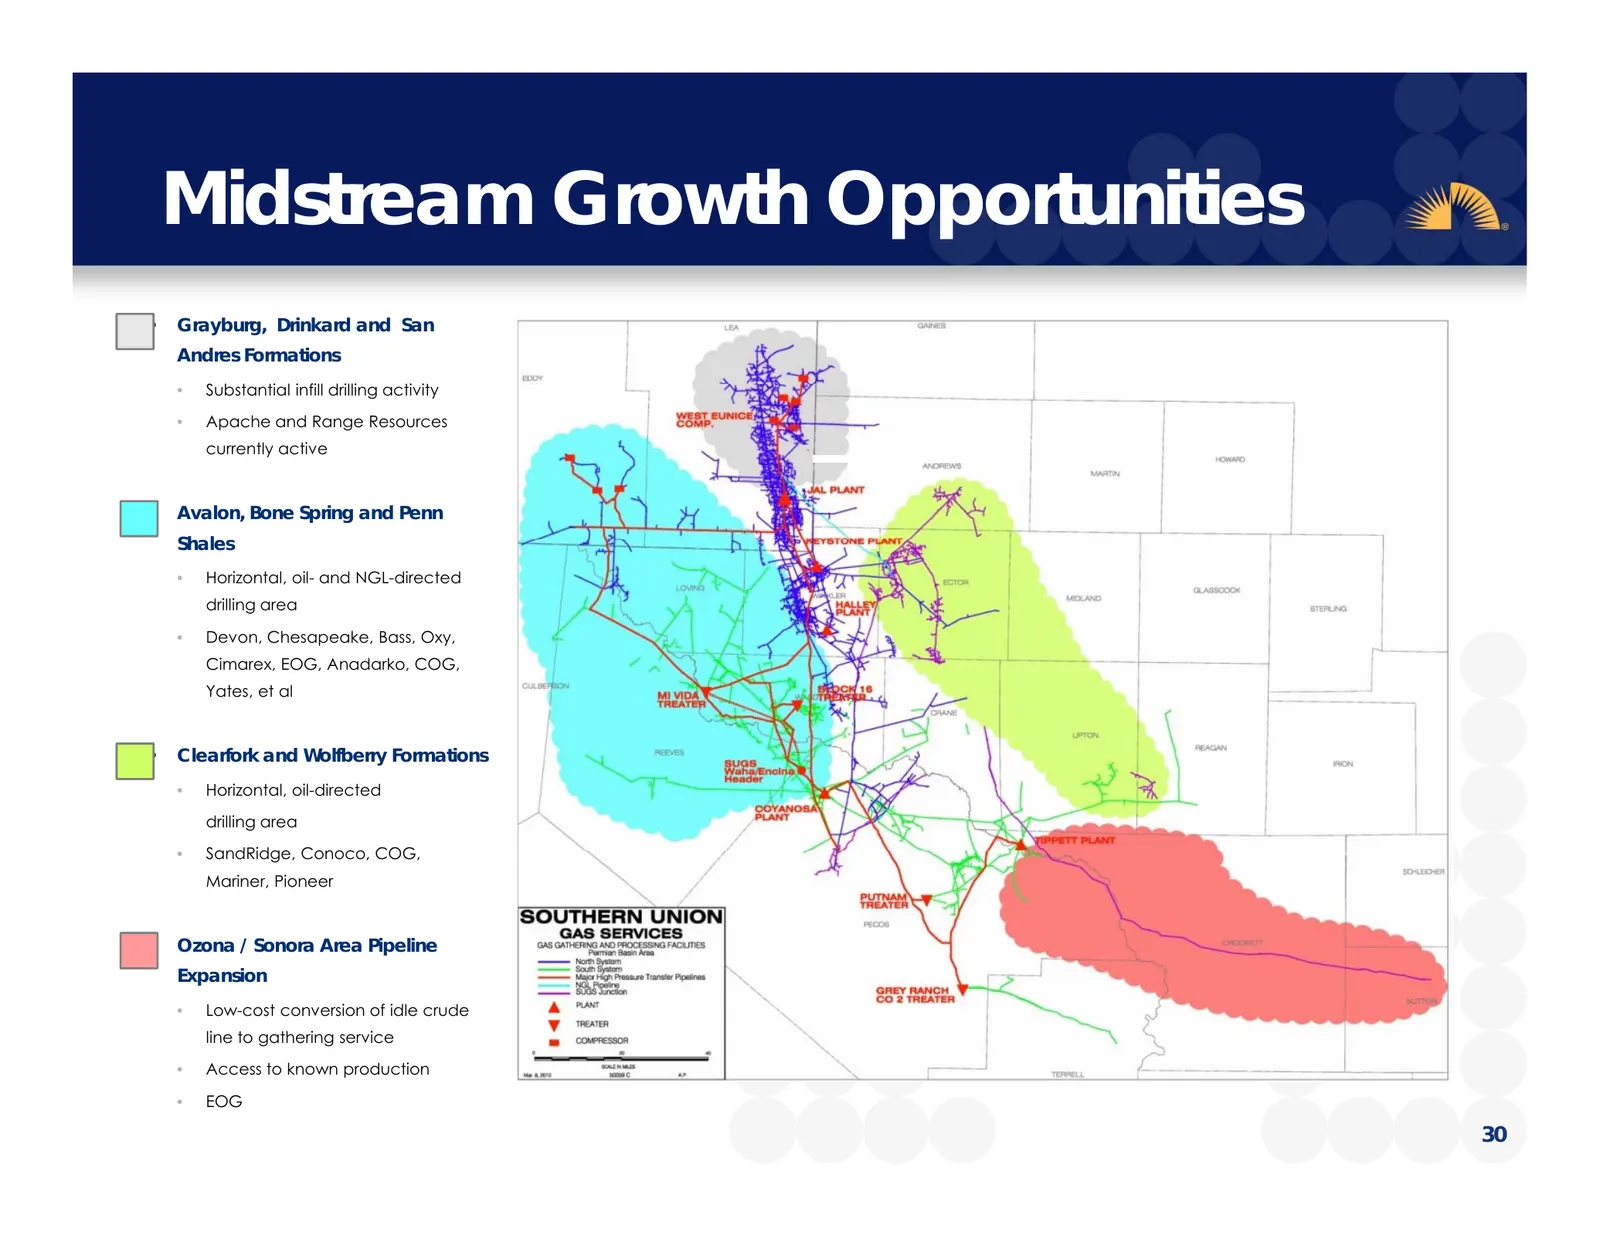
Midstream Growth Opportunities pp • Grayburg, Drinkard and San Andres Formations • S b t ti l iinfill Substantial fill d drilling illi activity ti it • Apache and Range Resources currently active • Avalon, Bone Spring and Penn Sh l Shales • Horizontal, oil- and NGL-directed drilling area • Devon, Ch
Slide 31: Appendix
Southern Union Company
Slide 32: Definitions
Definitions • EBITDA – earnings before interest taxes, depreciation and amortization. • Adjusted EBITDA – EBITDA adjusted for Southern Union’s Union s 50% interest in the EBITDA of Citrus Corp., the mark to market impact p of economic hedges g on p processing g spreads, p , non-cash equity allowance
Slide 33: Reg. G Reconciliation
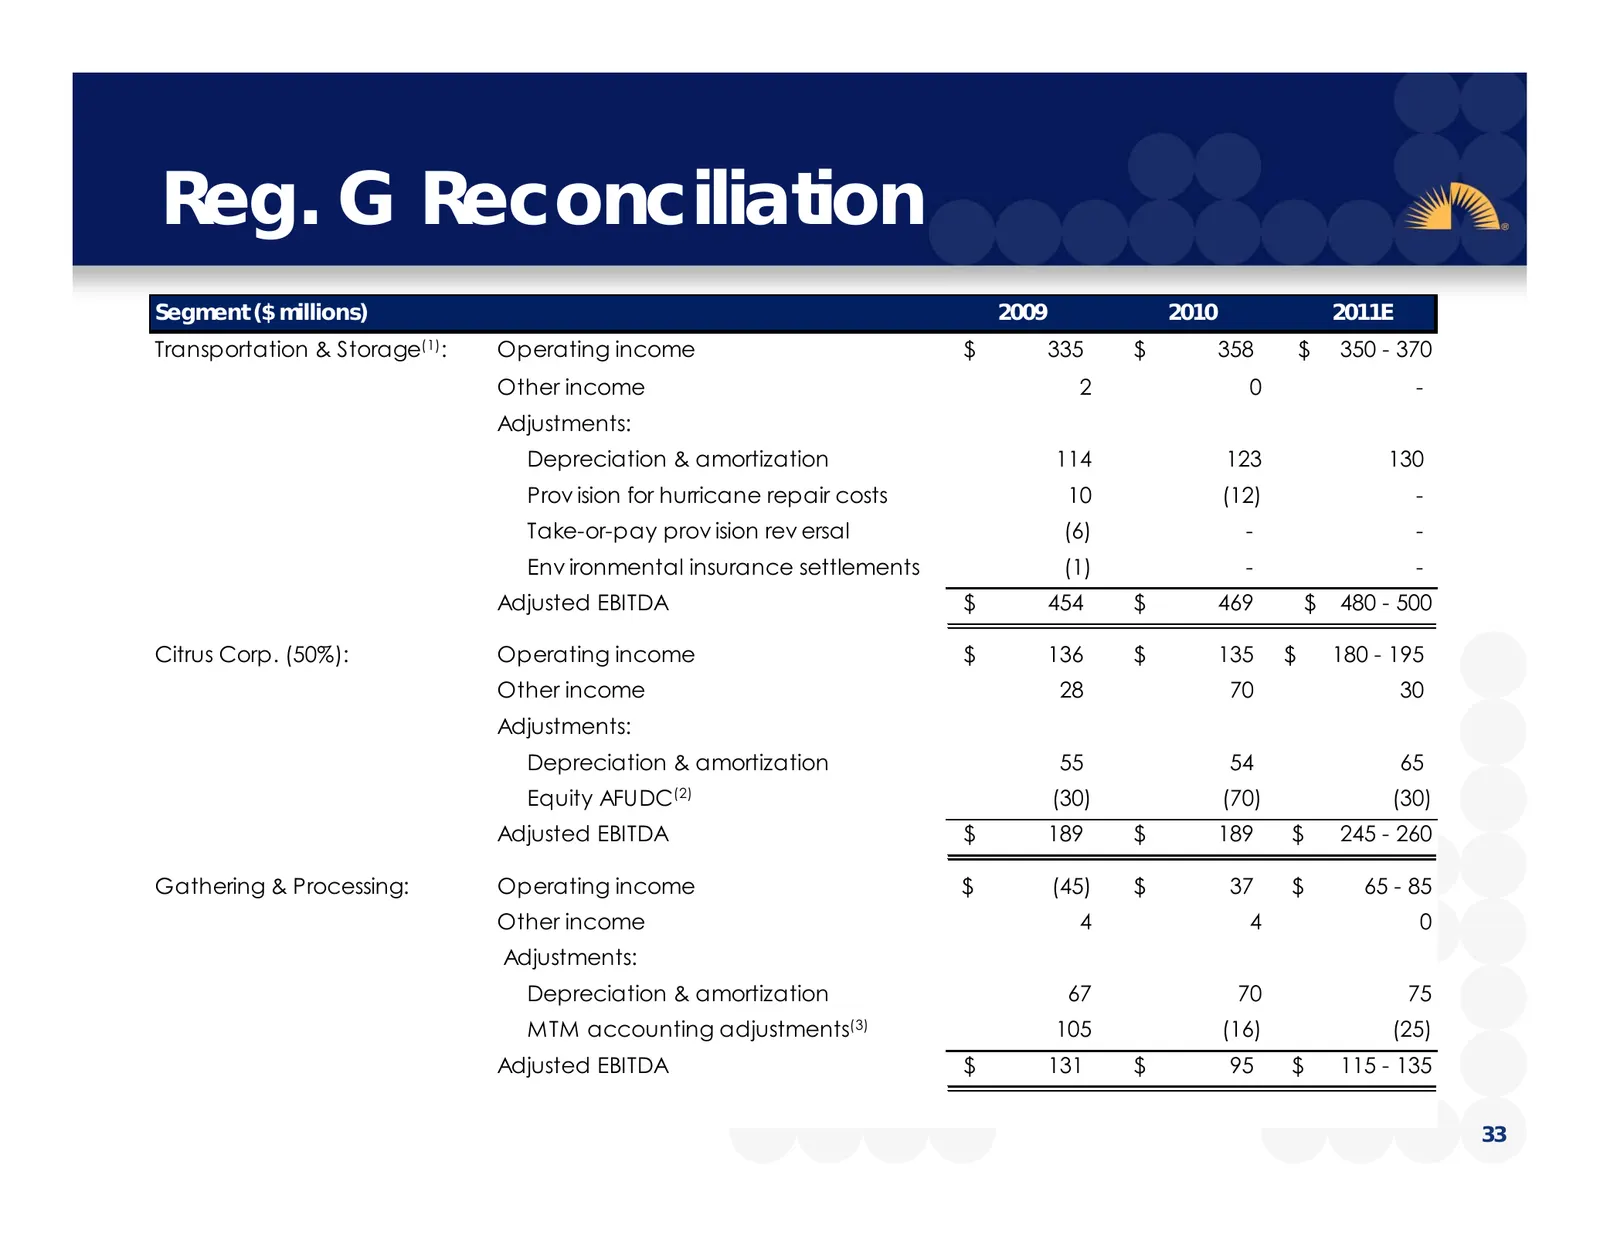
Reg. g G Reconciliation Segment ($ millions) 2009 2010 2011E Transportation & Storage(1) : Operating income $ 335 $ 358 $ 350 - 370 Other income 2 0 - Adjustments: Depreciation & amortization 114 123 130 Prov ision for hurricane repair costs 10 (12) - Take-or-pay p ypprov ision rev ersal ((6)) - - E
Slide 34: Reg. G Reconciliation – continued
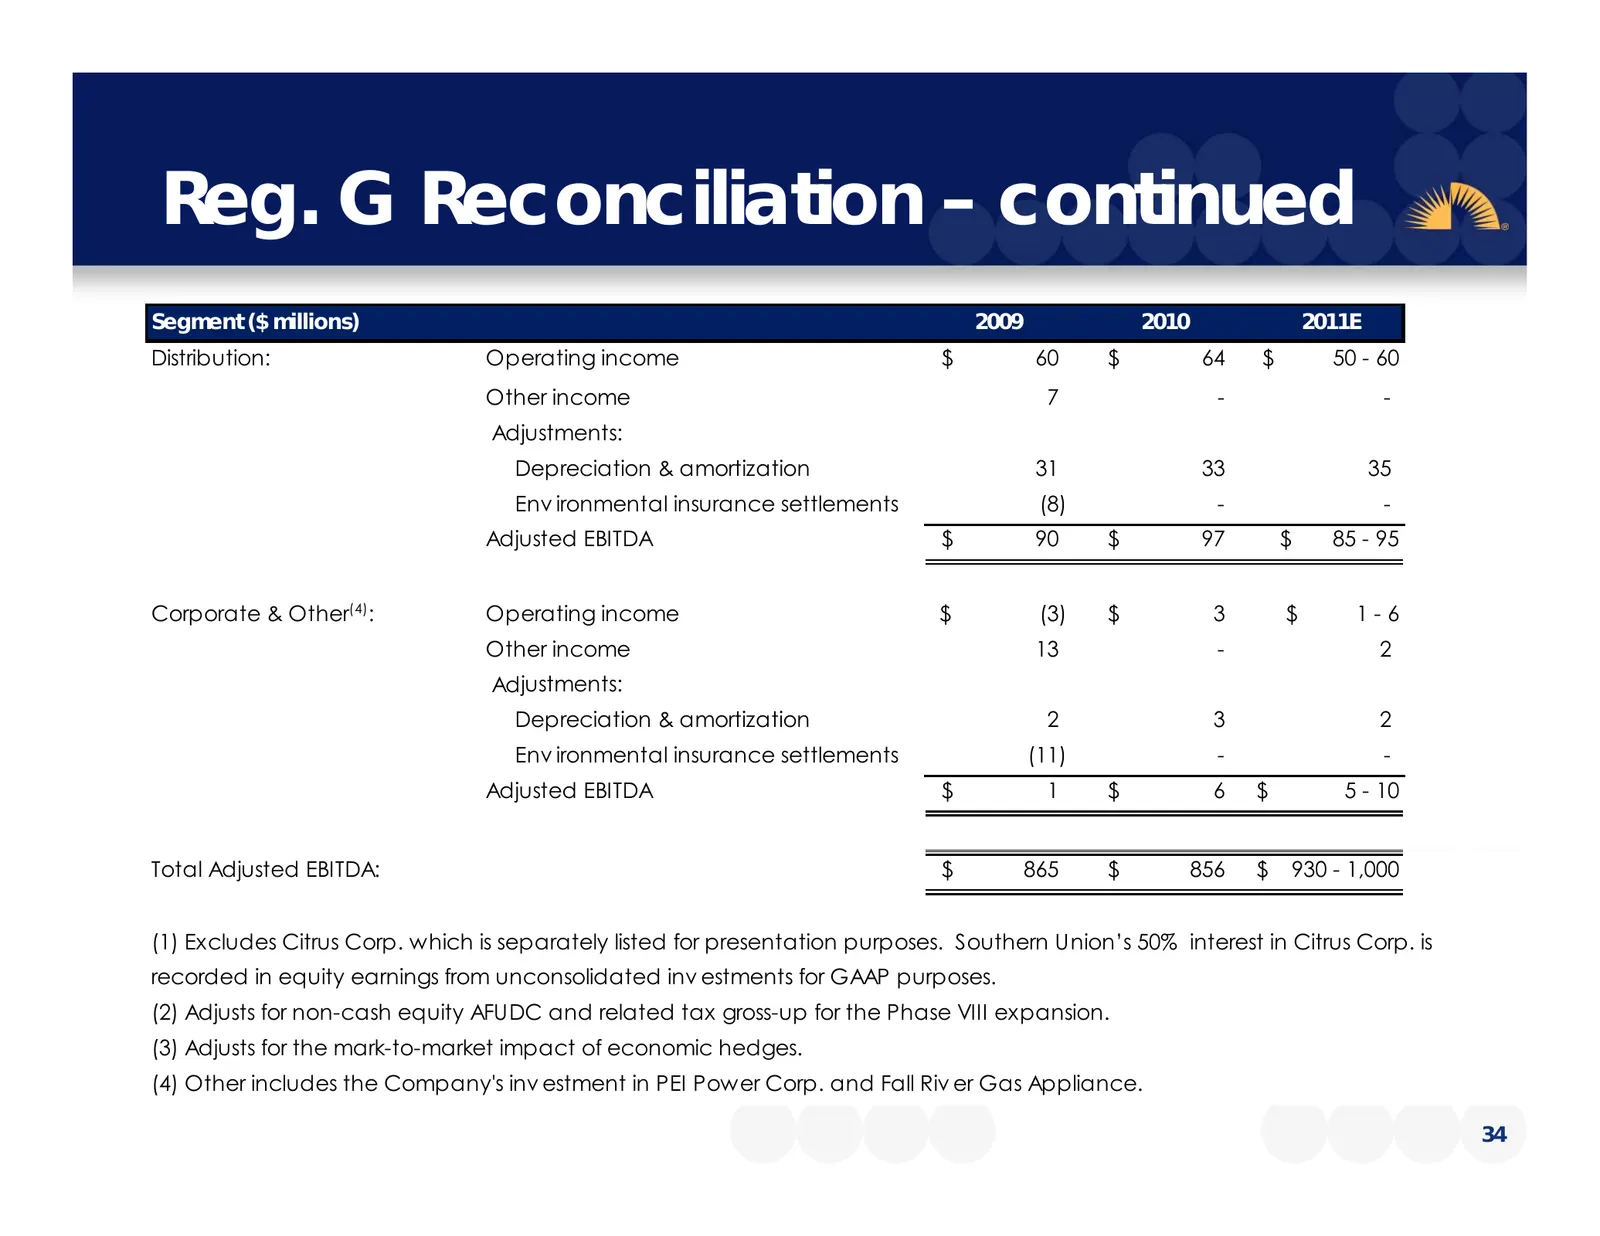
Reg. g G Reconciliation – continued Segment ($ millions) 2009 2010 2011E Distribution: Operating income $ 60 $ 64 $ 50 - 60 Other income 7 - - Adjustments: Depreciation & amortization 31 33 35 Env ironmental insurance settlements (8) - - Adjusted EBITDA $ 90 $ 97 $ 85 - 95 Corporate & Other(4) : Ope
Slide 35: Forward Looking Information
Forward Looking g Information This presentation contains “forward-looking statements” within the meaning of Section 27A of the Securities Act of 1933, as amended, and Section 21E off the Securities Exchange g Act off 1934, as amended. Forward-looking g statements are based on management’s beliefs an
Slide 36: Forward Looking Information
Forward Looking g Information unanticipated environmental liabilities; the uncertainty of estimates, including accruals and costs of environmental remediation; the impact of potential impairment charges; exposure to highly competitive commodity businesses and the effectiveness ff off the h Company's
Slide 37: Forward Looking Information
Forward Looking g Information the availability/cost of insurance coverage and the ability to collect under existing insurance policies; the risk that material weaknesses or significant deficiencies in internal controls over financial reporting could emerge or that minor problems could become signifi
Source: SEC EDGAR · 8-K filed Feb 25, 2011
More decks from Southern Union Co
 Barclays Capital Investment Grade Energy and Pipeline Conference 201232 slides · Mar 8, 2012
 Debt Investor Presentation (February 2012)33 slides · Feb 22, 2012
 Merger or Acquisition (July 2011)11 slides · Jul 5, 2011
 Merger or Acquisition (June 2011)22 slides · Jun 16, 2011
 BMO Capital Markets 2010 Utilities and Pipelines Day23 slides · Nov 30, 2010
 Non-Deal Roadshow (August 2010)22 slides · Aug 18, 2010