PSS World Medical — Investor Day (April 2004)
116 slides from PSS World Medical's investor day presentation, Apr 28, 2004

Slide 1: Improving health care in America through Innovative Solutions
Improving health care in America through Innovative Solutions Nasdaq:PSSI

Slide 2: David A. Smith, President and CEO
David A. Smith President and CEO
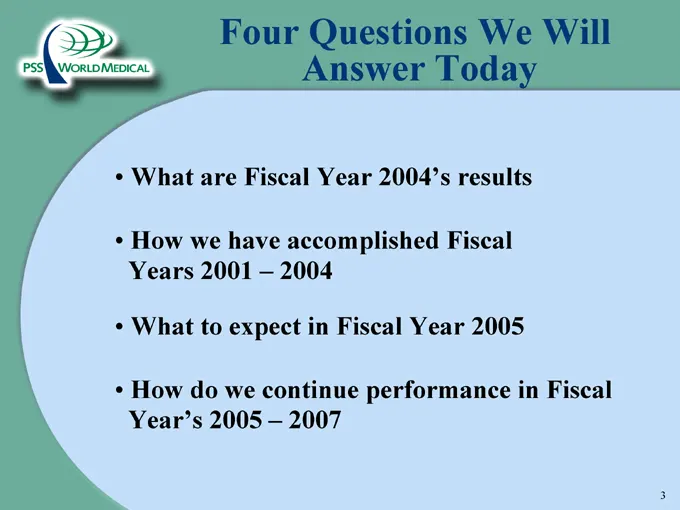
Slide 3: Four Questions We Will Answer Today
Four Questions We Will Answer Today • What are Fiscal Year 2004’s results • How we have accomplished Fiscal Years 2001 – 2004 • What to expect in Fiscal Year 2005 • How do we continue performance in Fiscal Year’s 2005 – 2007
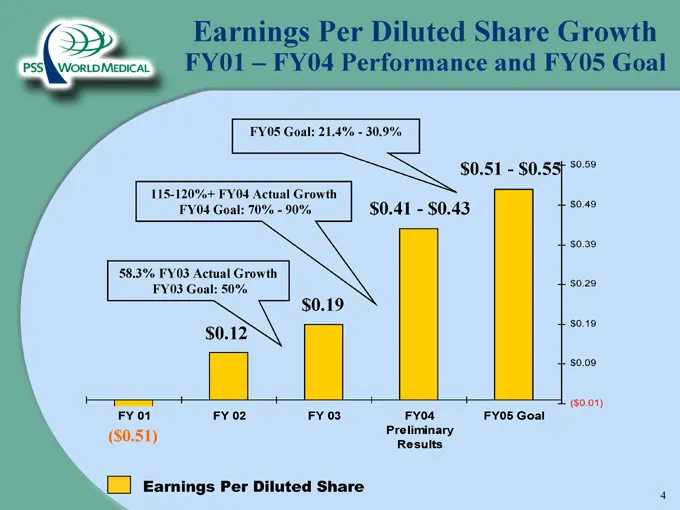
Slide 4: Earnings Per Diluted Share Growth
Earnings Per Diluted Share Growth FY01 – FY04 Performance and FY05 Goal FY05 Goal: 21.4%—30.9% $0.51—$0.55 115-120%+ FY04 Actual Growth FY04 Goal: 70%—90% $0.41—$0.43 58.3% FY03 Actual Growth FY03 Goal: 50% $0.19 $0.12 ($ 0.51) Earnings Per Diluted Share
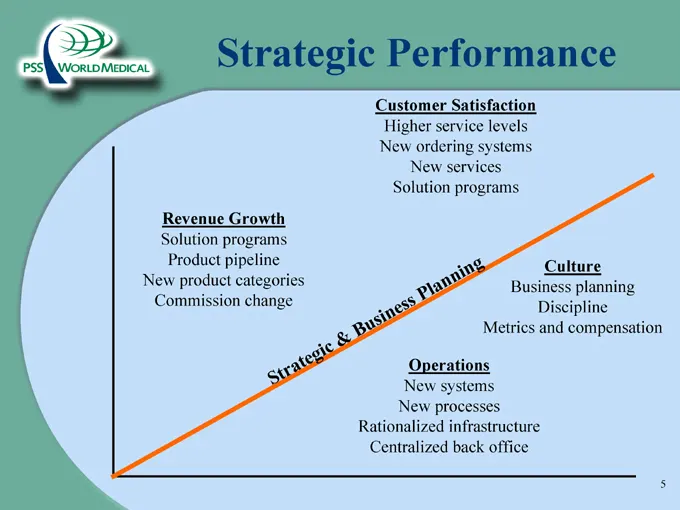
Slide 5: Strategic Performance
Strategic Performance Customer Satisfaction Higher service levels New ordering systems New services Solution programs Revenue Growth Solution programs Product pipeline New product categories Commission change Culture Business planning Discipline Metrics and compensation Operations New systems New pr
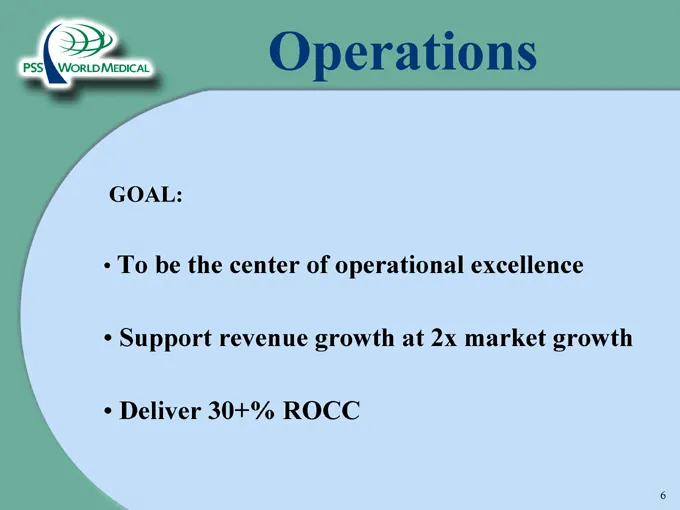
Slide 6: Goal
GOAL: • To be the center of operational excellence • Support revenue growth at 2x market growth • Deliver 30+% ROCC
Slide 7: Operations (Past)
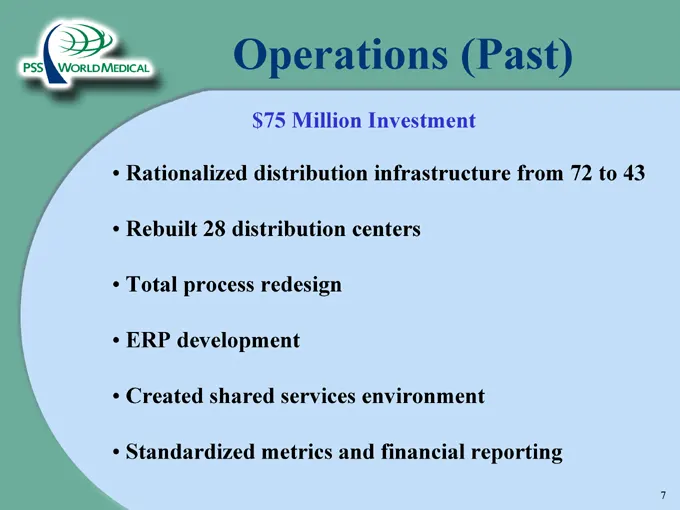
Operations (Past) $75 Million Investment • Rationalized distribution infrastructure from 72 to 43 • Rebuilt 28 distribution centers • Total process redesign • ERP development • Created shared services environment • Standardized metrics and financial reporting
Slide 8: Operations (Results)
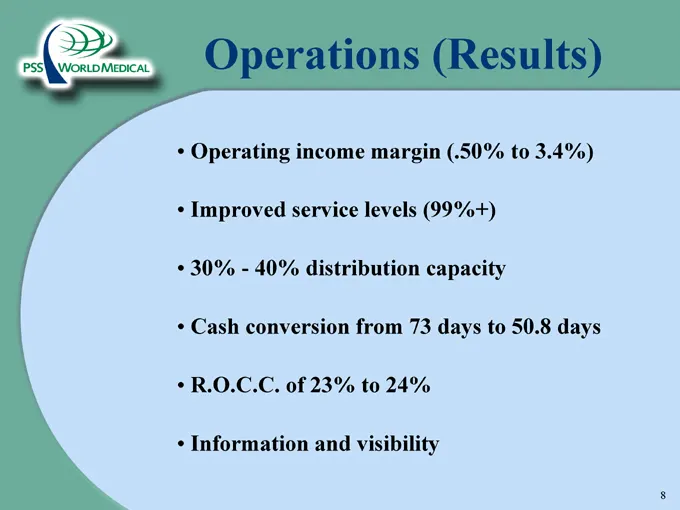
Operations (Results) • Operating income margin (.50% to 3.4%) • Improved service levels (99%+) • 30%—40% distribution capacity • Cash conversion from 73 days to 50.8 days • R.O.C.C. of 23% to 24% • Information and visibility
Slide 9: Operations (Future)
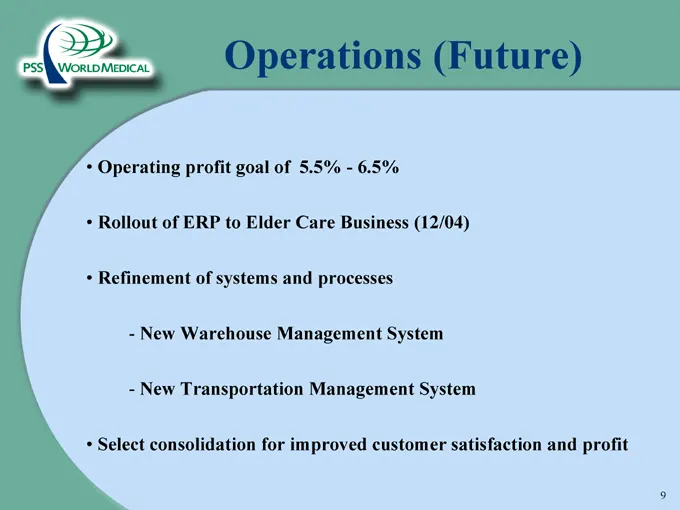
Operations (Future) • Operating profit goal of 5.5%—6.5% • Rollout of ERP to Elder Care Business (12/04) • Refinement of systems and processes - New Warehouse Management System - New Transportation Management System • Select consolidation for improved customer satisfaction and profit
Slide 10: Sales & Marketing
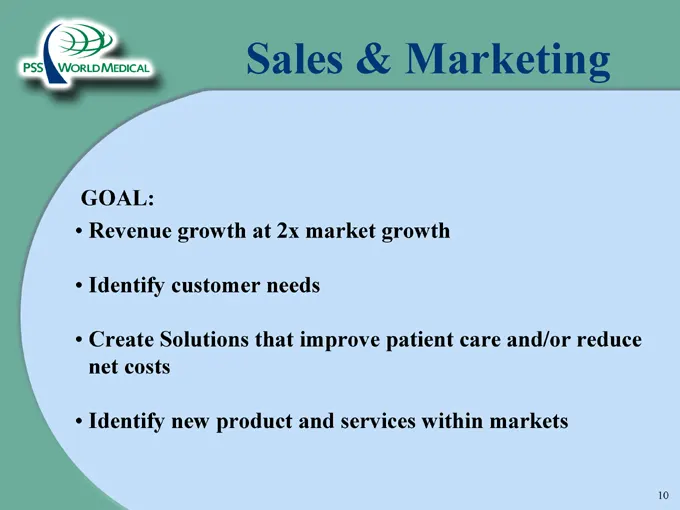
Sales & Marketing GOAL: • Revenue growth at 2x market growth • Identify customer needs • Create Solutions that improve patient care and/or reduce net costs • Identify new product and services within markets
Slide 11: Sales & Marketing (Past)
Sales & Marketing (Past) • Customer surveys • Solutions selling versus product demonstration • Retool product offering • Developed customer systems • Automated pricing
Slide 12: Sales & Marketing (Results)
Sales & Marketing (Results) • 3x revenue growth • Private label product offering ($113 million) • Gross margin stability • Retrained salesforce • Physician: Revenue growth in FY04 = FY99 – FY03 combined • Elder Care: Became market share leader at beginning of FY04 • Expanding market opportunities (R
Slide 13: Sales & Marketing (Future)
Sales & Marketing (Future) • Revenue growth at 2x market growth • Strong product pipeline • Vendor exclusives • Expanded product offering and markets • Stability in gross margins
Slide 14: Culture (Past)
Culture (Past) • Business planning and discipline • Retool management • Cost reduction is good if customer satisfaction is neutral or improved • Metrics and performance = compensation • Focus on process
Slide 15: Culture (Results)
Culture (Results) • Competent management • 14 consecutive quarters of execution • Alignment of resources • Employee turnover reduced by 3 times • Costs are down; profits are up, revenue is up, resources needed are down • Strong morale
Slide 16: Culture (Future)
Culture (Future) • Refinement of business planning process • Acquisition buy-in • Improved profitability • Lower employee turnover • Lower costs • Growth
Slide 17: Strategic Performance
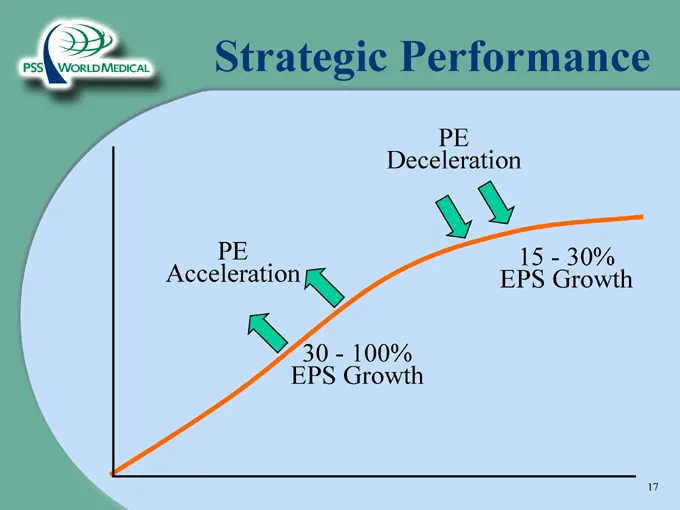
Strategic Performance PE Acceleration PE Deceleration 30—100% EPS Growth 15—30% EPS Growth
Slide 18: Strategic Performance
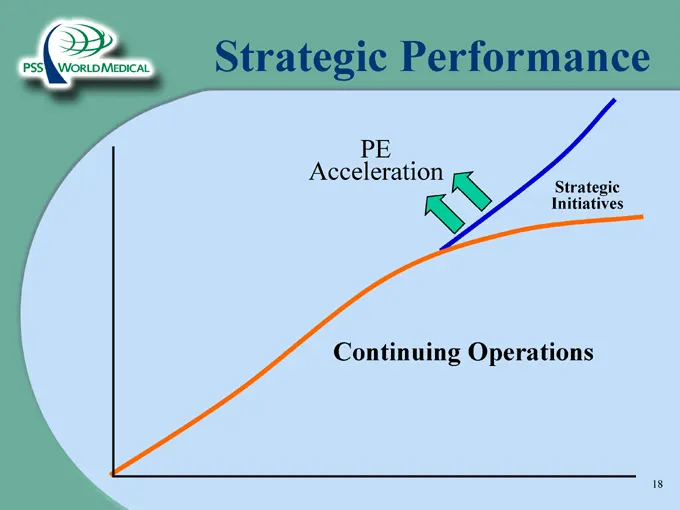
Strategic Performance PE Acceleration Strategic Initiatives Continuing Operations
Slide 19: Strategic Performance
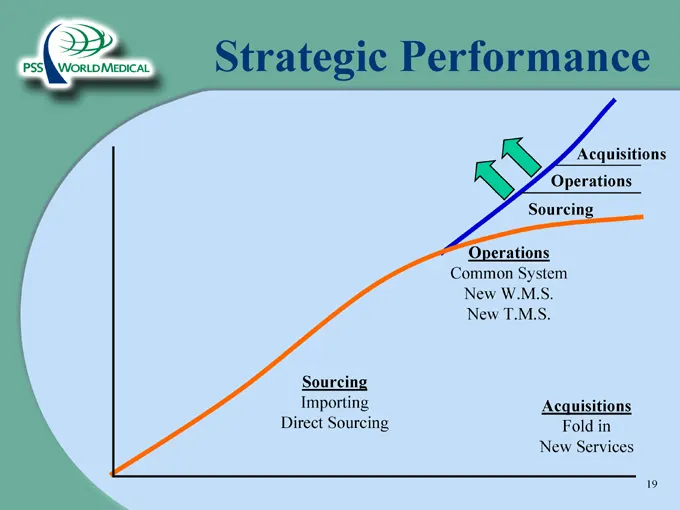
Strategic Performance Acquisitions Operations Sourcing Operations Common System New W.M.S. New T.M.S. Sourcing Importing Direct Sourcing Acquisitions Fold in New Services
Slide 20: Sourcing Priorities
Sourcing Priorities • Strategic positioning - Customer - Product - Brand • Quality • Availability • Price
Slide 21: Branding Strategy
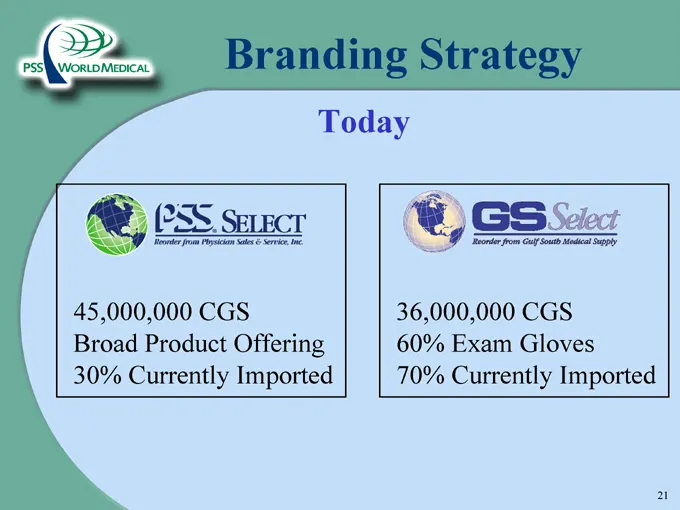
Branding Strategy Today 45,000,000 CGS Broad Product Offering 30% Currently Imported 36,000,000 CGS 60% Exam Gloves 70% Currently Imported
Slide 22: Elements of Sourcing
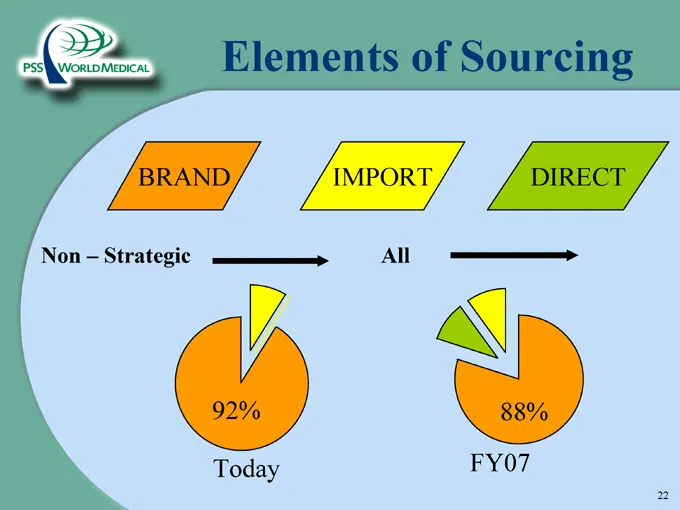
Elements of Sourcing BRAND IMPORT DIRECT Non – Strategic All 92% Today 88% FY07
Slide 23: Fiscal Year 2005
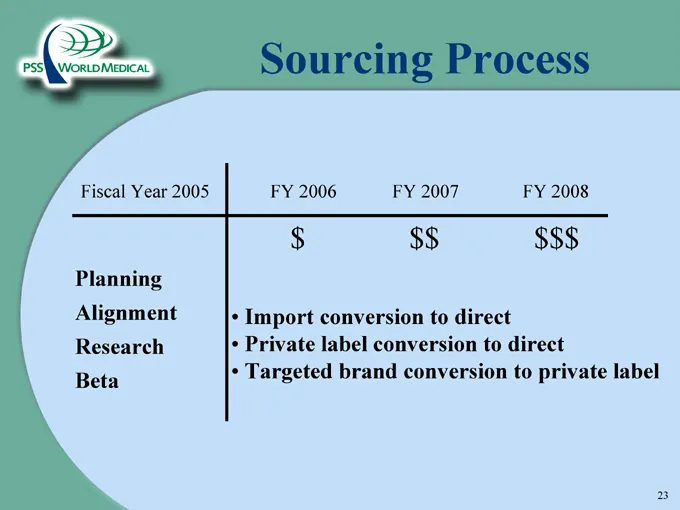
Fiscal Year 2005 Planning Alignment Research Beta FY 2006 FY 2007 FY 2008 $ $$ $$$ • Import conversion to direct • Private label conversion to direct • Targeted brand conversion to private label
Slide 24: Our Future Direction
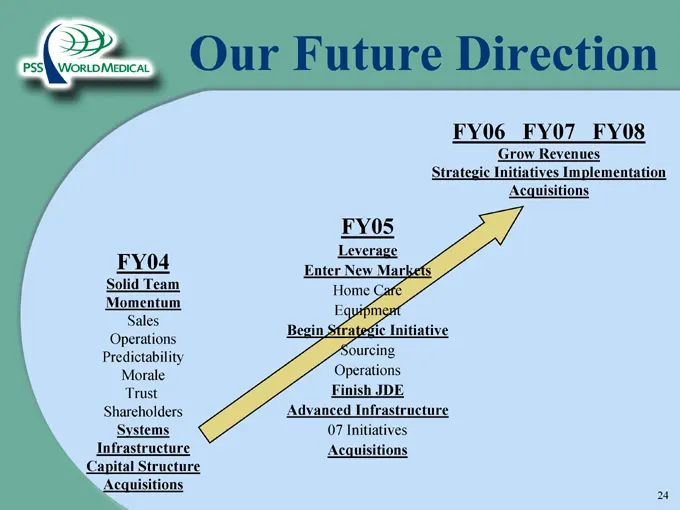
Our Future Direction FY04 Solid Team Momentum Sales Operations Predictability Morale Trust Shareholders Systems Infrastructure Capital Structure Acquisitions FY05 Leverage Enter New Markets Home Care Equipment Begin Strategic Initiative Sourcing Operations Finish JDE Advanced Infrastructure 07 Initi

Slide 25: PSS World Medical
Dy PSS WORLDMEDICAL

Slide 26: Gary J. Nutter, President Elder Care Business
Gary J. Nutter President Elder Care Business
Slide 27: The Elder Care Business FY04 Review & FY05 Focus
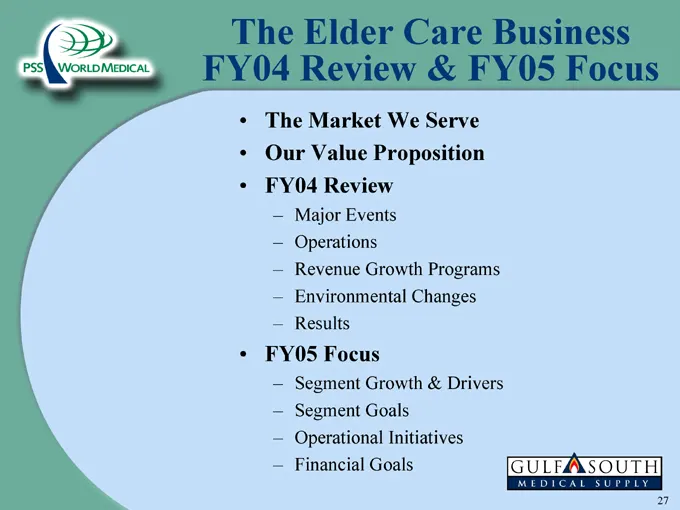
The Elder Care Business FY04 Review & FY05 Focus • The Market We Serve • Our Value Proposition • FY04 Review – Major Events – Operations – Revenue Growth Programs – Environmental Changes – Results • FY05 Focus – Segment Growth & Drivers – Segment Goals – Operational Initiatives – Financial Goals

Slide 28: The Market We Serve
(Cx. The Market We Serve
Slide 29: Eldercare
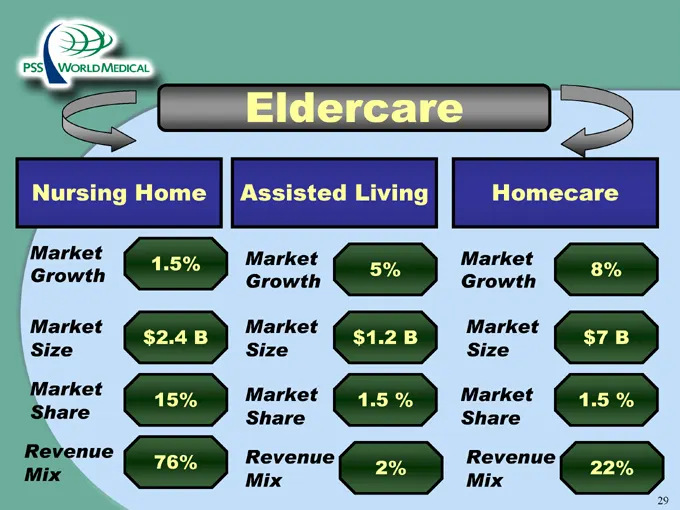
Eldercare Nursing Home Market 1.5% Growth Market $2.4 B Size Market 15% Share Revenue 76% Mix Assisted Living Market 5% Growth Market $1.2 B Size Market 1.5 % Share Revenue 2% Mix Homecare Market 8% Growth Market $7 B Size Market 1.5 % Share Revenue 22% Mix

Slide 30: Our Value Proposition
Our Value Proposition
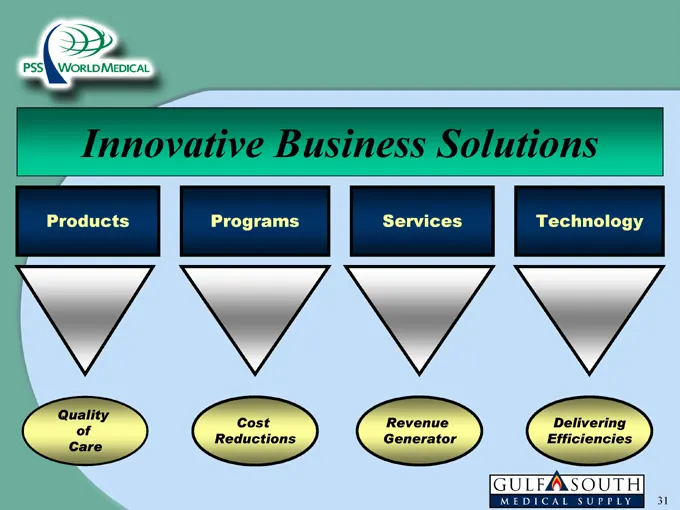
Slide 31: Innovative Business Solutions
Innovative Business Solutions Products Quality of Care Programs Cost Reductions Services Revenue Generator Technology Delivering Efficiencies
Slide 32: Fiscal Year 2004 Review
(Cx. /_ Fiscal Year | 2004 Review
Slide 33: Major Events
Major Events • Change in leadership • Home care launch • Loss of I.H.S ($22 mm in Annualized Sales)
Slide 34: FY04 Became Market Leader
:( > FY04 eeu Became Market Leader [GULFAASOUTH) EDICAL SUPPLY
Slide 35: Competitive Advantages
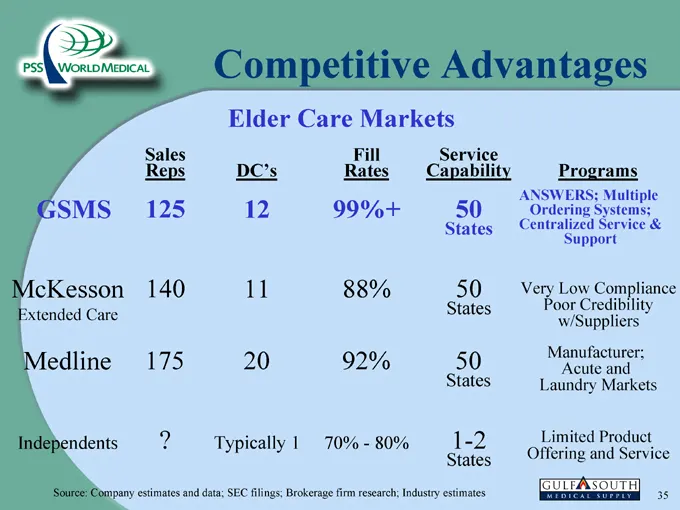
Competitive Advantages Elder Care Markets Source: Company estimates and data; SEC filings; Brokerage firm research; Industry estimates
Slide 36: Operational Review
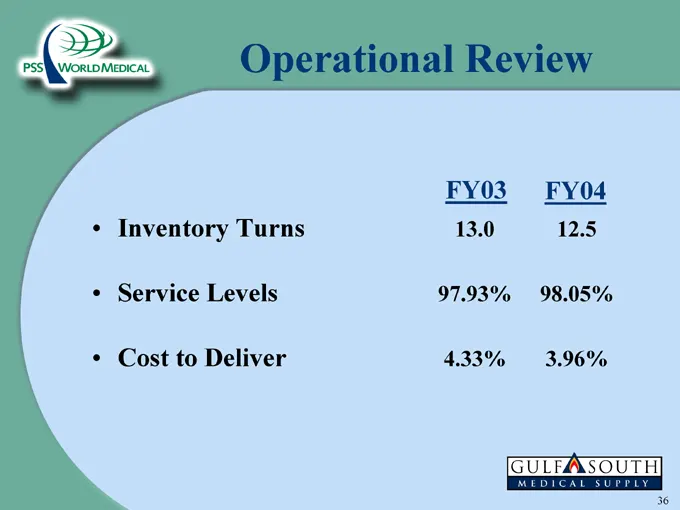
Operational Review FY03 FY04 / + Inventory Turns 13.0 12.5 ¢ Service Levels 97.93% 98.05% * Cost to Deliver 4.33% 3.96%
Slide 37: Revenue Growth Programs—FY 2004
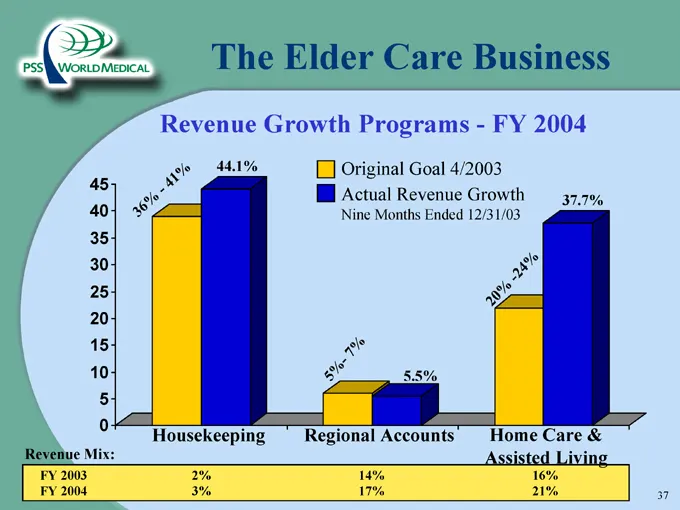
The Elder Care Business Revenue Growth Programs—FY 2004 Original Goal 4/2003 Actual Revenue Growth Nine Months Ended 12/31/03 36% -4 1 % 44.1% 5%-7% 5.5% 20%- 24% 37.7% Housekeeping Regional Accounts Home Care & Assisted Living Revenue Mix: FY 2003 2% 14% 16% FY 2004 3% 17% 21%

Slide 38: Environmental Factors
{EZ ~—— Environmental Factors [GULFAASOUTH) EDICAL SUPPLY
Slide 39: Catalyst in FY 2004
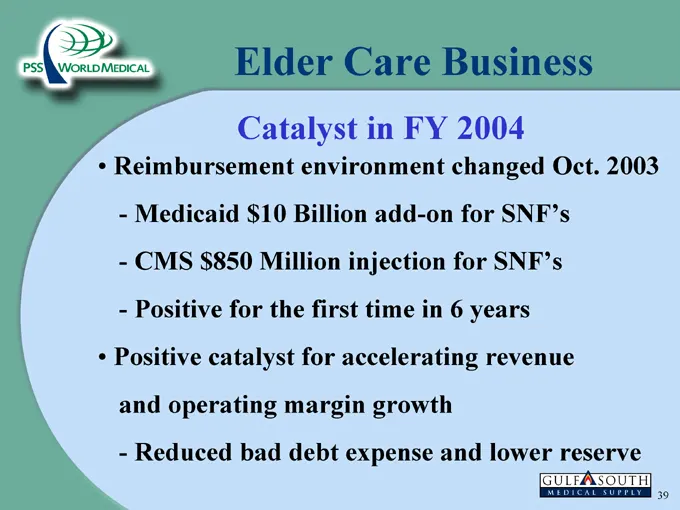
Elder Care Business Catalyst in FY 2004 • Reimbursement environment changed Oct. 2003 - Medicaid $10 Billion add-on for SNF’s - CMS $850 Million injection for SNF’s - Positive for the first time in 6 years • Positive catalyst for accelerating revenue and operating margin growth - Reduced bad debt ex
Slide 40: FY04 Program Results
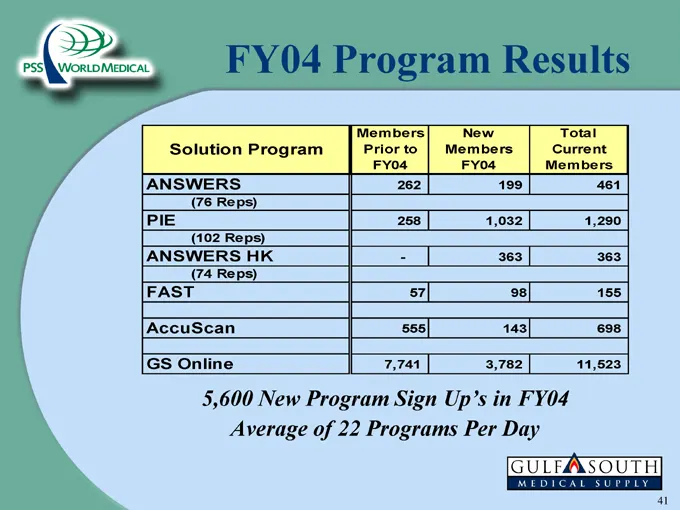
FY04 Program Results Members New Total Solution Program Prior to Members Current FY04 FY04 Members ANSWERS 262 199 461 (76 Reps) PIE 258 1,032 1,290 (102 Reps) ANSWERS HK - 363 363 (74 Reps) FAST 57 98 155 AccuScan 555 143 698 GS Online 7,741 3,782 11,523 5,600 New Program Sign Up’s in FY04 Average
Slide 41: FY04 Results
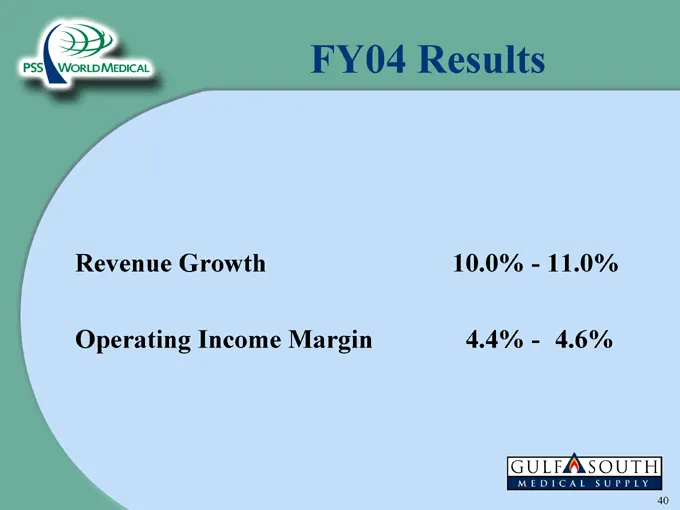
FY04 Results Revenue Growth 10.0%—11.0% Operating Income Margin 4.4%—4.6%

Slide 42: FY05 Focus
FY05 Focus

Slide 43: Market Segment Growth & Drivers
Market Segment Growth & Drivers
Slide 44: FY05 Nursing Home Revenue Growth & Drivers
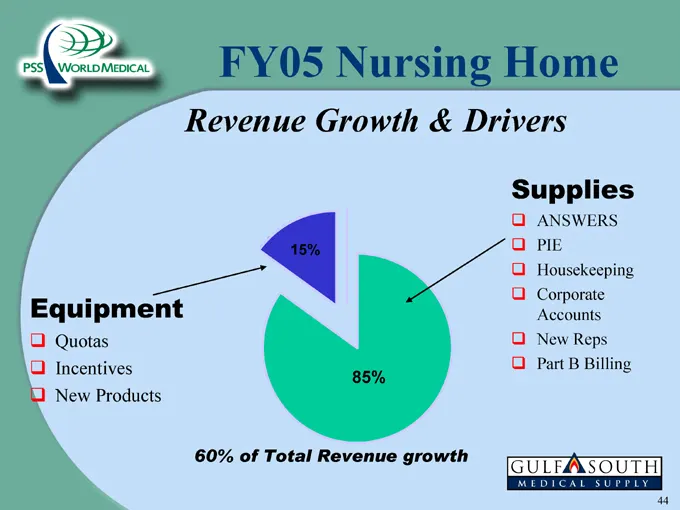
FY05 Nursing Home Revenue Growth & Drivers Equipment ! Quotas ! Incentives ! New Products 15% 85% Supplies ! ANSWERS ! PIE ! Housekeeping ! Corporate Accounts ! New Reps ! Part B Billing 60% of Total Revenue growth
Slide 45: Strategies
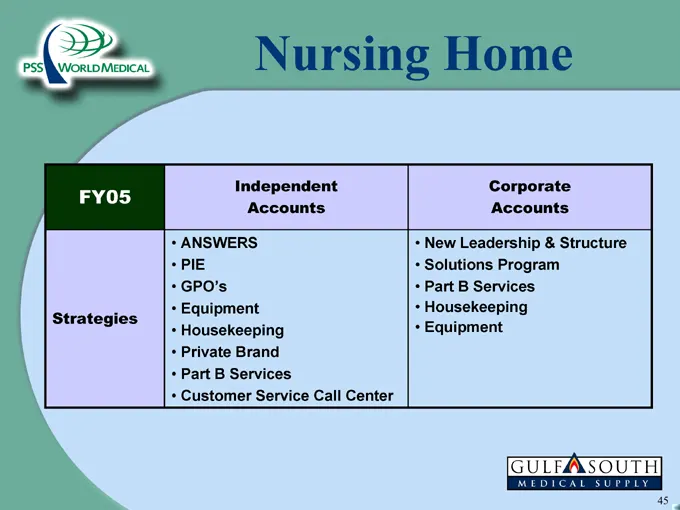
Strategies Nursing Home Independent Accounts Corporate Accounts + ANSWERS + PIE +GPO's + Equipment + Housekeeping + Private Brand + Part B Services + Customer Service Call Center + New Leadership & Structure + Solutions Program + Part B Services + Housekeeping + Equipment ULFAASOUTH MEDICAL SUPPLY 4
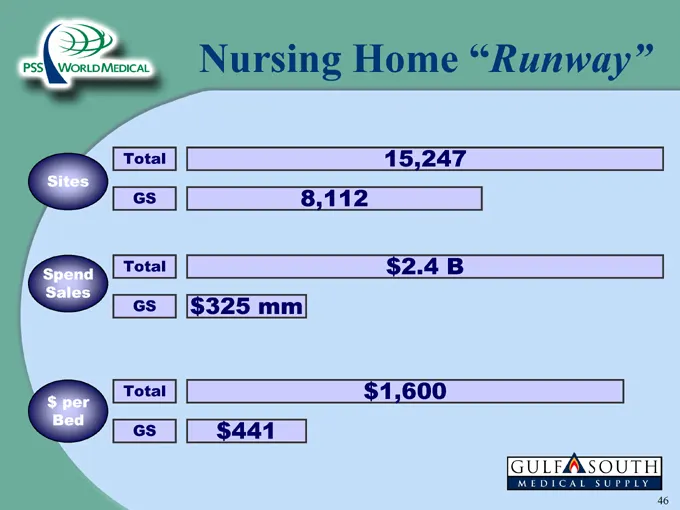
Slide 46: Nursing Home Runway
Nursing Home “Runway” Total 15,247 Sites GS 8,112 Spend Total $2.4 B Sales GS $325 mm Total $ per Bed GS $441
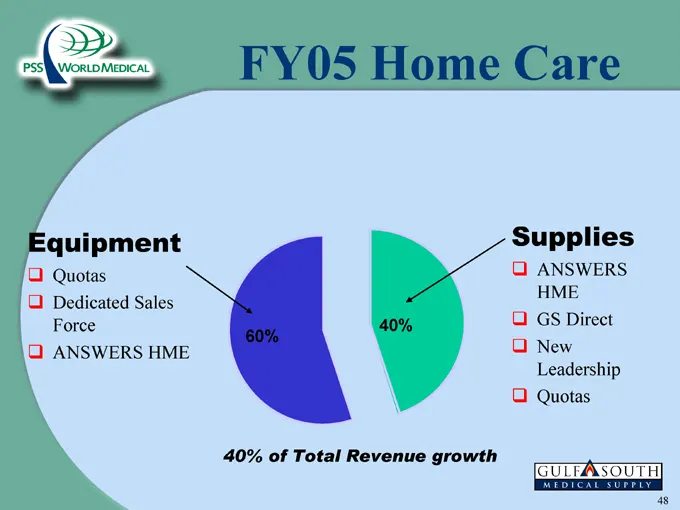
Slide 47: FY05 Home Care
FY05 Home Care Equipment ! Quotas ! Dedicated Sales Force 60% ! ANSWERS HME 40% Supplies ! ANSWERS HME ! GS Direct ! New Leadership ! Quotas 40% of Total Revenue growth
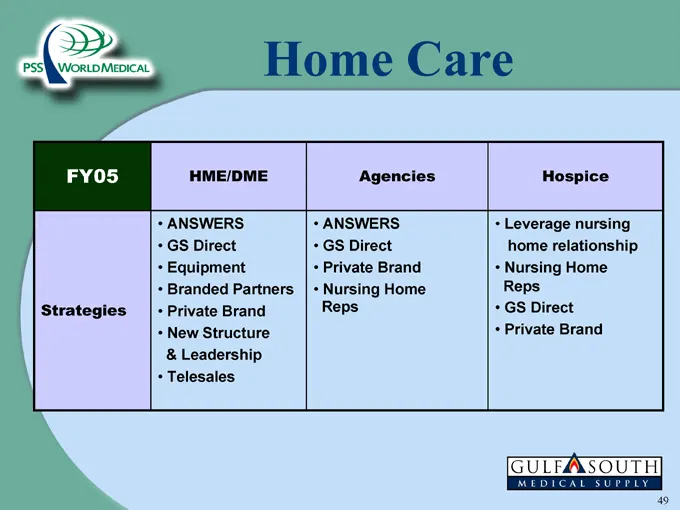
Slide 48: Strategies: Home Care
Strategies Home Care HME/DME Agencies Hospice + ANSWERS + ANSWERS + Leverage nursing + GS Direct + GS Direct home relationship + Equipment + Private Brand + Nursing Home + Branded Partners + Private Brand + New Structure & Leadership + Telesales + Nursing Home Reps Reps + GS Direct + Private Brand c

Slide 49: Segment Goals
Segment Goals
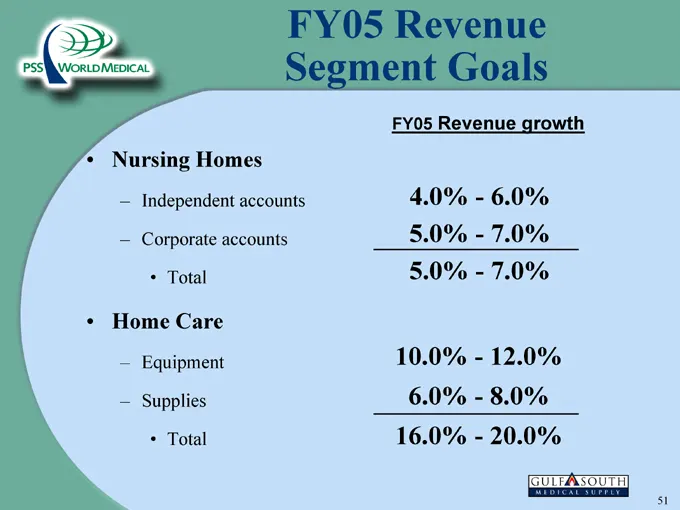
Slide 50: FY05 Revenue Segment Goals
FY05 Revenue Segment Goals * Nursing Homes — Independent accounts — Corporate accounts + Total + Home Care — Equipment — Supplies + Total FY05 Revenue growth 4.0% - 6.0% 5.0% - 7.0% 5.0% - 7.0% 10.0% - 12.0% 6.0% - 8.0% 16.0% - 20.0% CuLPAsourE
Slide 51: Fiscal Year 2005 Operational Initiatives
Fiscal Year 2005 Operational Initiatives
Slide 52: Operational Initiatives
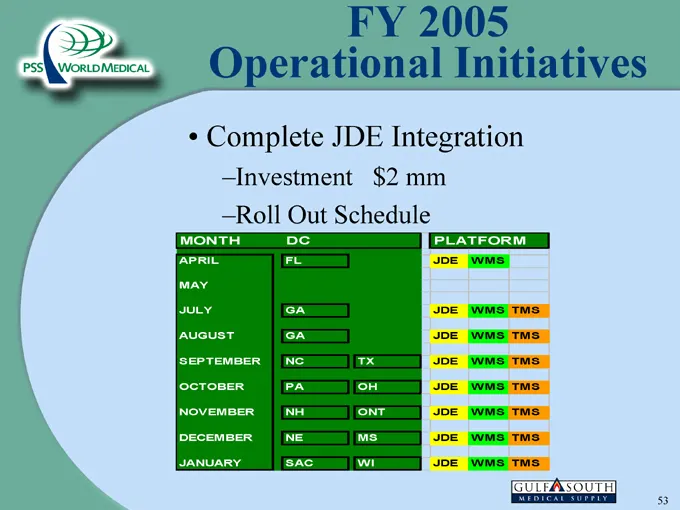
Operational Initiatives • Complete JDE Integration –Investment $2 mm –Roll Out Schedule
Slide 53: Operational Initiatives
Operational Initiatives • Route Optimization • Improved Training • Advanced Warehousing – Warehouse Management System – Transportation Management System

Slide 54: Fiscal Year 2005 Financial Goals
Fiscal Year 2005 Financial Goals
Slide 55: FY2005 Goals
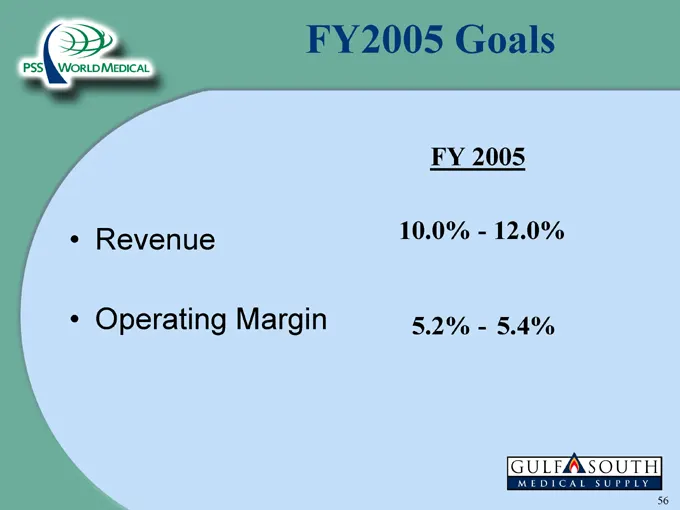
FY2005 Goals FY 2005 • Revenue 10.0%—12.0% • Operating Margin 5.2%—5.4%

Slide 56: PSS World Medical
Dy PSS WORLDMEDICAL
Slide 57: Gary Corless, President Physician Business
Gary Corless President Physician Business
Slide 58: Agenda
Agenda • Market Overview • FY ‘04 Review • FY ‘05 Focus
Slide 59: Environment
Environment • Market growth approximately 4% • Increase in reimbursements for medicare • Medical liability impacting testing
Slide 60: Competitive Advantages
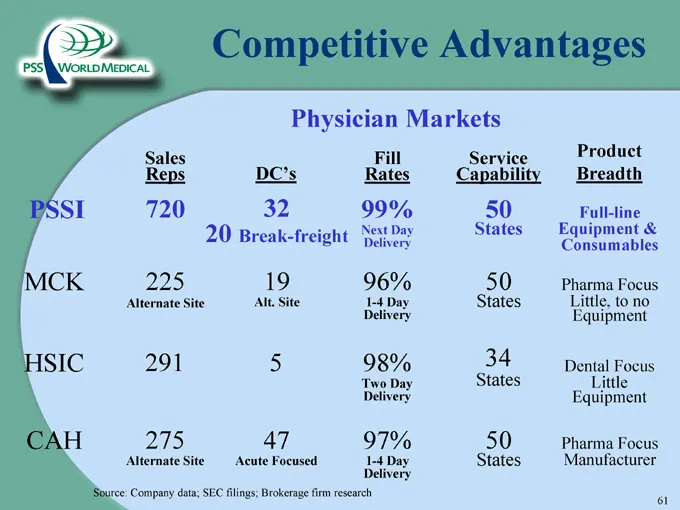
Competitive Advantages Physician Markets Source: Company data; SEC filings; Brokerage firm research
Slide 61: FY04 Growth greater than FY99-FY03 Combined
FY04 ‘04 Growth greater than ‘99, ‘00, ‘01, ‘02, ‘03 Growth COMBINED
Slide 62: Sales & Marketing
Sales & Marketing Customer Satisfaction • Cost savings • Revenue & profit opportunities • Inventory management • One stop shopping Profitability • Cost savings physician program • Revenue & profit opportunities for physician • Inventory management • One stop shopping
Slide 63: FY Program Review
FY 04 Program Review Air (Equipment) Land (Base – Consumables) Sea (Rx)
Slide 64: Broad Based Growth
Broad Based Growth • More strategic • Increased opportunity • Difficult to defend against • Full participation (100% of sales force) • Less risk
Slide 65: Air (Equipment)
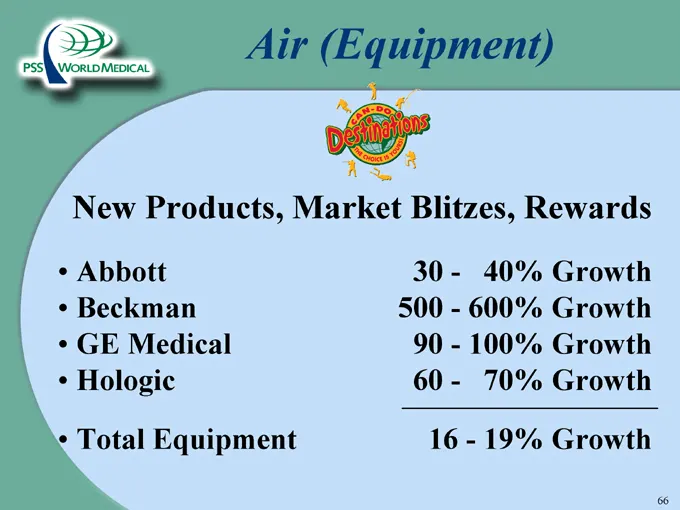
Air (Equipment) New Products, Market Blitzes, Rewards • Abbott 30 - 40% Growth • Beckman 500—600% Growth • GE Medical 90—100% Growth • Hologic 60 - 70% Growth • Total Equipment 16—19% Growth
Slide 66: Land (Base-Consumables)
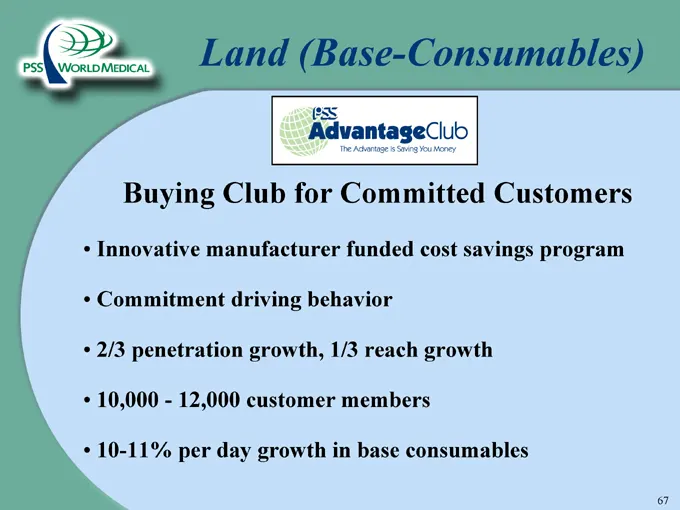
Land (Base-Consumables) Buying Club for Committed Customers • Innovative manufacturer funded cost savings program • Commitment driving behavior • 2/3 penetration growth, 1/3 reach growth • 10,000—12,000 customer members • 10-11% per day growth in base consumables
Slide 67: Sea (Rx)
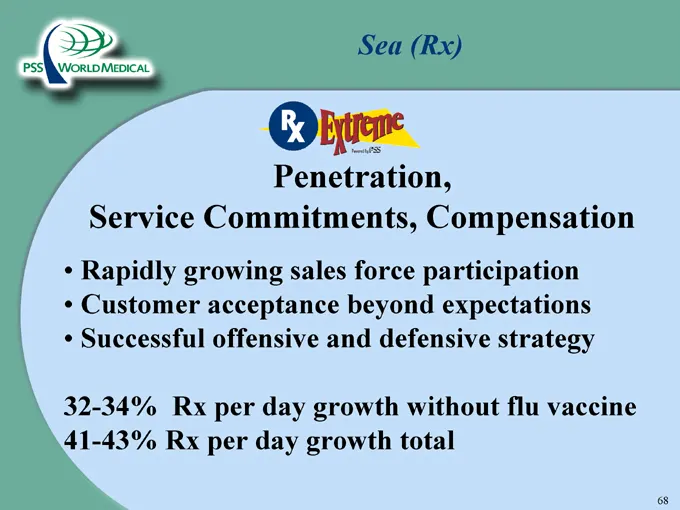
Sea (Rx) Service Commitments, Compensation • Rapidly growing sales force participation • Customer acceptance beyond expectations • Successful offensive and defensive strategy 32-34% Rx per day growth without flu vaccine 41-43% Rx per day growth total
Slide 68: FY Financial Review
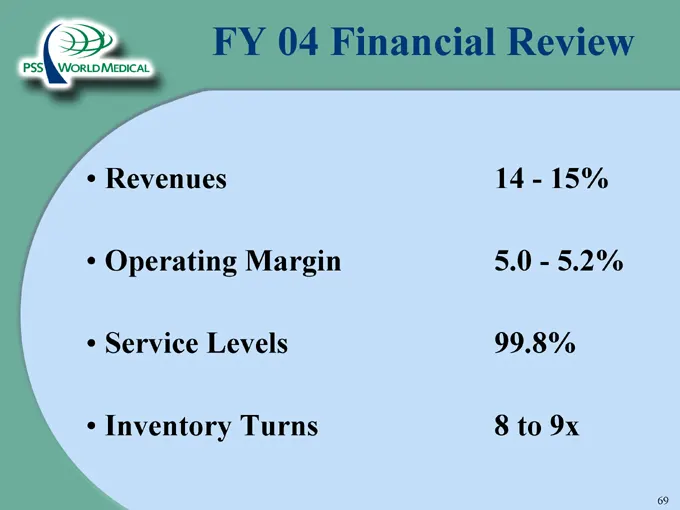
FY 04 Financial Review • Revenues 14—15% • Operating Margin 5.0—5.2% • Service Levels 99.8% • Inventory Turns 8 to 9x
Slide 69: FY '05 Focus
FY ‘05 Focus
Slide 70: Operational Initiatives
Operational Initiatives Customer Satisfaction • Leverage service differentiators – Delivery – Service levels – Local inventory • Compensation alignment – customer surveys Profitability • Continuous process improvements • Route optimization • Leveraging infrastructure • New capabilities
Slide 71: FY Focus
FY 05 Focus • Key sales force differentiators • Market blitzes • Improve physicians’ point of care diagnostic capability and profitability • Growth expectation 8—9%
Slide 72: FY Focus
FY 05 Focus • Customer savings statements • PSS Select growth opportunity • Membership expectations 10,000 to 15,000 Customers • Consumables growth per day 10—11%

Slide 73: FY Focus
FY 05 Focus • “New” rep opportunity • “New” product opportunity • One stop shop • Growth expectation 40-45%
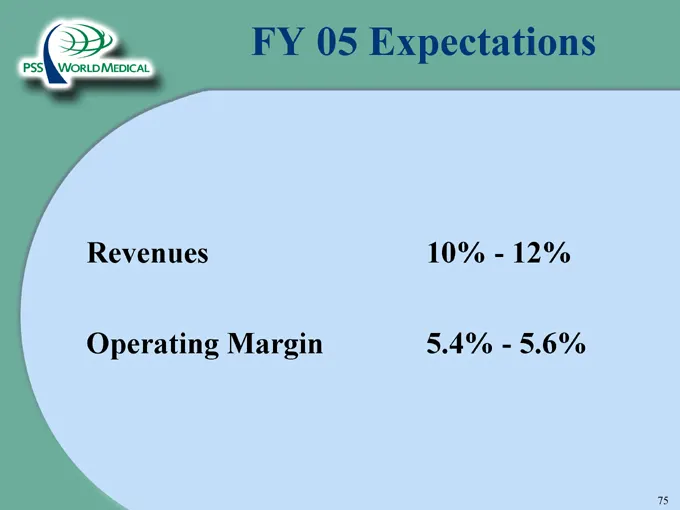
Slide 74: FY Expectations
FY 05 Expectations Revenues 10%—12% Operating Margin 5.4%—5.6%

Slide 75: PSS World Medical
Dy PSS WORLDMEDICAL
Slide 76: Brad Hilton, Senior Vice President, Operations
Brad Hilton Senior Vice President, Operations
Slide 77: Operations Excellence
(24 Operations Excellence
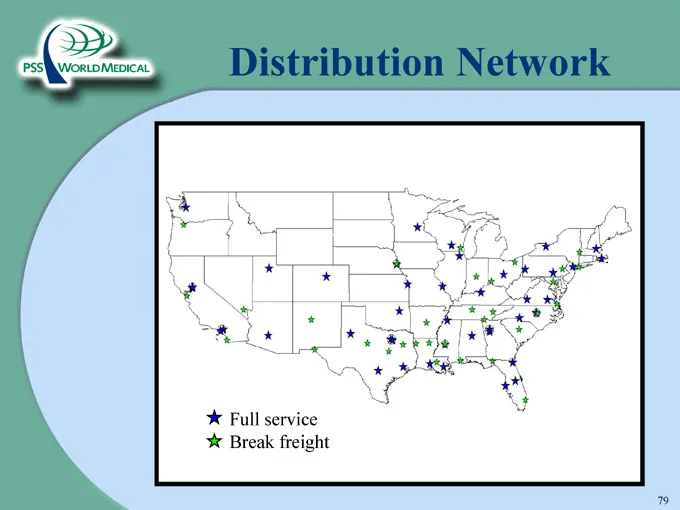
Slide 78: Distribution Network
Distribution Network Full service Break freight
Slide 79: PSS Leveraging
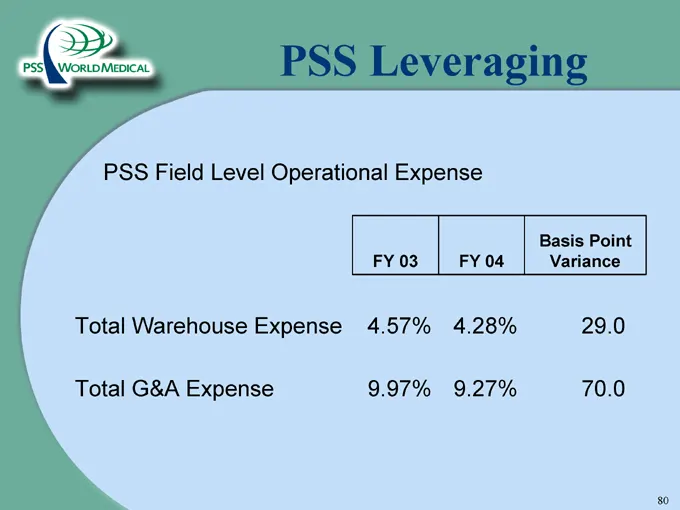
PSS Leveraging PSS Field Level Operational Expense Basis Point FY 03 FY 04 Variance Total Warehouse Expense 4.57% 4.28% 29.0 Total G&A Expense 9.97% 9.27% 70.0
Slide 80: Leveraging
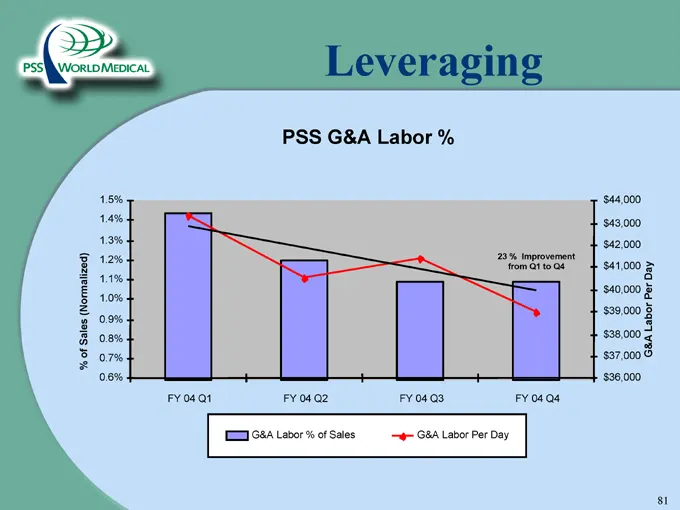
Leveraging PSS G&A Labor % % of Sales (Normalized) 23 % Improvement from Q1 to Q4 G&A Labor % of Sales G&A Labor Per Day
Slide 81: Customer Satisfaction
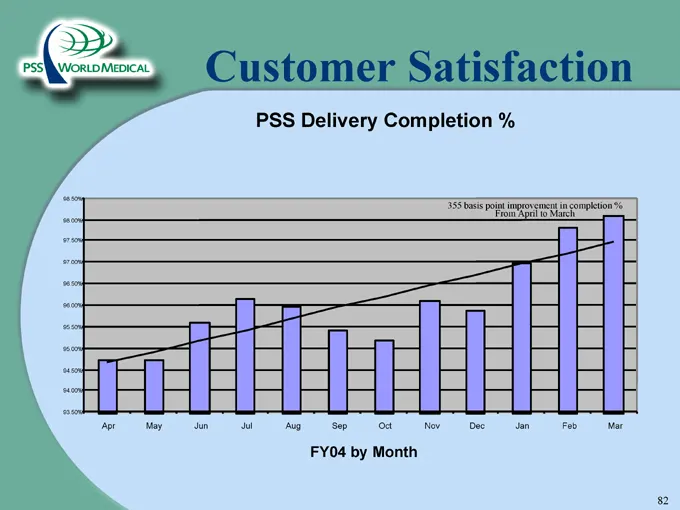
Customer Satisfaction PSS Delivery Completion % 355 basis point improvement in completion % From April to March FY04 by Month
Slide 82: Customer Satisfaction
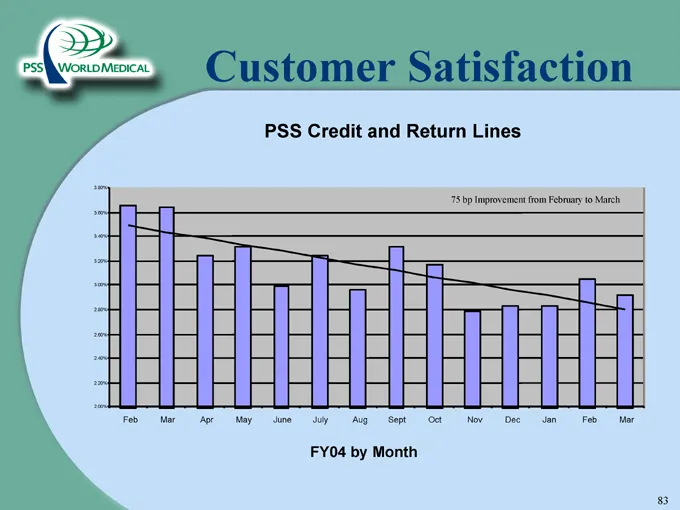
Customer Satisfaction PSS Credit and Return Lines 75 bp Improvement from February to March FY04 by Month
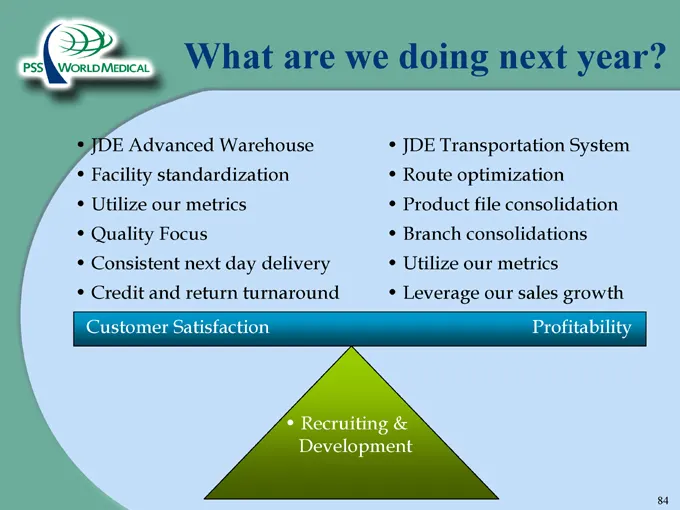
Slide 83: What are we doing next year?
What are we doing next year? • JDE Advanced Warehouse • Facility standardization • Utilize our metrics • Quality Focus • Consistent next day delivery • Credit and return turnaround • JDE Transportation System • Route optimization • Product file consolidation • Branch consolidations • Utilize our met
Slide 84: Warehouse Management System
Warehouse Management System
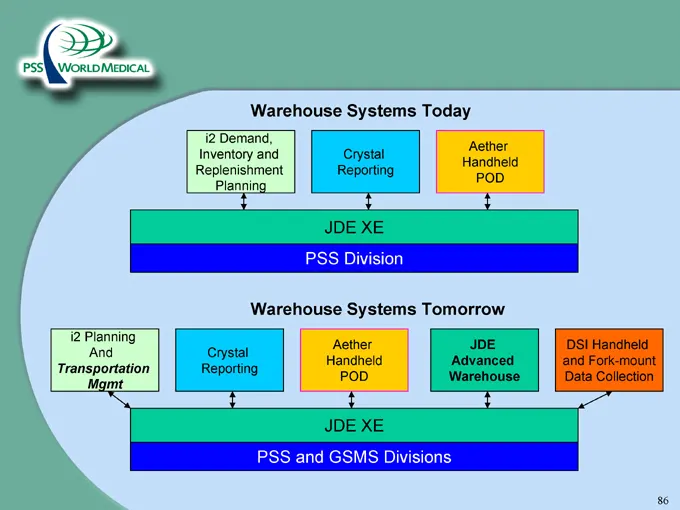
Slide 85: Warehouse Systems
Warehouse Systems Today i2 Demand, Aether Inventory and Crystal Handheld Replenishment Reporting POD Planning JDE XE PSS Division Warehouse Systems Tomorrow i2 Planning Aether JDE DSI Handheld And Crystal Handheld Advanced and Fork-mount Transportation Reporting POD Warehouse Data Collection Mgmt JD
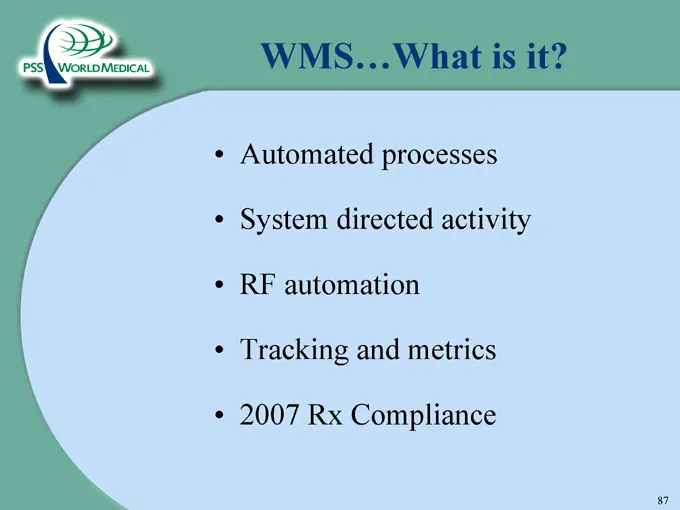
Slide 86: WMS…What is it?
WMS…What is it? • Automated processes • System directed activity • RF automation • Tracking and metrics • 2007 Rx Compliance
Slide 87: Impact on Customer Satisfaction
Impact on Customer Satisfaction • Fewer errors • Higher fill rates • Delivery accuracy and completeness • Reagent shipping integrity • Higher customer delivery completion %
Slide 88: Impact on Profitability
Impact on Profitability • Better space utilization • Increased inventory turns • Improved fleet optimization • Material freight reduction • Labor efficiencies • Tracking and metrics
Slide 89: Implementation Process
Implementation Process • New employee training • Warehouse set-up and processing options • Committed resources • GSMS completed during FY05 • PSS started during FY05 and completed in FY06
Slide 90: Key Operating Metrics
Key Operating Metrics • Customer satisfaction – Delivery completion % – Credit and return turnaround time – Order accuracy % – Customer fill rates • Profitability – Distribution lines processed per hour – Delivery cost per line – COGS per sq ft – Inventory accuracy % – Expired and adjusted product %
Slide 91: Operations…A look into the future
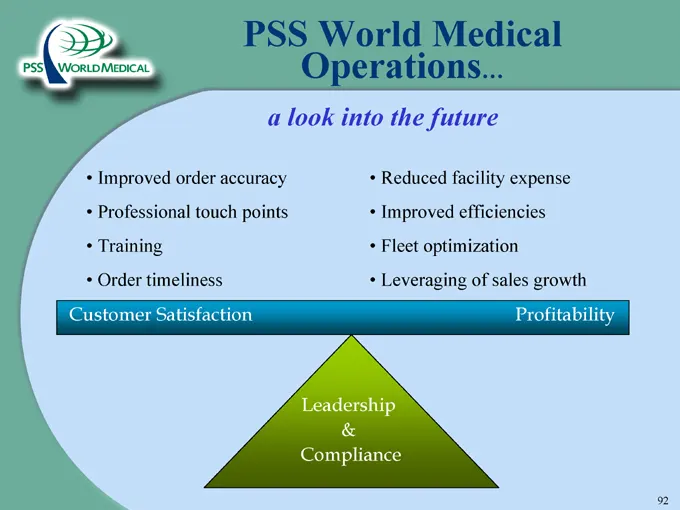
PSS World Medical Operations… A look into the future • Improved order accuracy • Professional touch points • Training • Order timeliness • Reduced facility expense • Improved efficiencies • Fleet optimization • Leveraging of sales growth Customer Satisfaction Profitability Leadership & Compliance

Slide 92: PSS World Medical
Dy PSS WORLDMEDICAL
Slide 93: David Bronson, Executive Vice President and CFO
David Bronson Executive Vice President and CFO
Slide 94: Three Takeaways For Today
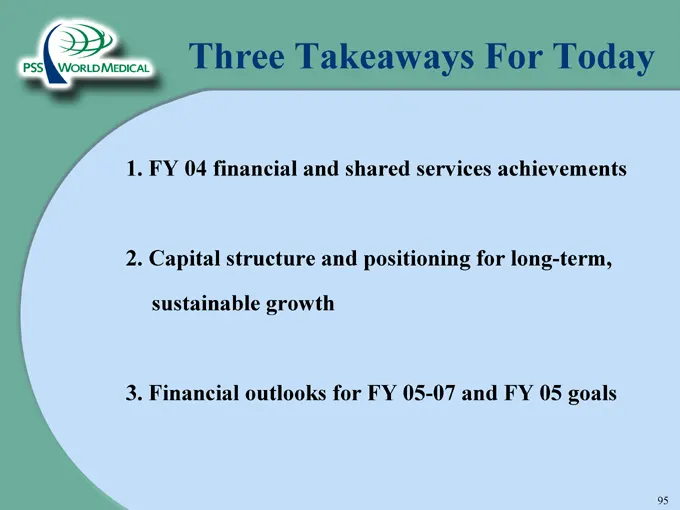
Three Takeaways For Today 1. FY 04 financial and shared services achievements 2. Capital structure and positioning for long-term, sustainable growth 3. Financial outlooks for FY 05-07 and FY 05 goals

Slide 95: Fiscal Year 2004
PSSIAWortD MEDICAL. Fiscal Year 2004
Slide 96: Fiscal Year 2004
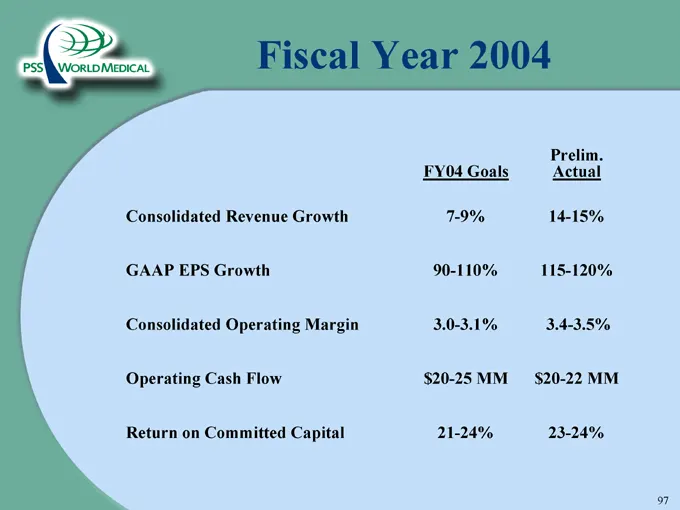
Fiscal Year 2004 FY04 Goals Prelim. Actual Consolidated Revenue Growth 7-9% 14-15% GAAP EPS Growth 90-110% 115-120% Consolidated Operating Margin 3.0-3.1% 3.4-3.5% Operating Cash Flow $20-25 MM $20-22 MM Return on Committed Capital 21-24% 23-24%
Slide 97: Shared Services Accomplishments
Shared Services Accomplishments • Centralized purchasing • JDE rollout to Physician Business • Supply chain & indirect materials • Information technology

Slide 98: Capital Structure
Capital Structure
Slide 99: Summary Balance Sheet
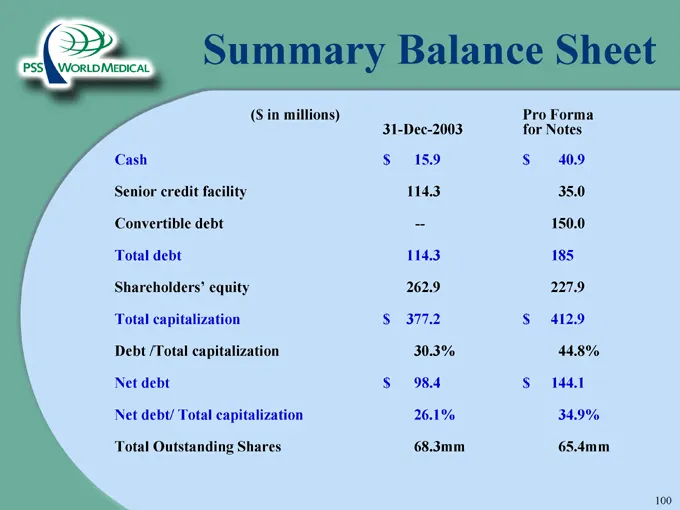
Summary Balance Sheet ($ in millions) Pro Forma 31-Dec-2003 or Notes Cash $ 15.9 $ 40.9 Senior credit facility 114.3 35.0 Convertible debt — 150.0 Total debt 114.3 185 Shareholders’ equity 262.9 227.9 Total capitalization $ 377.2 $ 412.9 Debt /Total capitalization 30.3% 44.8% Net debt $ 98.4 $ 144.1
Slide 100: Capital Resources
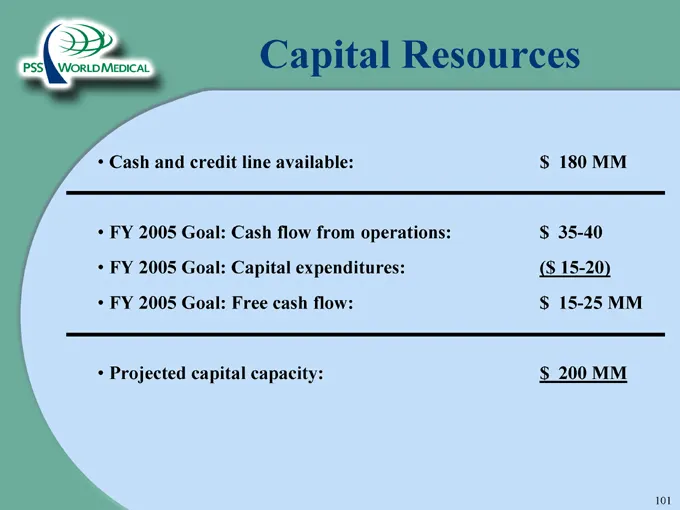
Capital Resources • Cash and credit line available: $ 180 MM • FY 2005 Goal: Cash flow from operations: $ 35-40 • FY 2005 Goal: Capital expenditures: ($ 15-20) • FY 2005 Goal: Free cash flow: $ 15-25 MM • Projected capital capacity: $ 200 MM

Slide 101: Acquisition Strategy
PSSIAWortD MEDICAL. Acquisition Strategy
Slide 102: Acquisition Criteria
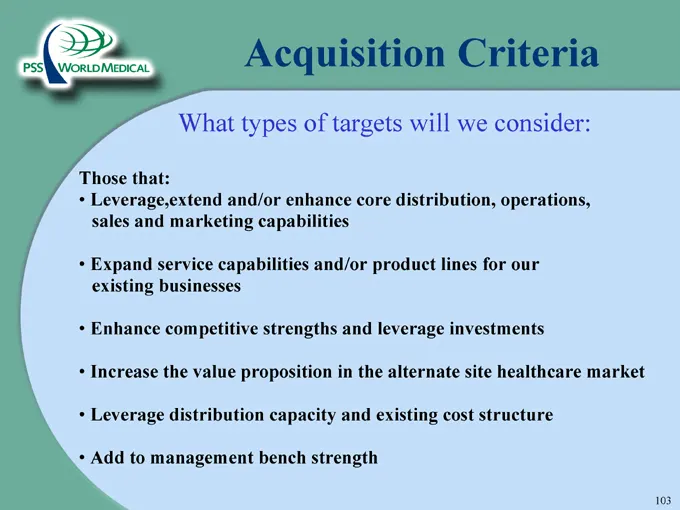
Acquisition Criteria What types of targets will we consider: Those that: • Leverage,extend and/or enhance core distribution, operations, sales and marketing capabilities • Expand service capabilities and/or product lines for our existing businesses • Enhance competitive strengths and leverage invest
Slide 103: Acquisition Criteria
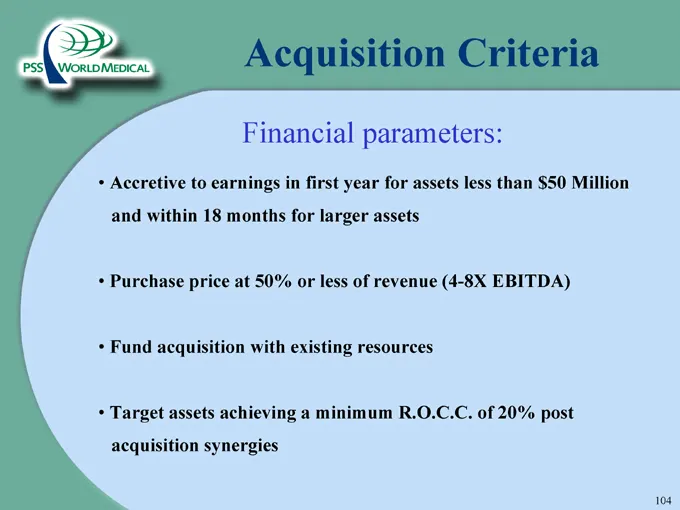
Acquisition Criteria Financial parameters: • Accretive to earnings in first year for assets less than $50 Million and within 18 months for larger assets • Purchase price at 50% or less of revenue (4-8X EBITDA) • Fund acquisition with existing resources • Target assets achieving a minimum R.O.C.C. of
Slide 104: Case Study—Highpoint Acquisition
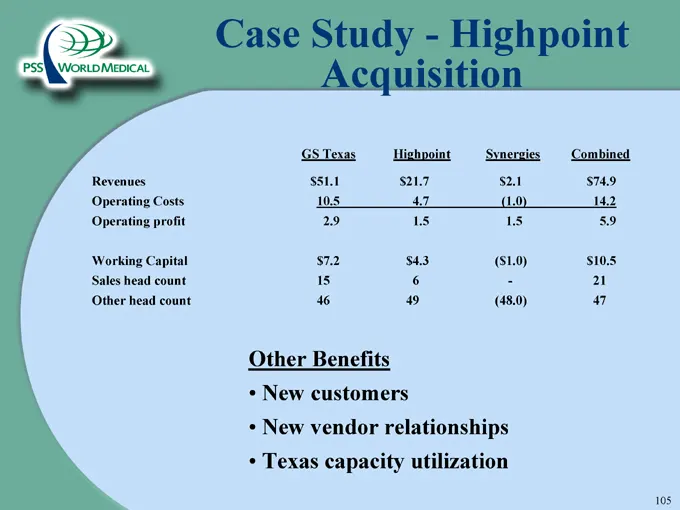
Case Study—Highpoint Acquisition GS Texas Highpoint Synergies Combined Revenues $51.1 $21.7 $2.1 $74.9 Operating Costs 10.5 4.7 (1.0) 14.2 Operating profit 2.9 1.5 1.5 5.9 Working Capital $7.2 $4.3 ($1.0) $10.5 Sales head count 15 6 - 21 Other head count 46 49 (48.0) 47 Other Benefits • New customer

Slide 105: Financial Outlook for FY '05-'07
Financial Outlook for FY ‘05 - ‘07
Slide 106: The Physician Business
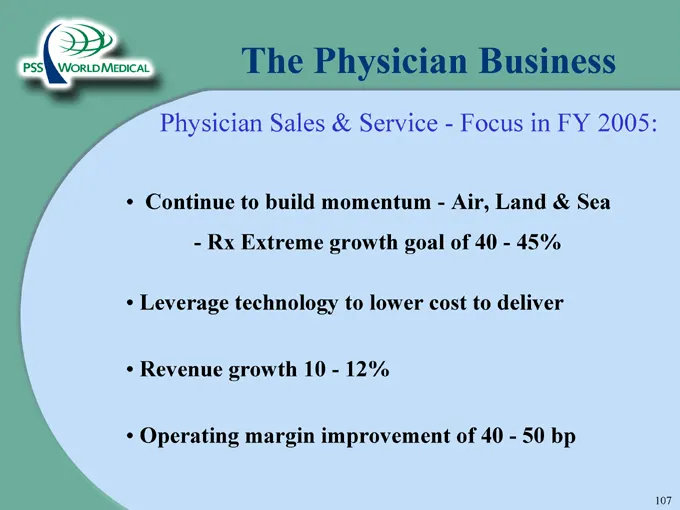
The Physician Business Physician Sales & Service—Focus in FY 2005: • Continue to build momentum—Air, Land & Sea - Rx Extreme growth goal of 40—45% • Leverage technology to lower cost to deliver • Revenue growth 10—12% • Operating margin improvement of 40—50 bp
Slide 107: The Elder Care Business
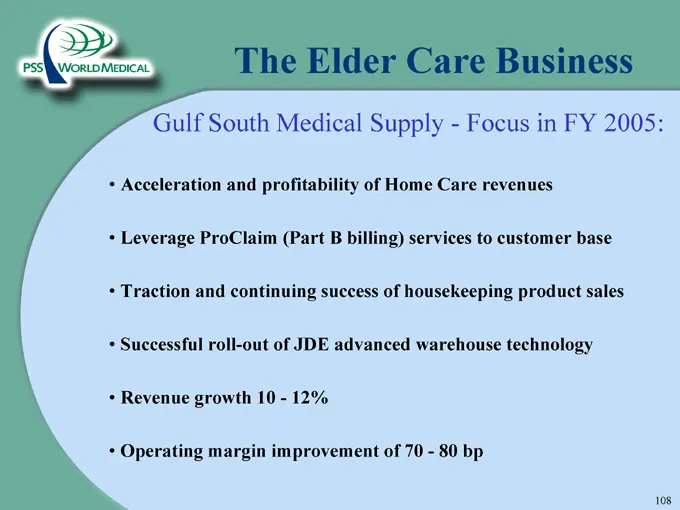
The Elder Care Business Gulf South Medical Supply—Focus in FY 2005: • Acceleration and profitability of Home Care revenues • Leverage ProClaim (Part B billing) services to customer base • Traction and continuing success of housekeeping product sales • Successful roll-out of JDE advanced warehouse te
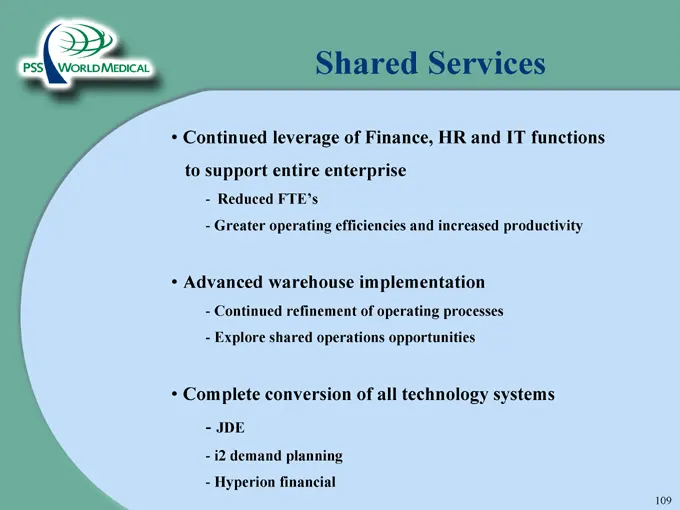
Slide 108: Shared Services
Shared Services • Continued leverage of Finance, HR and IT functions to support entire enterprise - Reduced FTE’s - Greater operating efficiencies and increased productivity • Advanced warehouse implementation - Continued refinement of operating processes - Explore shared operations opportunities •
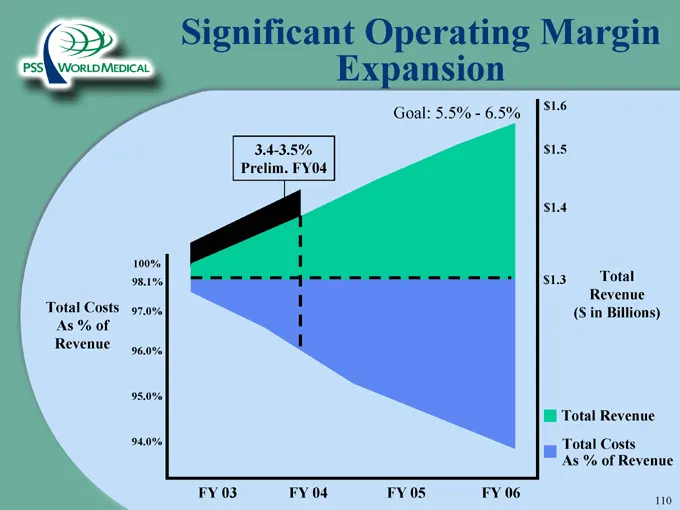
Slide 109: Significant Operating Margin Expansion
Significant Operating MarginExpansion Total Costs As % of Revenue 3.4-3.5% Prelim. FY04 Goal: 5.5%—6.5% Total Revenue ($ in Billions) Total Revenue Total Costs As % of Revenue
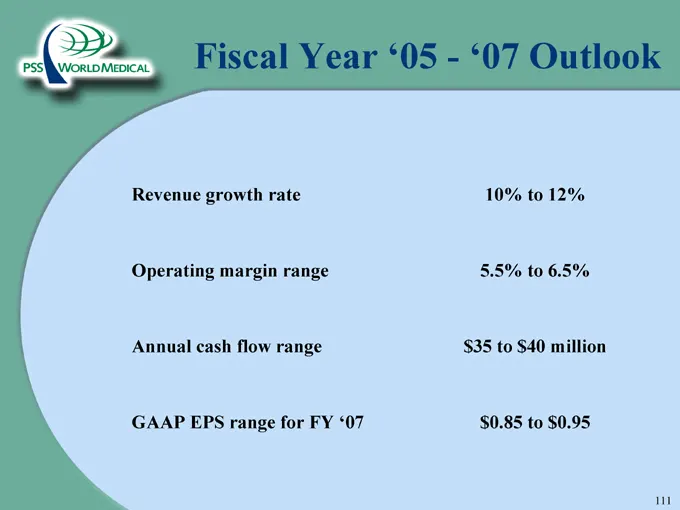
Slide 110: Fiscal Year '05-'07 Outlook
Fiscal Year ‘05—‘07 Outlook Revenue growth rate 10% to 12% Operating margin range 5.5% to 6.5% Annual cash flow range $35 to $40 million GAAP EPS range for FY ‘07 $0.85 to $0.95

Slide 111: FY '05 Financial Goals
PSSIAWortD MEDICAL. FY ‘05 Financial Goals
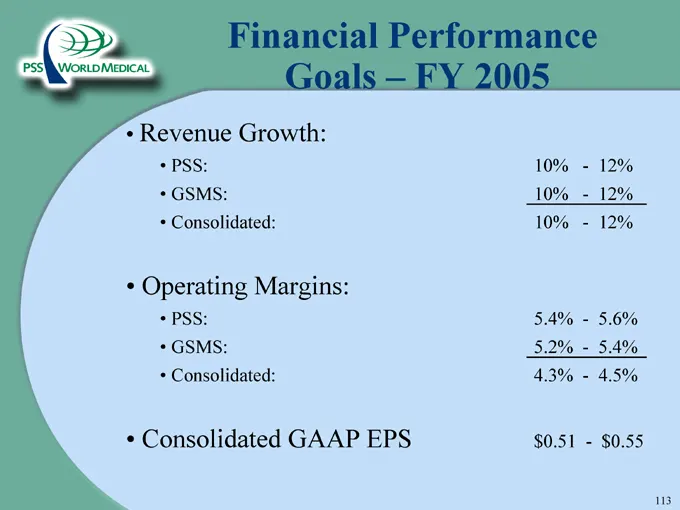
Slide 112: Financial Performance Goals – FY 2005
Financial Performance Goals – FY 2005 • Revenue Growth: • PSS: 10%—12% • GSMS: 10%—12% • Consolidated: 10%—12% • Operating Margins: • PSS: 5.4%—5.6% • GSMS: 5.2%—5.4% • Consolidated: 4.3%—4.5% • Consolidated GAAP EPS $0.51—$0.55
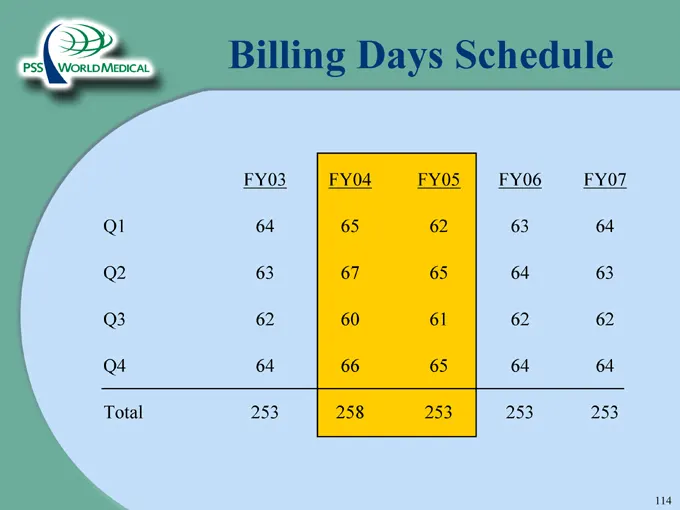
Slide 113: Billing Days Schedule
Billing Days Schedule FY03 FY04 FY05 FY06 FY07 Q1 64 65 62 63 64 Q2 63 67 65 64 63 Q3 62 60 61 62 62 Q4 64 66 65 64 64 Total 253 258 253 253 253
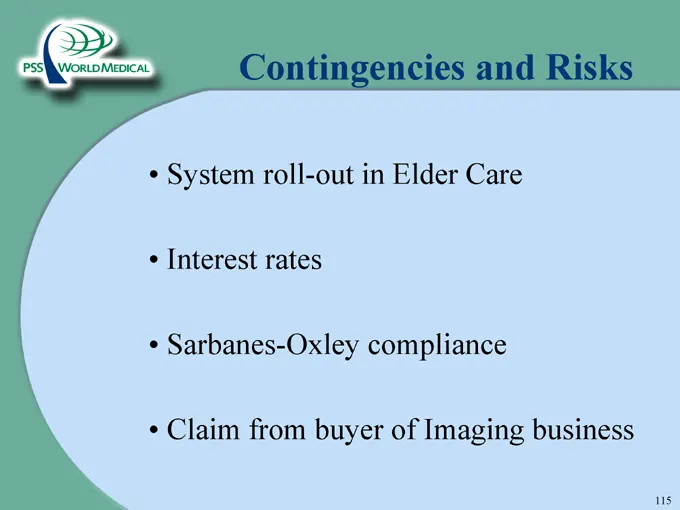
Slide 114: Contingencies and Risks
Contingencies and Risks • System roll-out in Elder Care • Interest rates • Sarbanes-Oxley compliance • Claim from buyer of Imaging business
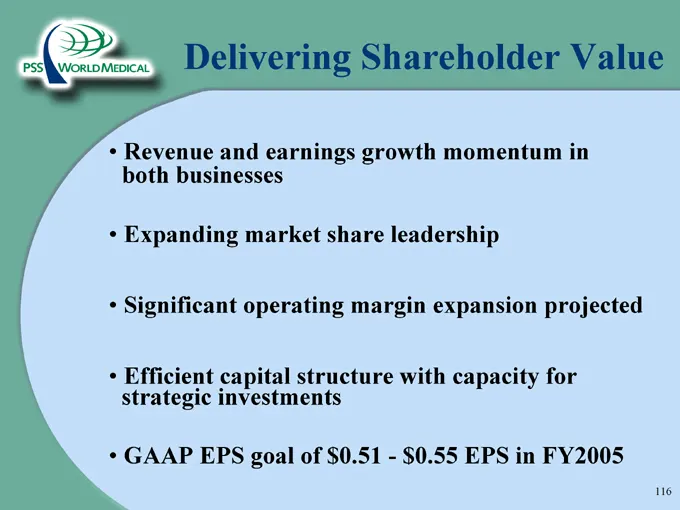
Slide 115: Delivering Shareholder Value
Delivering Shareholder Value • Revenue and earnings growth momentum in both businesses • Expanding market share leadership • Significant operating margin expansion projected • Efficient capital structure with capacity for strategic investments • GAAP EPS goal of $0.51—$0.55 EPS in FY2005

Slide 116: Improving health care in America through Innovative Solutions
Improving health care in America through Innovative Solutions Nasdaq:PSSI
Source: SEC EDGAR · 8-K filed Apr 28, 2004