Oiltanking Partners LP — RBC Capital Markets MLP Conference 2014
36 slides from Oiltanking Partners LP's conference presentation, Nov 19, 2014

Slide 1: Filed by Enterprise Products Partners L.P. Pursuant to Rule 425
Filed by Enterprise Products Partners L.P. Pursuant to Rule 425 under the Securities Act of 1933 Subject Company: Oiltanking Partners, L.P. Commission File No.: 001-35230 Enterprise Products Partners L.P. (the “Partnership”) is filing an investor presentation that discloses a variety of financial, o
Slide 2: RBC Capital Markets MLP Conference
ENTERPRISE PRODUCTS PARTNERS L.P. RBC CAPITAL MARKETS MLP CONFERENCE November 19, 2014 Mike Creel CEO © ALL RIGHTS RESERVED. ENTERPRISE PRODUCTS PARTNERS L.P. enterpriseproducts.com
Slide 3: Forward-Looking Statements
FORWARD–LOOKING STATEMENTS This presentation contains forward-looking statements based on the beliefs of the company, as well as assumptions made by, and information currently available to our management team. When used in this presentation, words such as “anticipate,” “project,” “expect,” “plan,” “
Slide 4: Additional Information
ADDITIONAL INFORMATION This communication does not constitute an offer to buy or solicitation of an offer to sell any securities. In furtherance of the proposed merger of Oiltanking Partners, L.P. (“Oiltanking”) with a wholly-owned subsidiary of Enterprise, Enterprise and Oiltanking will file one or
Slide 5: Enterprise Products Partners L.P.
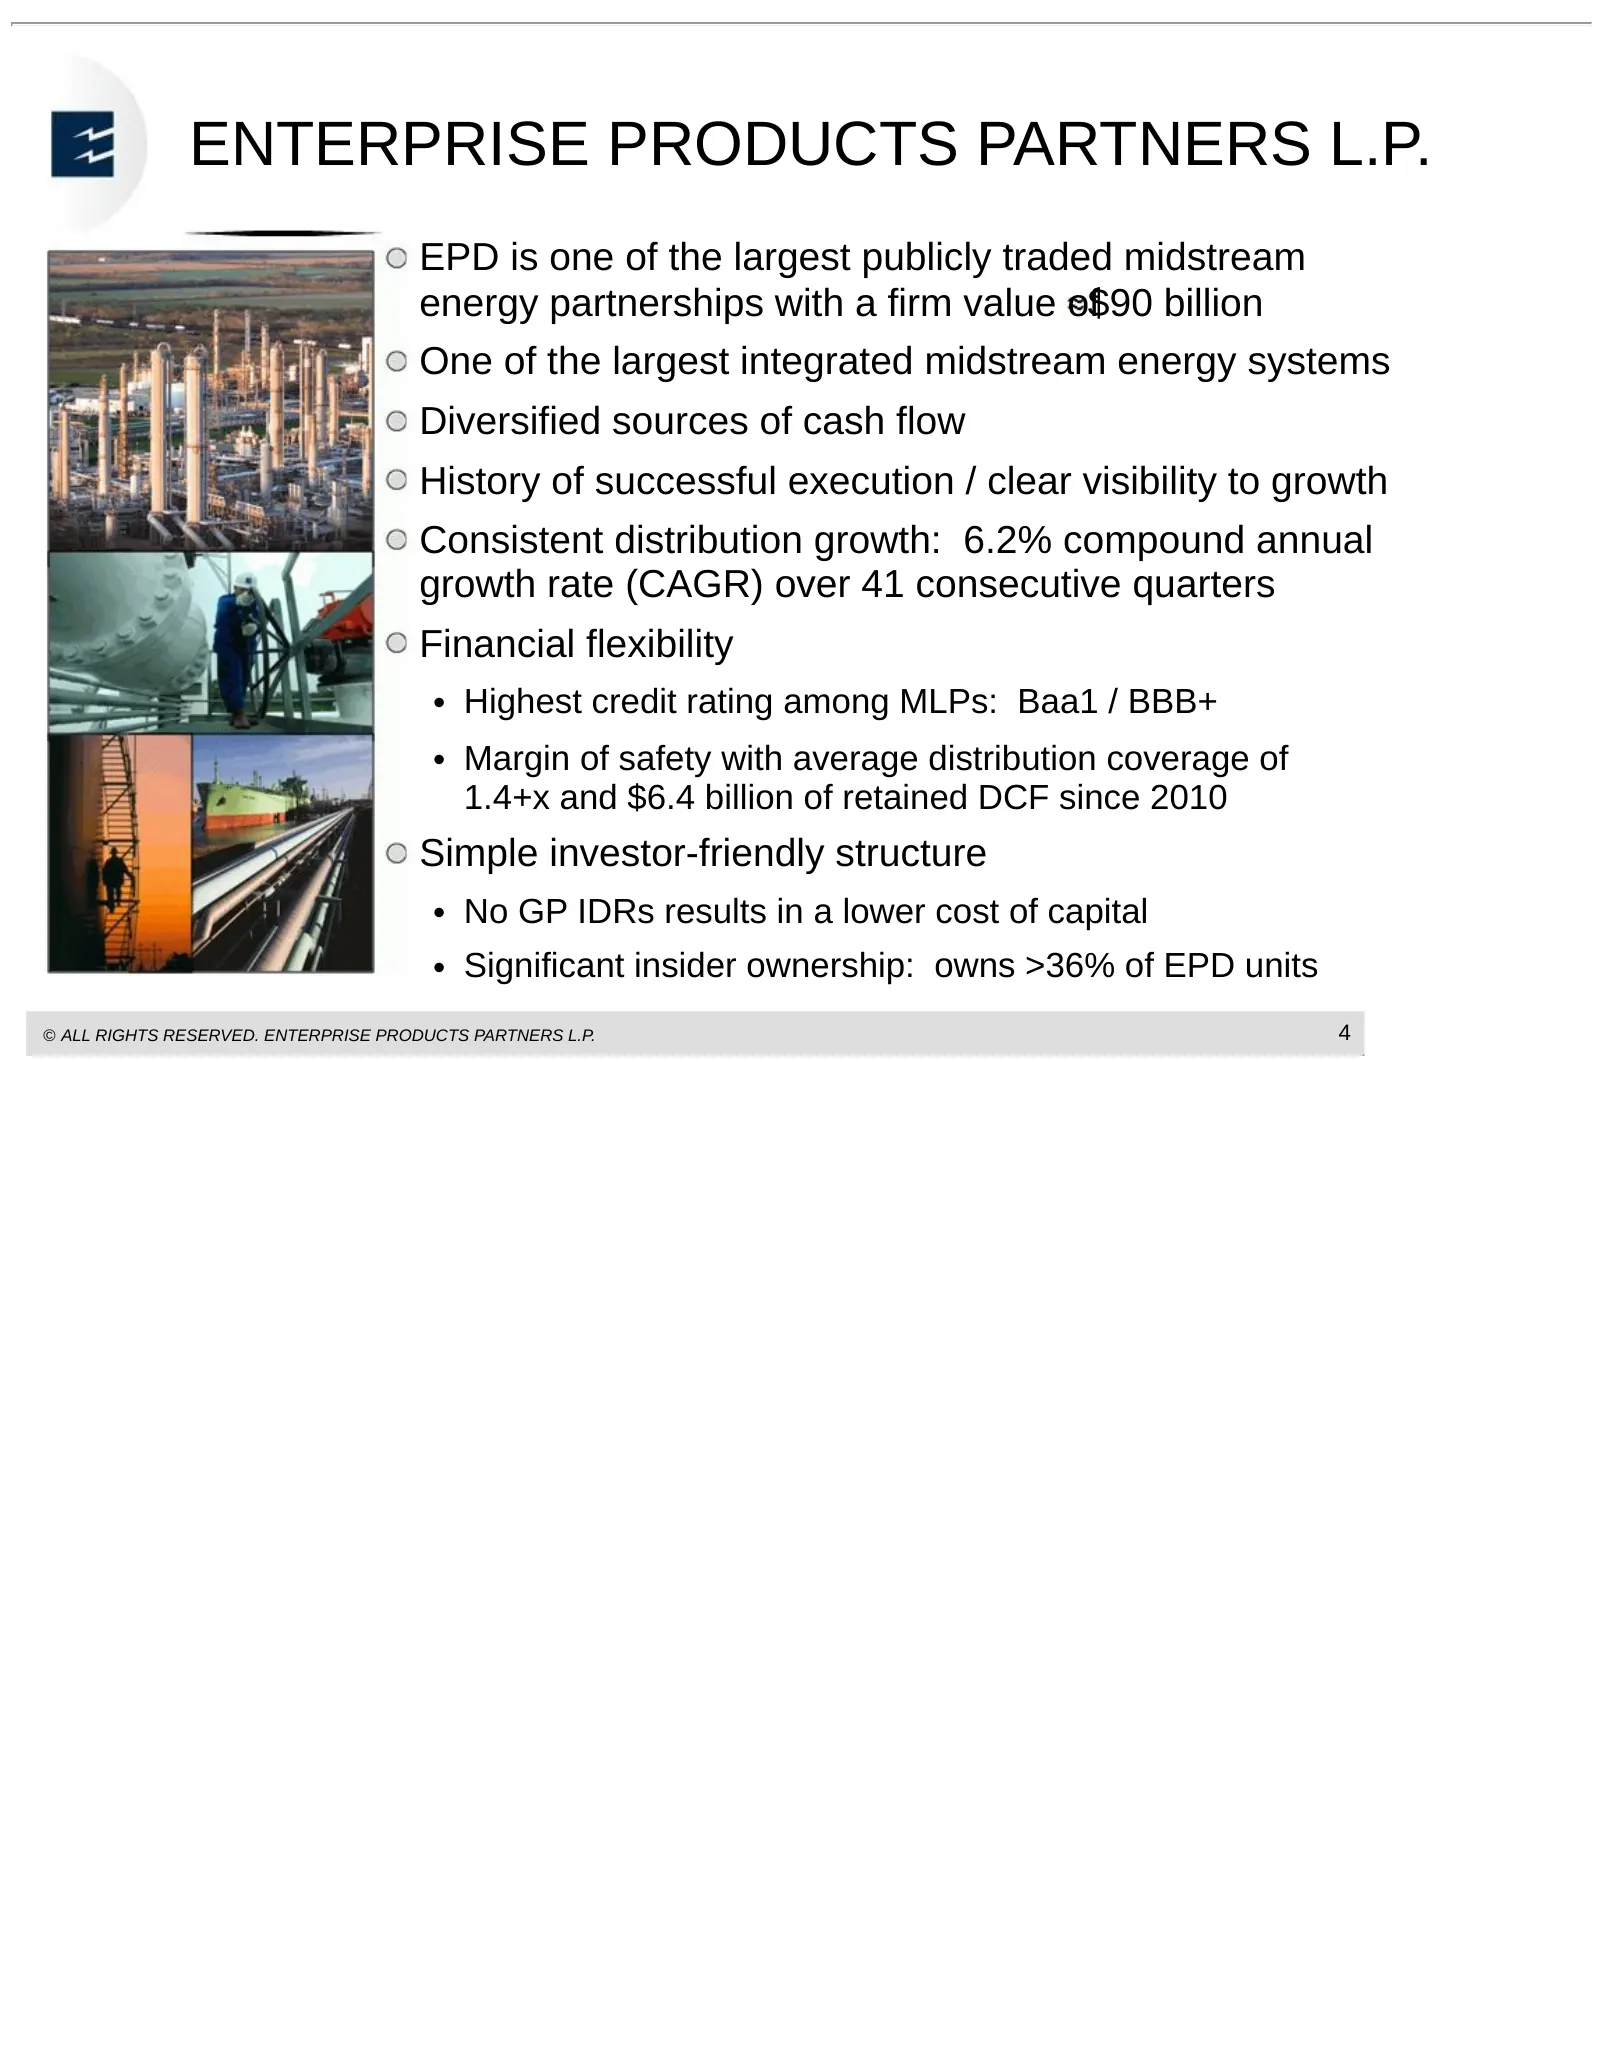
ENTERPRISE PRODUCTS PARTNERS L.P. EPD is one of the largest publicly traded midstream energy partnerships with a firm value of$90 billion One of the largest integrated midstream energy systems Diversified sources of cash flow History of successful execution / clear visibility to growth Consistent di
Slide 6: EPD Today: Natural Gas, NGL, Crude Oil, Refined Products and Petrochemicals
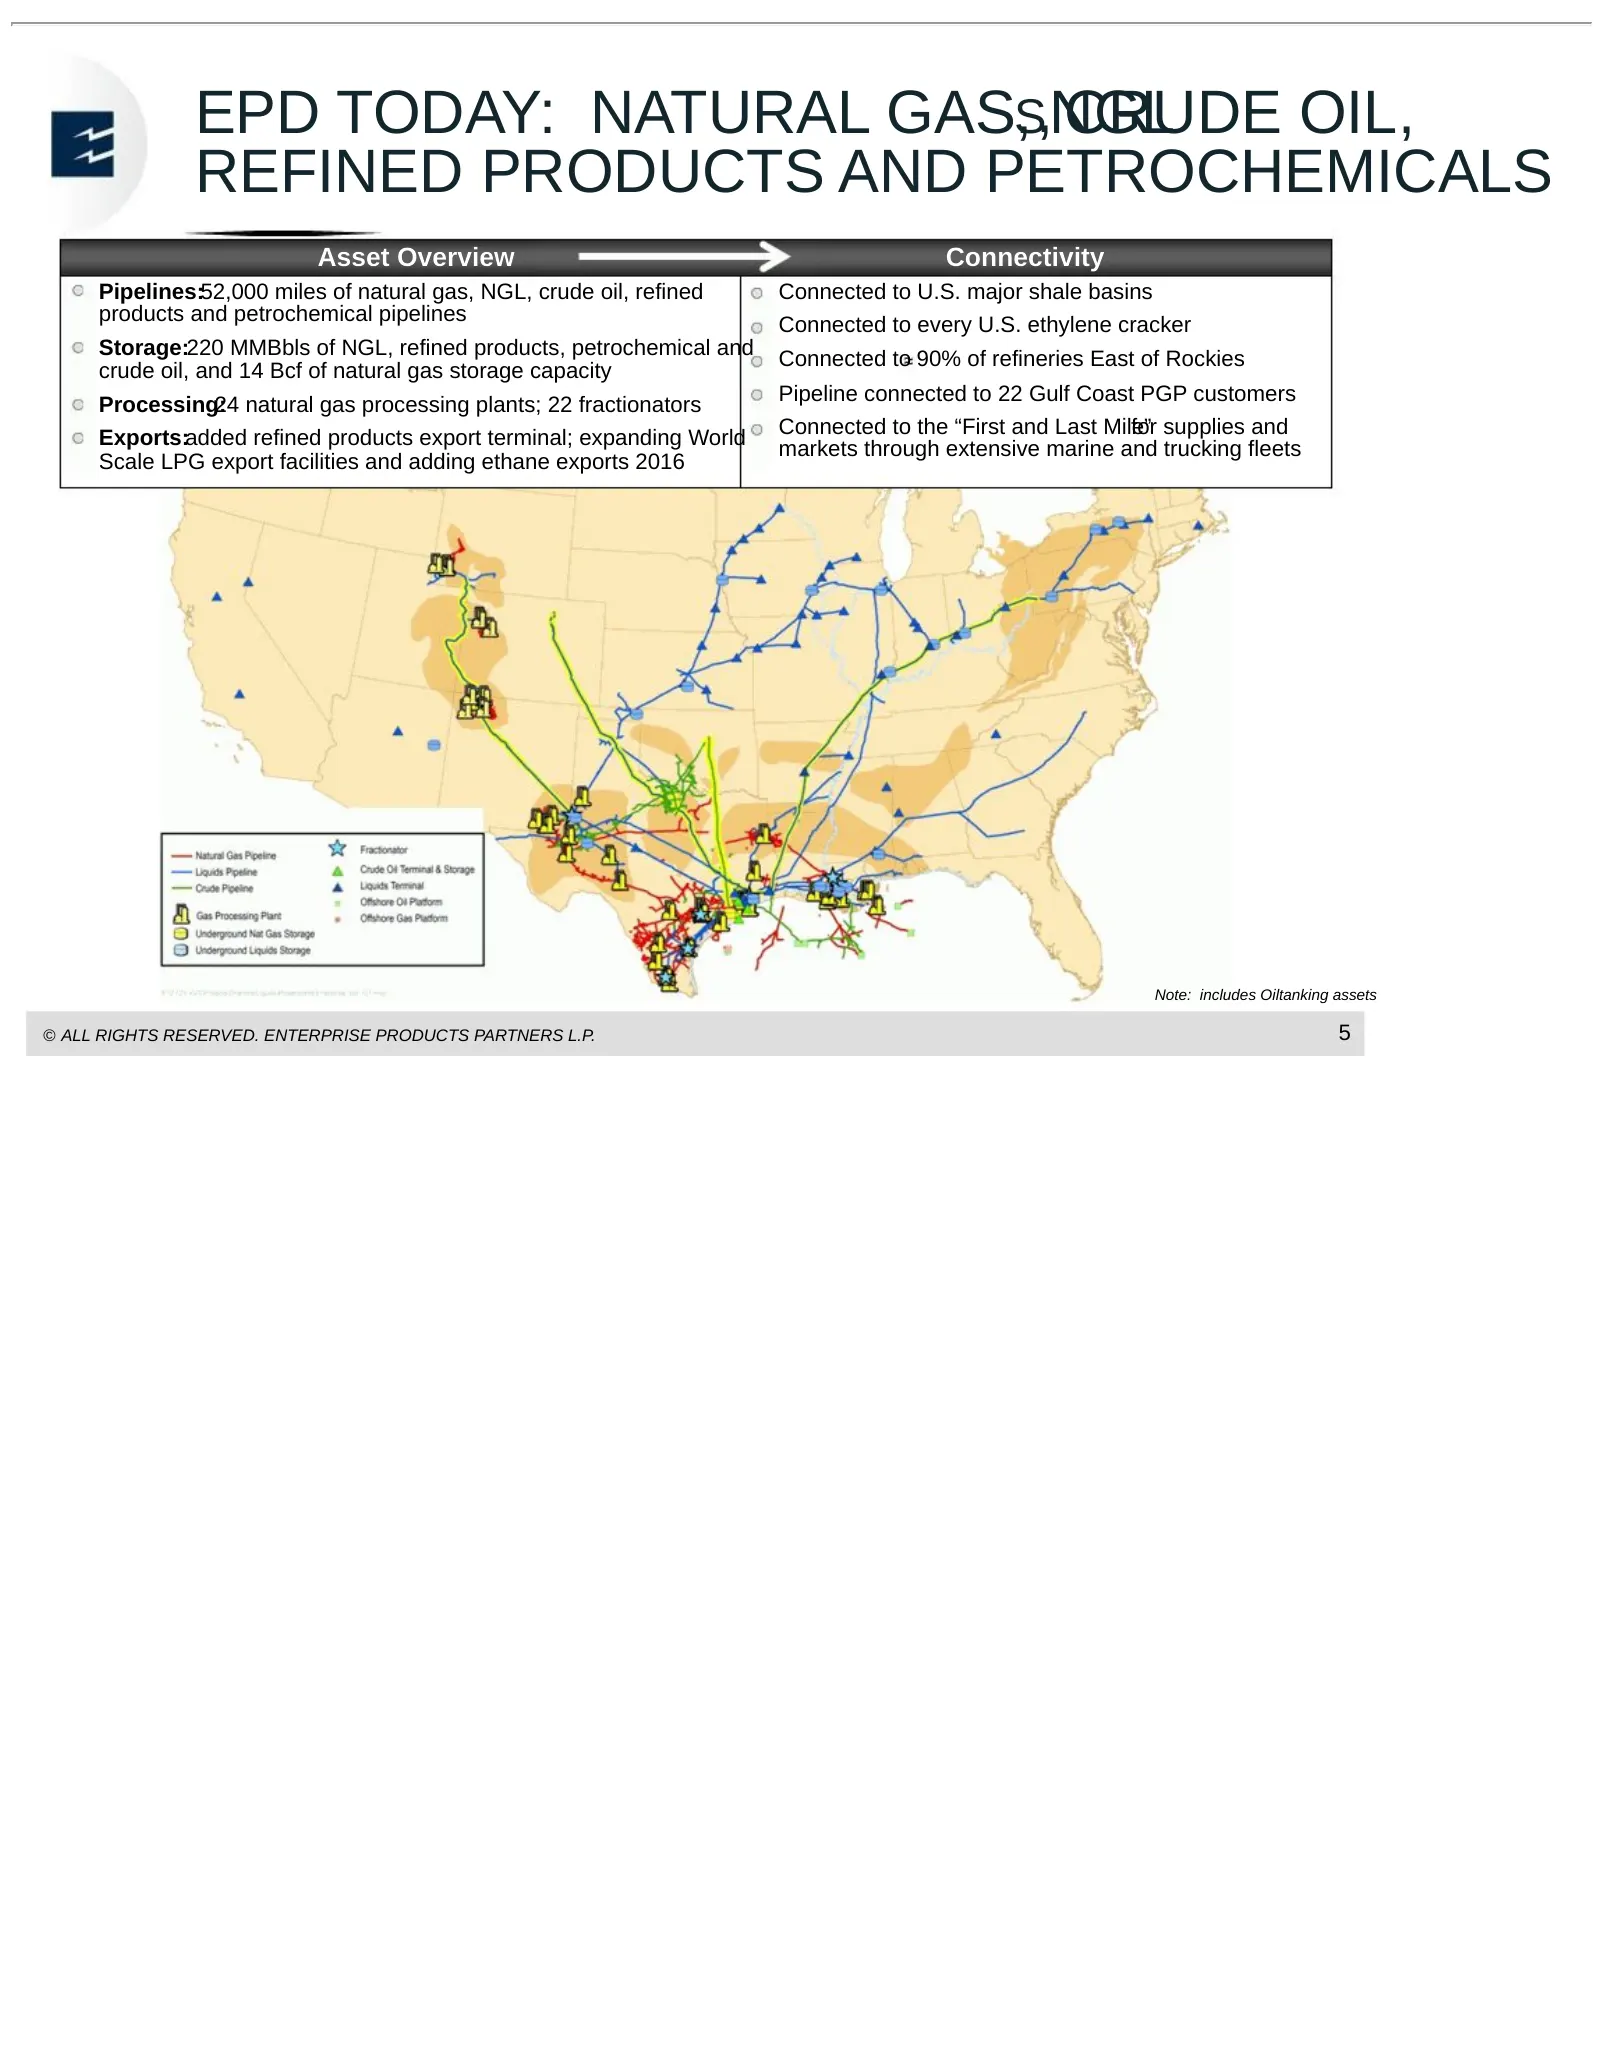
EPD TODAY: NATURAL GAS,S,NGL CRUDE OIL, REFINED PRODUCTS AND PETROCHEMICALS Asset Overview Connectivity Pipelines:52,000 miles of natural gas, NGL, crude oil, refined Connected to U.S. major shale basins products and petrochemical pipelines Connected to every U.S. ethylene cracker Storage:220 MMBbls
Slide 7: Geographic and Business Diversification Provide Multiple Earnings Streams
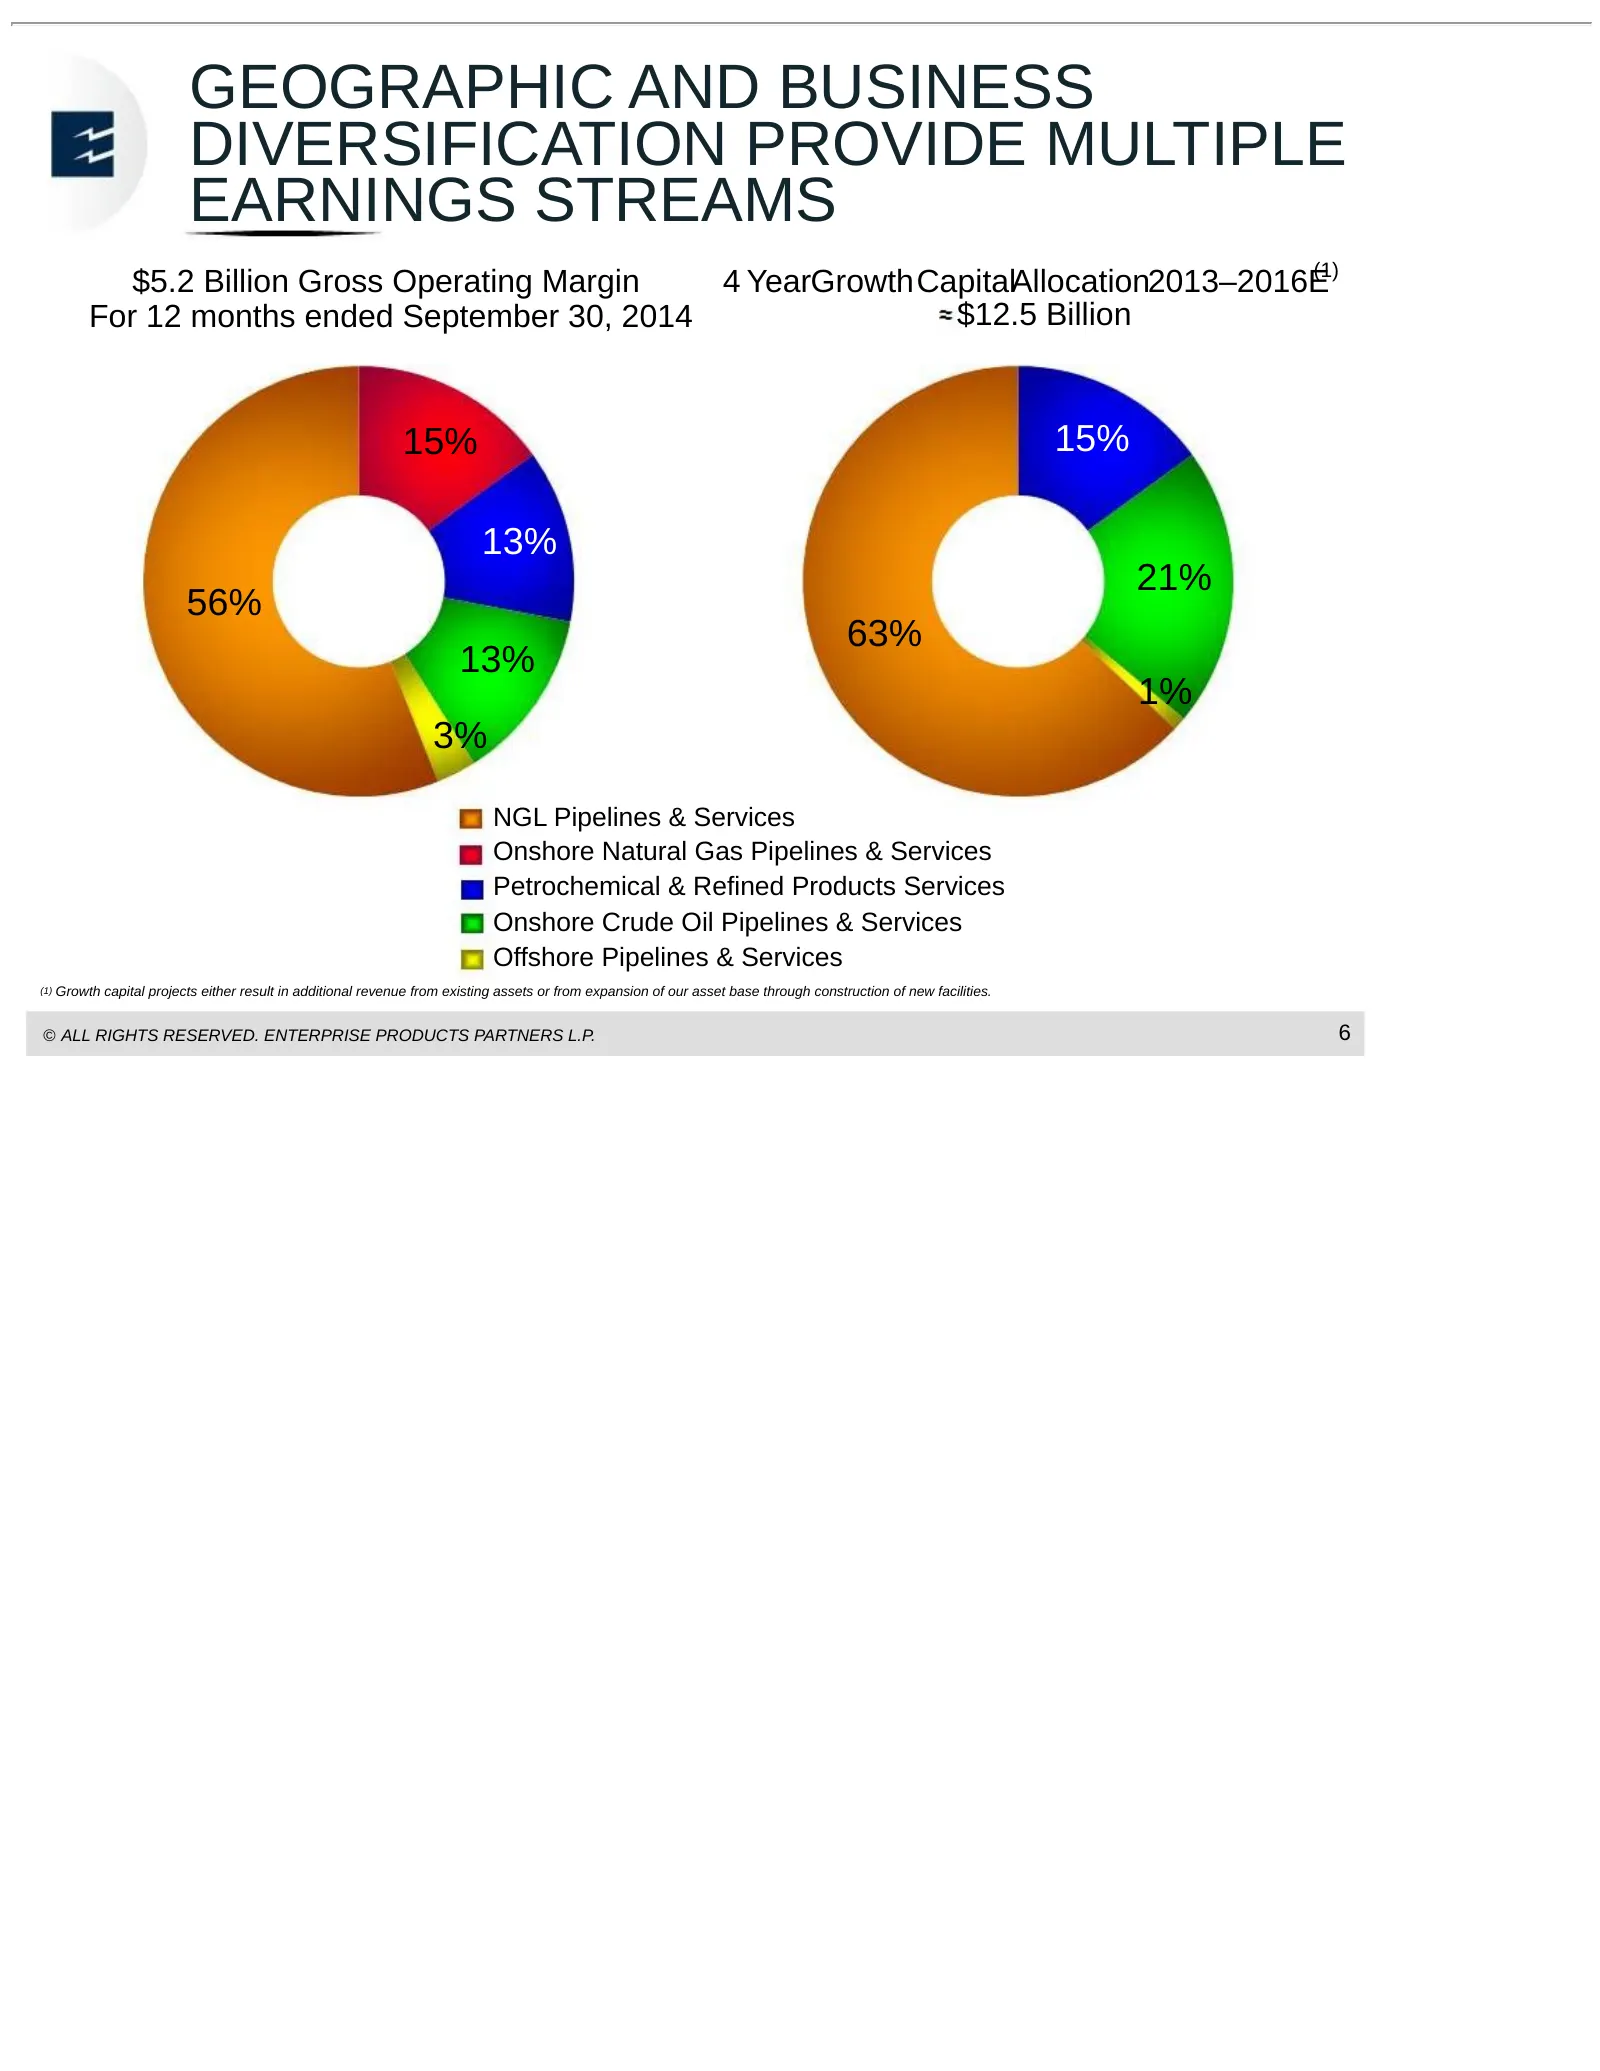
GEOGRAPHIC AND BUSINESS DIVERSIFICATION PROVIDE MULTIPLE EARNINGS STREAMS $5.2 Billion Gross Operating Margin 4 YearGrowthCapitalAllocation2013–2016E(1) For 12 months ended September 30, 2014 $12.5 Billion 15% 15% 13% 21% 56% 63% 13% 1% 3% NGL Pipelines & Services Onshore Natural Gas Pipelines & Ser
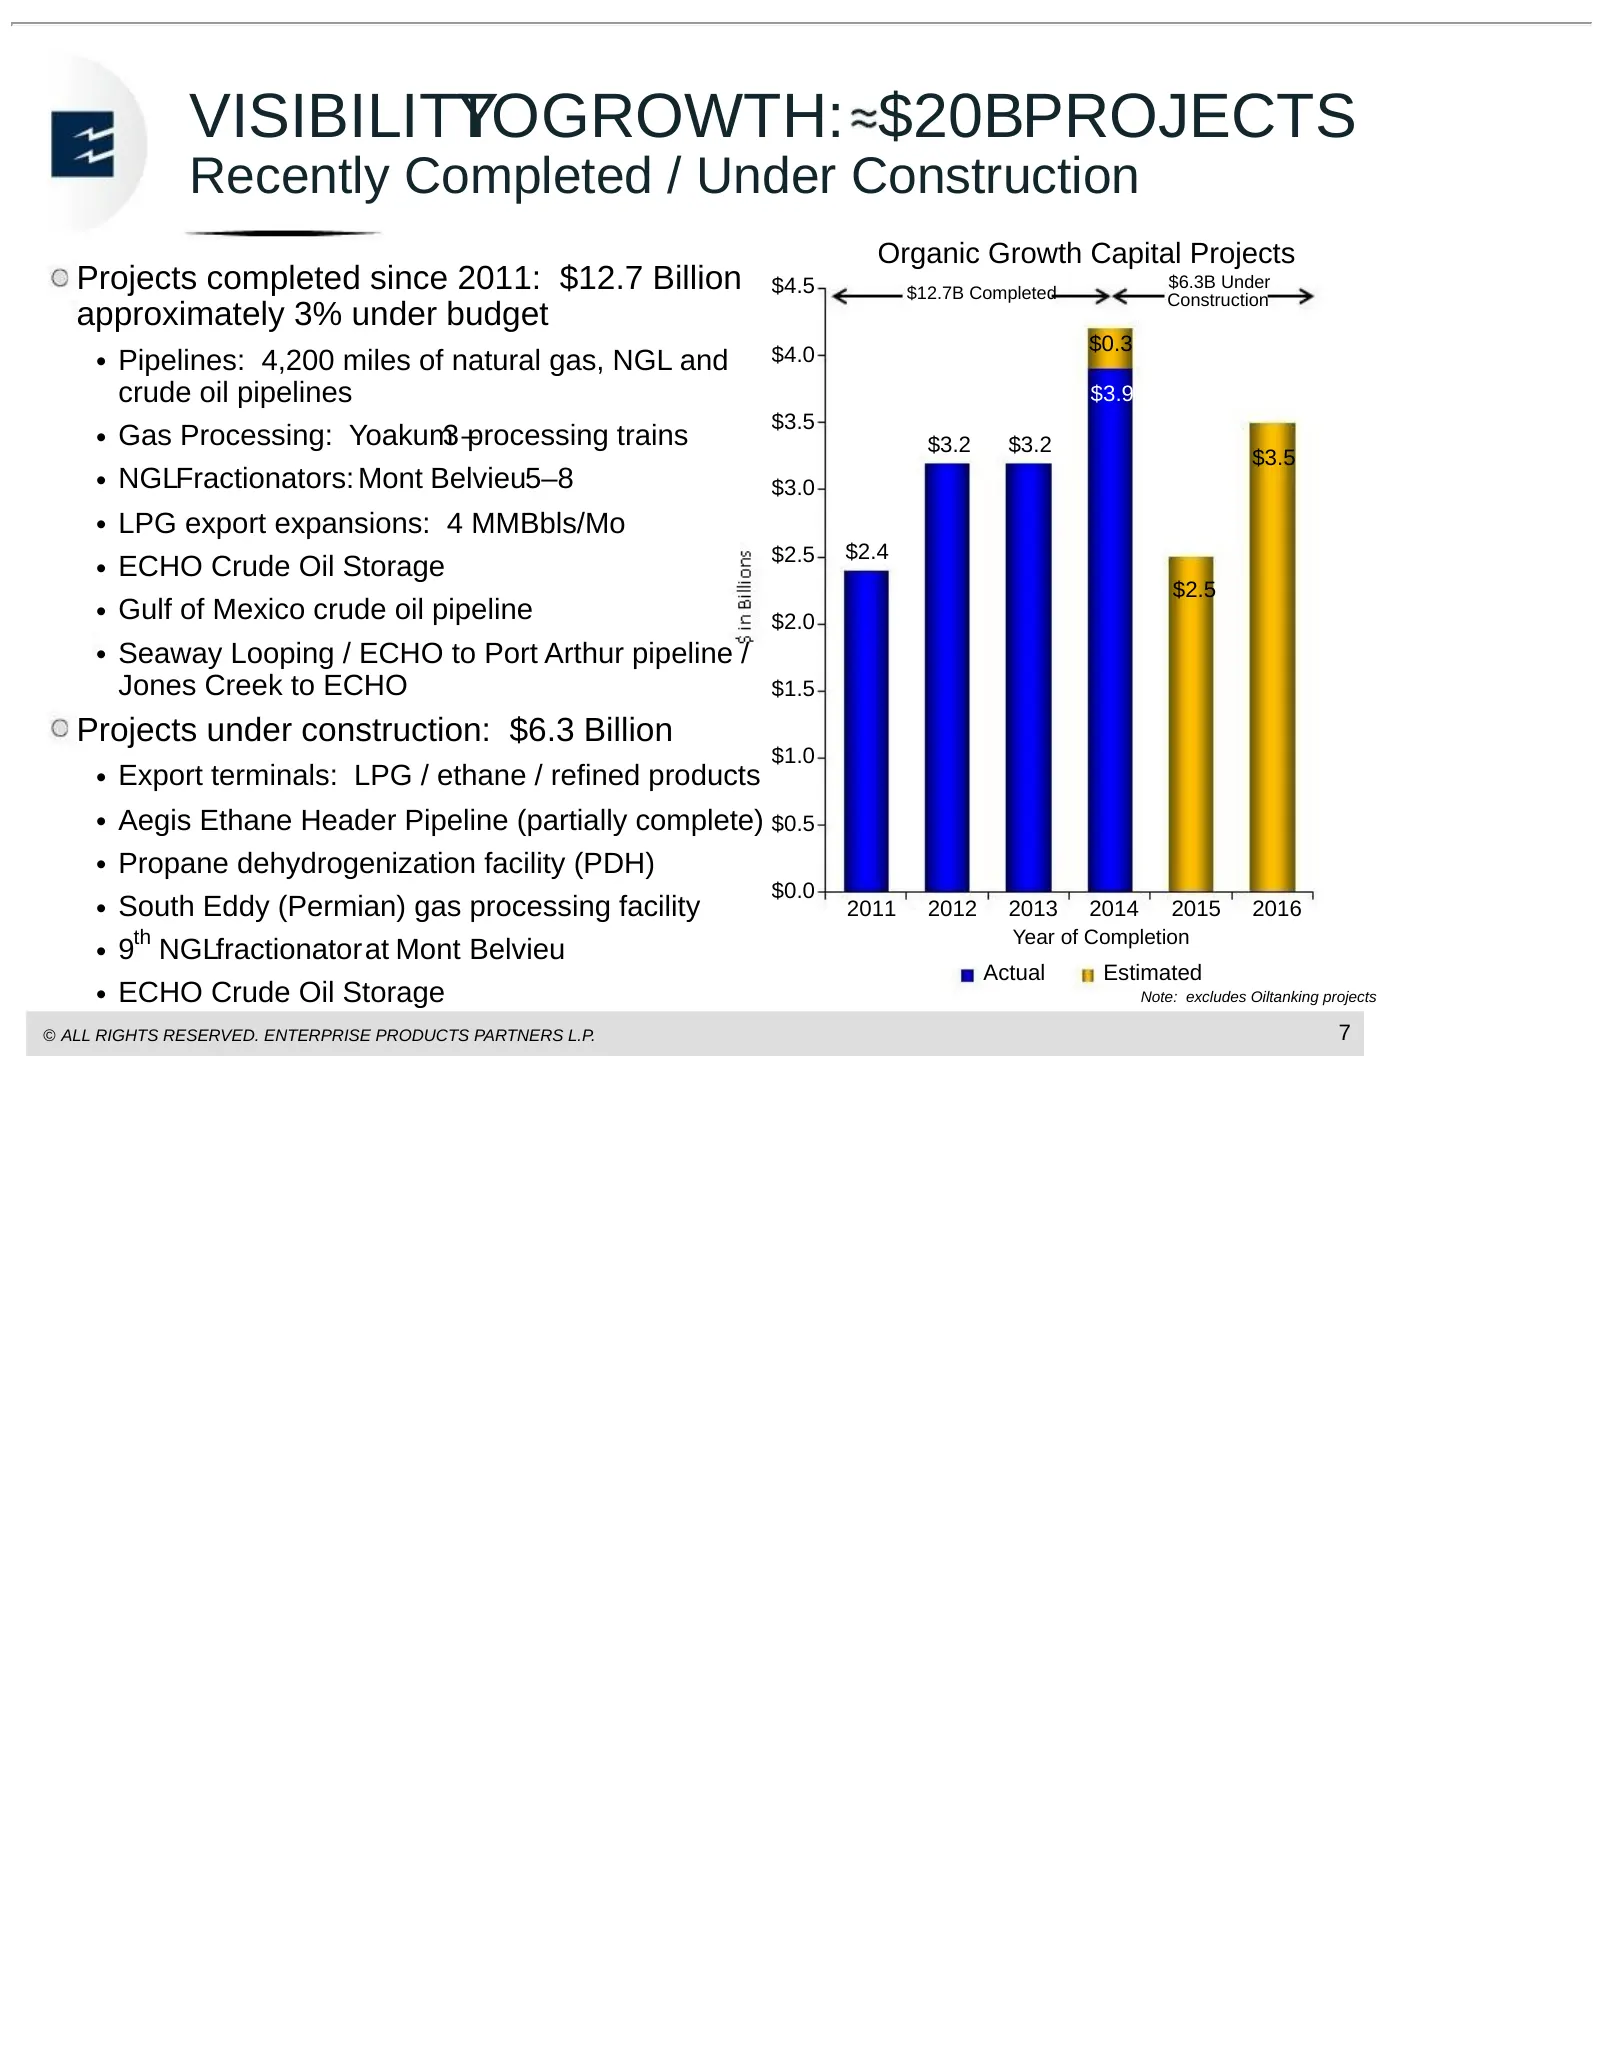
Slide 8: Visibility to Growth: $20B Projects
VISIBILITY TOGROWTH: $20BPROJECTS Recently Completed / Under Construction Organic Growth Capital Projects Projects completed since 2011: $12.7 Billion $4.5 $12.7B Completed $6.3B Under Construction approximately 3% under budget $4.0 $0.3 • Pipelines: 4,200 miles of natural gas, NGL and crude oil pip
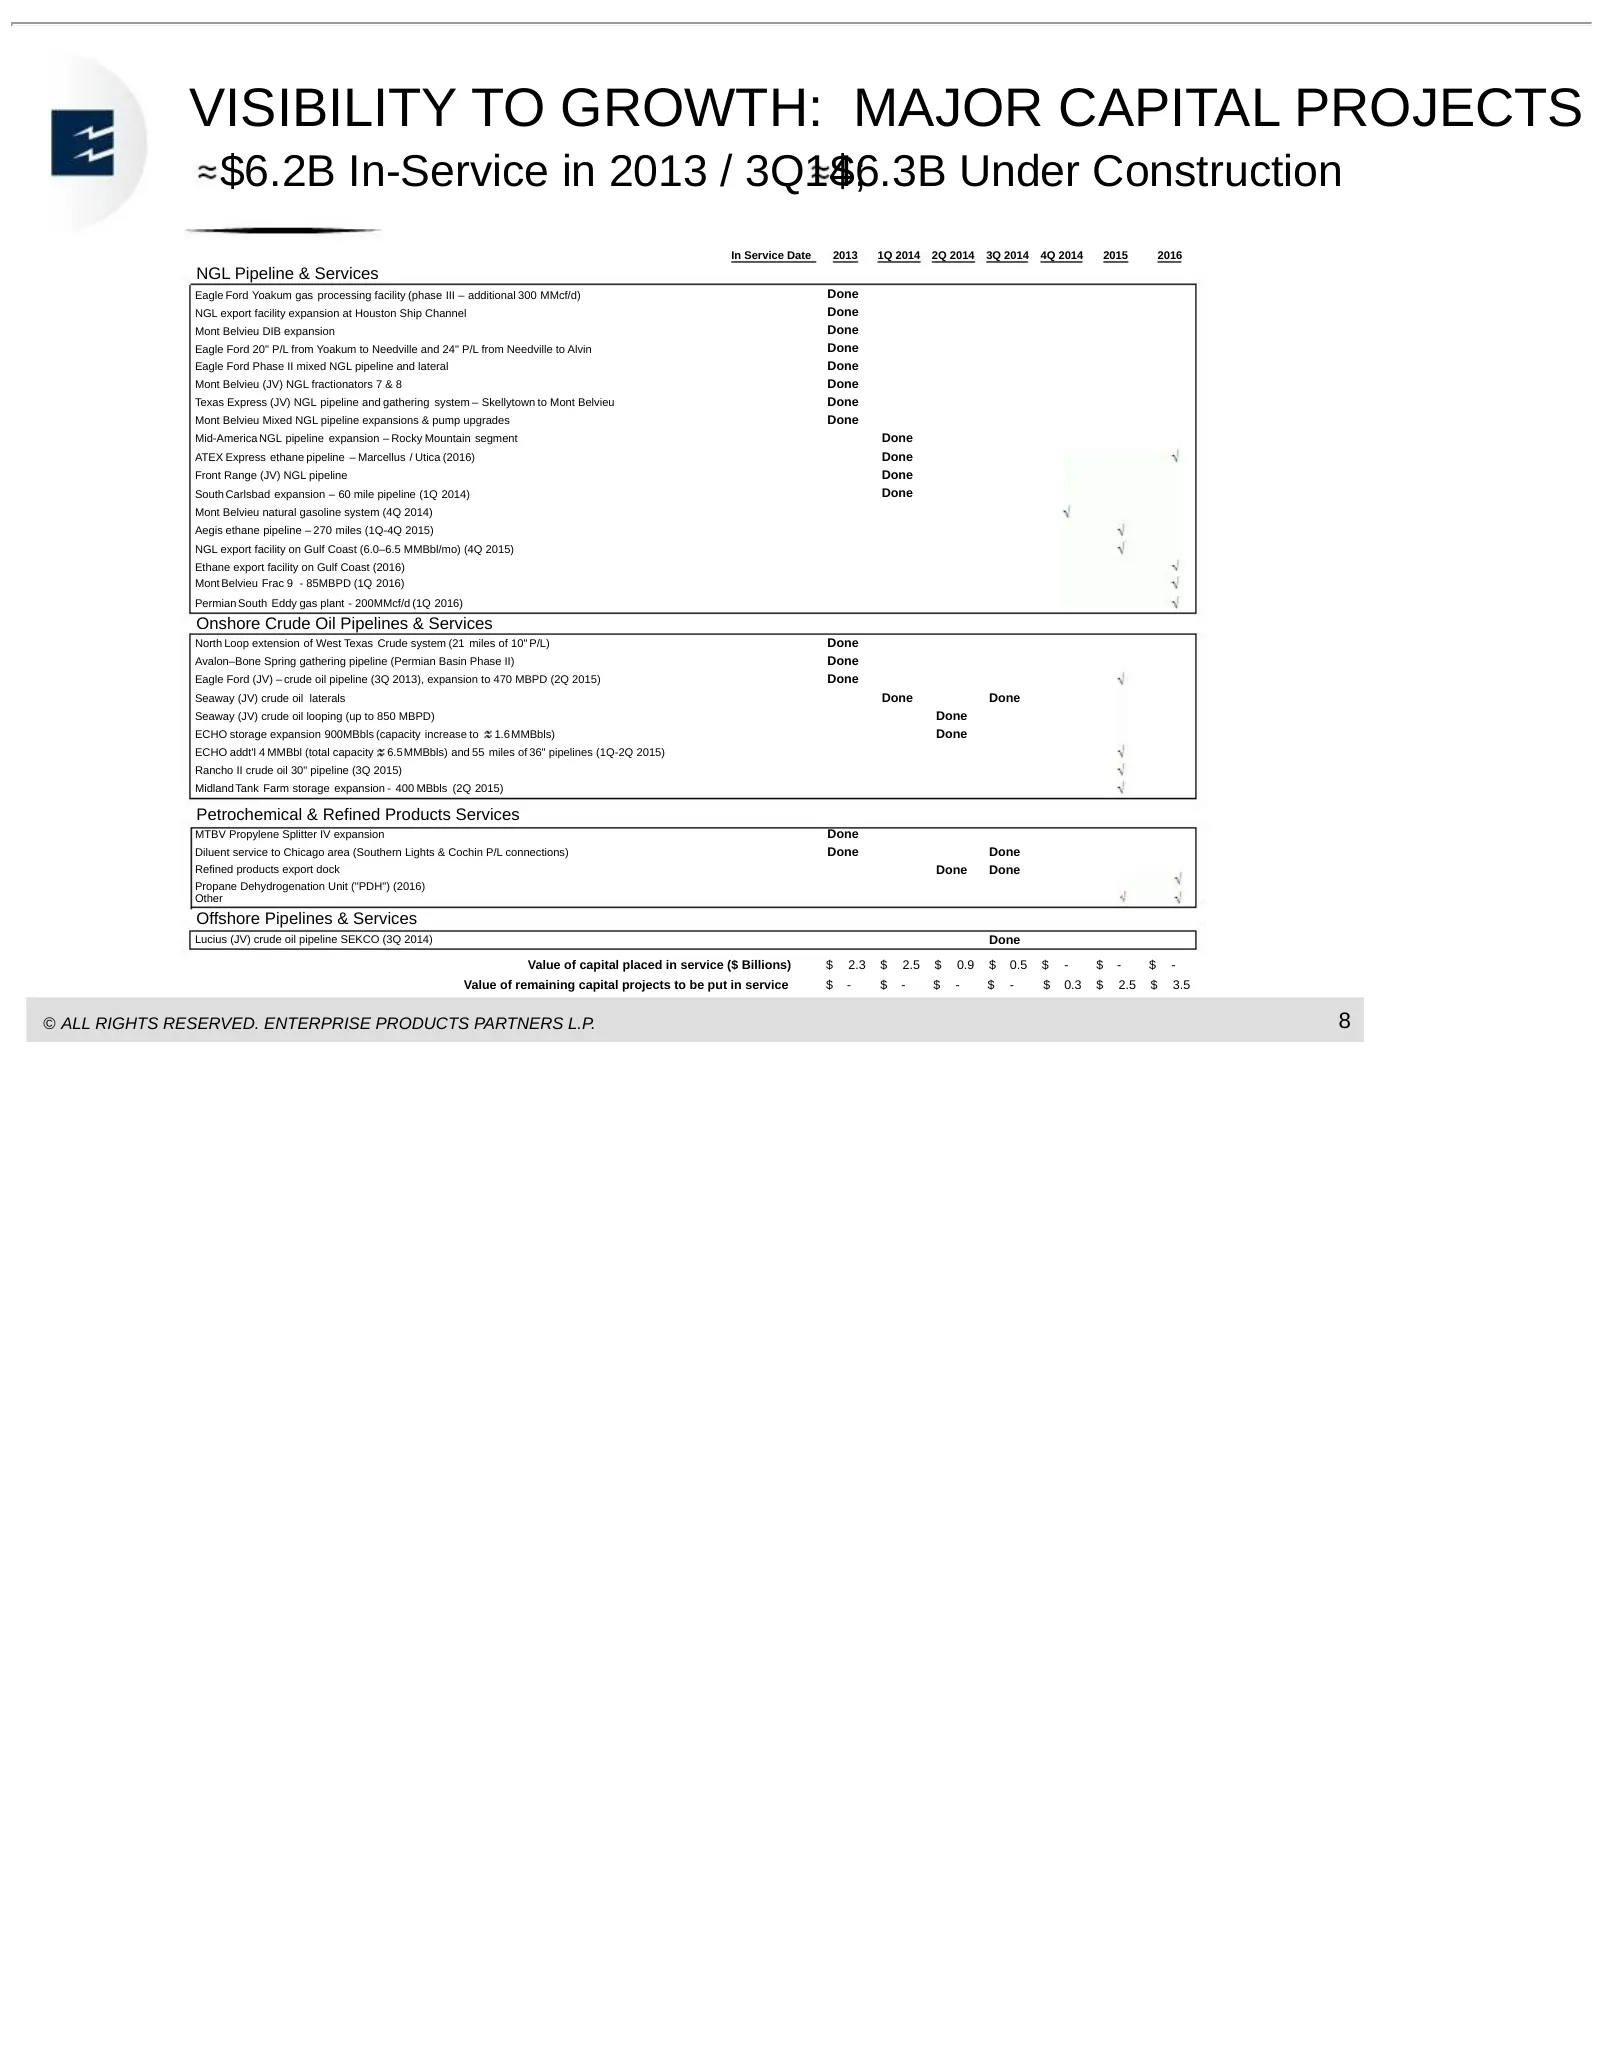
Slide 9: Visibility to Growth: Major Capital Projects
VISIBILITY TO GROWTH: MAJOR CAPITAL PROJECTS $6.2B In-Service in 2013 / 3Q14; $6.3B Under Construction In Service Date 2013 1Q 2014 2Q 2014 3Q 2014 4Q 2014 2015 2016 NGL Pipeline & Services Eagle Ford Yoakum gas processing facility (phase III – additional 300 MMcf/d) Done NGL export facility expansi
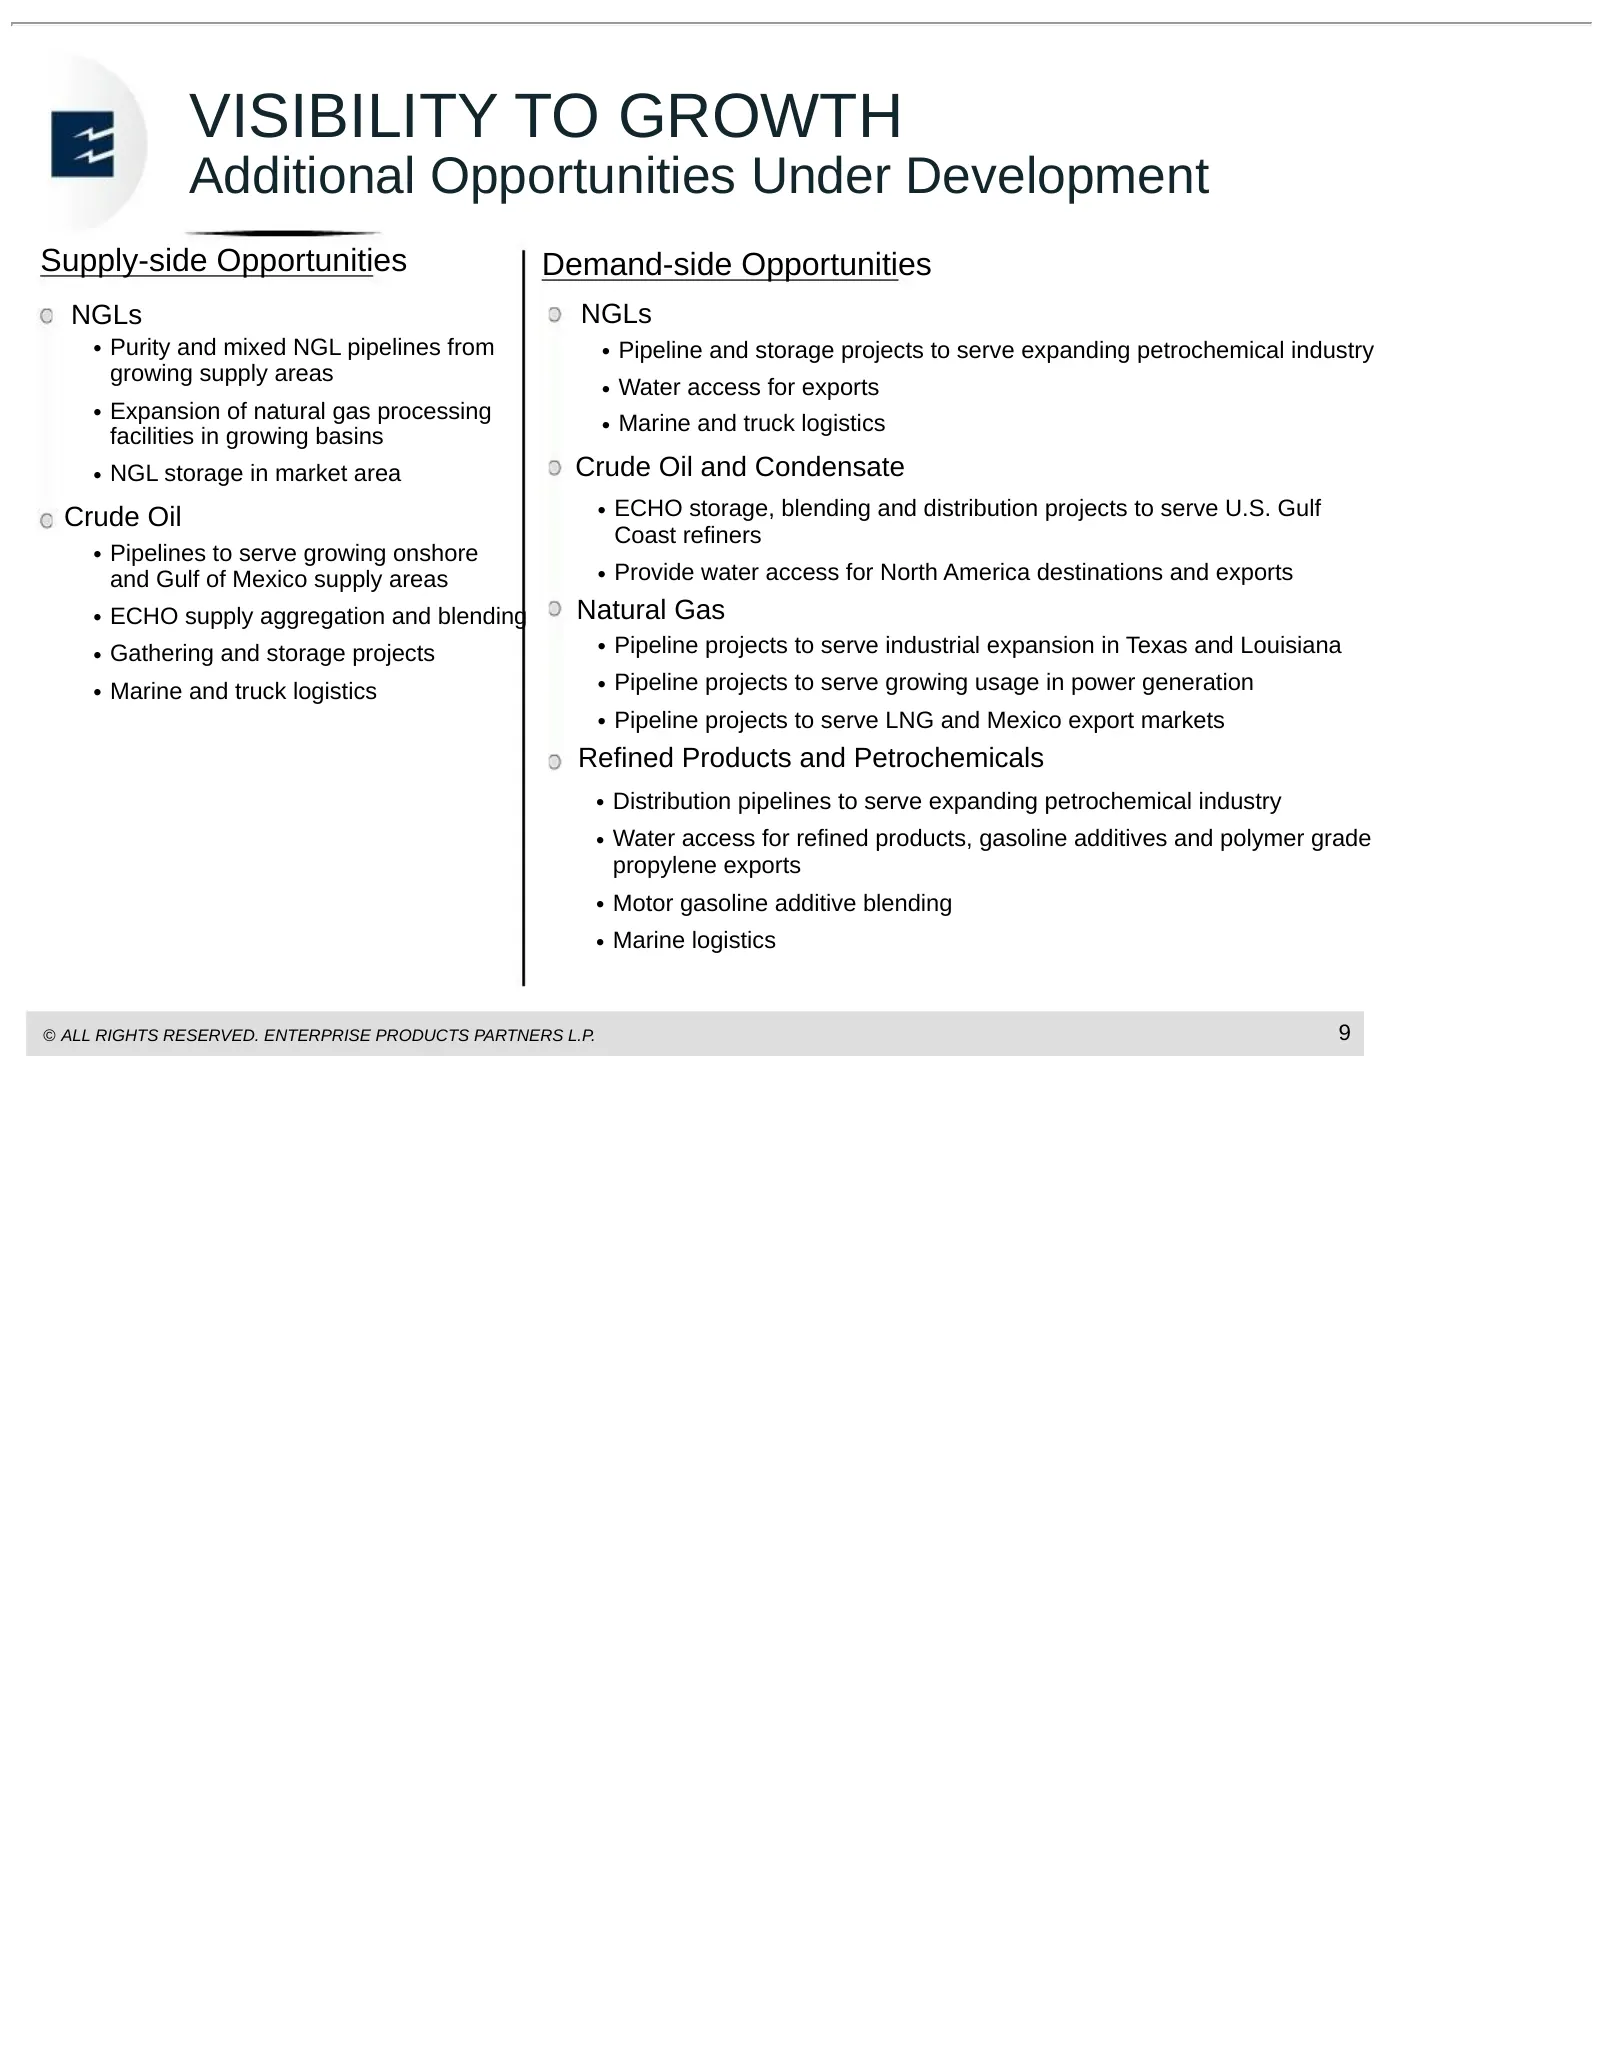
Slide 10: Visibility to Growth
VISIBILITY TO GROWTH Additional Opportunities Under Development Supply-side Opportunities Demand-side Opportunities NGLs NGLs • Purity and mixed NGL pipelines from • Pipeline and storage projects to serve expanding petrochemical industry growing supply areas • Water access for exports • Expansion of
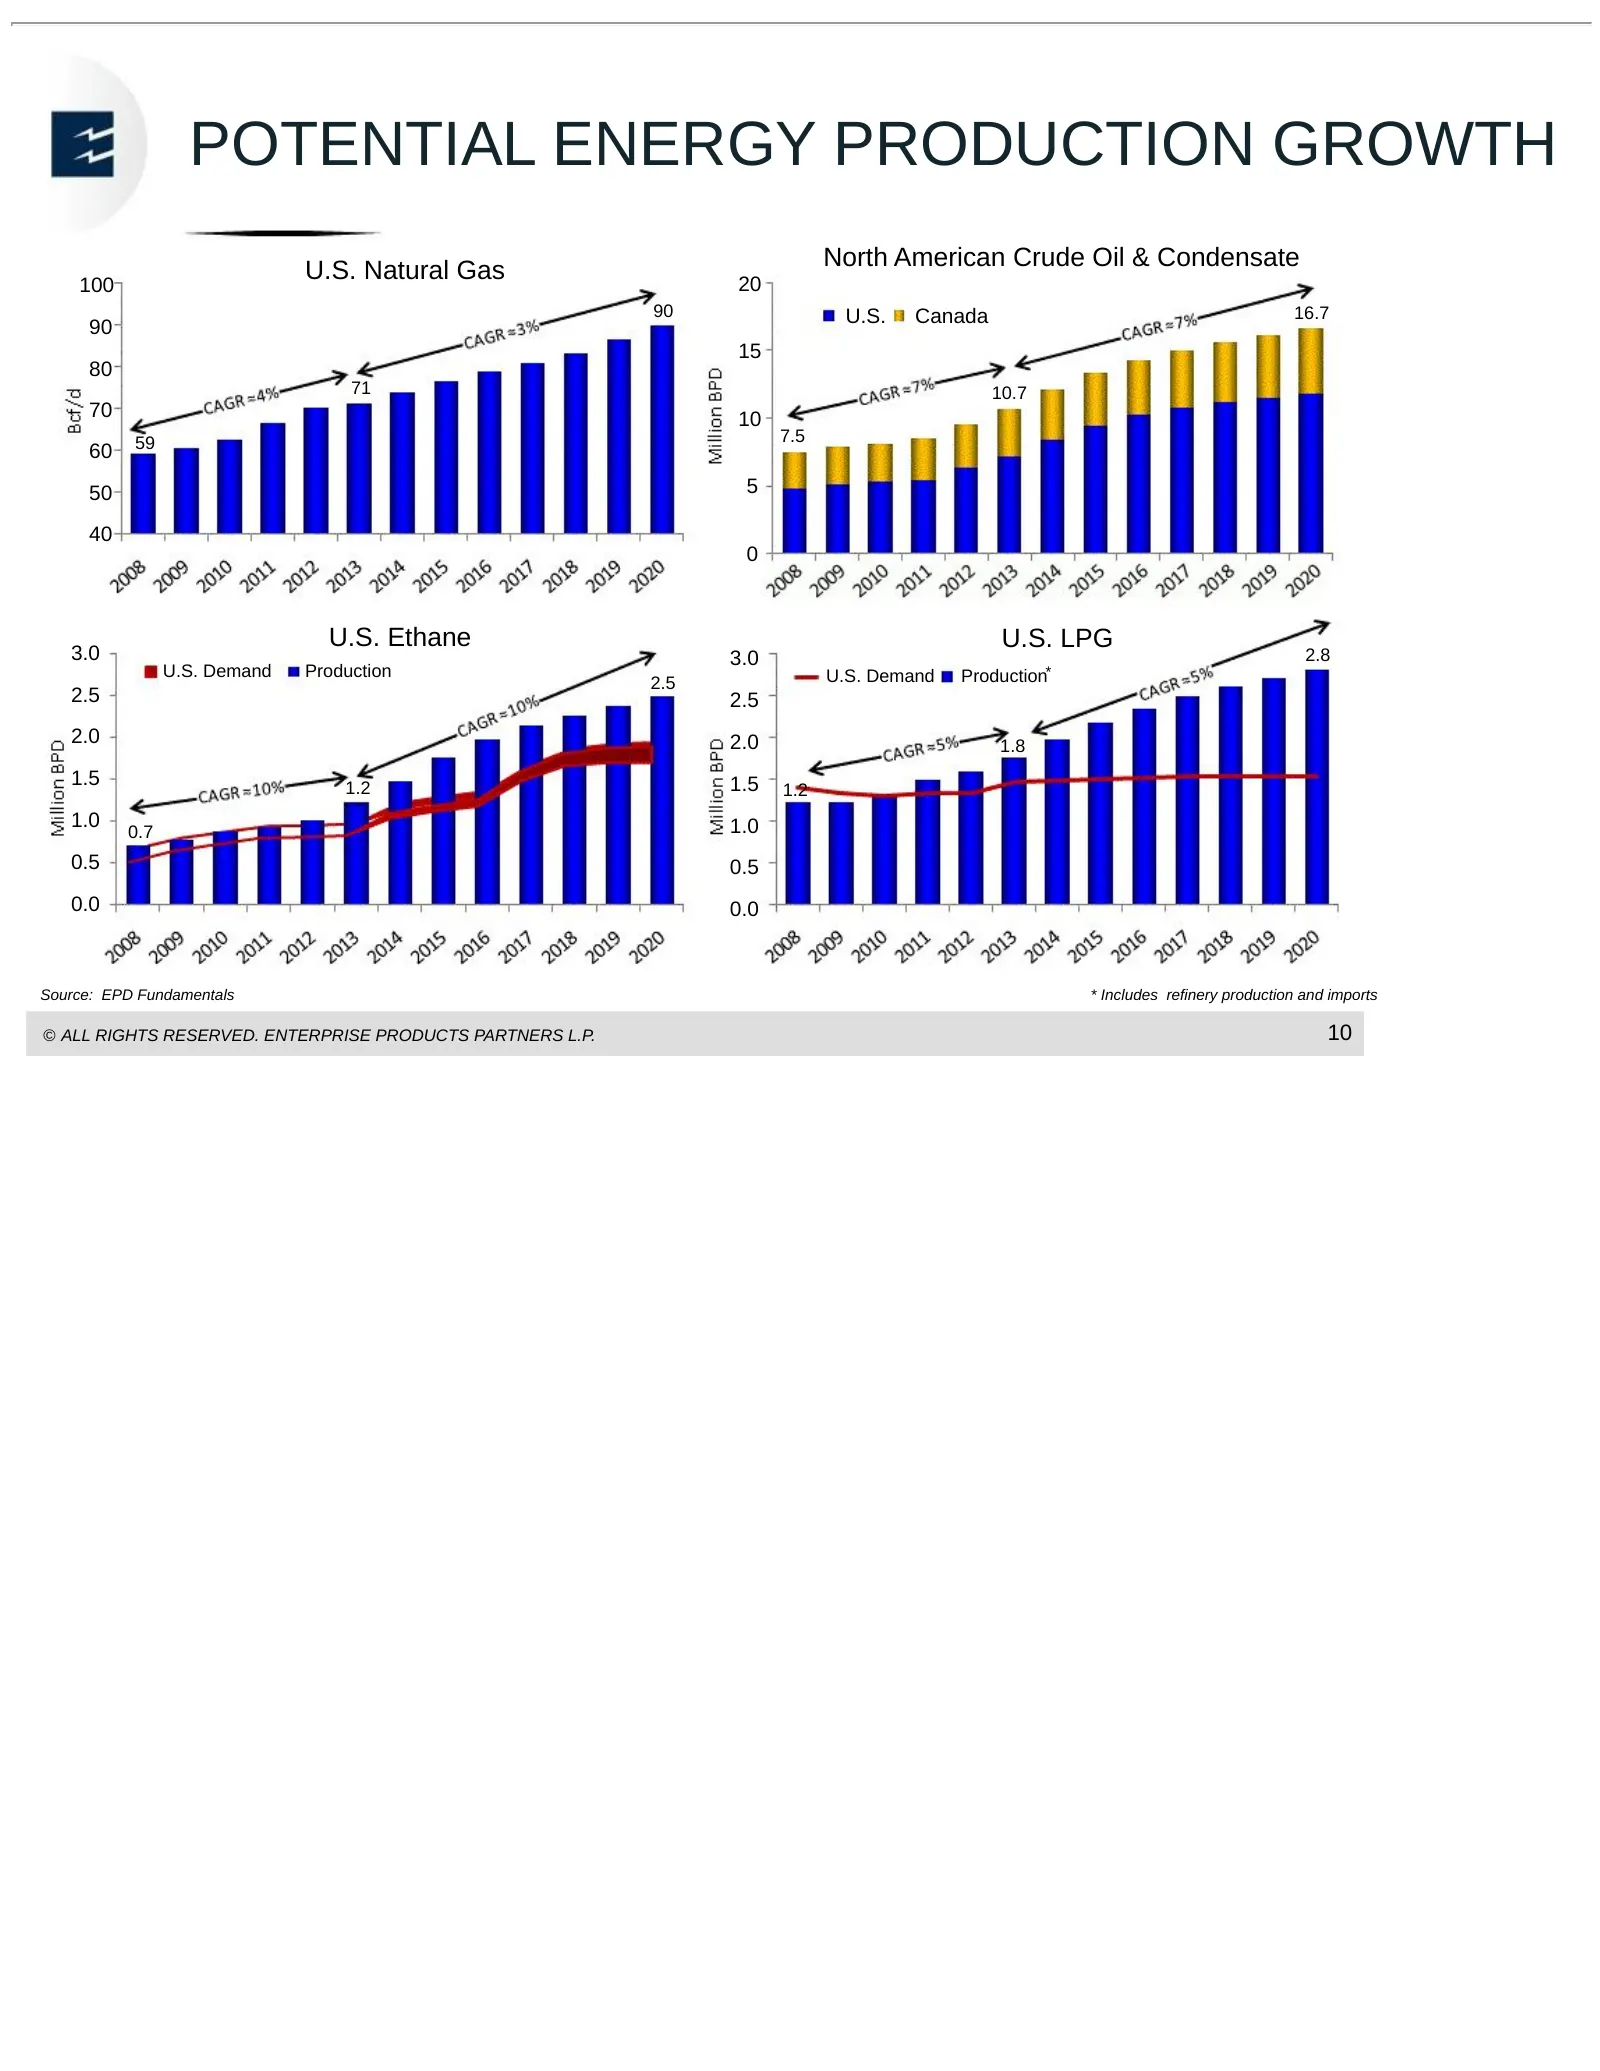
Slide 11: Potential Energy Production Growth
POTENTIAL ENERGY PRODUCTION GROWTH North American Crude Oil & Condensate 100 U.S. Natural Gas 20 90 U.S. Canada 16.7 90 15 80 71 10.7 70 10 59 7.5 60 50 5 40 0 U.S. Ethane U.S. LPG 3.0 3.0 2.8 U.S. Demand Production U.S. Demand Production* 2.5 2.5 2.5 2.0 2.0 1.8 1.5 1.2 1.5 1.2 1.0 1.0 0.7 0.5 0.5
Slide 12: Projects Overview
PROJECTS OVERVIEW © ALL RIGHTS RESERVED. ENTERPRISE PRODUCTS PARTNERS L.P. enterpriseproducts.com
Slide 13: Major NGL Capital Growth Projects
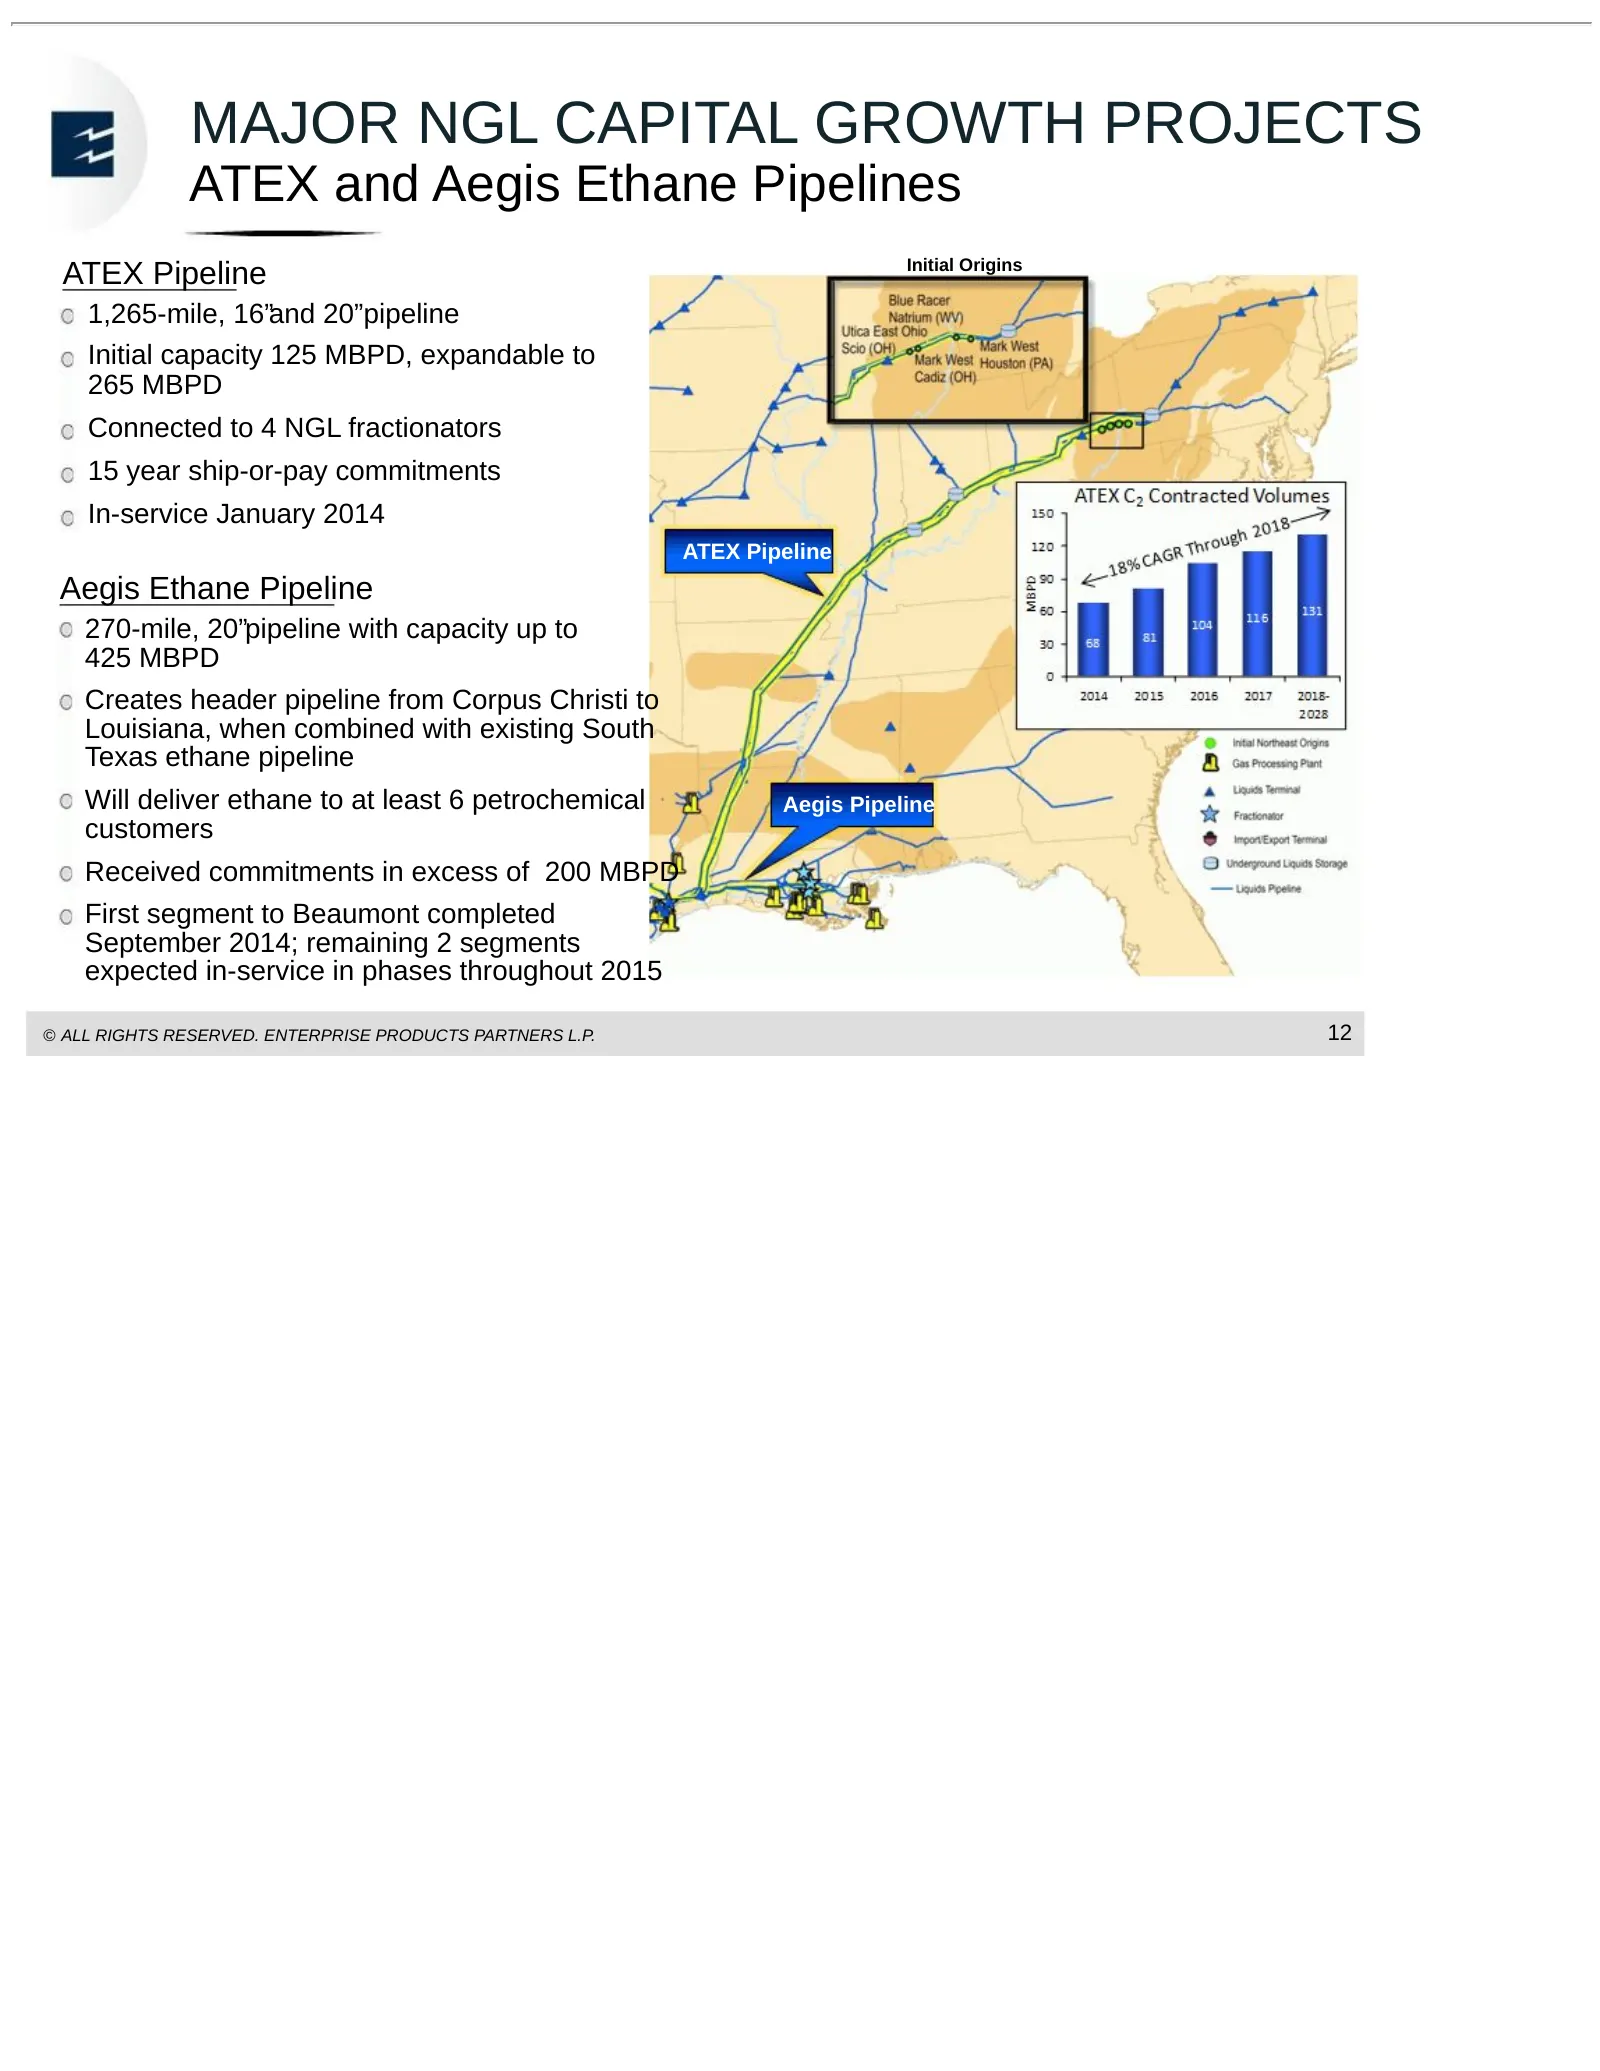
MAJOR NGL CAPITAL GROWTH PROJECTS ATEX and Aegis Ethane Pipelines ATEX Pipeline Initial Origins 1,265-mile, 16”and 20”pipeline Initial capacity 125 MBPD, expandable to 265 MBPD Connected to 4 NGL fractionators 15 year ship-or-pay commitments In-service January 2014 ATEX Pipeline Aegis Ethane Pipelin
Slide 14: EPD PDH Facility Update
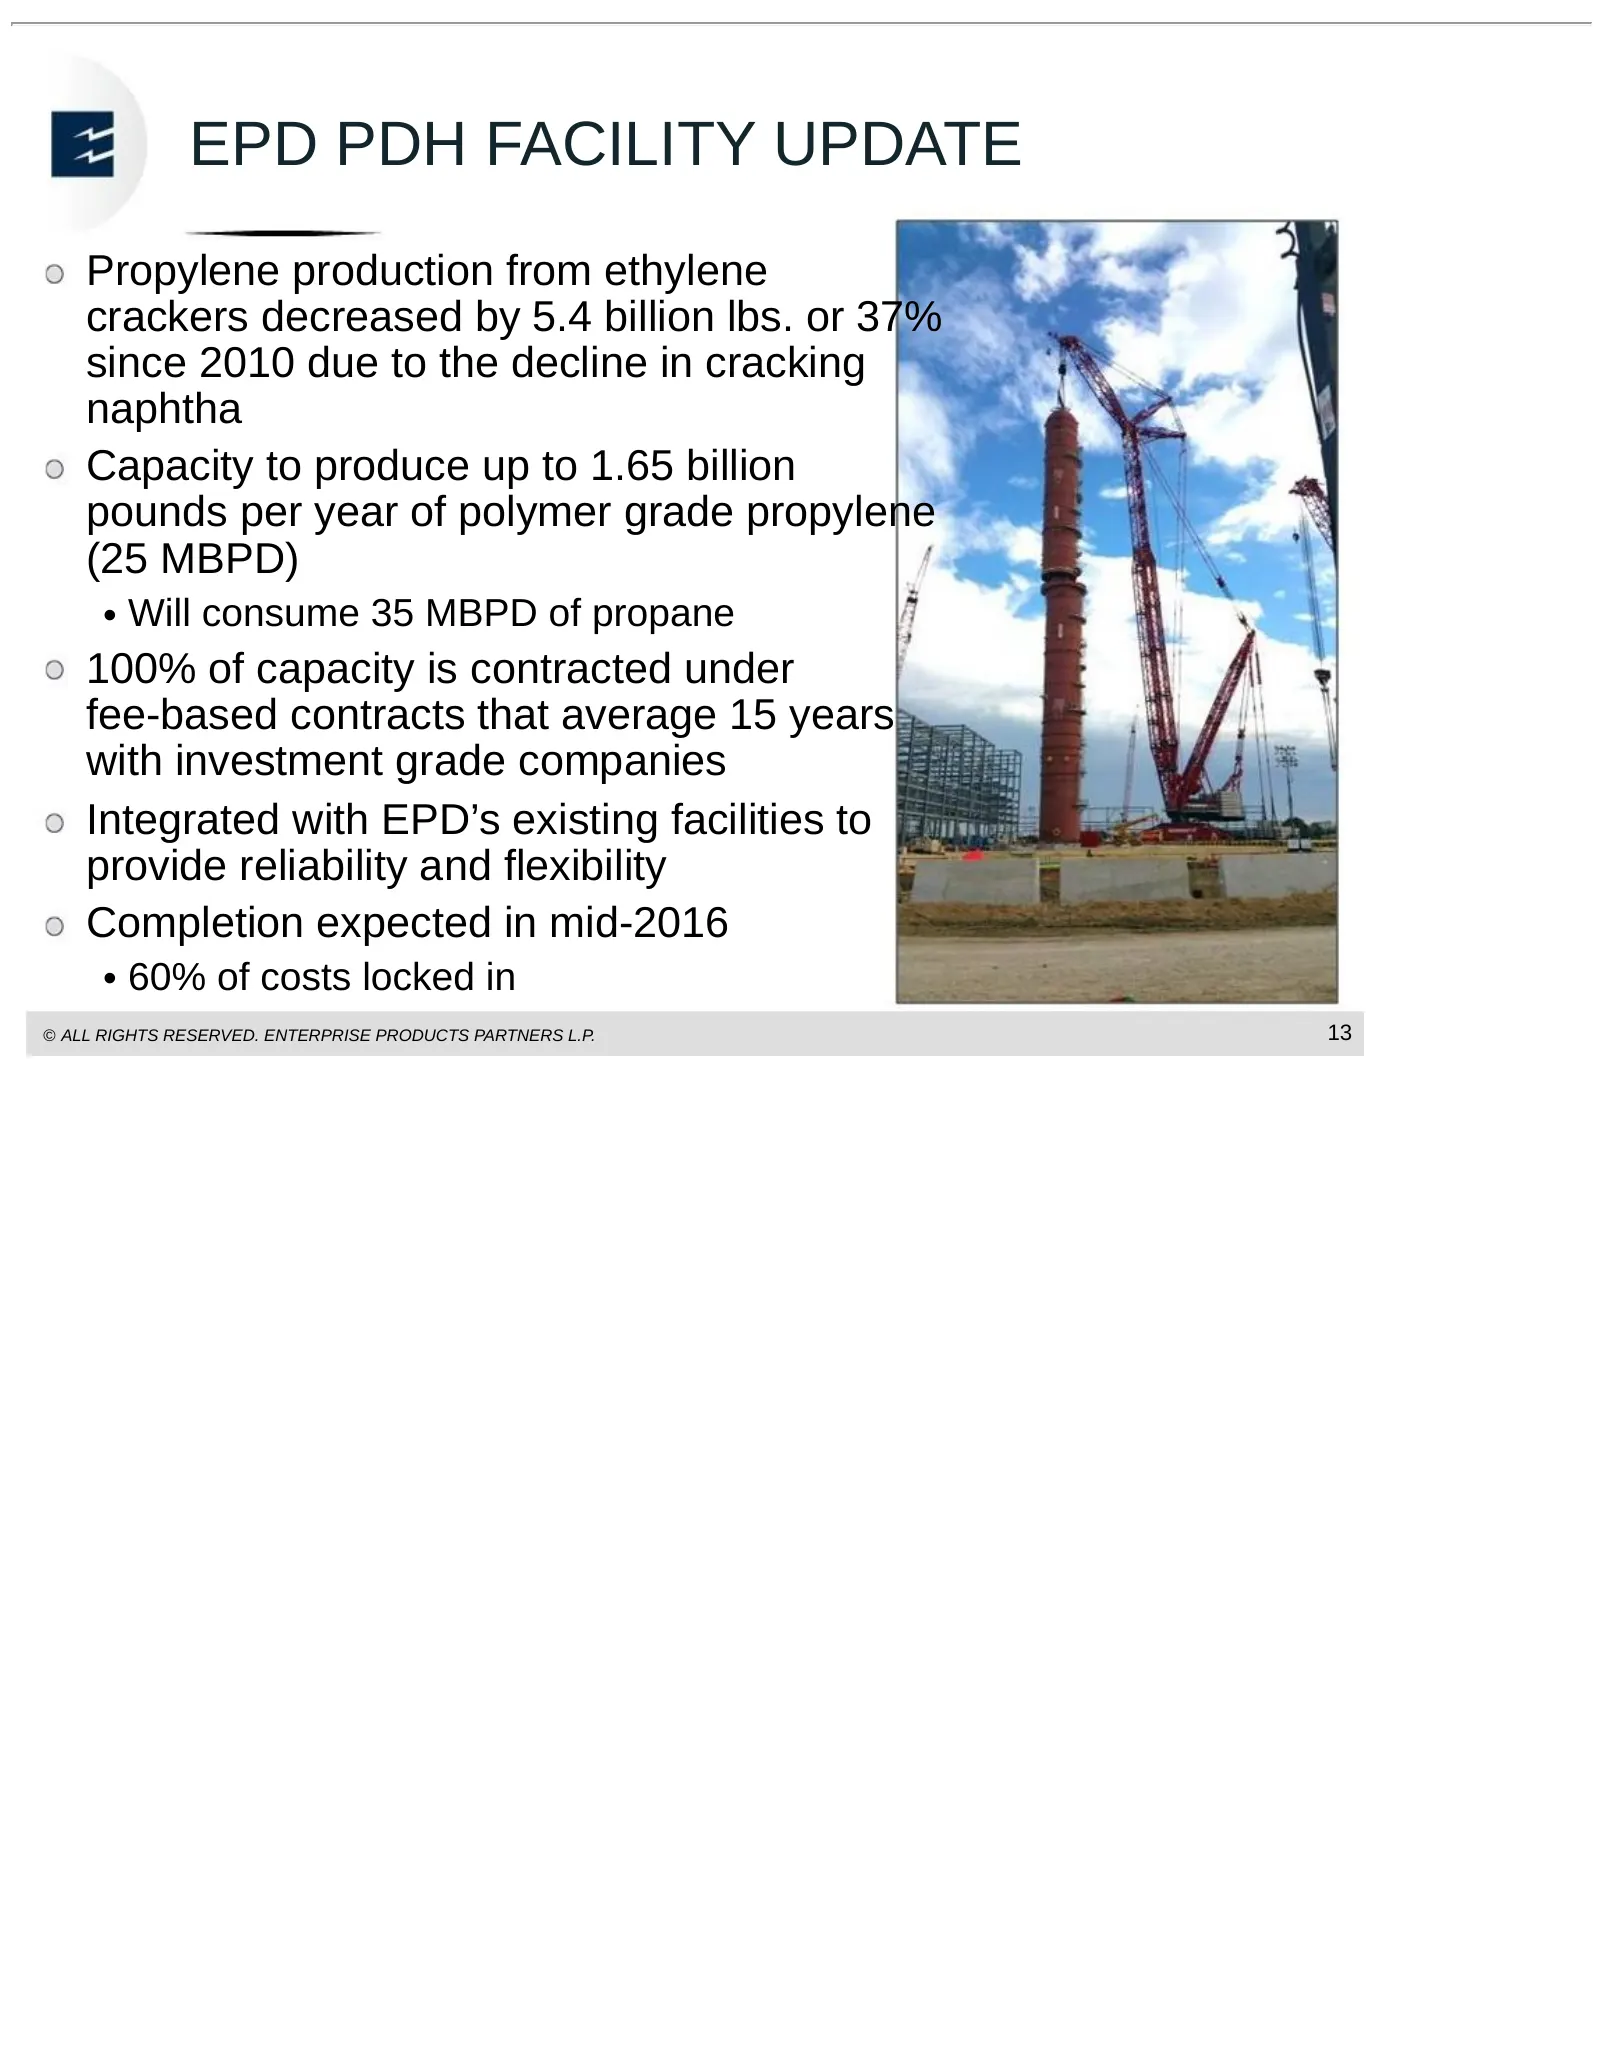
EPD PDH FACILITY UPDATE Propylene production from ethylene crackers decreased by 5.4 billion lbs. or 37% since 2010 due to the decline in cracking naphtha Capacity to produce up to 1.65 billion pounds per year of polymer grade propylene (25 MBPD) • Will consume 35 MBPD of propane 100% of capacity is
Slide 15: Export Capacity: Linking U.S. Supplies to Growing Global Demand
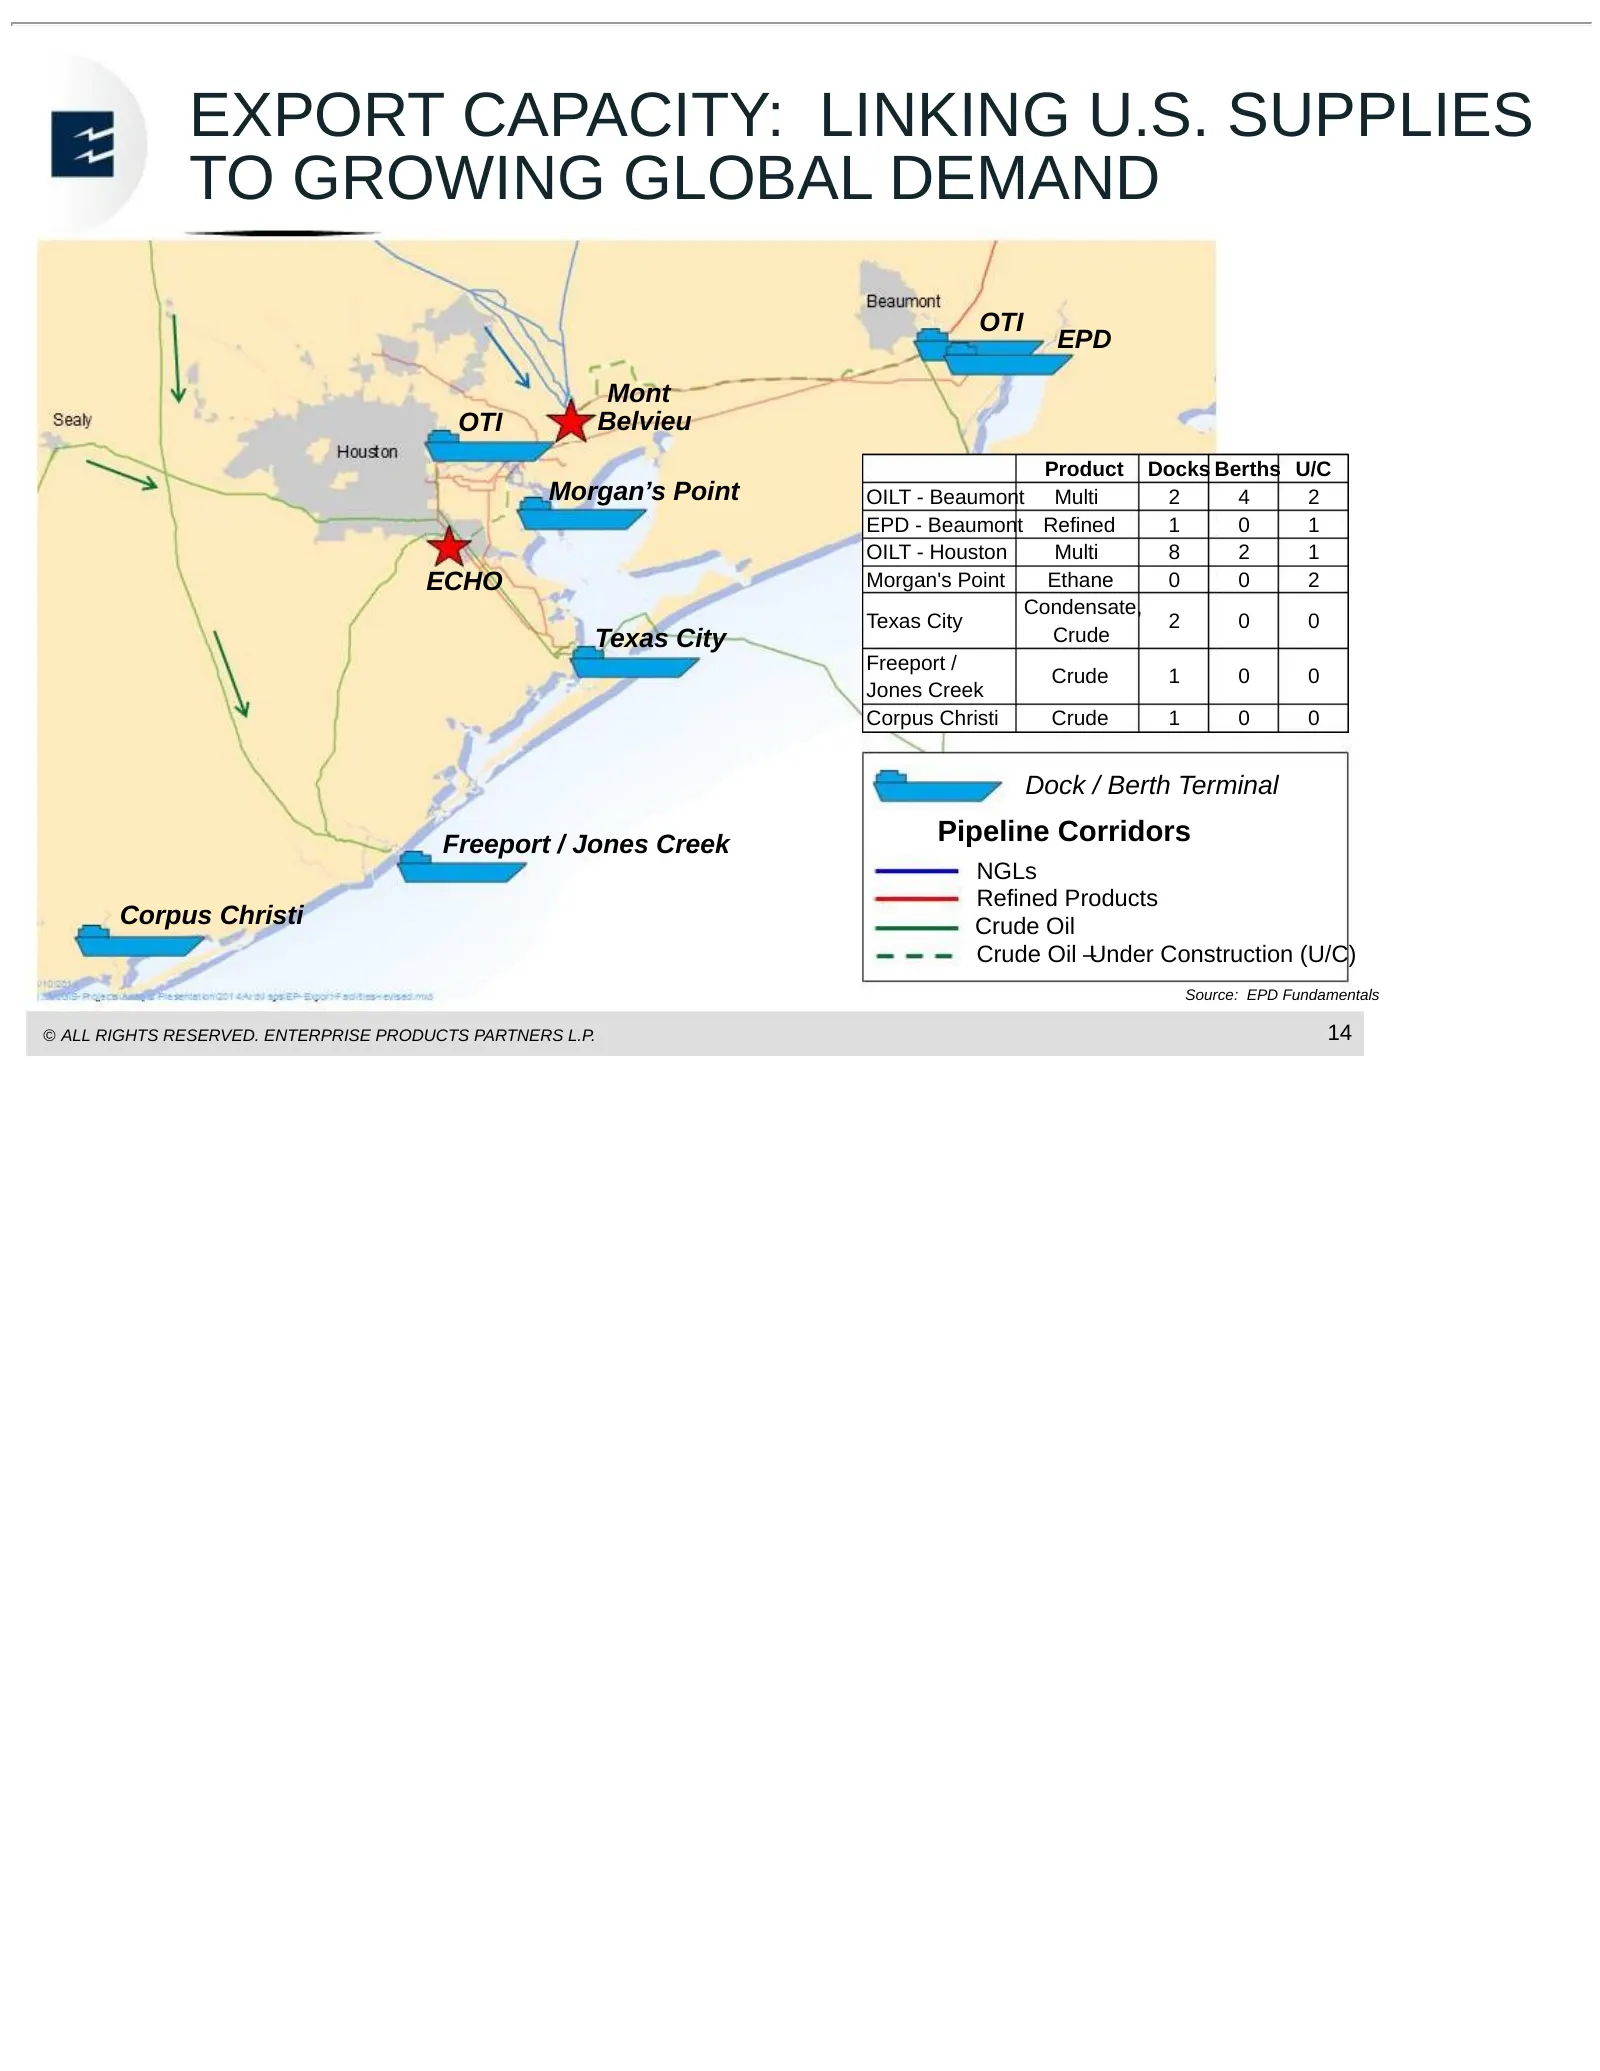
EXPORT CAPACITY: LINKING U.S. SUPPLIES TO GROWING GLOBAL DEMAND OTI EPD Mont OTI Belvieu Product Docks Berths U/C Morgan’s Point OILT - Beaumont Multi 2 4 2 EPD - Beaumont Refined 1 0 1 OILT - Houston Multi 8 2 1 ECHO Morgan's Point Ethane 0 0 2 Condensate, Texas City 2 0 0 Texas City Crude Freeport
Slide 16: U.S. Becomes Largest Exporter of Propane
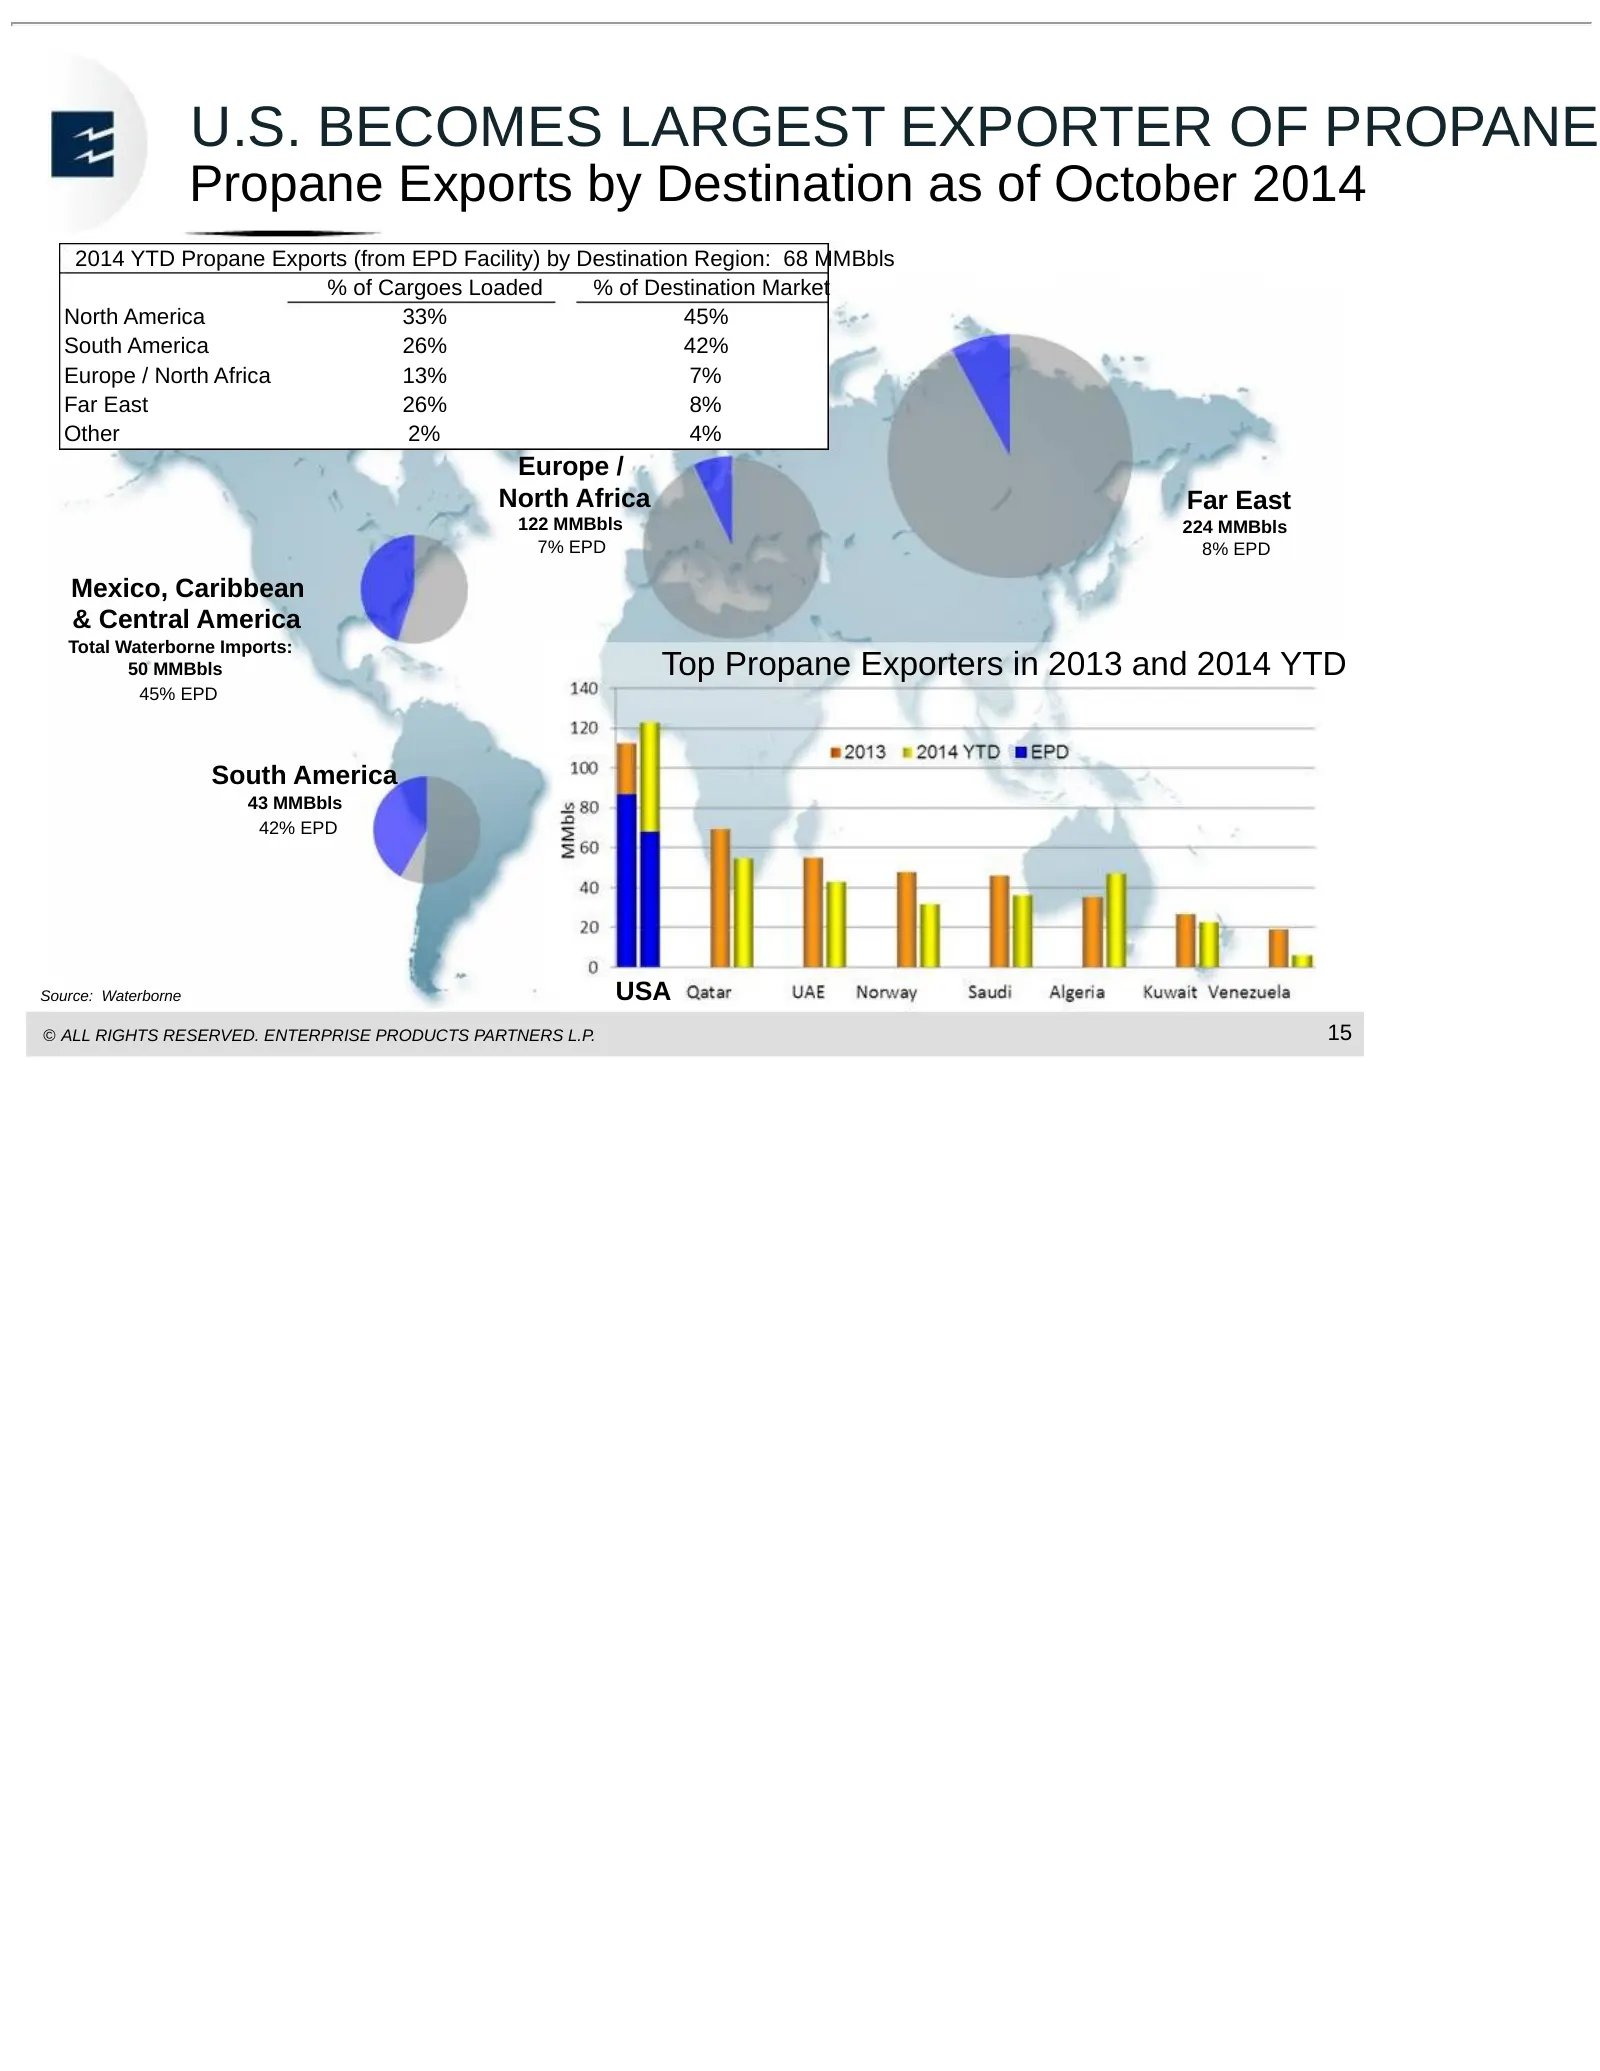
U.S. BECOMES LARGEST EXPORTER OF PROPANE Propane Exports by Destination as of October 2014 2014 YTD Propane Exports (from EPD Facility) by Destination Region: 68 MMBbls % of Cargoes Loaded % of Destination Market North America 33% 45% South America 26% 42% Europe / North Africa 13% 7% Far East 26% 8
Slide 17: EPD Booking Cargoes / Building Capacity
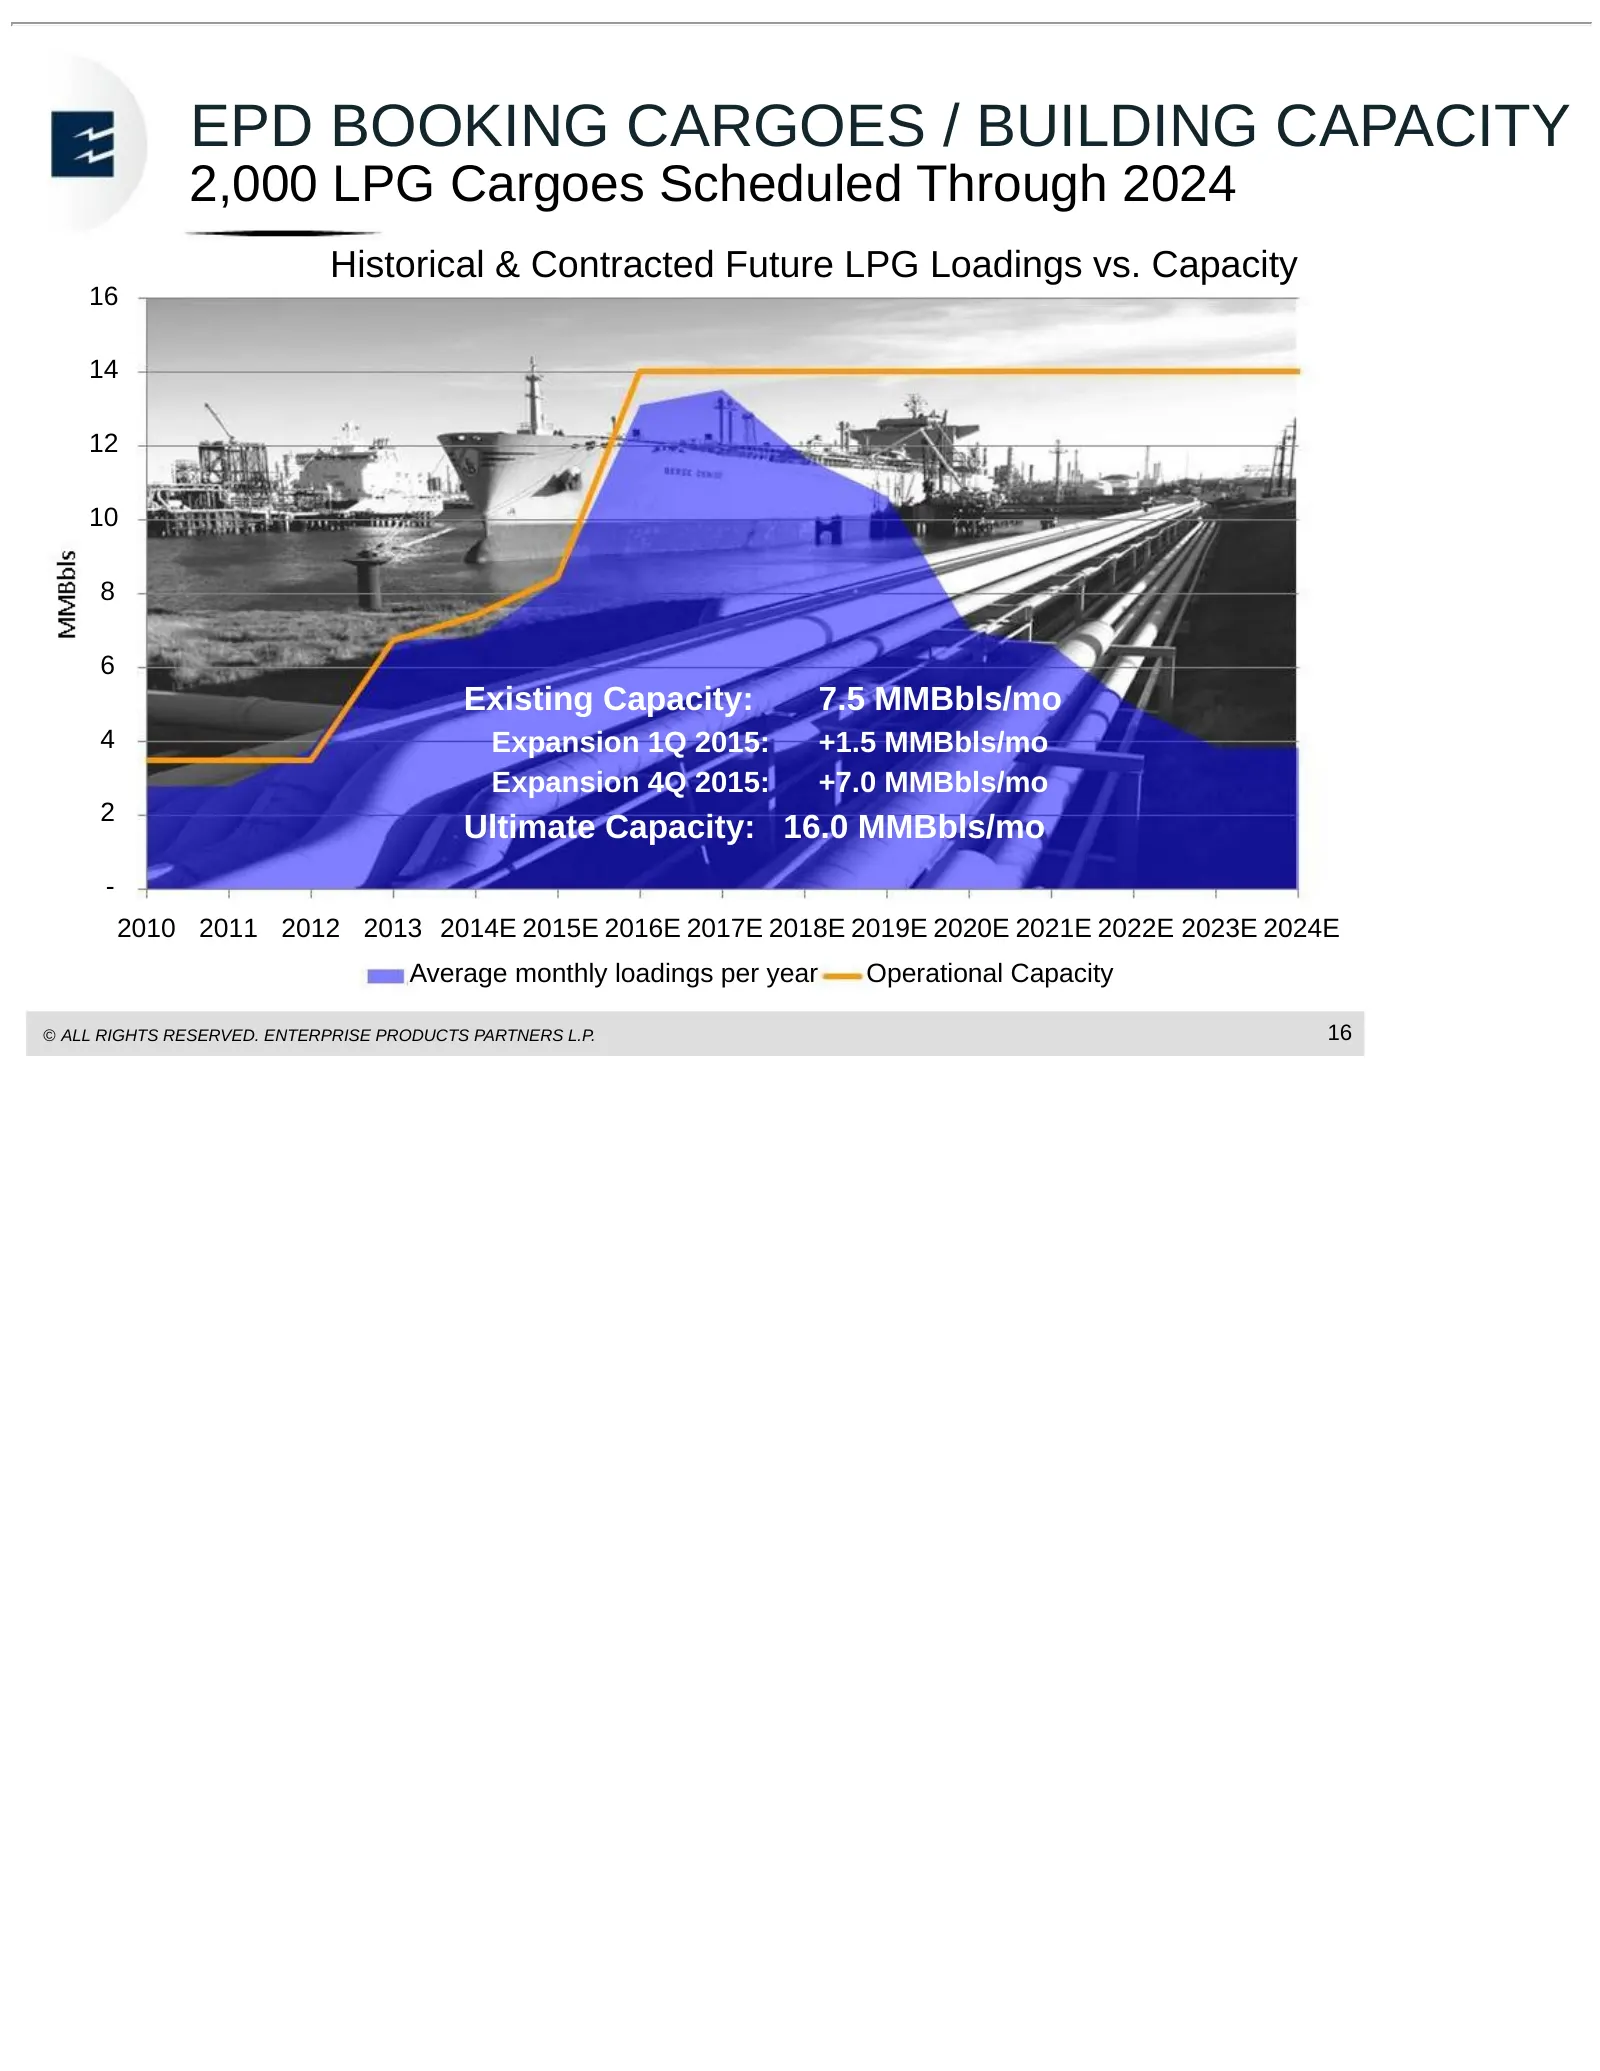
EPD BOOKING CARGOES / BUILDING CAPACITY 2,000 LPG Cargoes Scheduled Through 2024 Historical & Contracted Future LPG Loadings vs. Capacity 16 14 12 10 8 6 Existing Capacity: 7.5 MMBbls/mo 4 Expansion 1Q 2015: +1.5 MMBbls/mo Expansion 4Q 2015: +7.0 MMBbls/mo 2 Ultimate Capacity: 16.0 MMBbls/mo - 2010
Slide 18: New Markets Develop for U.S. Ethane
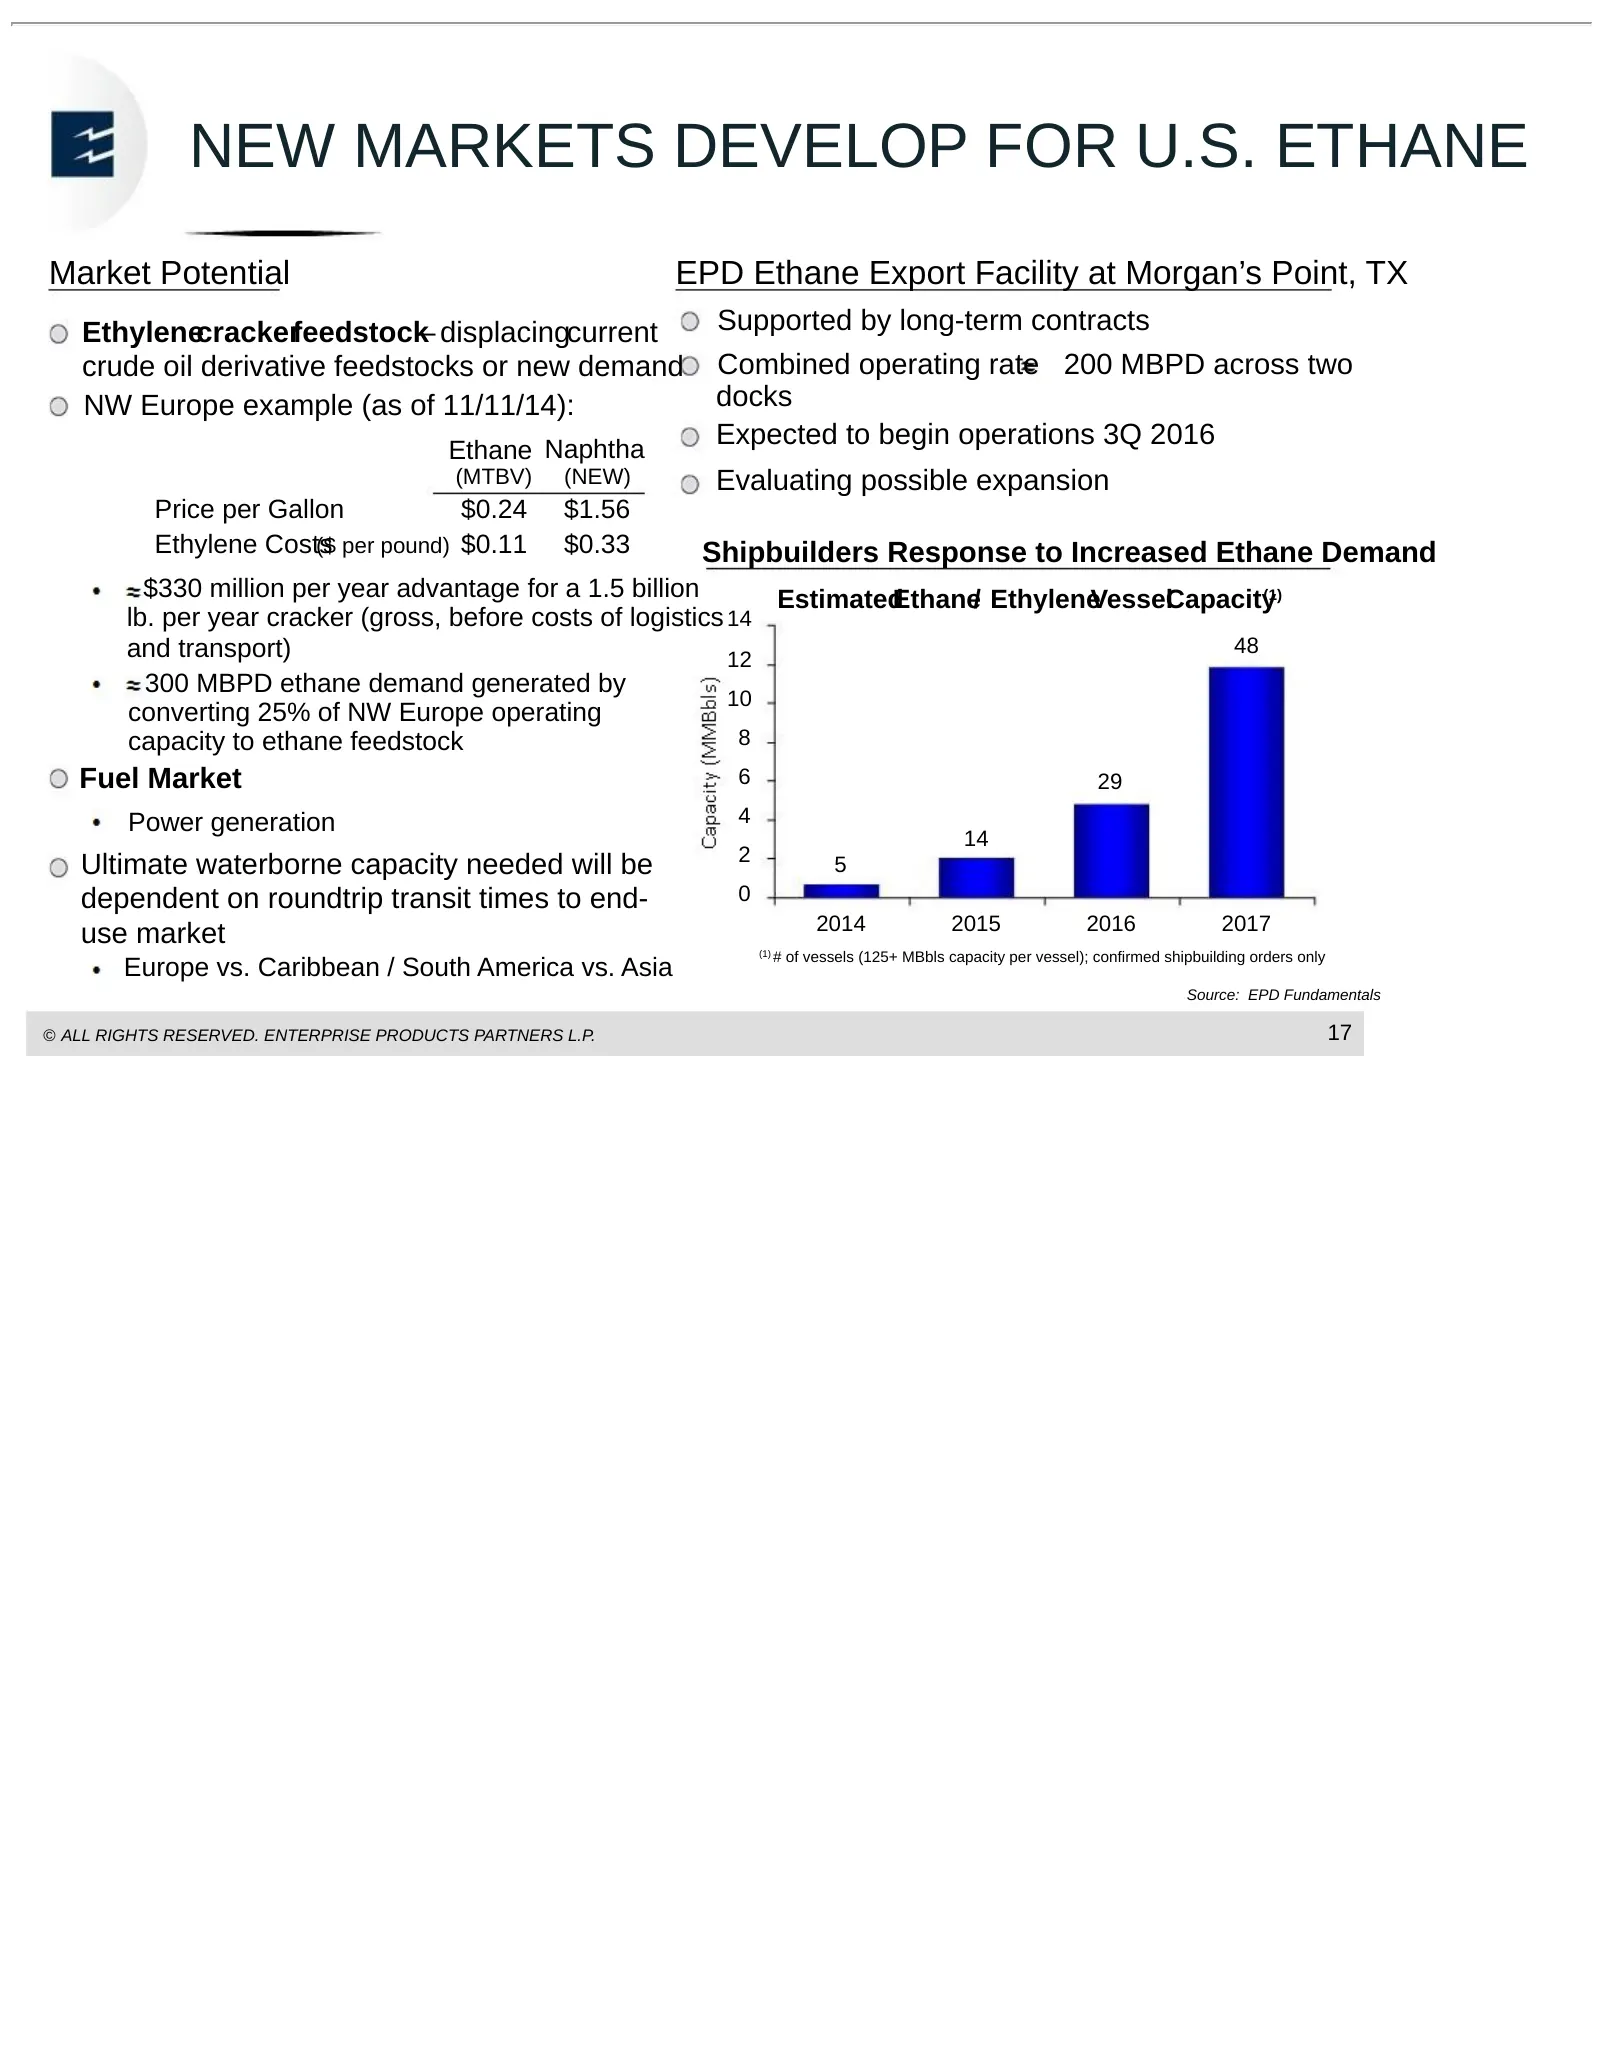
NEW MARKETS DEVELOP FOR U.S. ETHANE Market Potential EPD Ethane Export Facility at Morgan’s Point, TX Ethylenecrackerfeedstock– displacingcurrent Supported by long-term contracts crude oil derivative feedstocks or new demand Combined operating rate 200 MBPD across two NW Europe example (as of 11/11/
Slide 19: Seaway Crude Oil Pipeline Expansion Completed
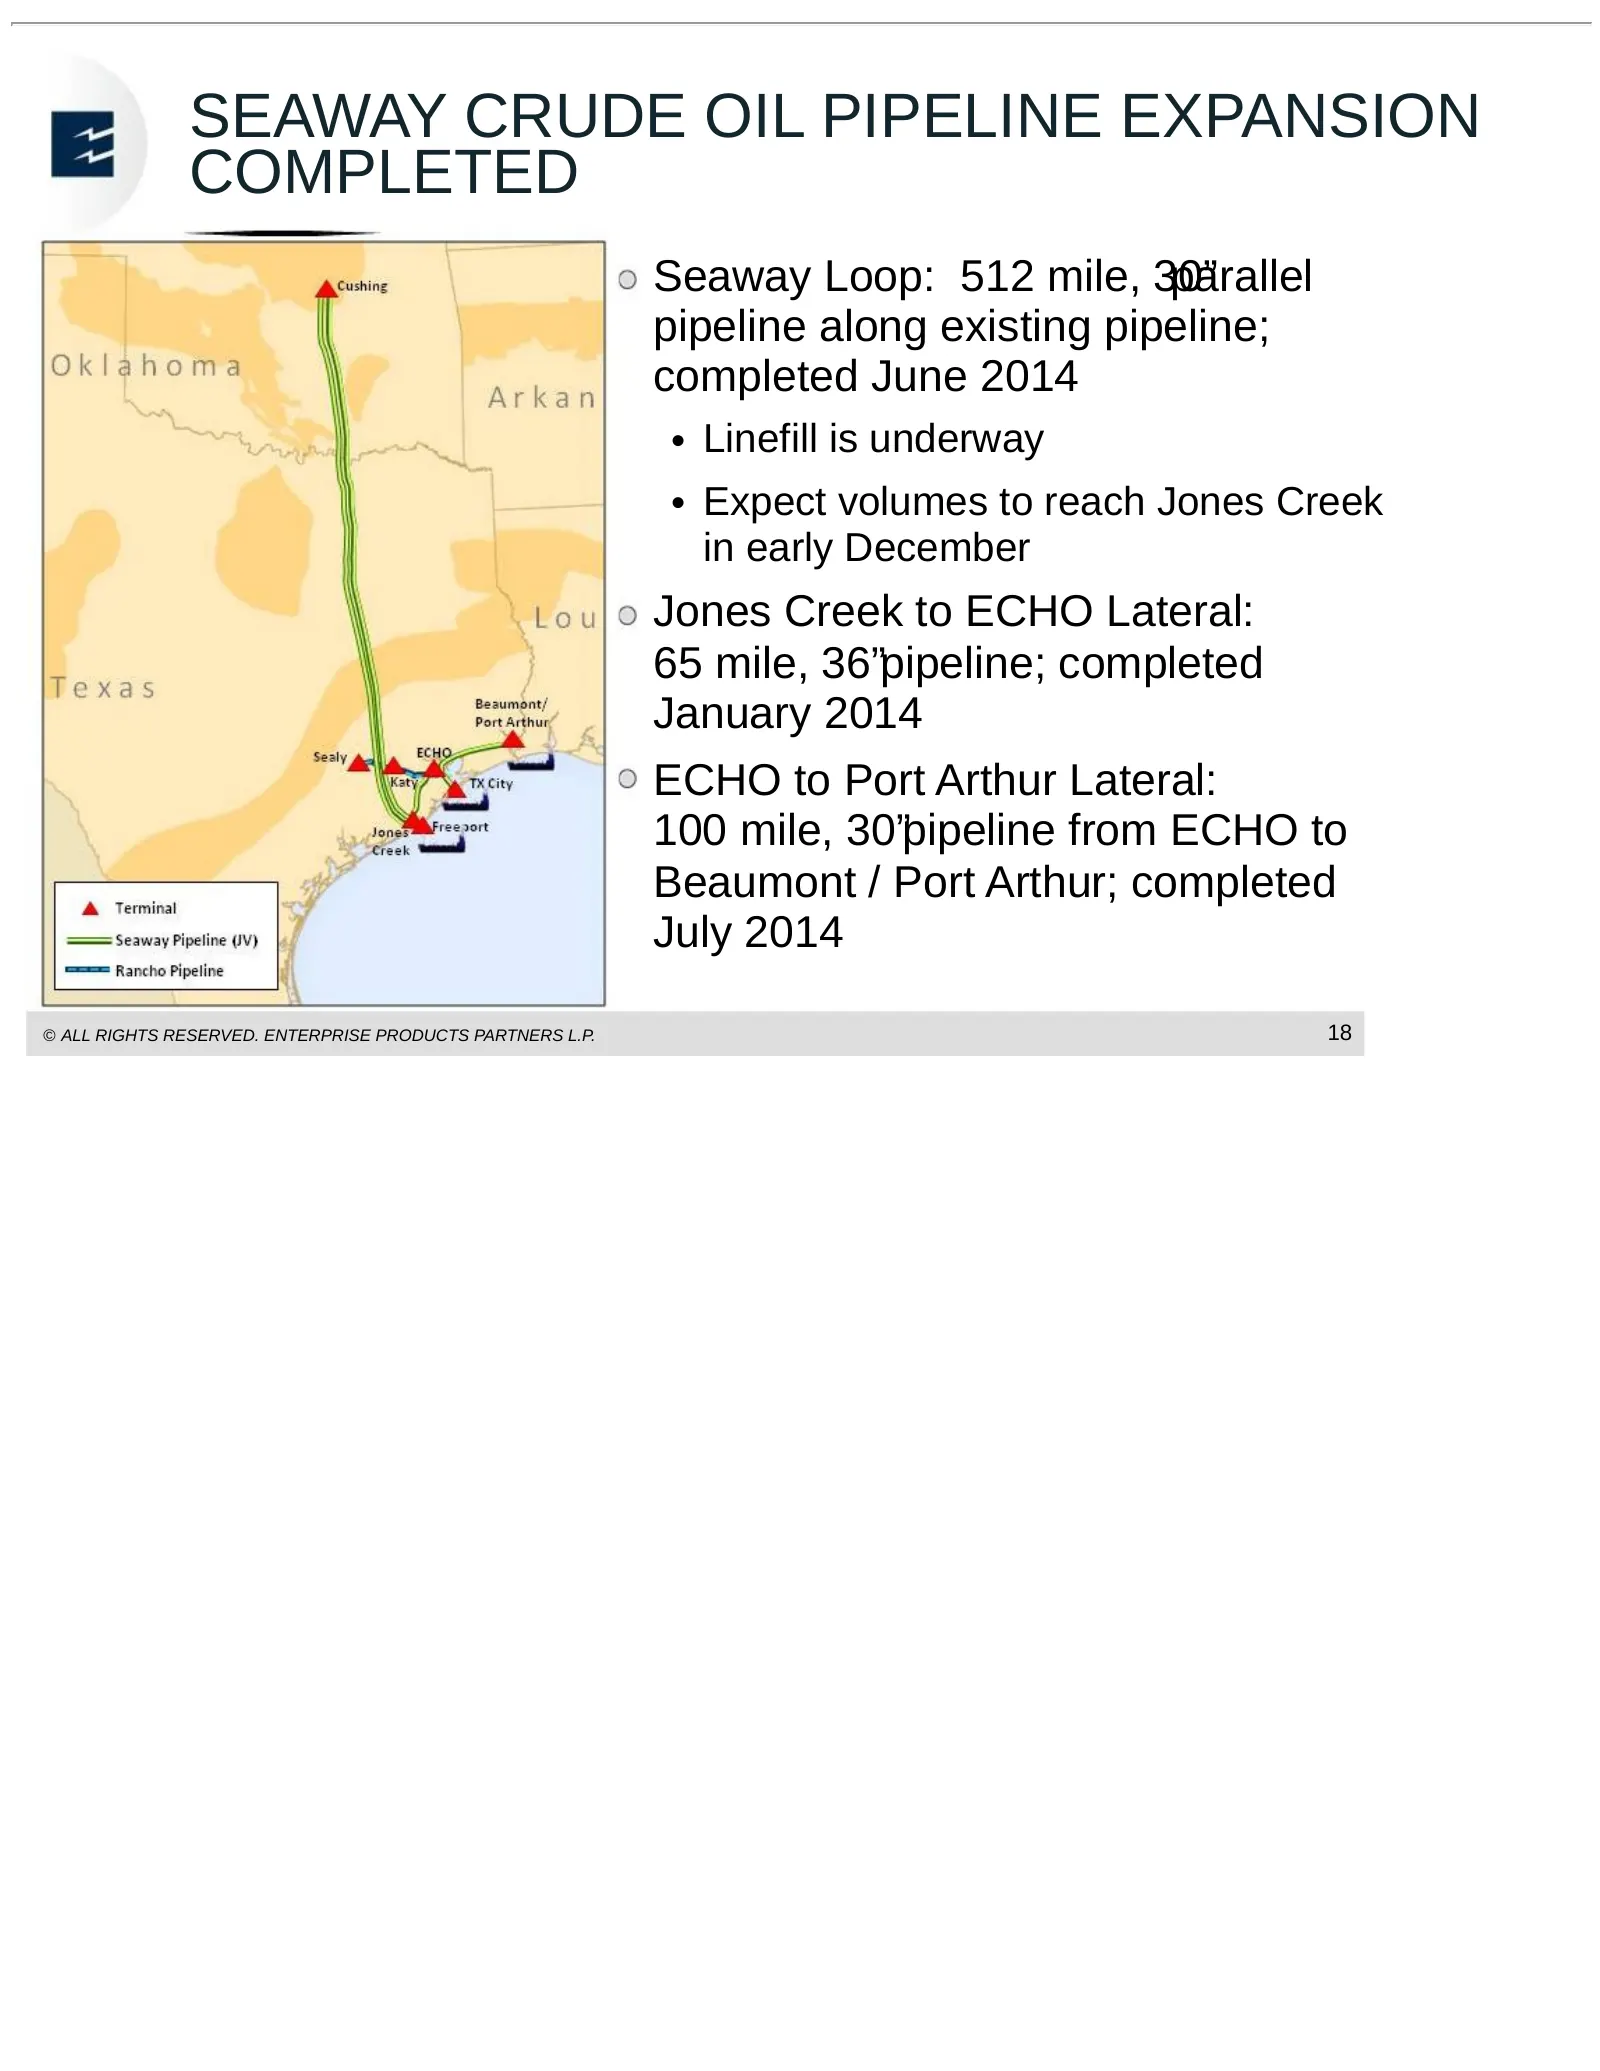
SEAWAY CRUDE OIL PIPELINE EXPANSION COMPLETED Seaway Loop: 512 mile, 30” parallel pipeline along existing pipeline; completed June 2014 • Linefill is underway • Expect volumes to reach Jones Creek in early December Jones Creek to ECHO Lateral: 65 mile, 36”pipeline; completed January 2014 ECHO to Por
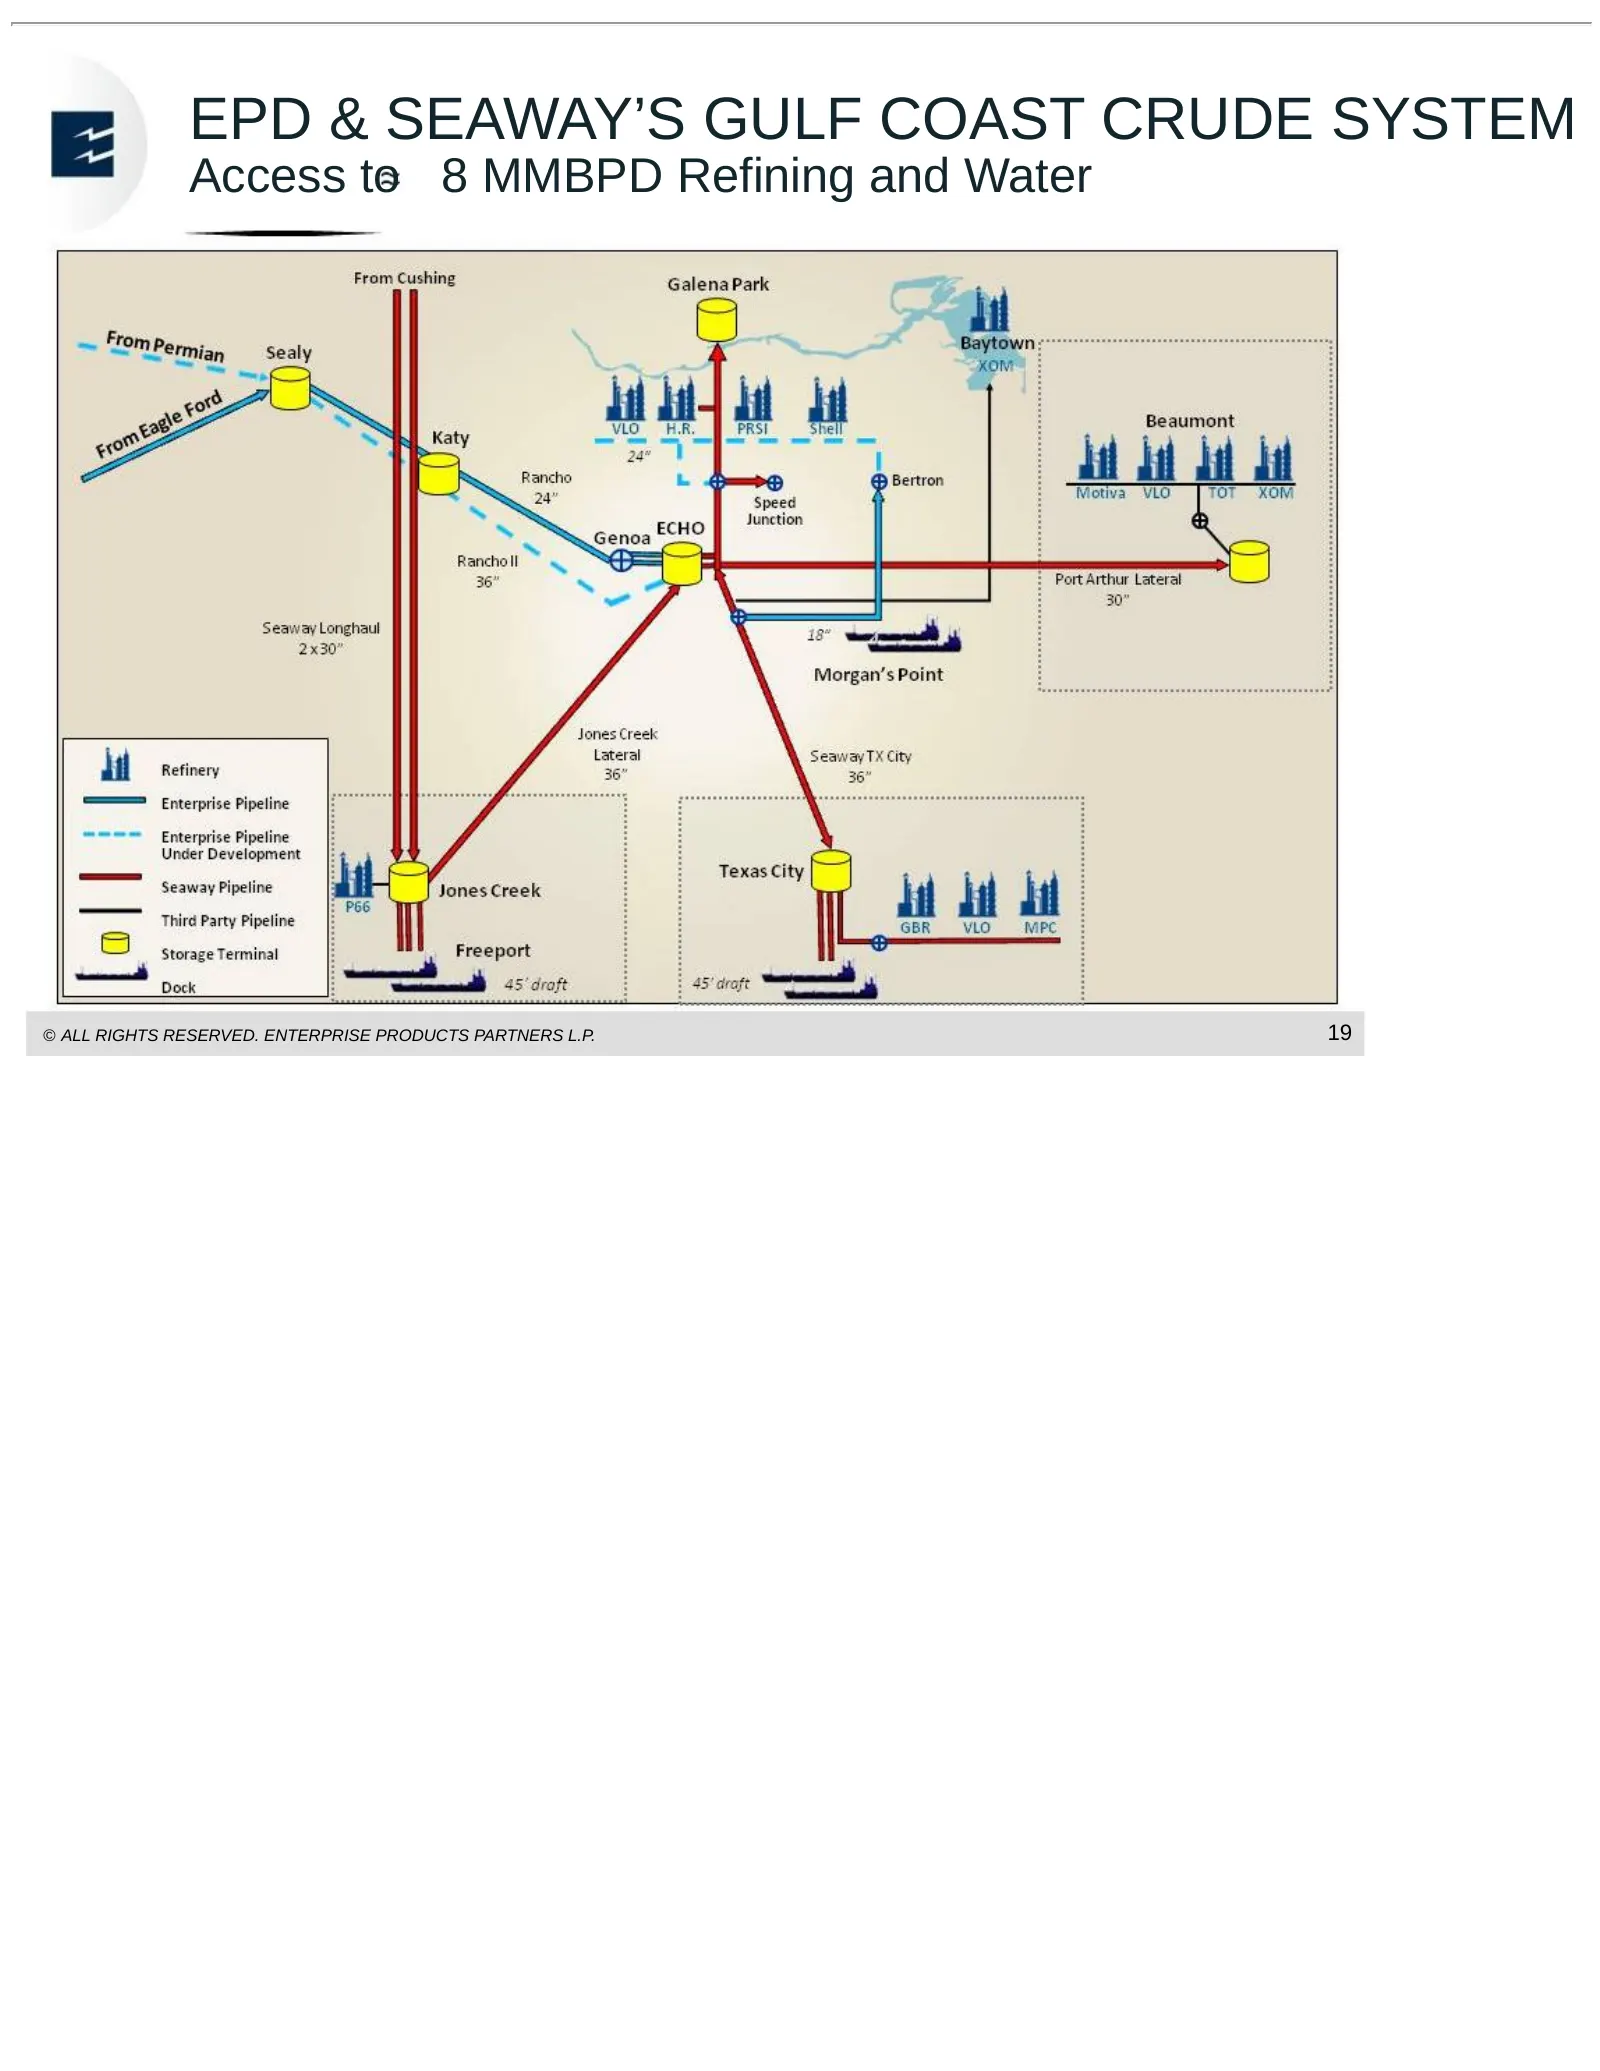
Slide 20: EPD & Seaway's Gulf Coast Crude System
EPD & SEAWAY’S GULF COAST CRUDE SYSTEM Access to 8 MMBPD Refining and Water © ALL RIGHTS RESERVED. ENTERPRISE PRODUCTS PARTNERS L.P. 19
Slide 21: Oiltanking
OILTANKING © ALL RIGHTS RESERVED. ENTERPRISE PRODUCTS PARTNERS L.P. enterpriseproducts.com
Slide 22: Acquisition of Oiltanking (OILT) Overview and Rationale
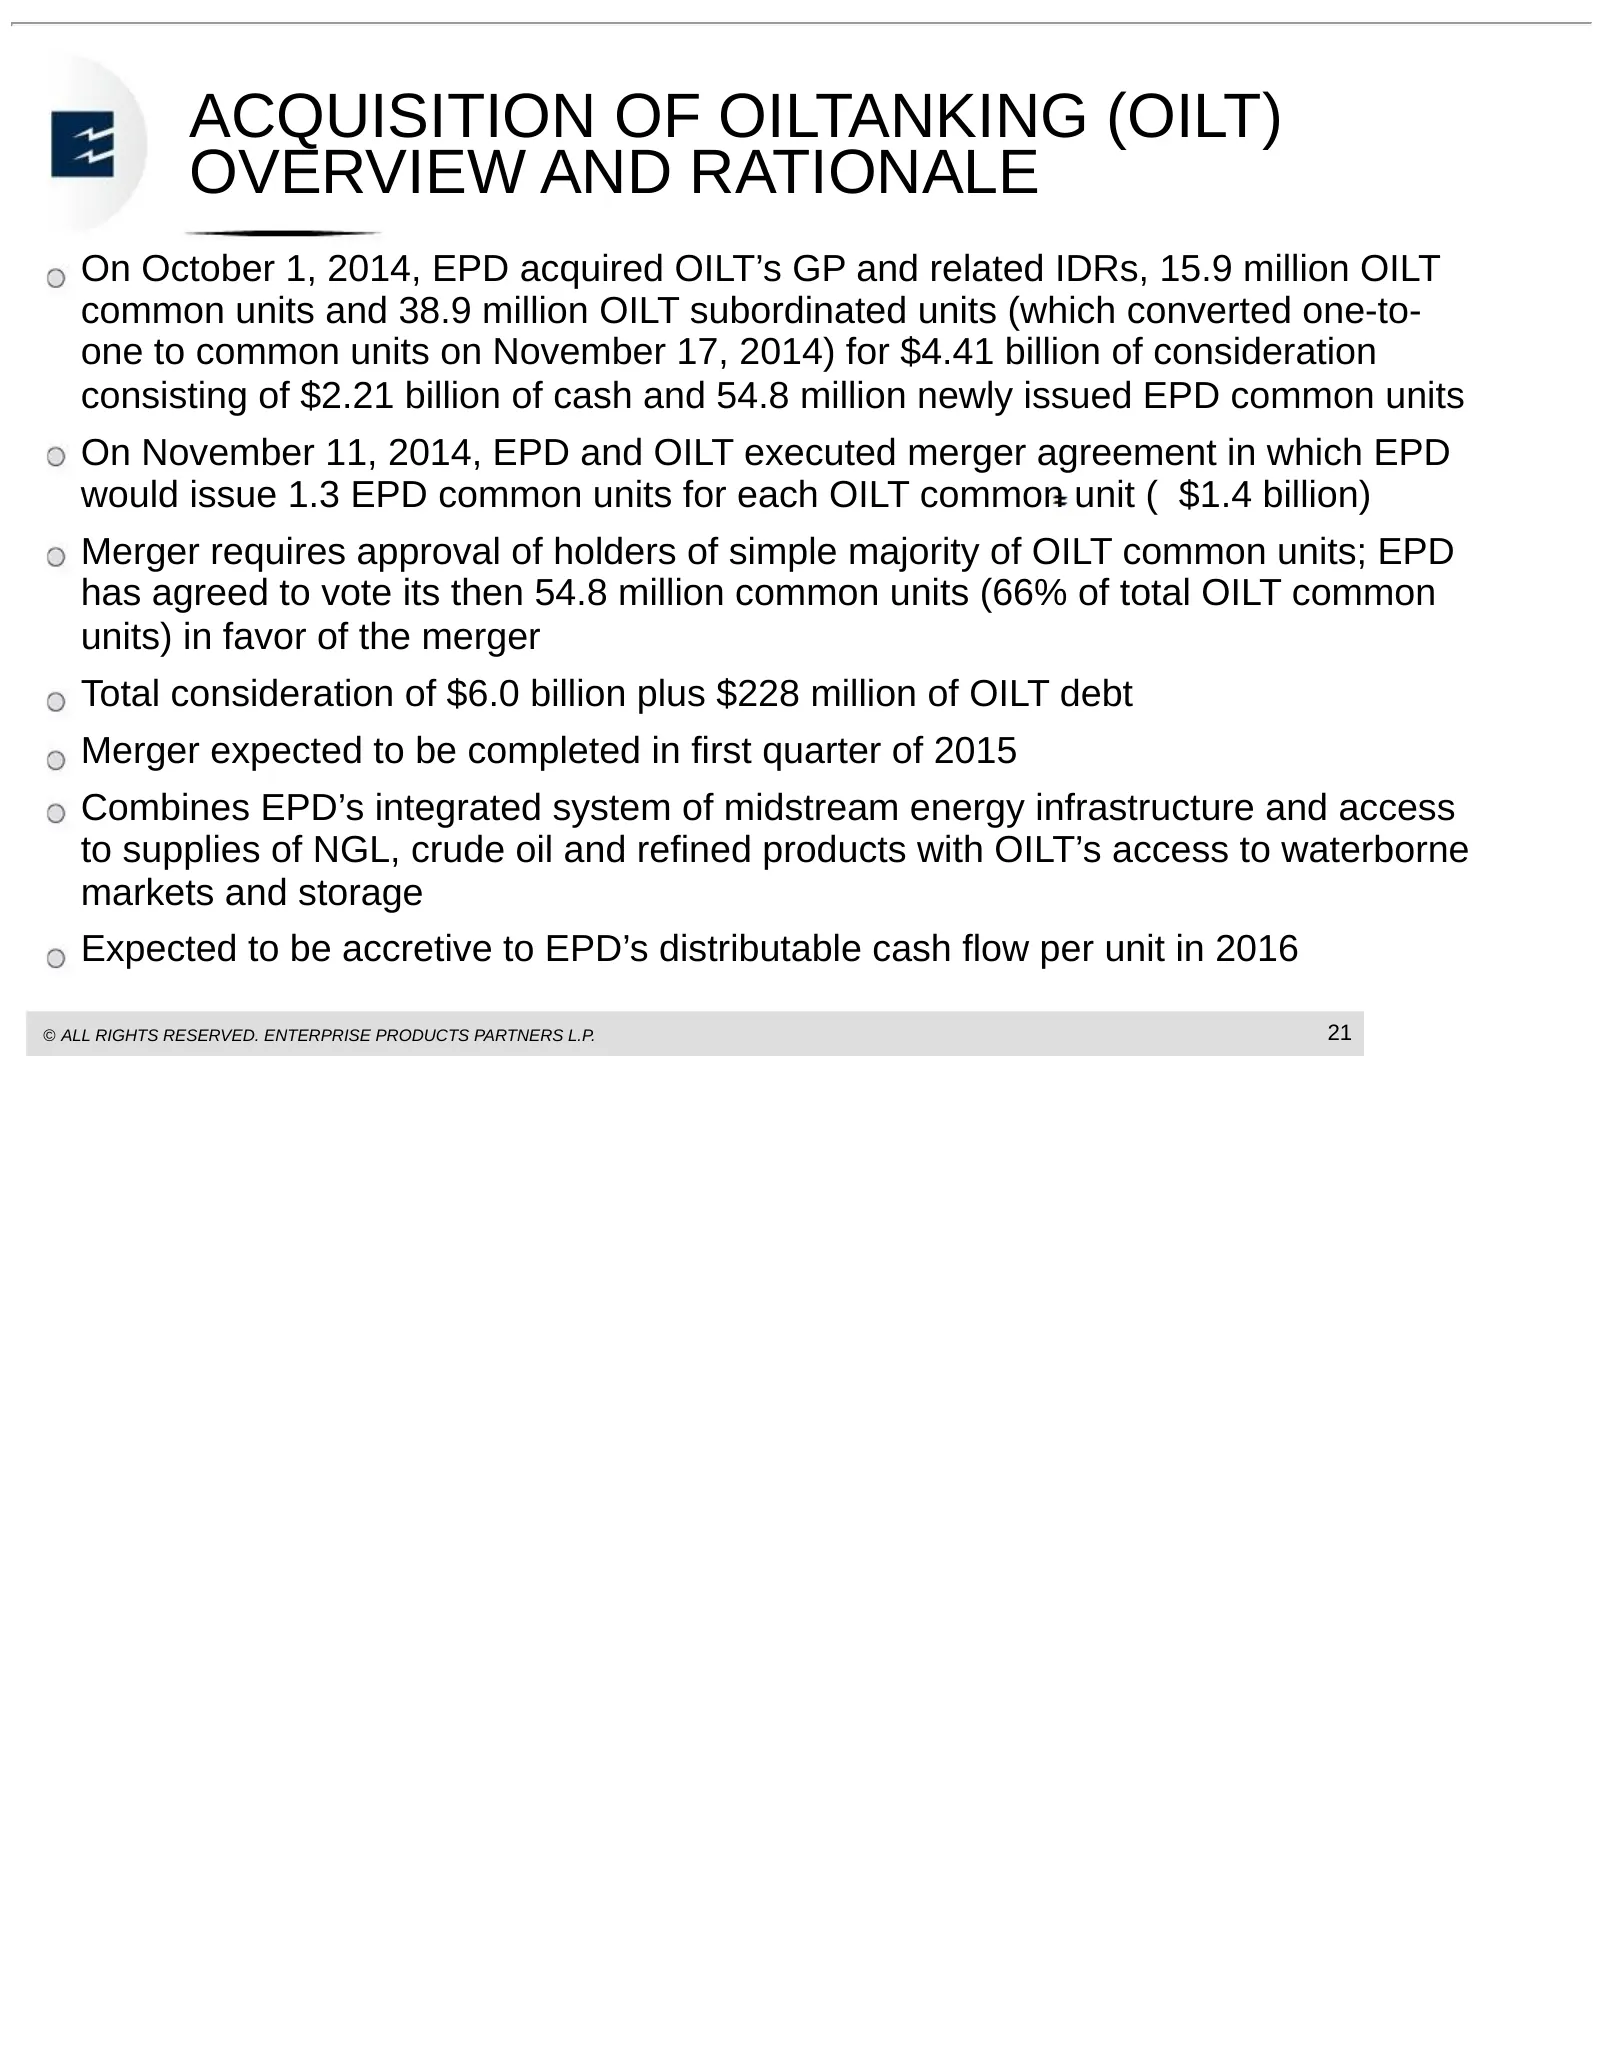
ACQUISITION OF OILTANKING (OILT) OVERVIEW AND RATIONALE On October 1, 2014, EPD acquired OILT’s GP and related IDRs, 15.9 million OILT common units and 38.9 million OILT subordinated units (which converted one-to- one to common units on November 17, 2014) for $4.41 billion of consideration consistin
Slide 23: Acquisition of OILT Principle Drivers of Value Creation
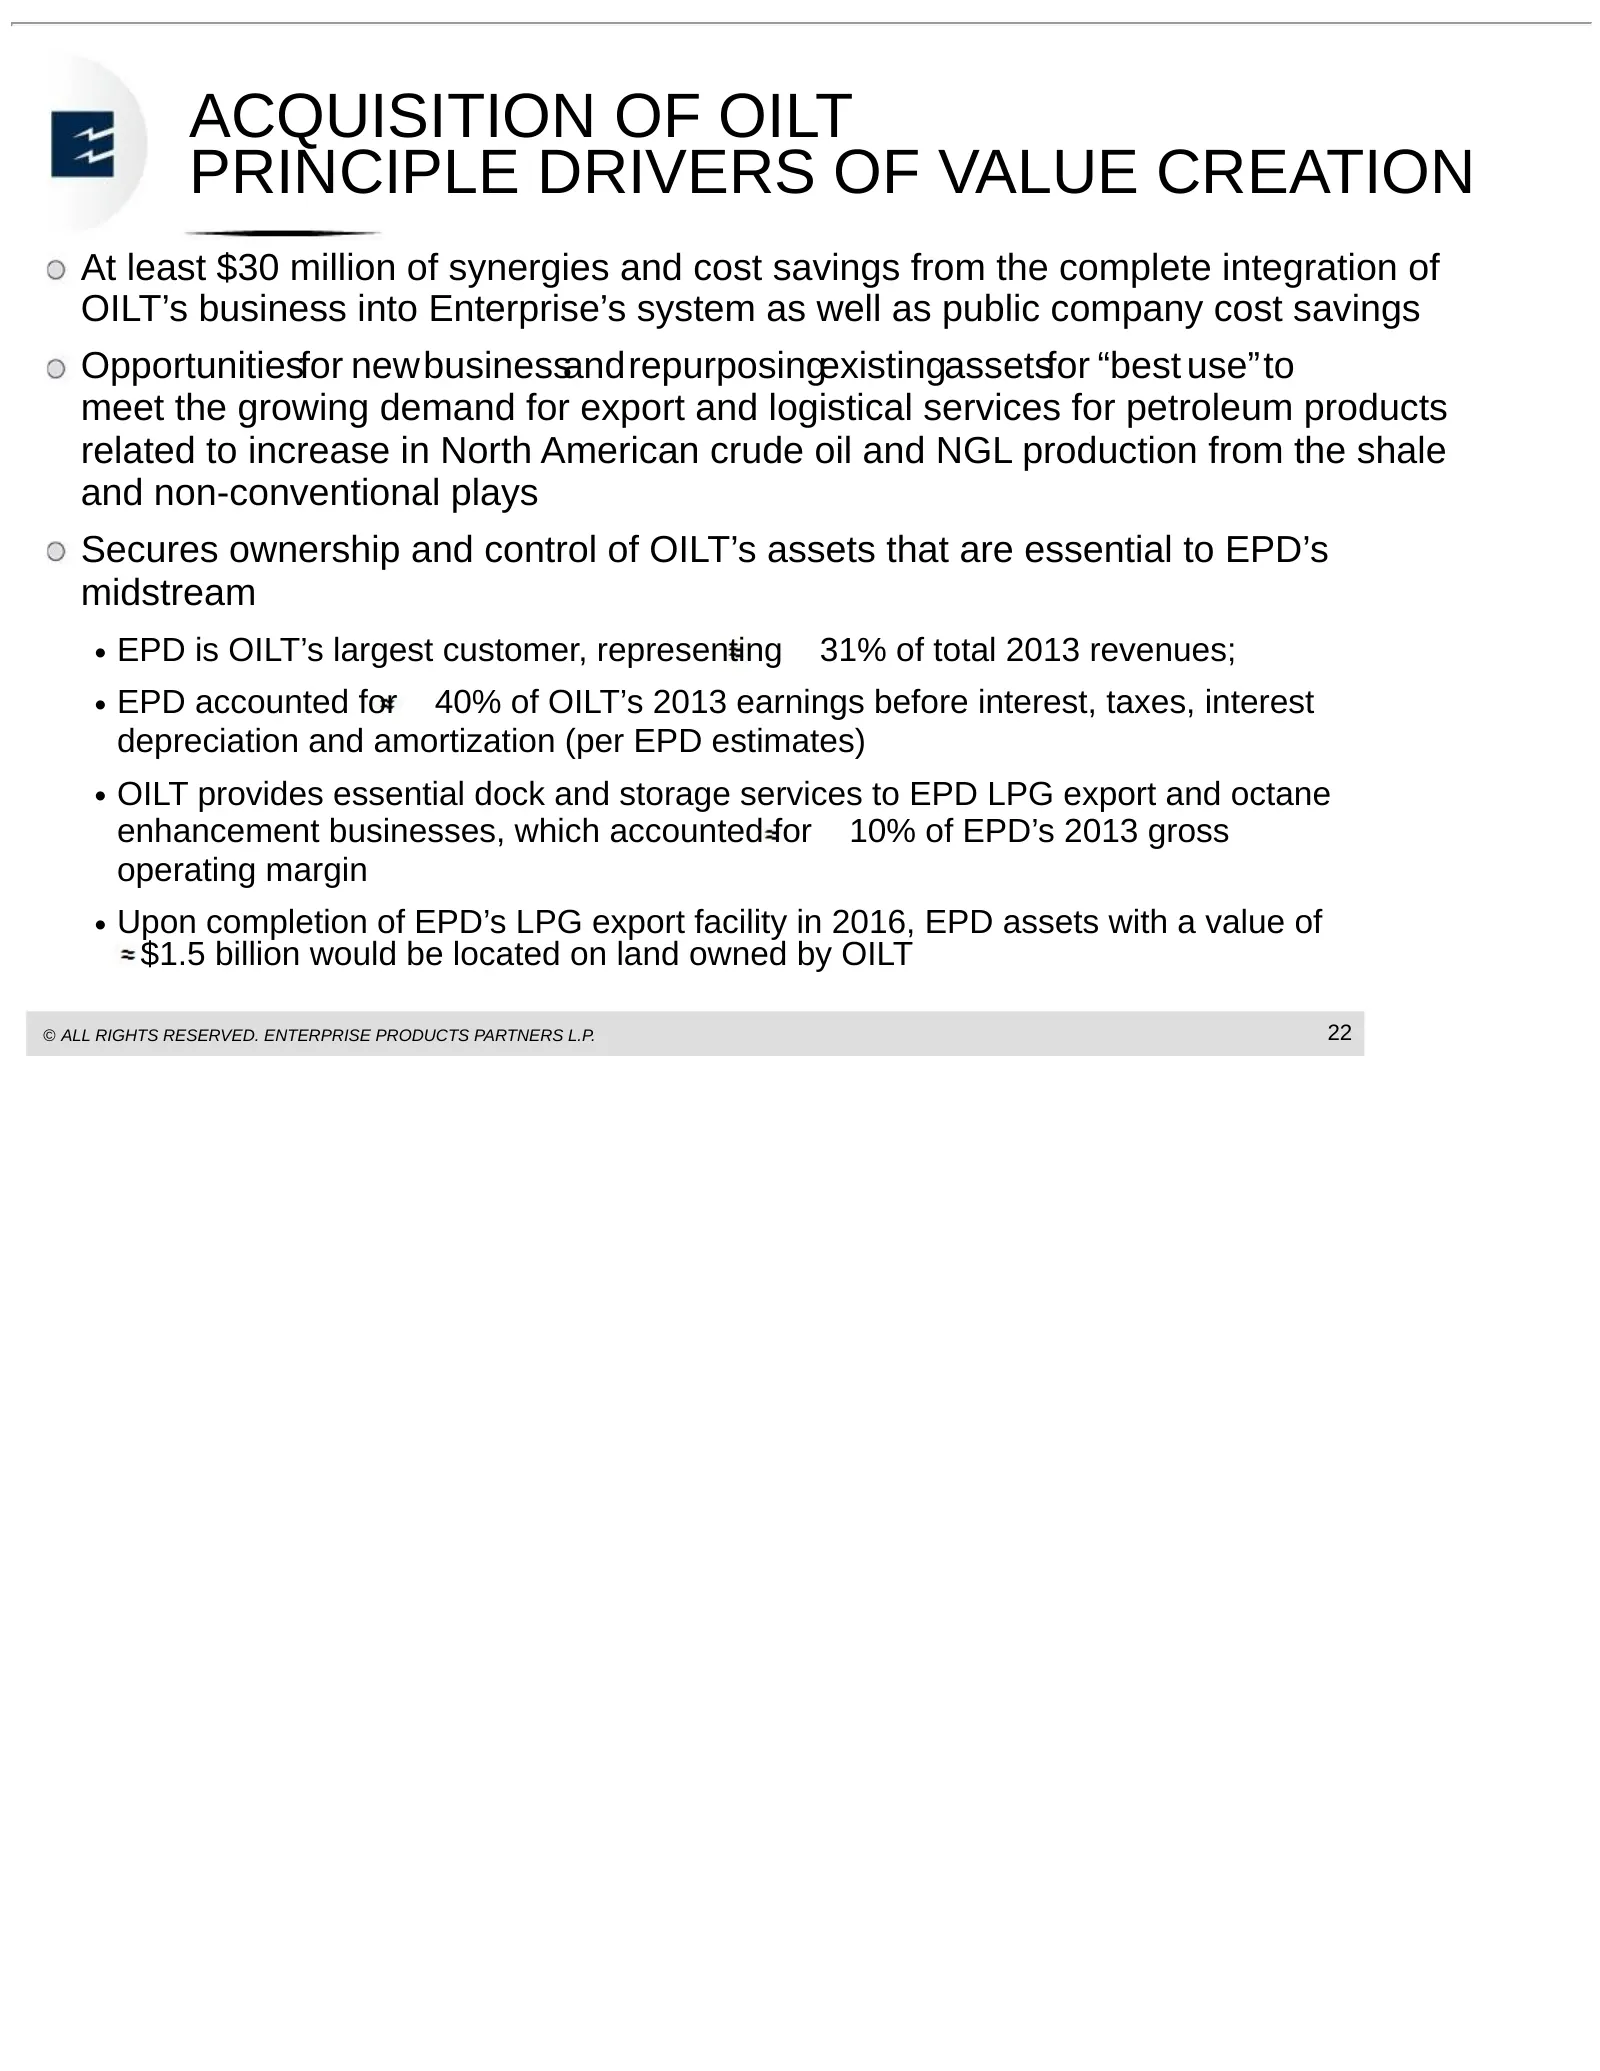
ACQUISITION OF OILT PRINCIPLE DRIVERS OF VALUE CREATION At least $30 million of synergies and cost savings from the complete integration of OILT’s business into Enterprise’s system as well as public company cost savings Opportunitiesfor newbusinessandrepurposingexistingassetsfor “best use”to meet th
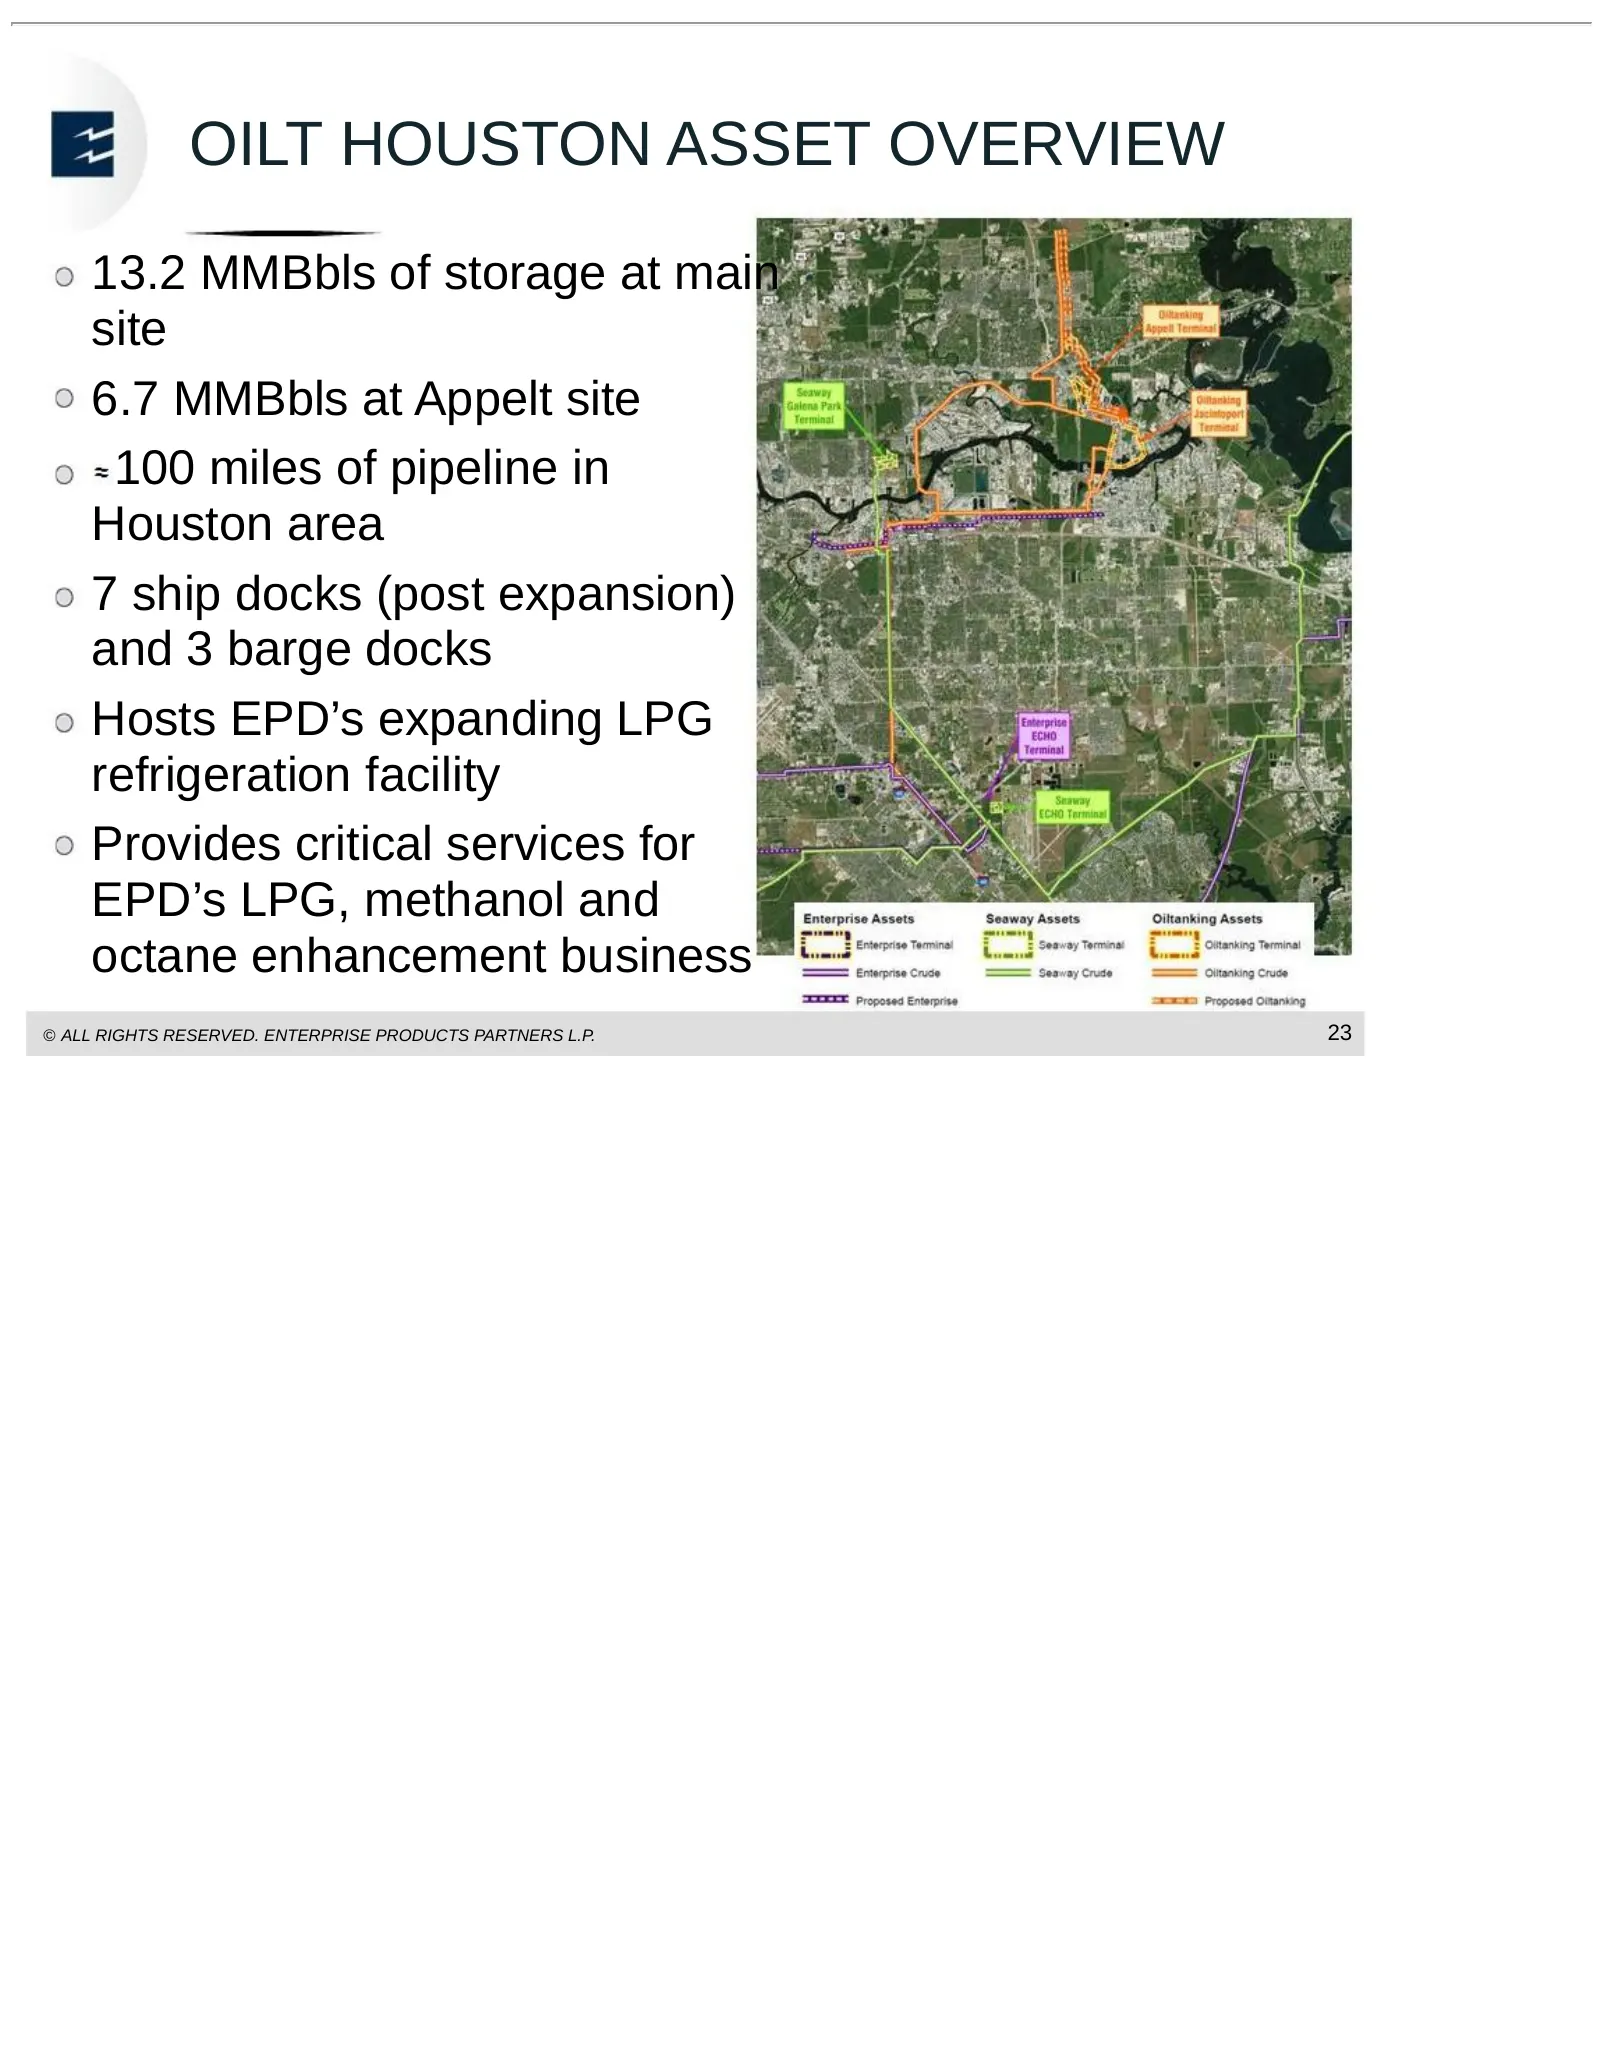
Slide 24: OILT Houston Asset Overview
OILT HOUSTON ASSET OVERVIEW 13.2 MMBbls of storage at main site 6.7 MMBbls at Appelt site 100 miles of pipeline in Houston area 7 ship docks (post expansion) and 3 barge docks Hosts EPD’s expanding LPG refrigeration facility Provides critical services for EPD’s LPG, methanol and octane enhancement b
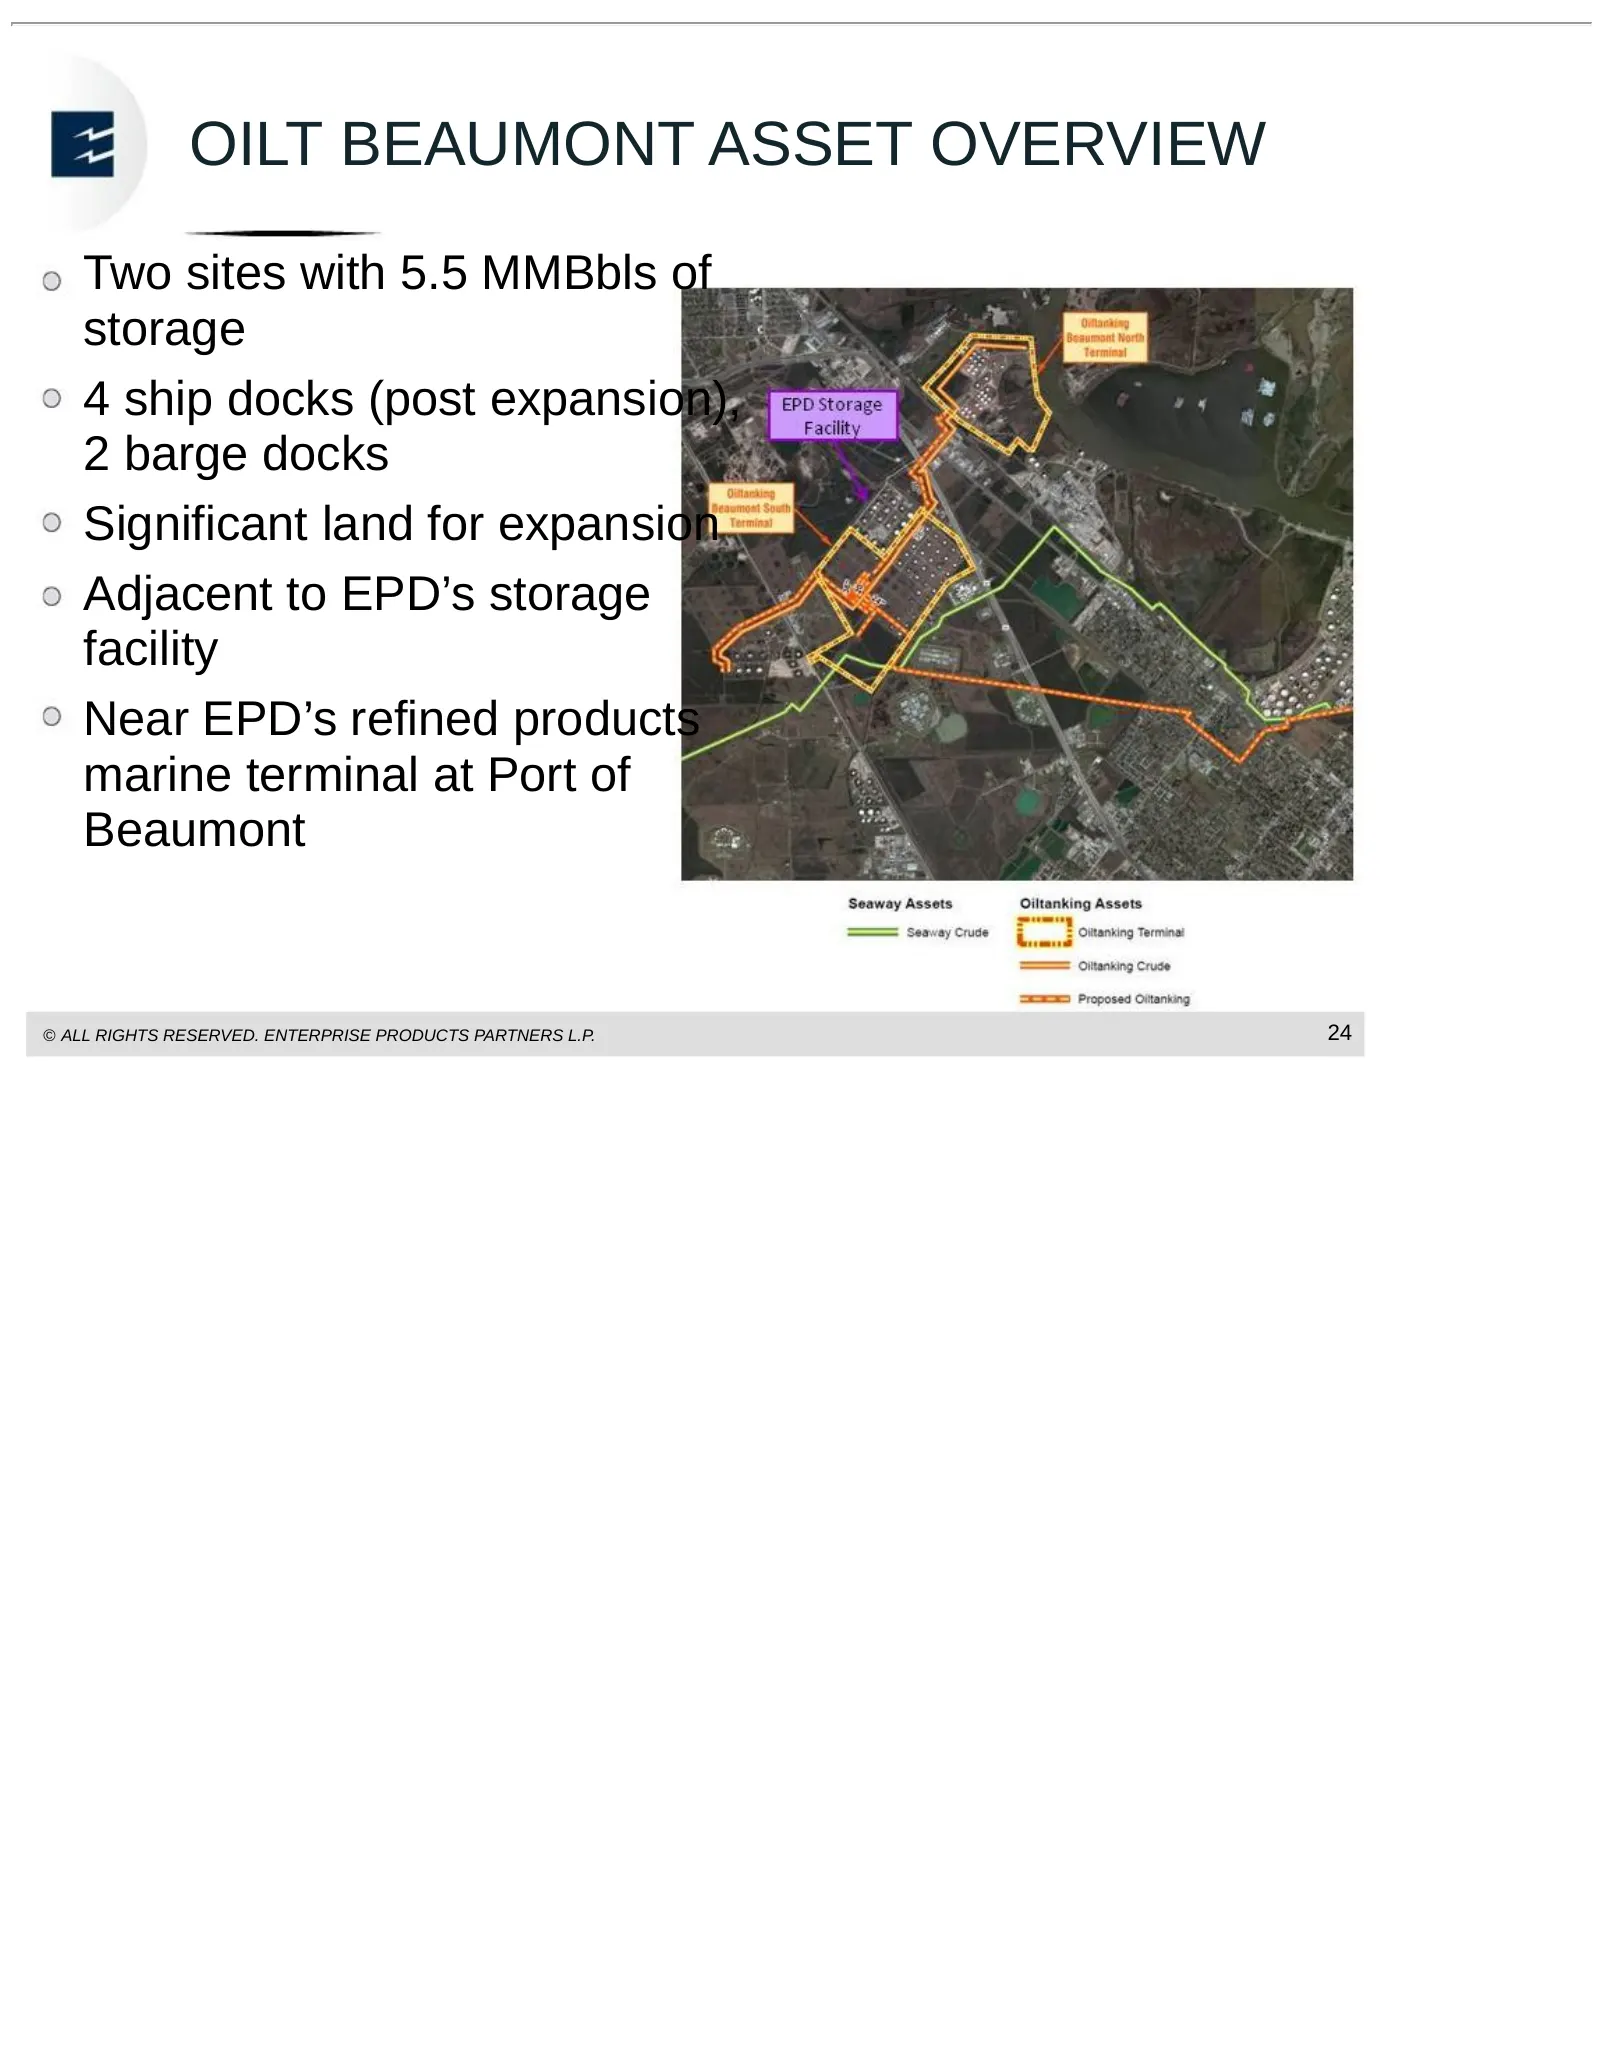
Slide 25: OILT Beaumont Asset Overview
OILT BEAUMONT ASSET OVERVIEW Two sites with 5.5 MMBbls of storage 4 ship docks (post expansion), 2 barge docks Significant land for expansion Adjacent to EPD’s storage facility Near EPD’s refined products marine terminal at Port of Beaumont © ALL RIGHTS RESERVED. ENTERPRISE PRODUCTS PARTNERS L.P. 24

Slide 26: Financial
FINANCIAL © ALL RIGHTS RESERVED. ENTERPRISE PRODUCTS PARTNERS L.P. enterpriseproducts.com
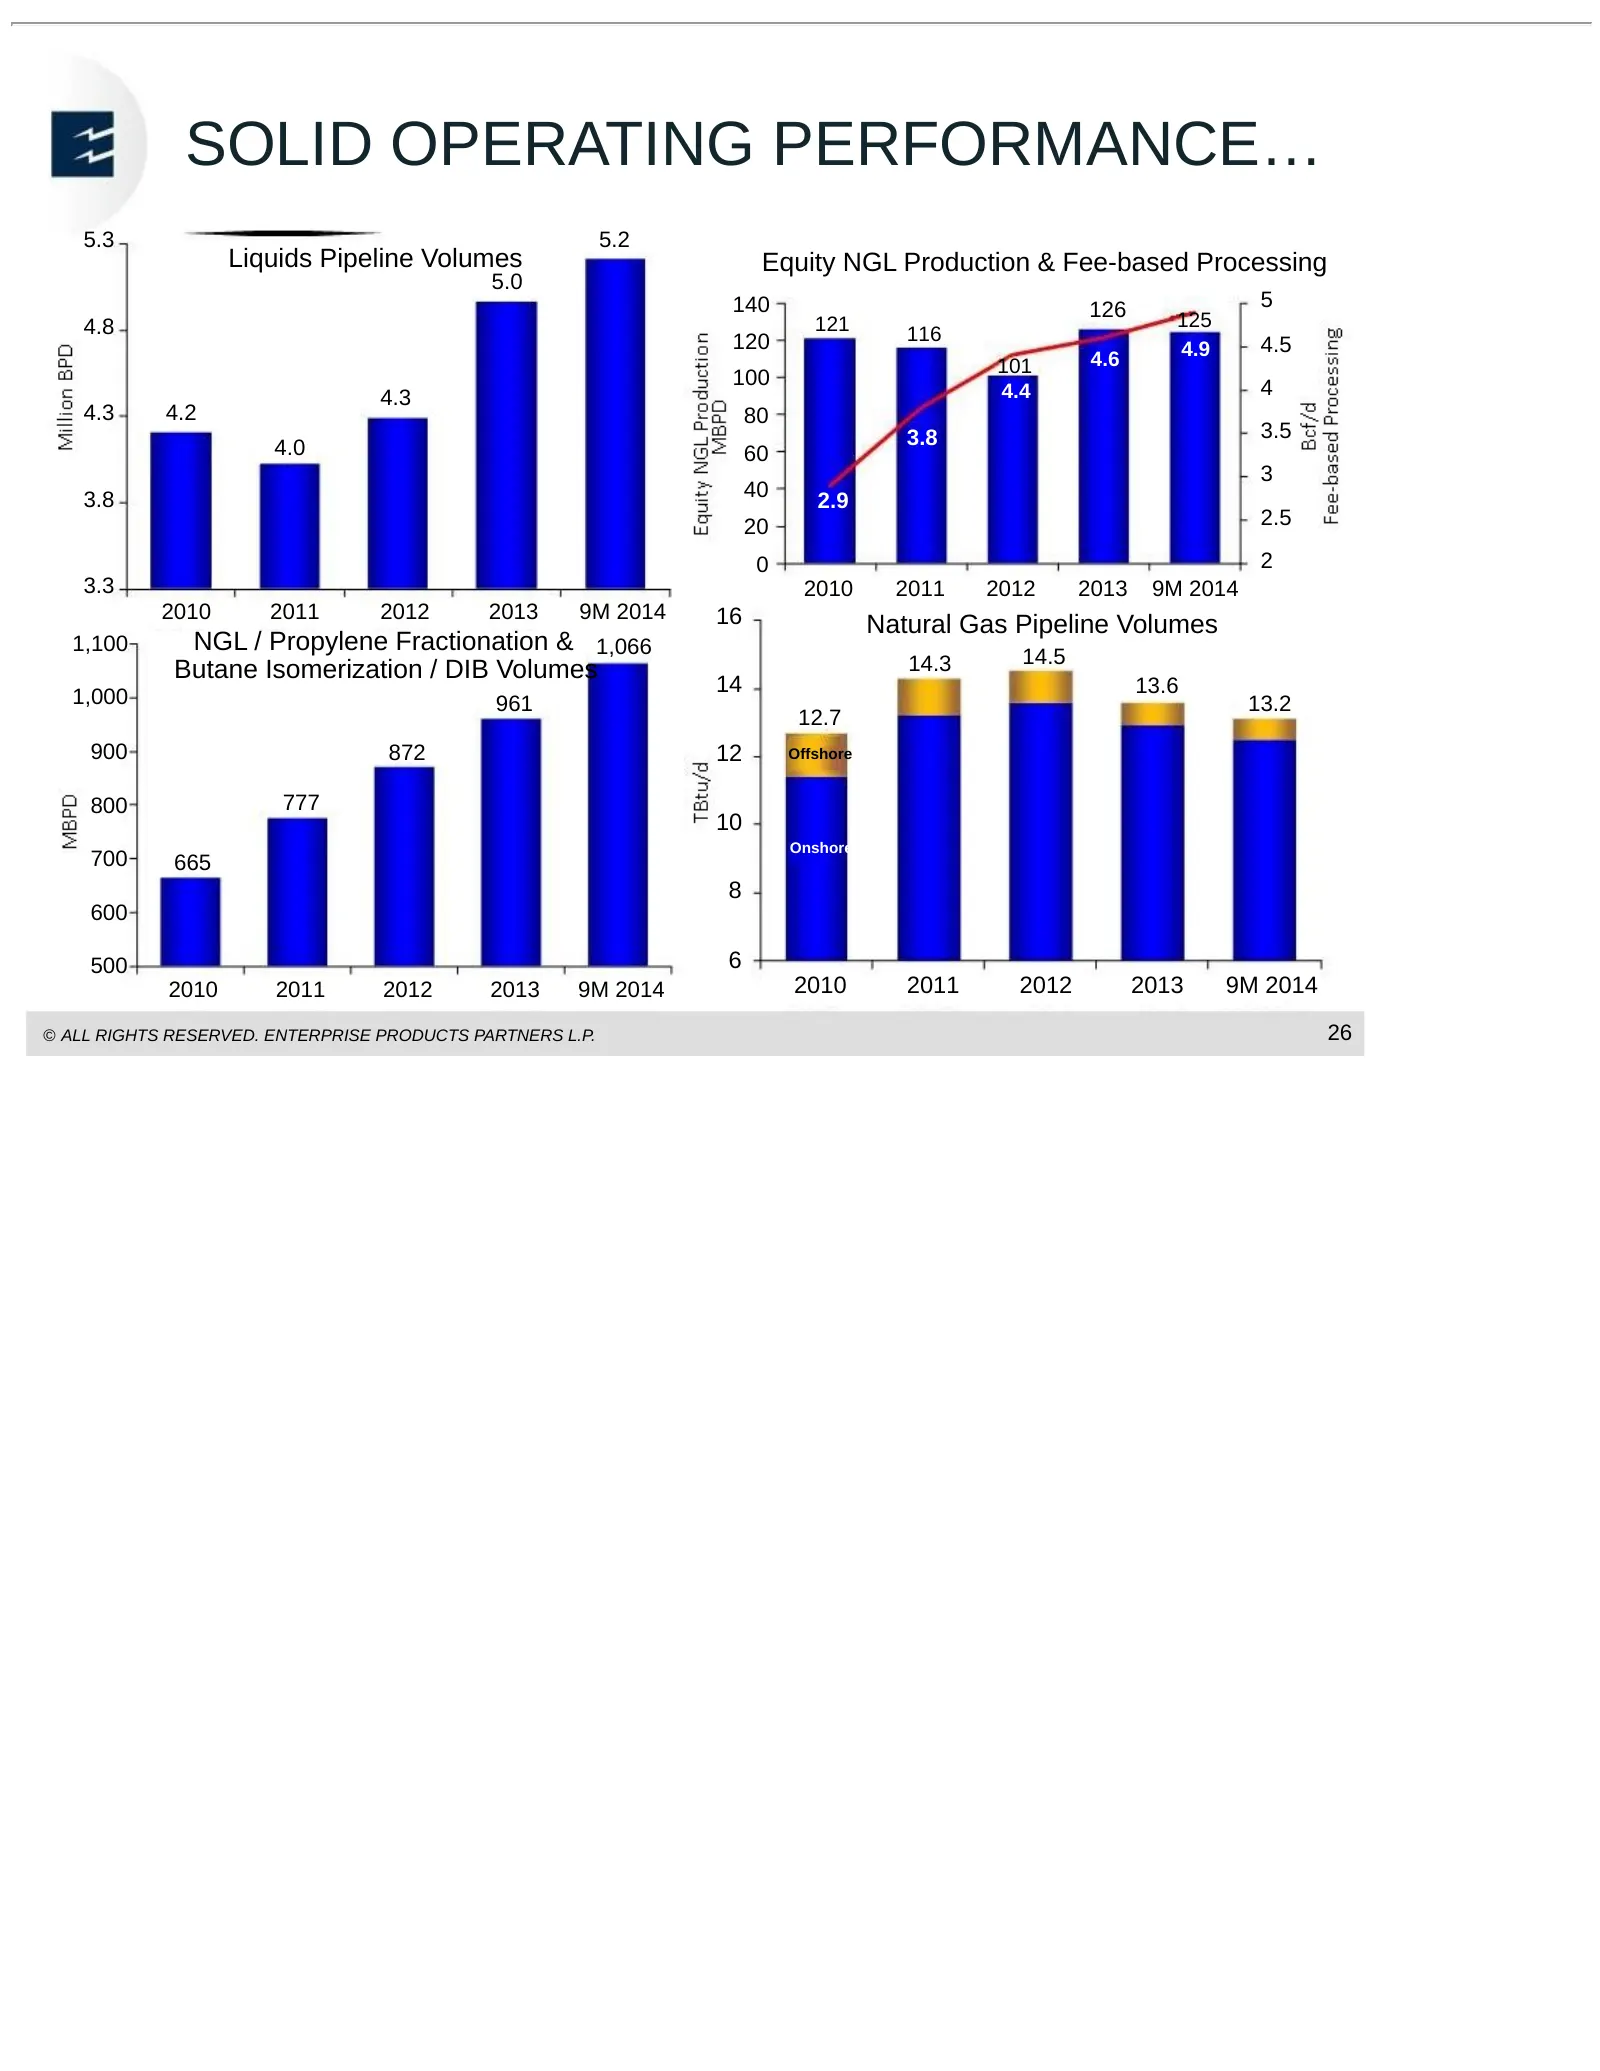
Slide 27: Solid Operating Performance…
SOLID OPERATING PERFORMANCE… 5.3 5.2 Liquids Pipeline Volumes Equity NGL Production & Fee-based Processing 5.0 140 126 5 4.8 121 125 120 116 4.9 4.5 101 4.6 100 4 4.3 4.4 4.3 4.2 80 3.8 3.5 4.0 60 3 3.8 40 2.9 20 2.5 0 2 3.3 2010 2011 2012 2013 9M 2014 2010 2011 2012 2013 9M 2014 16 Natural Gas Pipe
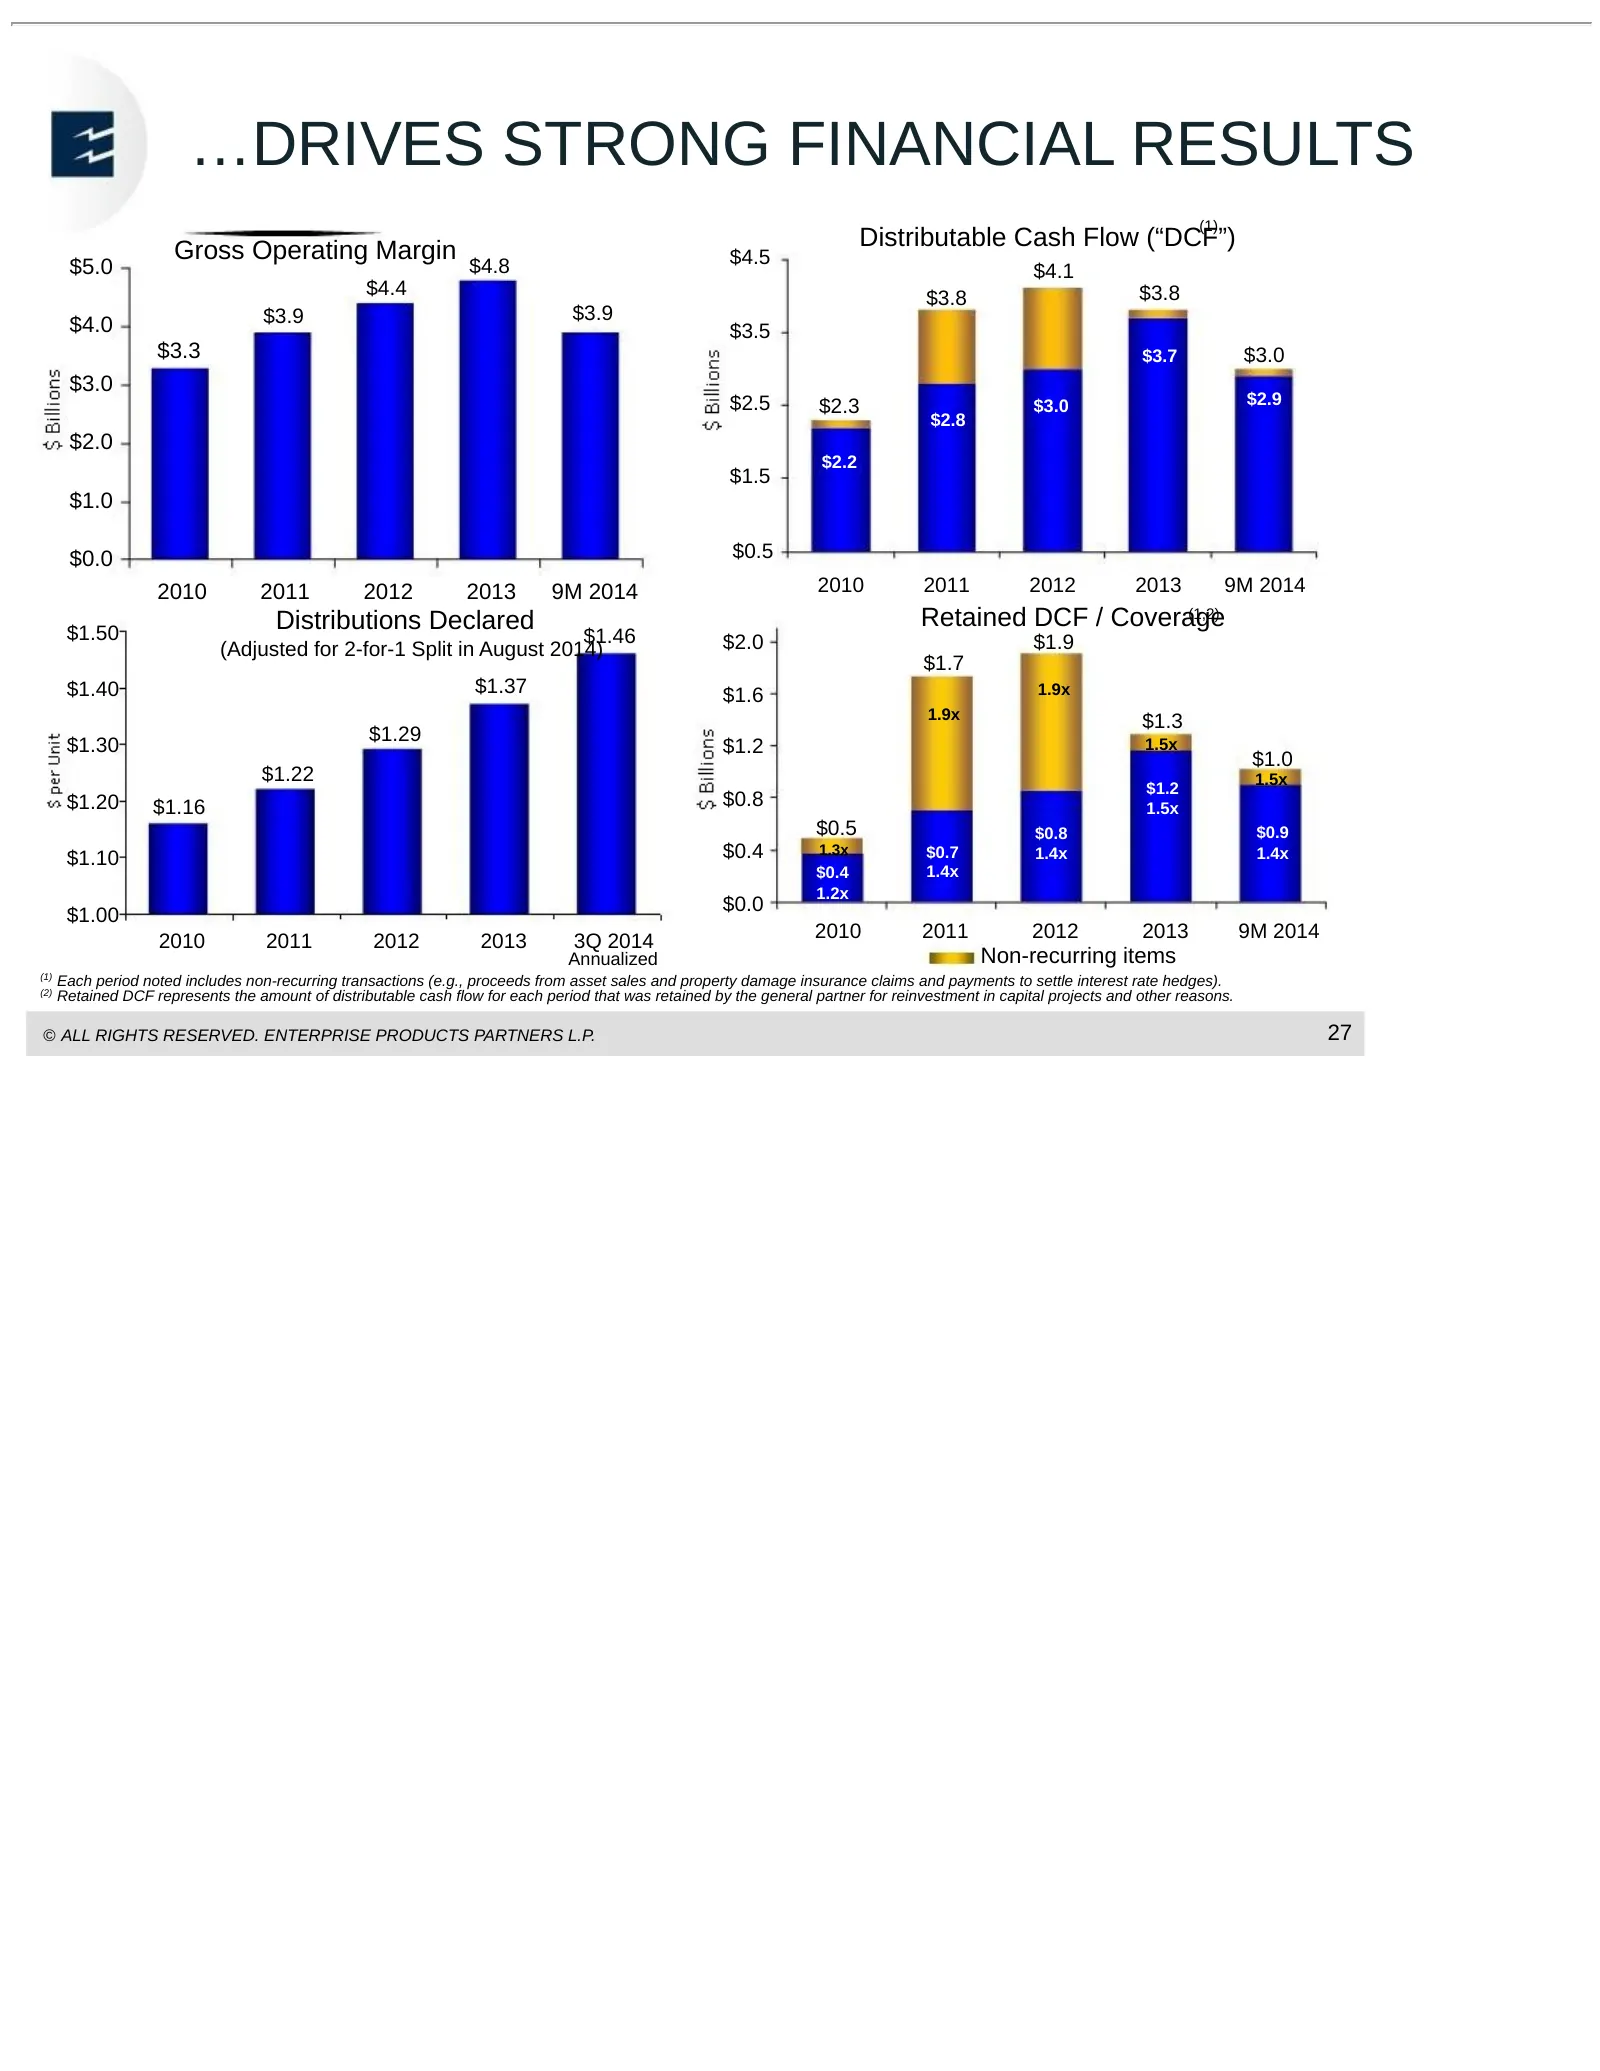
Slide 28: …Drives Strong Financial Results
…DRIVES STRONG FINANCIAL RESULTS (1) Gross Operating Margin Distributable Cash Flow (“DCF”) $5.0 $4.8 $4.5 $4.1 $4.4 $3.8 $3.8 $3.9 $3.9 $4.0 $3.5 $3.3 $3.7 $3.0 $3.0 $2.5 $2.3 $3.0 $2.9 $2.8 $2.0 $2.2 $1.5 $1.0 $0.0 $0.5 2010 2011 2012 2013 9M 2014 2010 2011 2012 2013 9M 2014 Distributions Declared
Slide 29: History of Financial Discipline While Executing Growth Strategy
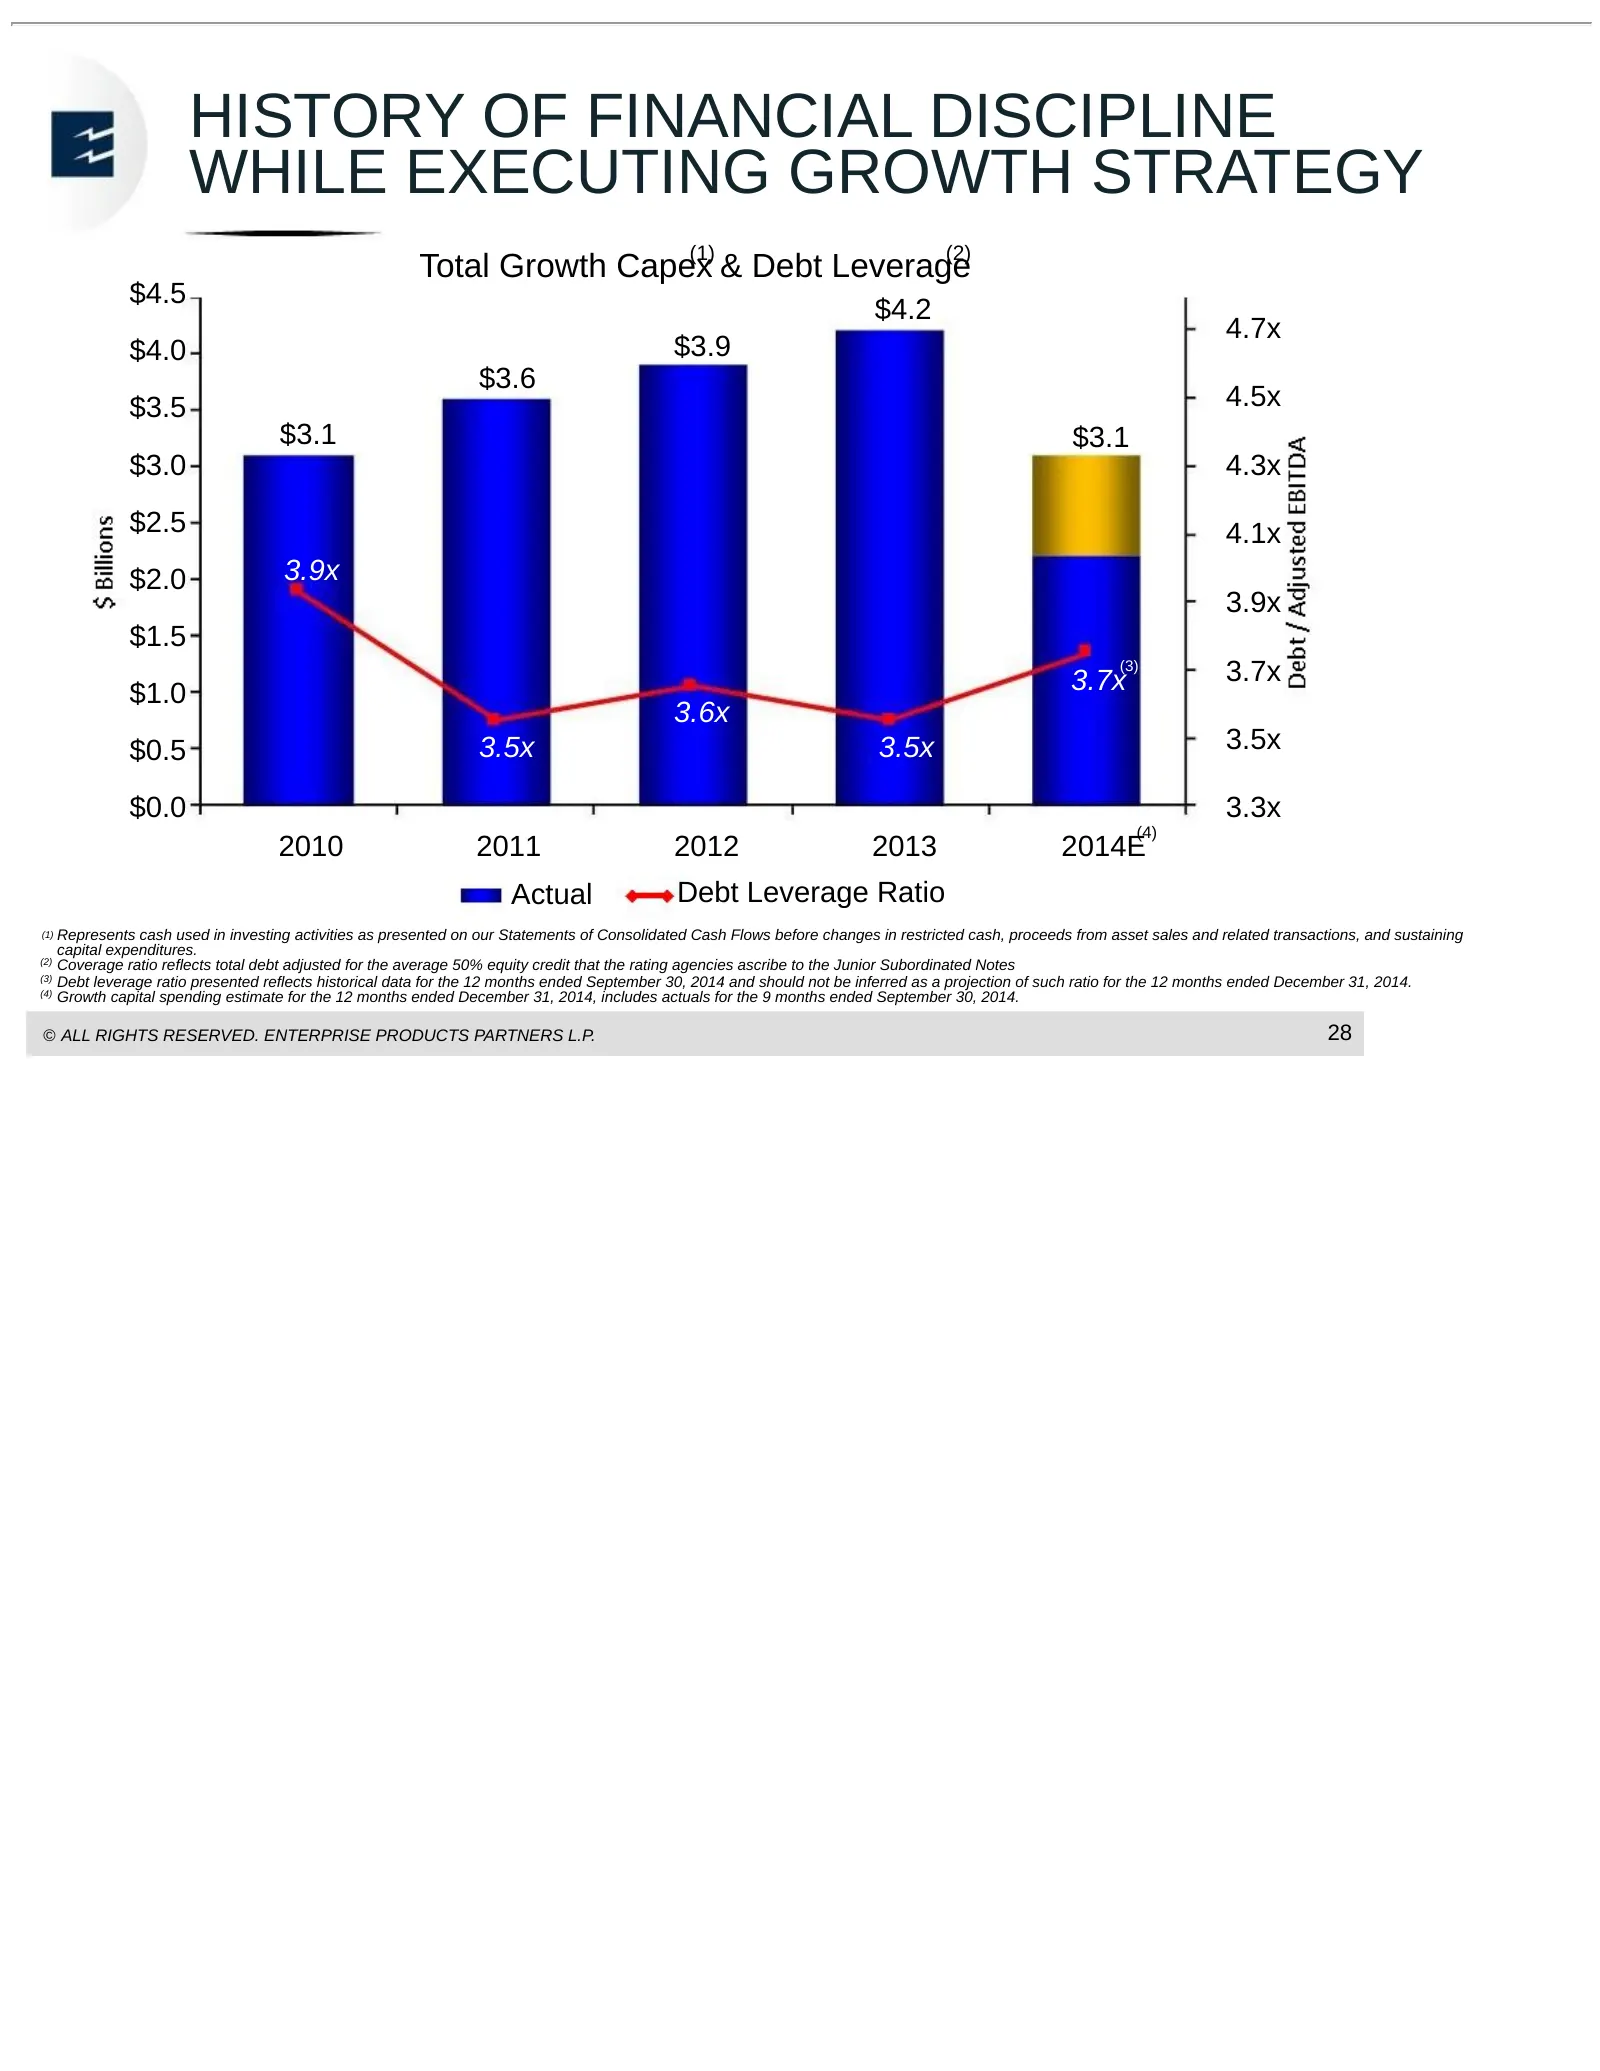
HISTORY OF FINANCIAL DISCIPLINE WHILE EXECUTING GROWTH STRATEGY (1) (2) Total Growth Capex & Debt Leverage $4.5 $4.2 4.7x $4.0 $3.9 $3.6 $3.5 4.5x $3.1 $3.1 $3.0 4.3x $2.5 4.1x $2.0 3.9x 3.9x $1.5 3.7x (3) 3.7x $1.0 3.6x $0.5 3.5x 3.5x 3.5x $0.0 3.3x (4) 2010 2011 2012 2013 2014E Actual Debt Leverag
Slide 30: Strengthening Debt Portfolio
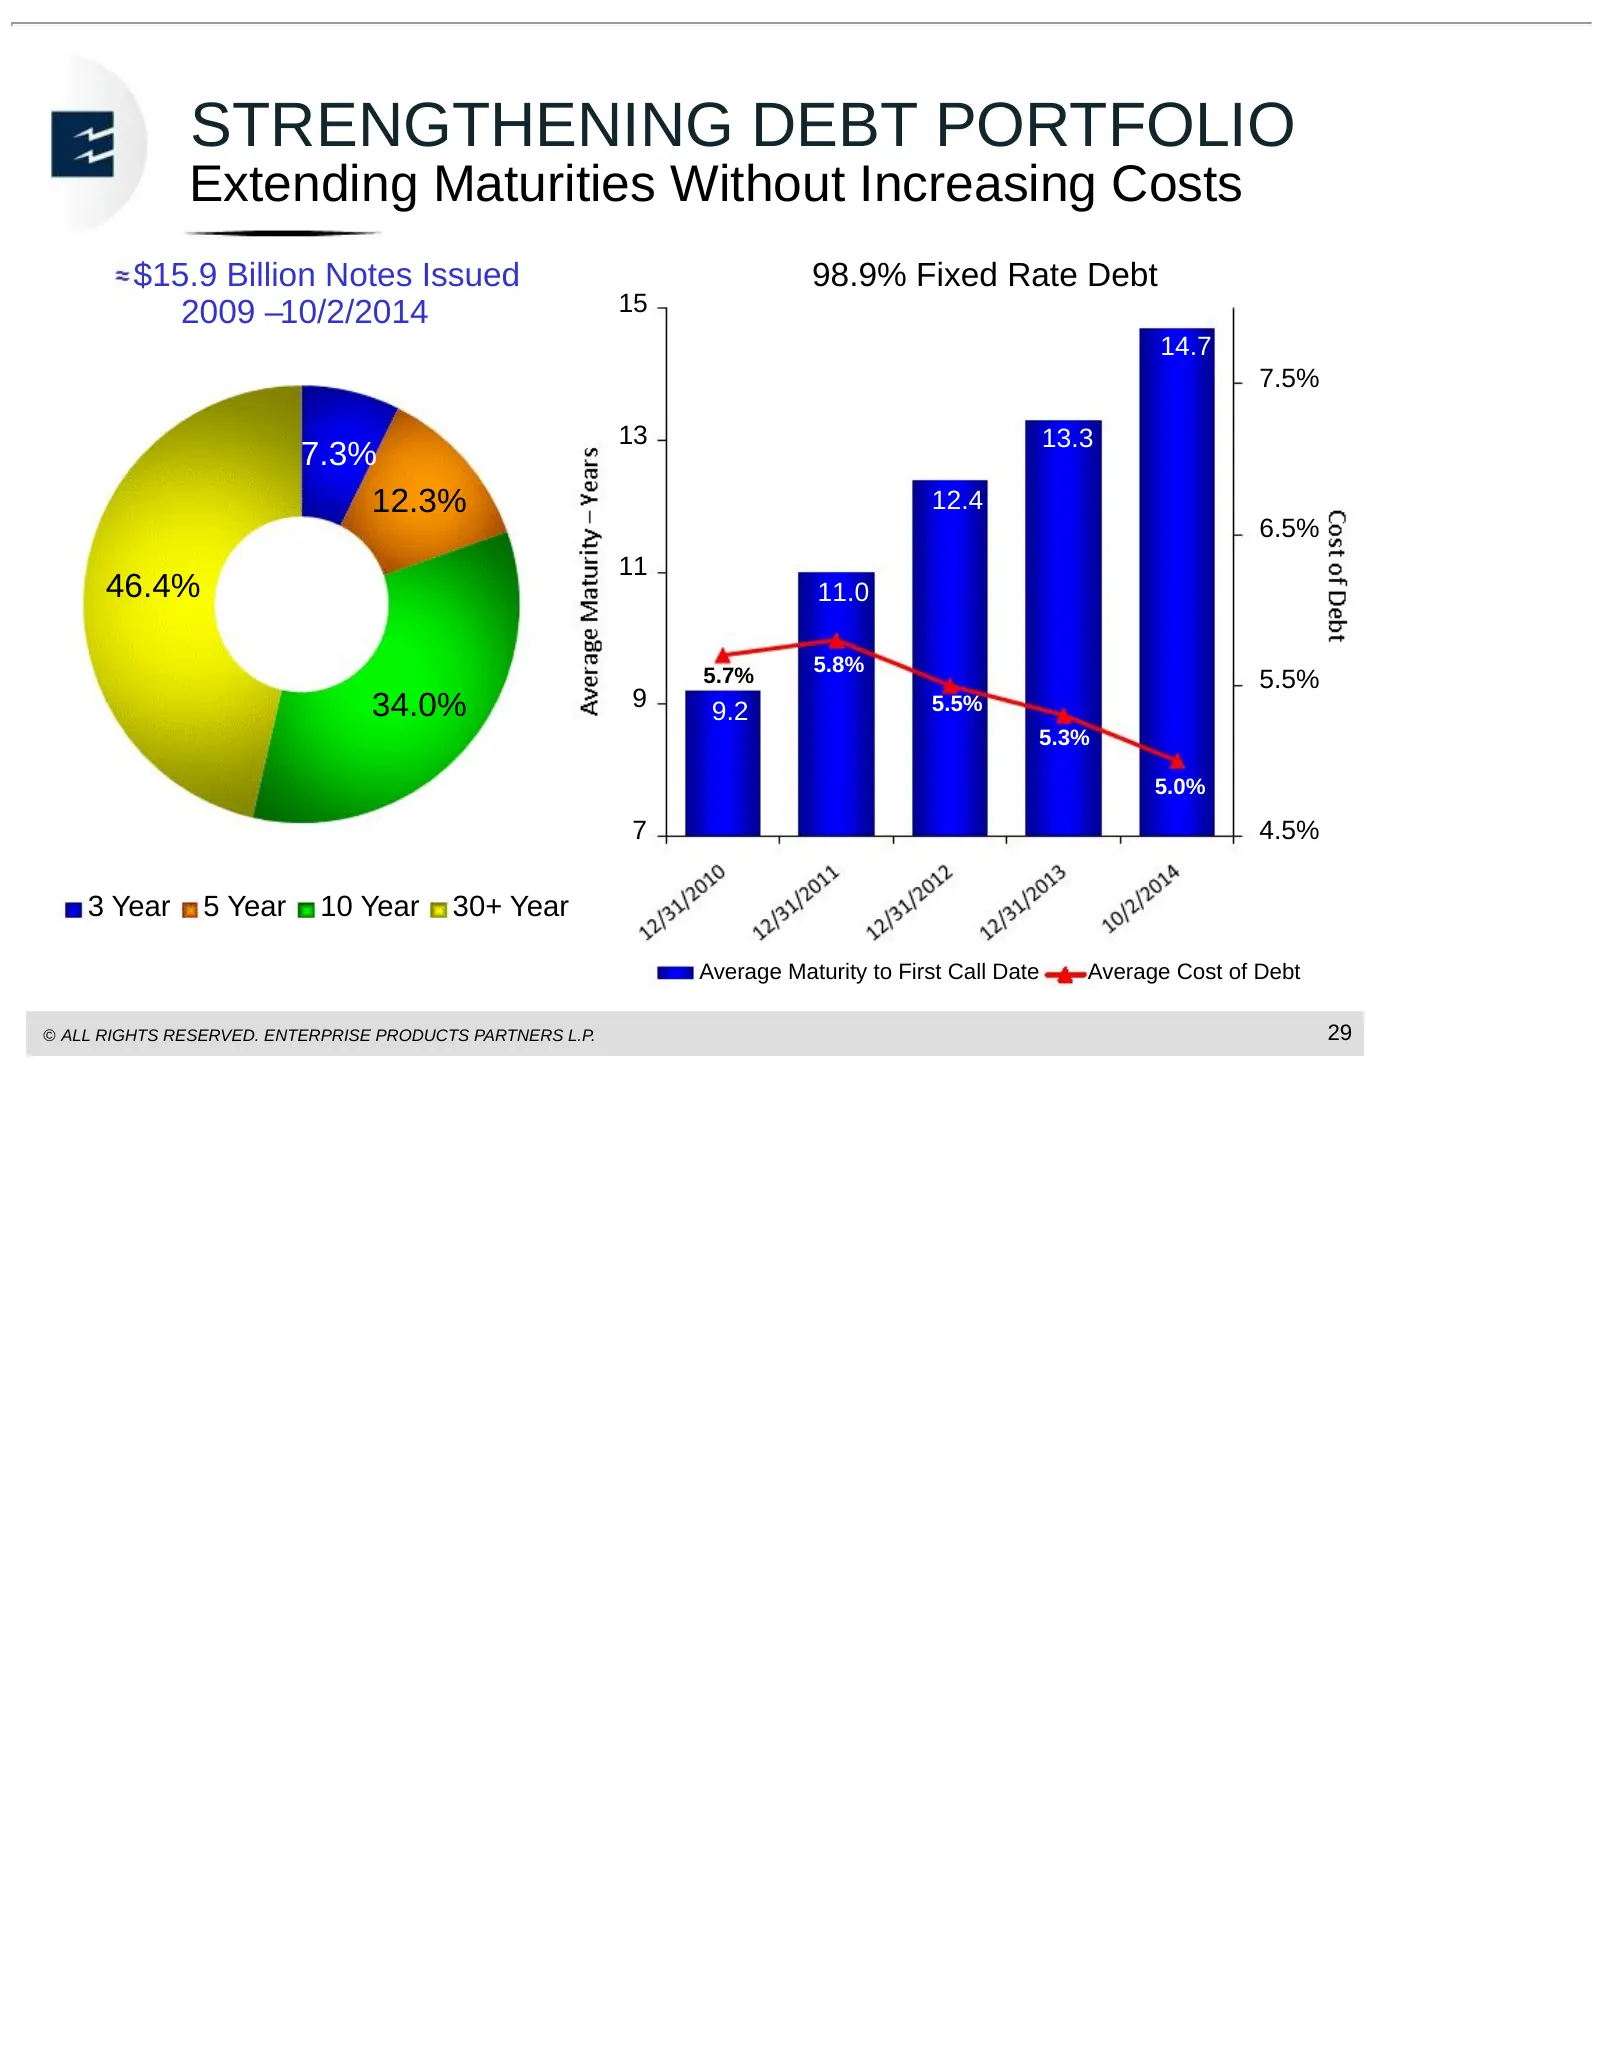
STRENGTHENING DEBT PORTFOLIO Extending Maturities Without Increasing Costs $15.9 Billion Notes Issued 98.9% Fixed Rate Debt 2009 –10/2/2014 15 14.7 7.5% 13 13.3 7.3% 12.3% 12.4 6.5% 11 46.4% 11.0 5.7% 5.8% 5.5% 34.0% 9 9.2 5.5% 5.3% 5.0% 7 4.5% 3 Year 5 Year 10 Year 30+ Year Average Maturity to Firs
Slide 31: EPD Total Return
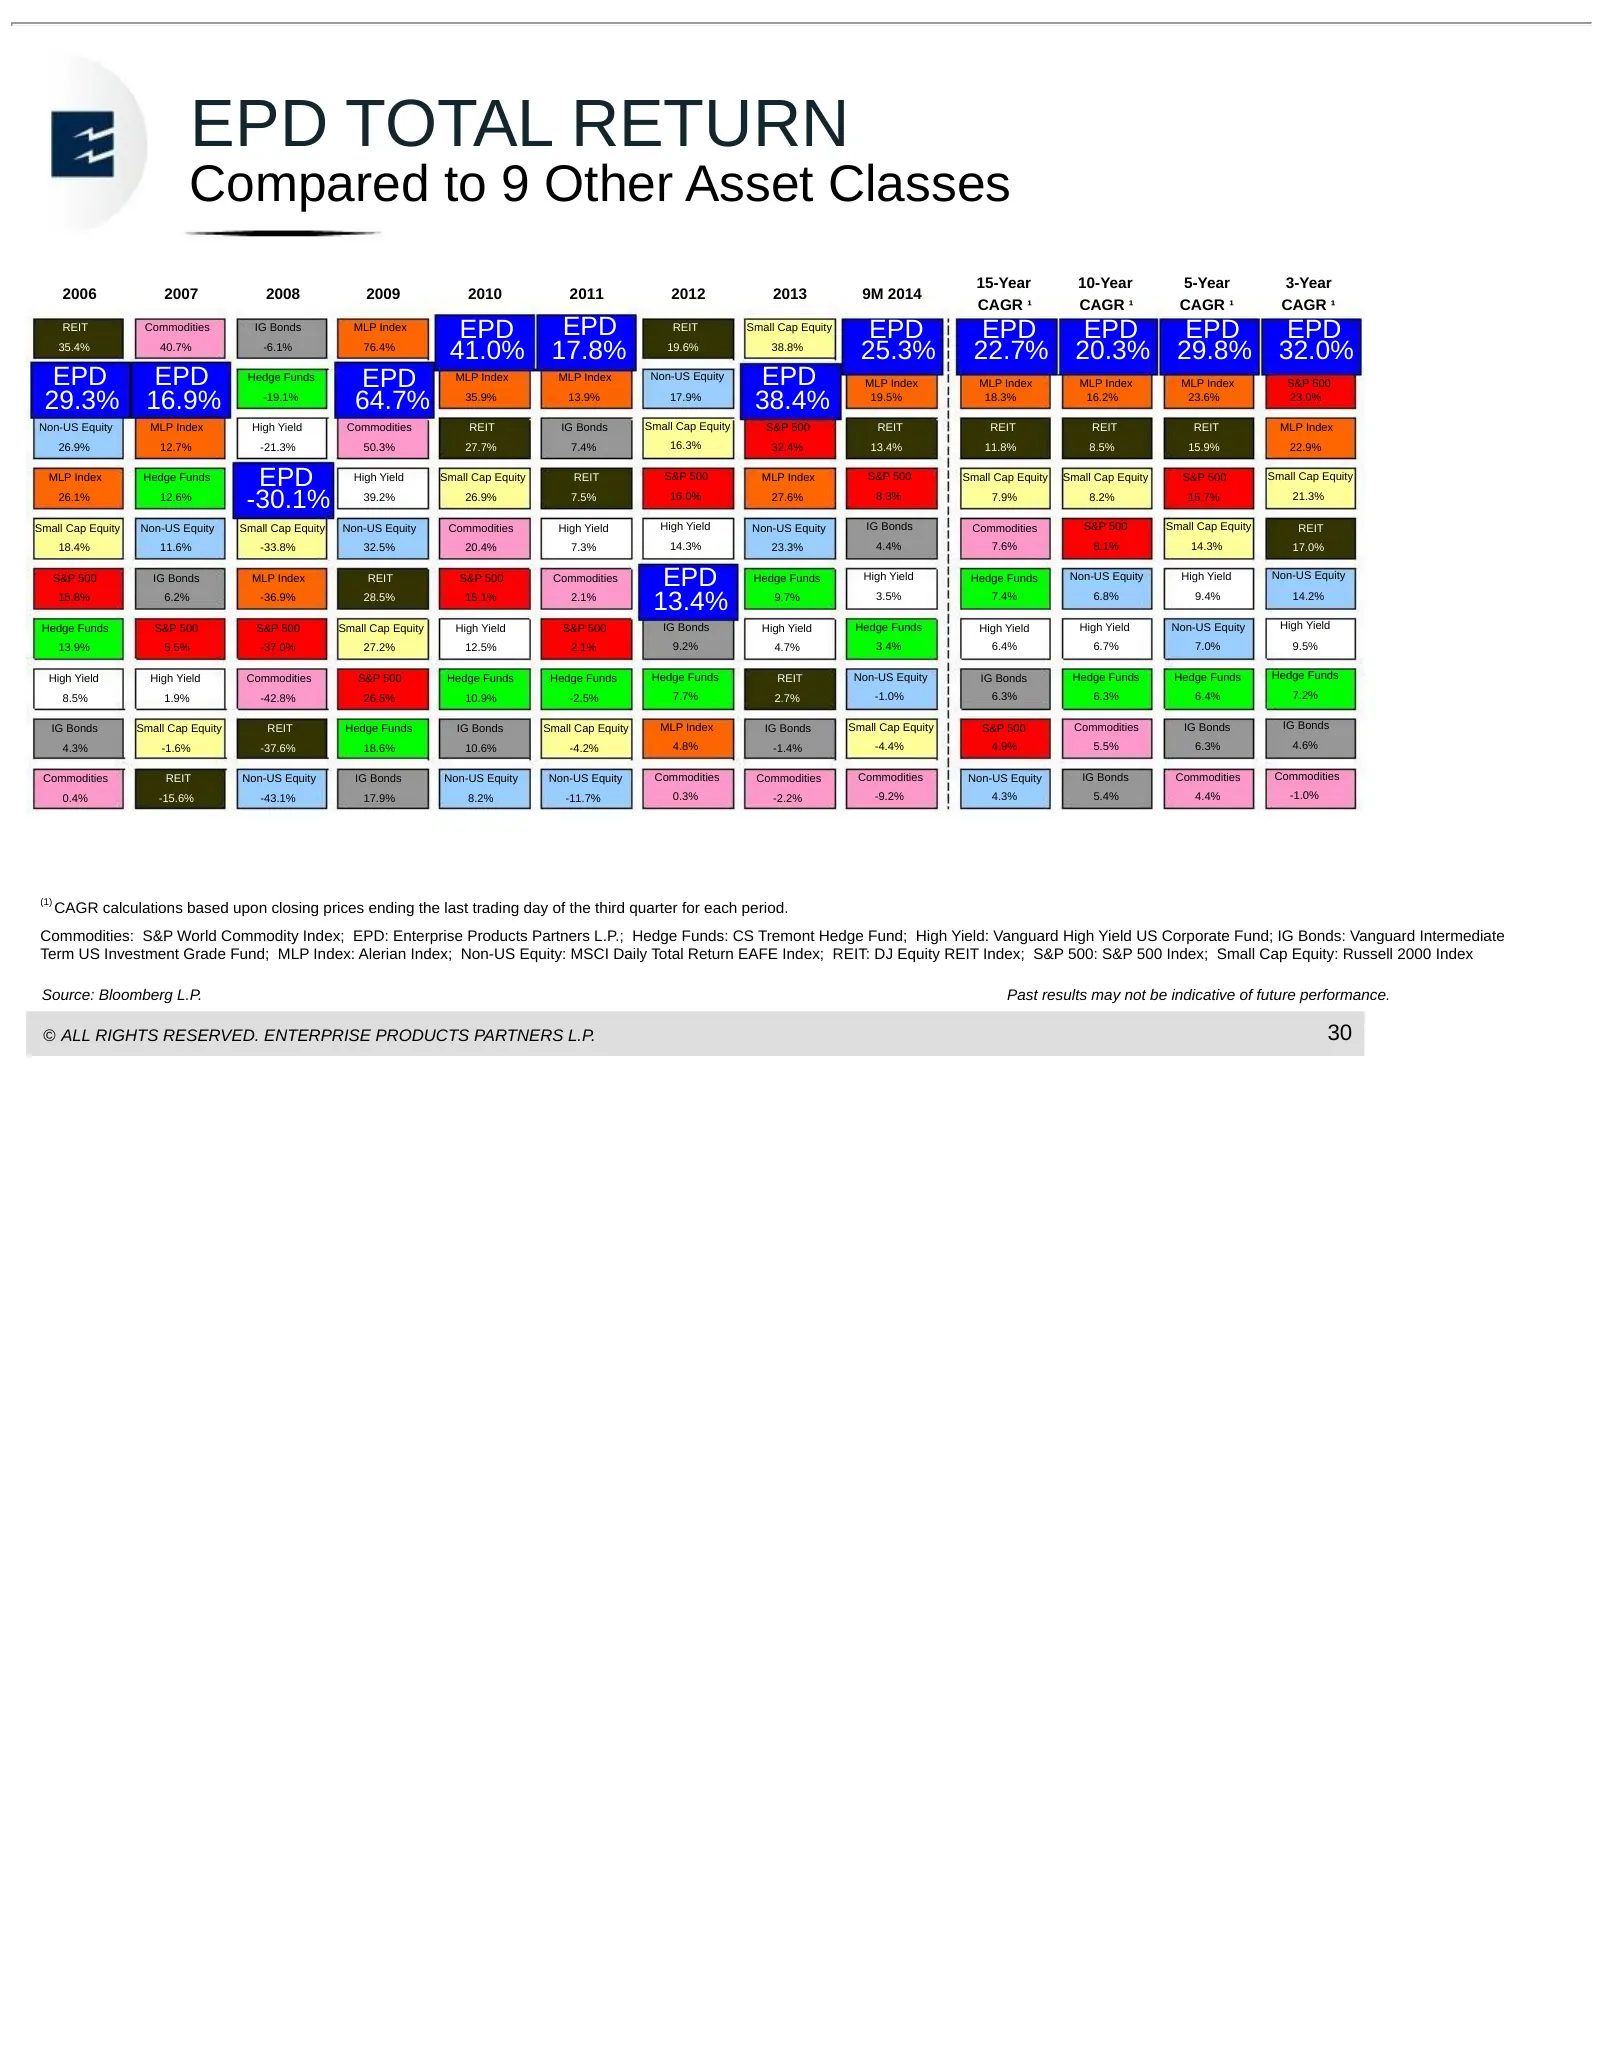
EPD TOTAL RETURN Compared to 9 Other Asset Classes 15-Year 10-Year 5-Year 3-Year 2006 2007 2008 2009 2010 2011 2012 2013 9M 2014 CAGR ¹ CAGR ¹ CAGR ¹ CAGR ¹ REIT Commodities IG Bonds MLP Index EPD EPD REIT Small Cap Equity EPD EPD EPD EPD EPD 35.4% 40.7% -6.1% 76.4% 41.0% 17.8% 19.6% 38.8% 25.3% 22.
Slide 32: Non-GAAP Reconciliations
NON–GAAP RECONCILIATIONS © ALL RIGHTS RESERVED. ENTERPRISE PRODUCTS PARTNERS L.P. enterpriseproducts.com
Slide 33: Gross Operating Margin
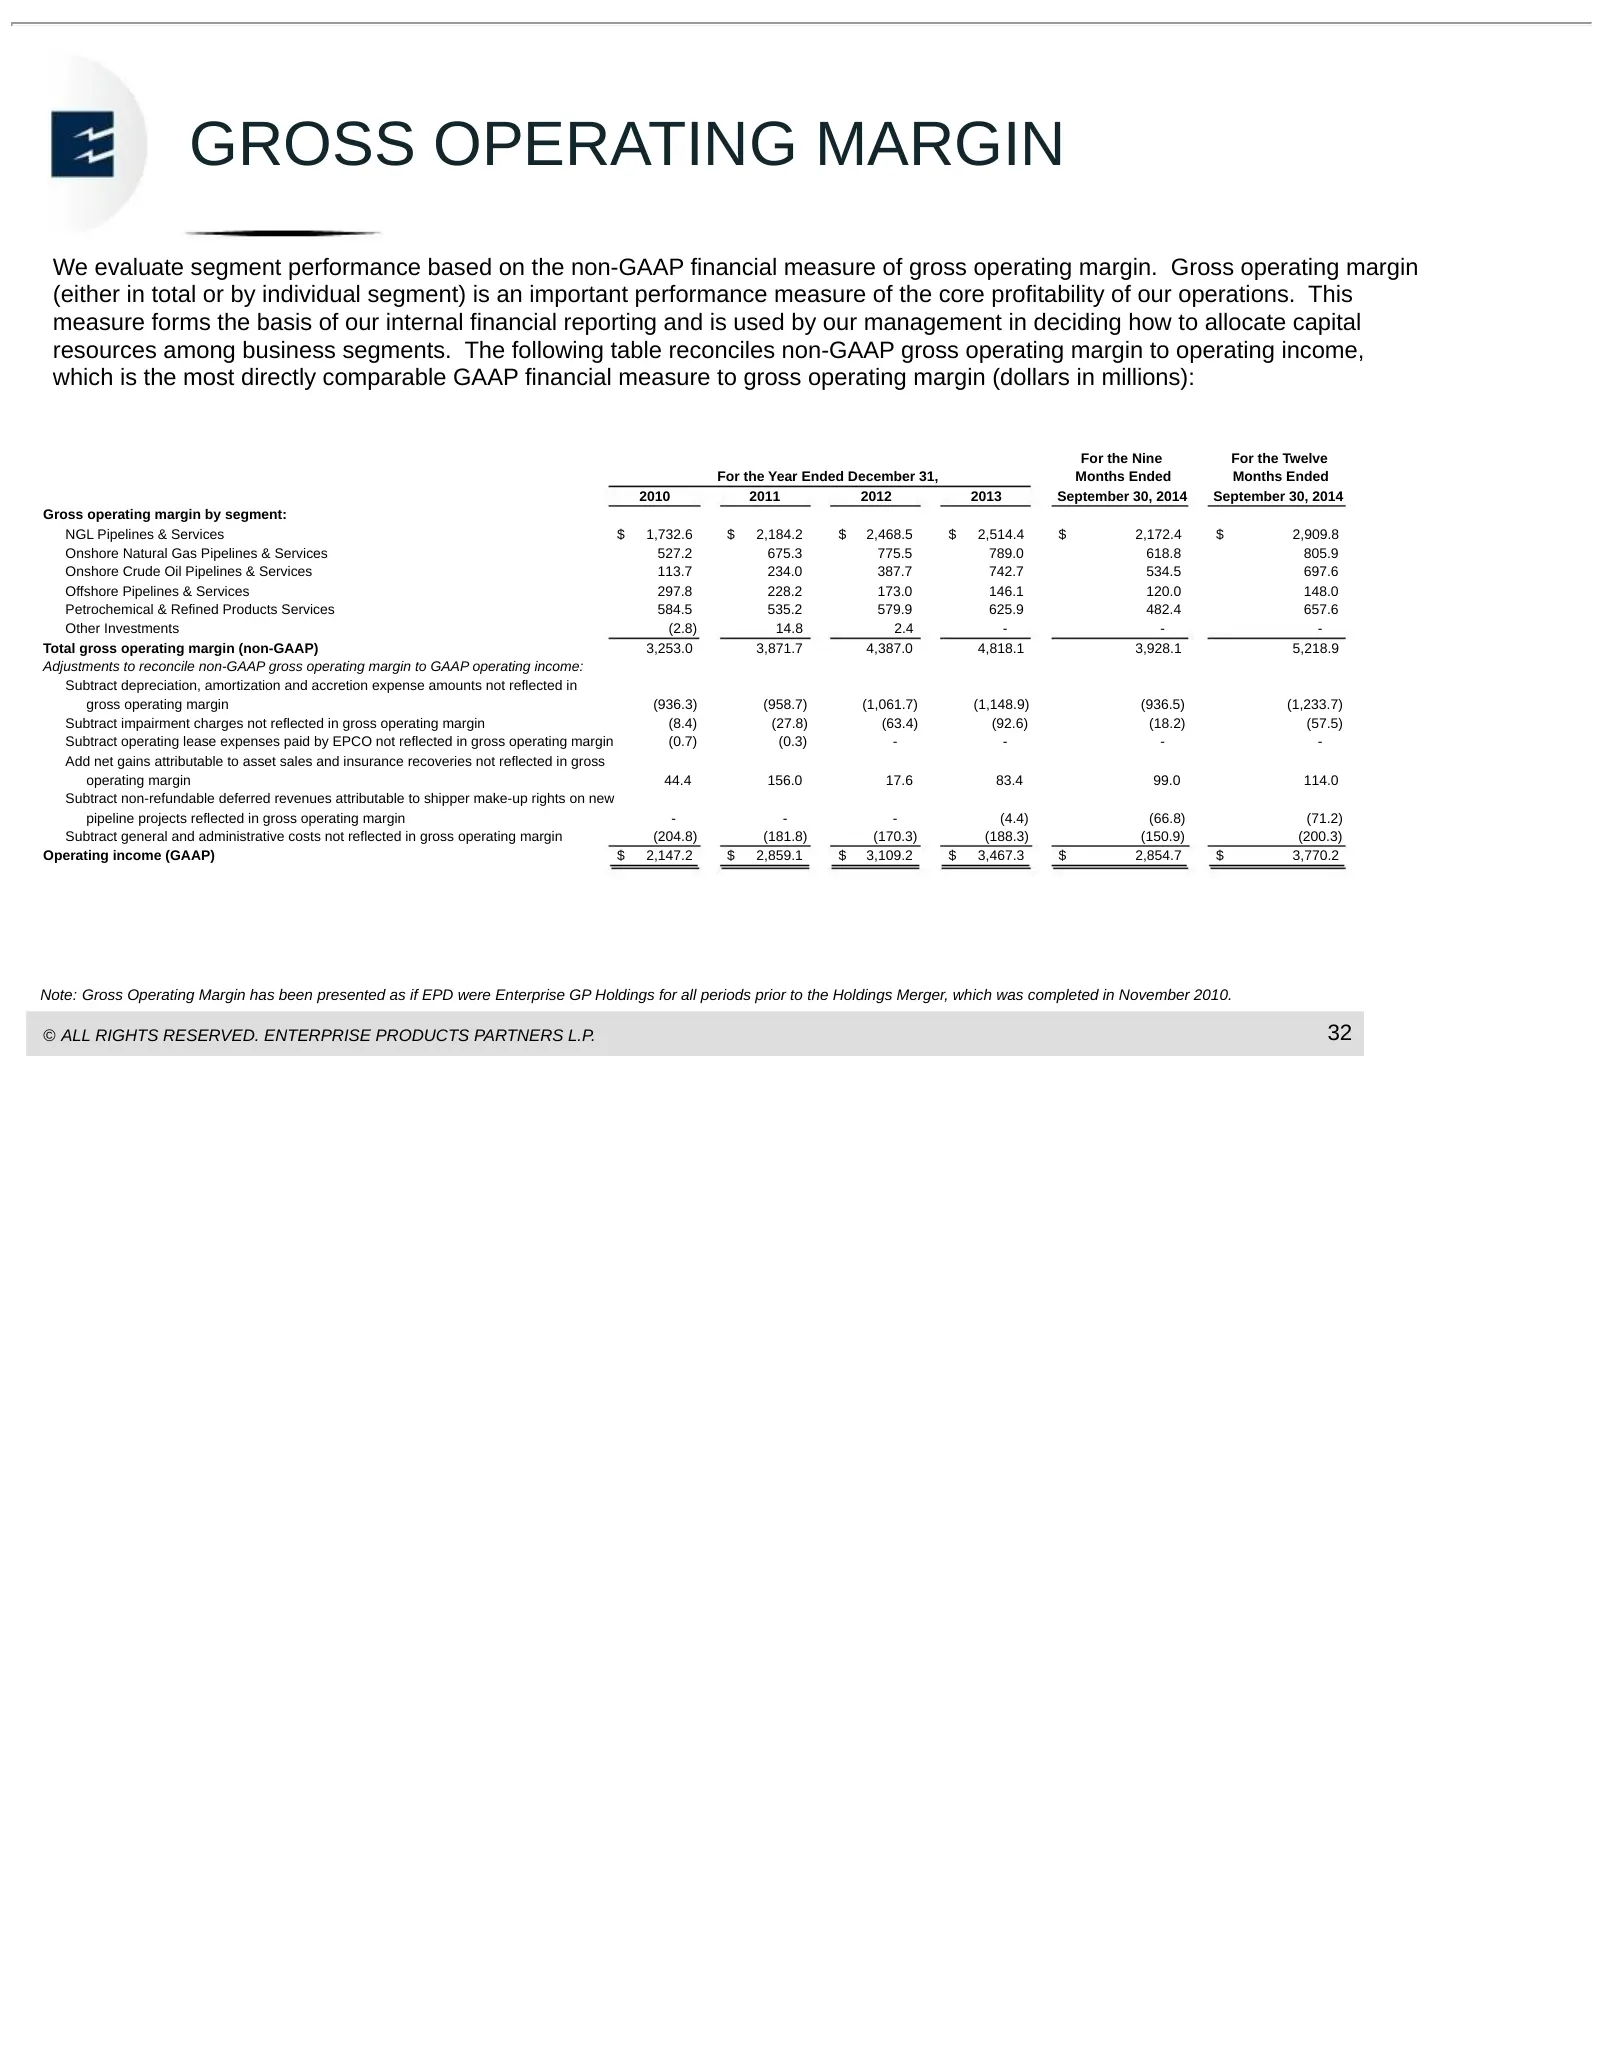
GROSS OPERATING MARGIN We evaluate segment performance based on the non-GAAP financial measure of gross operating margin. Gross operating margin (either in total or by individual segment) is an important performance measure of the core profitability of our operations. This measure forms the basis of
Slide 34: Adjusted EBITDA
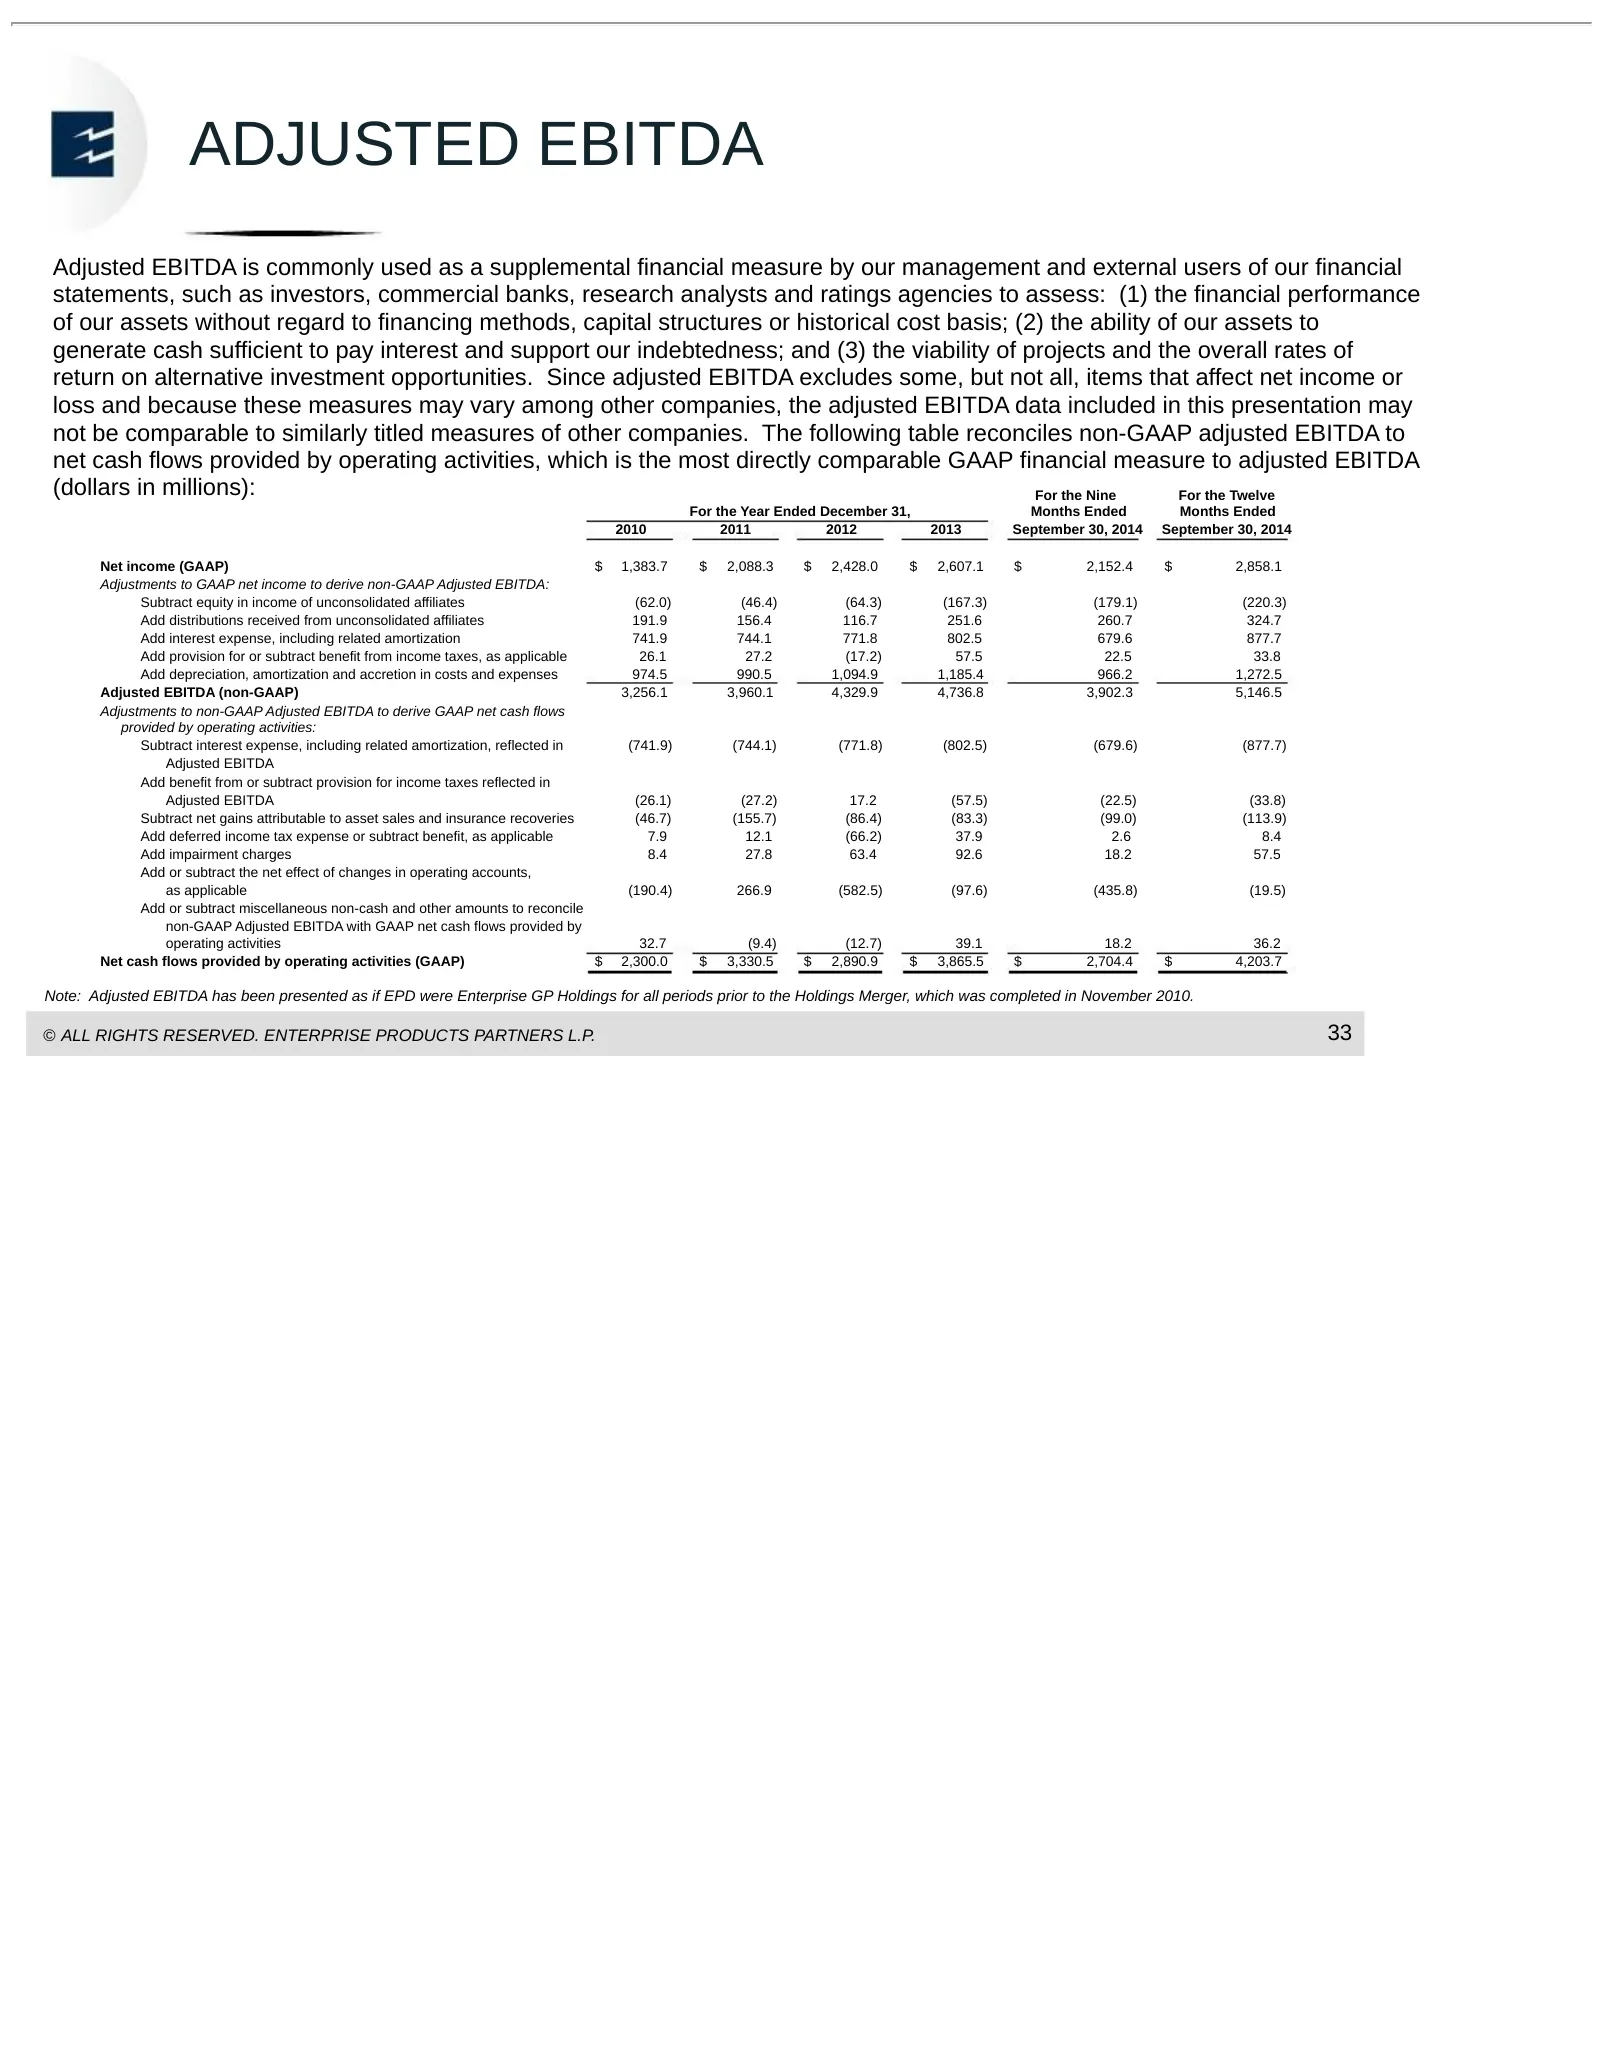
ADJUSTED EBITDA Adjusted EBITDA is commonly used as a supplemental financial measure by our management and external users of our financial statements, such as investors, commercial banks, research analysts and ratings agencies to assess: (1) the financial performance of our assets without regard to
Slide 35: Distributable Cash Flow
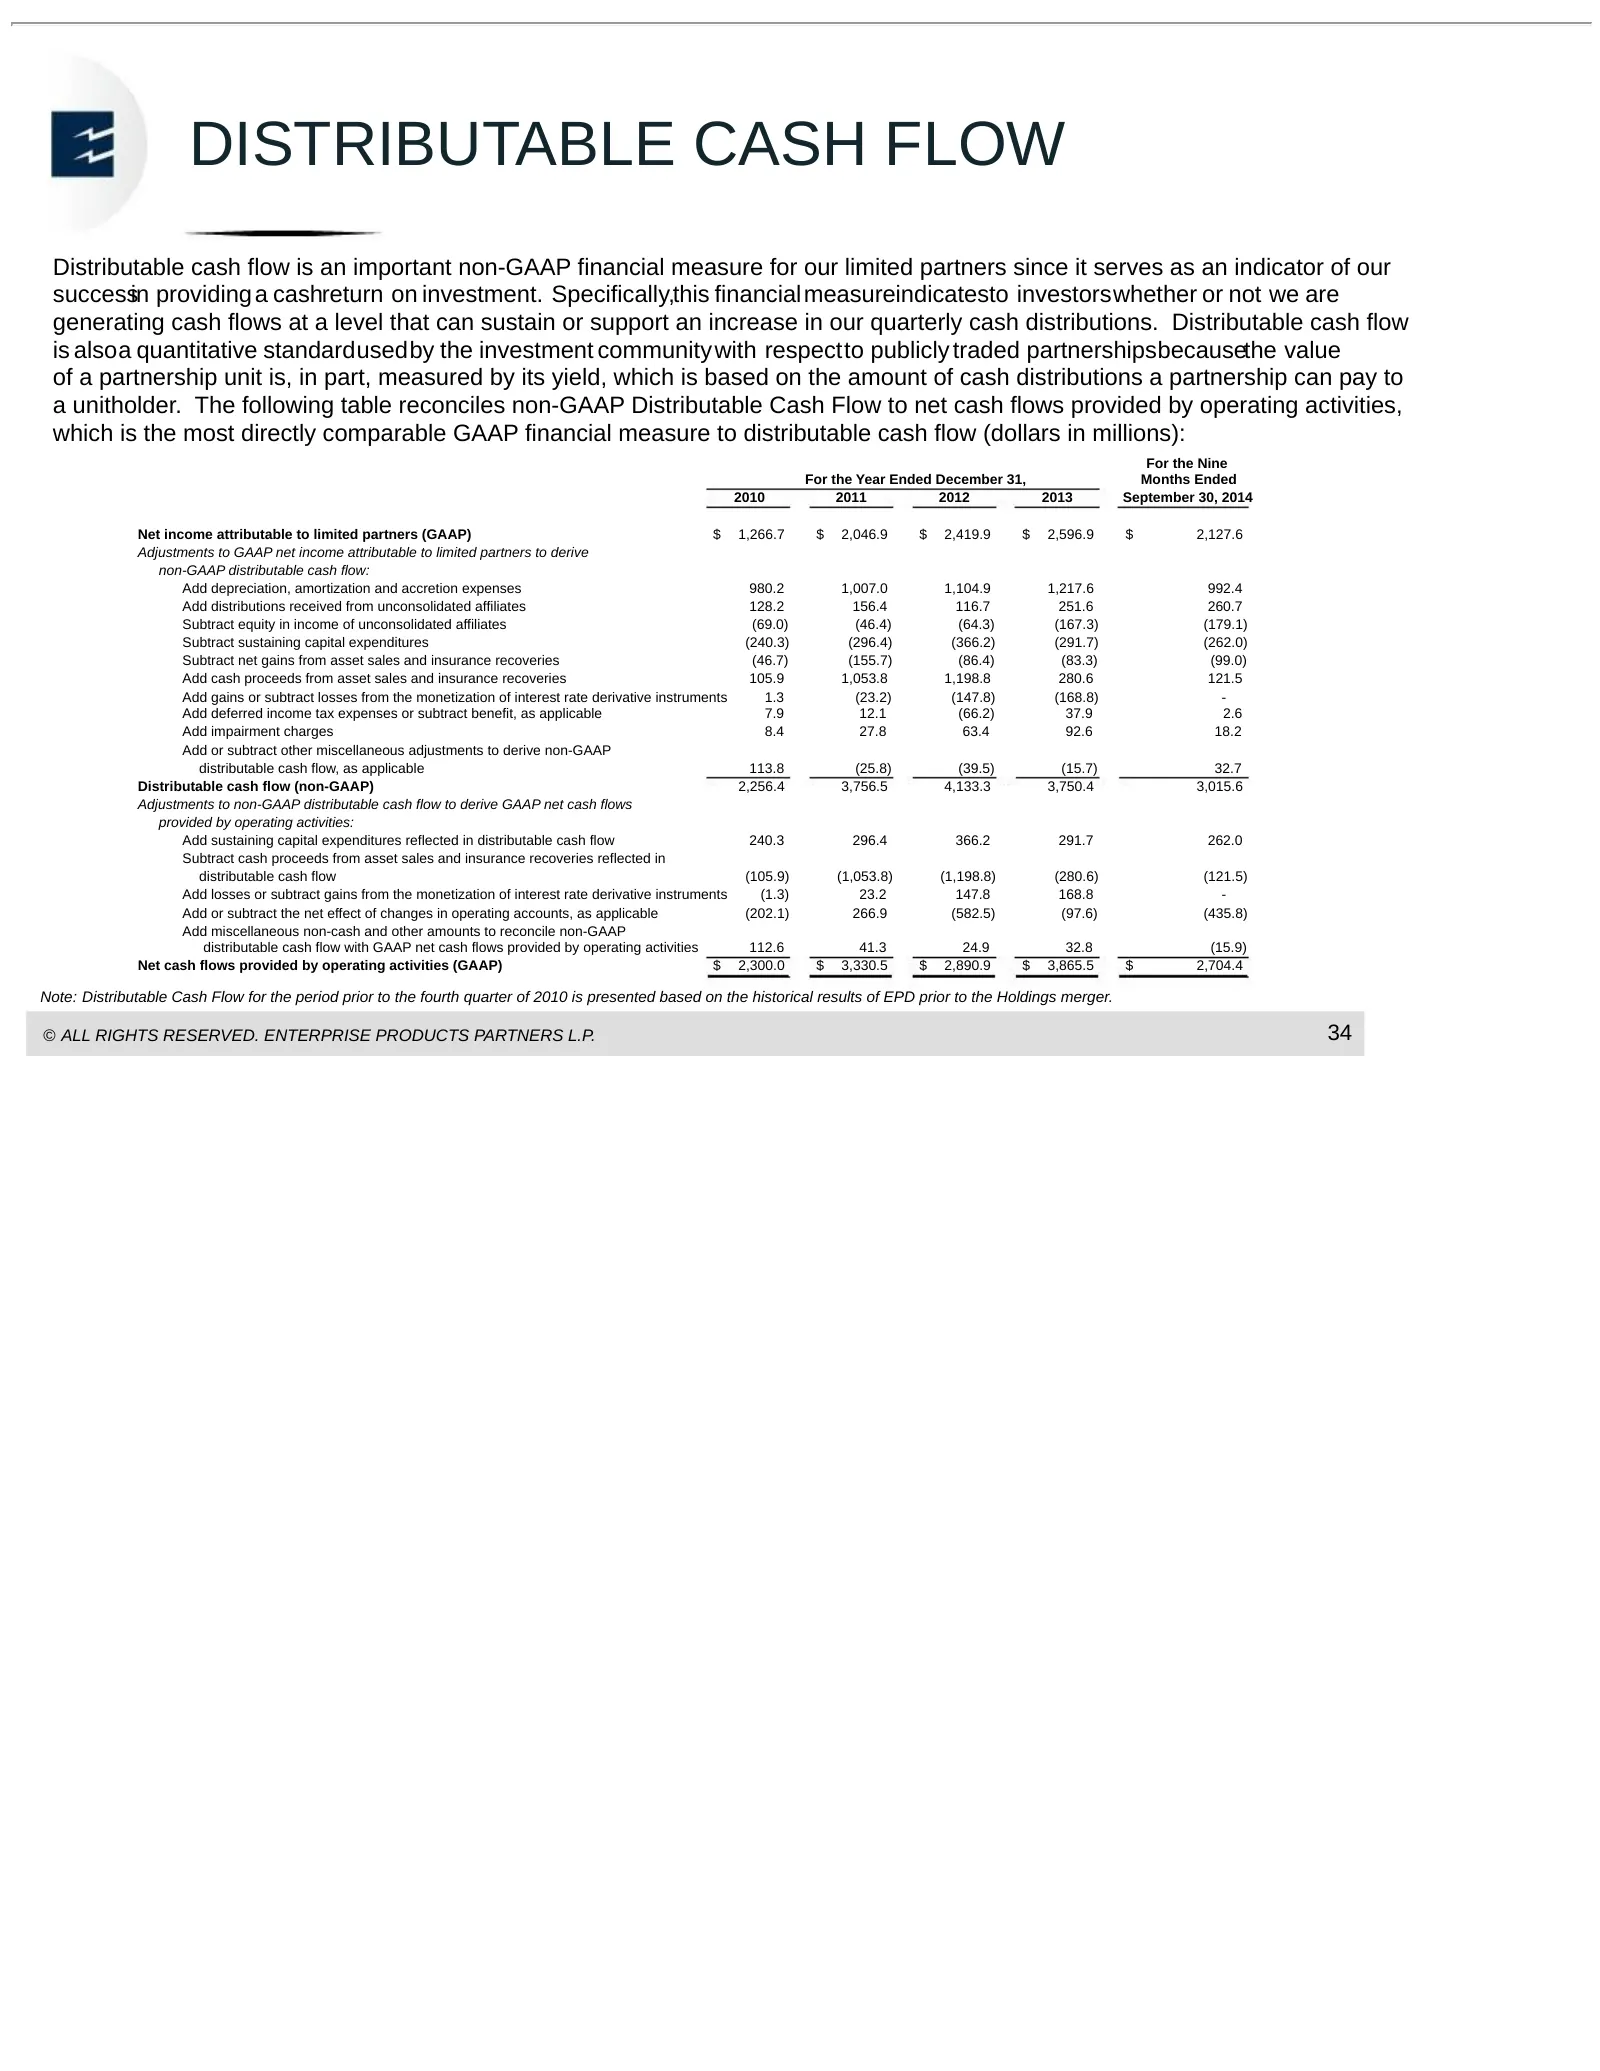
DISTRIBUTABLE CASH FLOW Distributable cash flow is an important non-GAAP financial measure for our limited partners since it serves as an indicator of our successin providing a cashreturn on investment. Specifically,this financialmeasureindicatesto investorswhether or not we are generating cash flow

Slide 36: Contact Information
CONTACT INFORMATION Randy Burkhalter – Vice President, Investor Relations • (713) 381-6812 • [email protected] © ALL RIGHTS RESERVED. ENTERPRISE PRODUCTS PARTNERS L.P. 35
Source: SEC EDGAR · 425 filed Nov 19, 2014