Hudson City Bancorp — Financial Institutions Investor Conference 2006
26 slides from Hudson City Bancorp's conference presentation, Dec 7, 2006
Slide 1: Financial Institutions Investor Conference, December 7, 2006
- - Financial Institutions Investor Conference, December 7, 2006
Slide 2: Forward-Looking Statements
Forward-Looking Statements This presentation may contain forward-looking statements within the meaning of the Private Securities Litigation Reform Act of 1995. These forward-looking statements include, but are not limited to, statements about (i) the benefits of the merger between Hudson City Bancor
Slide 3: Overview & Strategy
oe Se eee Overview & Strategy
Slide 4: Overview
Overview 110 branch locations (including Sound Federal acquisition effective July 14, 2006): 88 in New Jersey, 18 in New York and 4 in Connecticut "First-step" conversion in July 1999, selling 47% and raising $541 million and completed "second-step" conversion on June 7, 2005 raising $3.9 billion Th
Slide 5: Operating Model
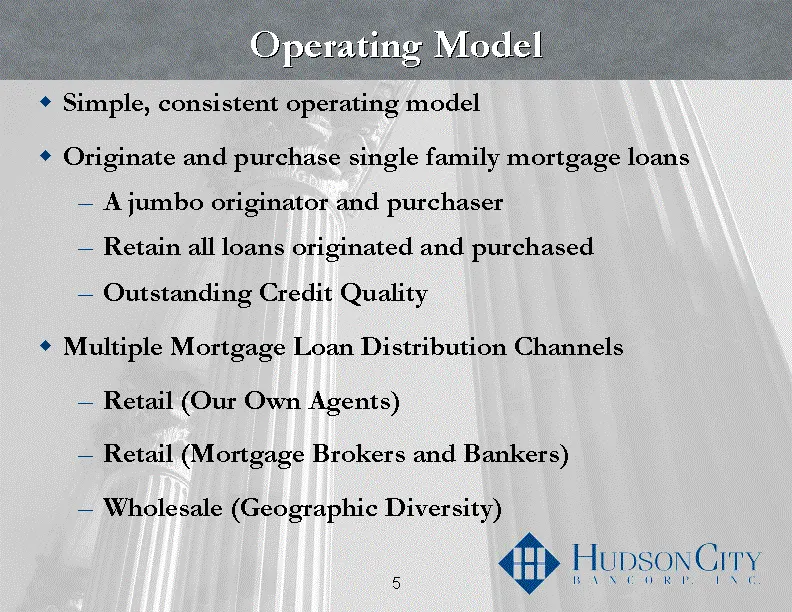
Operating Model Simple, consistent operating model Originate and purchase single family mortgage loans A jumbo originator and purchaser Retain all loans originated and purchased Outstanding Credit Quality Multiple Mortgage Loan Distribution Channels Retail (Our Own Agents) Retail (Mortgage Brokers a
Slide 6: Strategy: Focused Growth
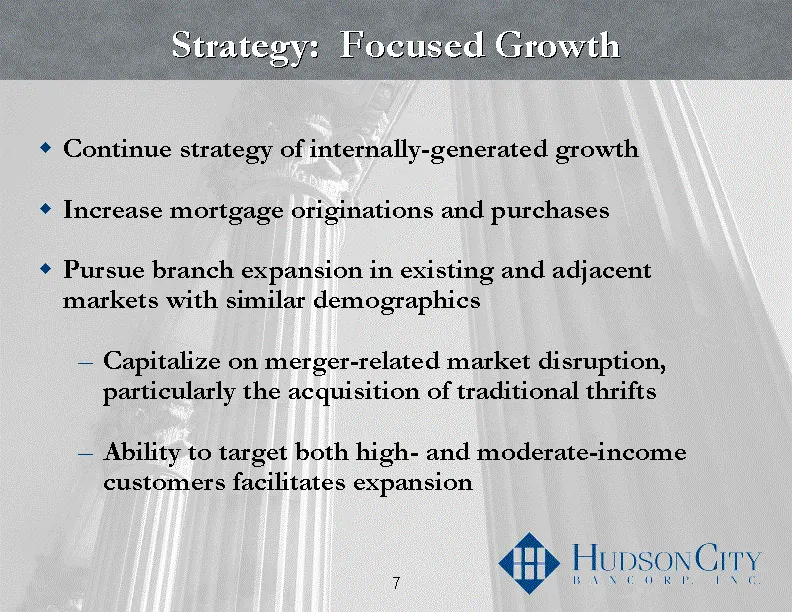
Strategy: Focused Growth Continue strategy of internally-generated growth Increase mortgage originations and purchases Pursue branch expansion in existing and adjacent markets with similar demographics Capitalize on merger-related market disruption, particularly the acquisition of traditional thrift
Slide 7: Successful Acquisition of Sound Federal
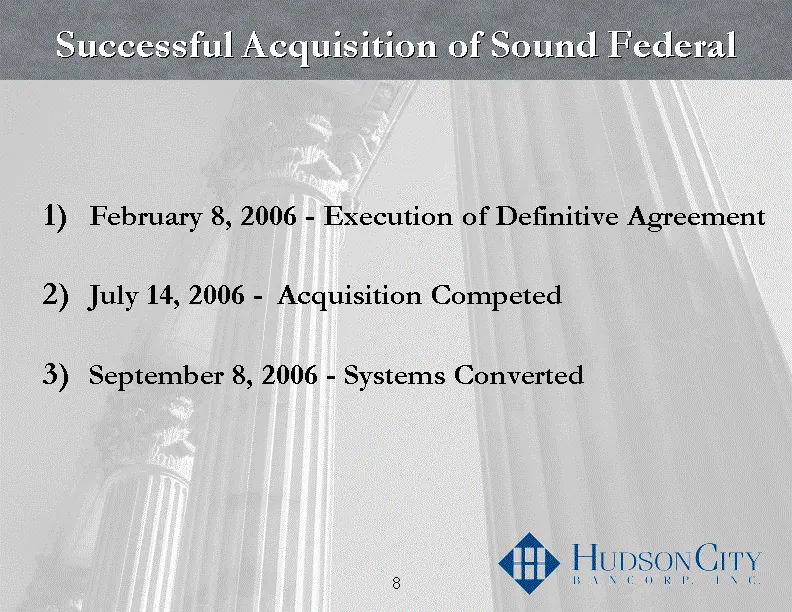
Successful Acquisition of Sound Federal February 8, 2006 - Execution of Definitive Agreement July 14, 2006 - Acquisition Competed September 8, 2006 - Systems Converted
Slide 8: Attractive and Complementary Branch Network
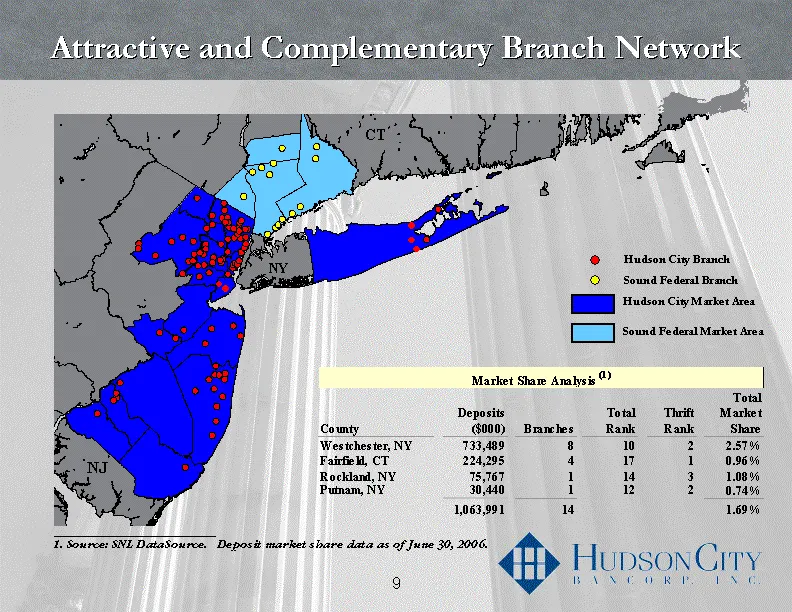
Attractive and Complementary Branch Network ___________________________ Source: SNL DataSource. Deposit market share data as of June 30, 2006. Hudson City Market Area Sound Federal Market Area Hudson City Branch Sound Federal Branch NY
Slide 9: Strong Growth in New Markets
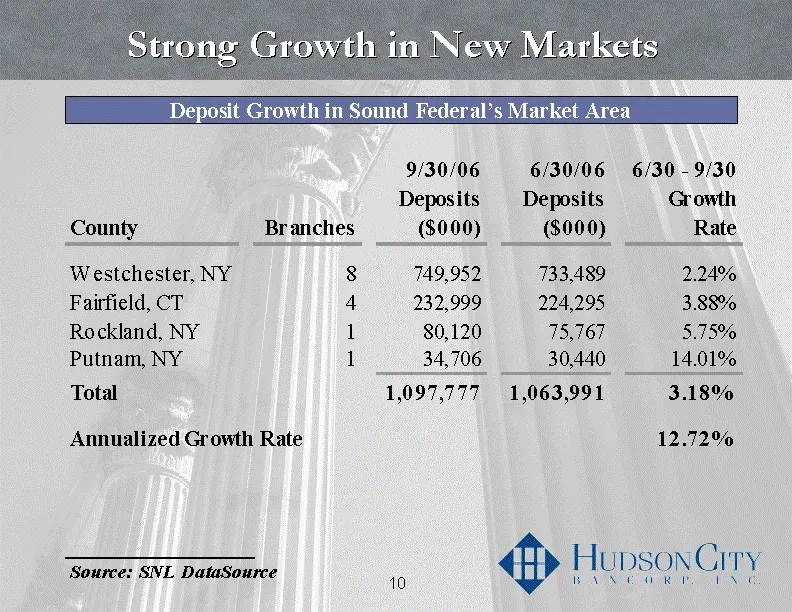
Strong Growth in New Markets hin Sound Federal’ 9/30/06 6/30/06 6/30 - 9/30 Deposits Deposits Growth County Branches ($000) ($000) Rate Westchester, NY 8 749,952 733,489 2.24% Fairfield, CT 4 232,999 224,295 3.88% Rockland, NY 1 80,120 75,767 5.75% Putnam, NY 1 34,706 30,440 14.01% Total 1,097,777 1
Slide 10: Strong Growth in New Markets
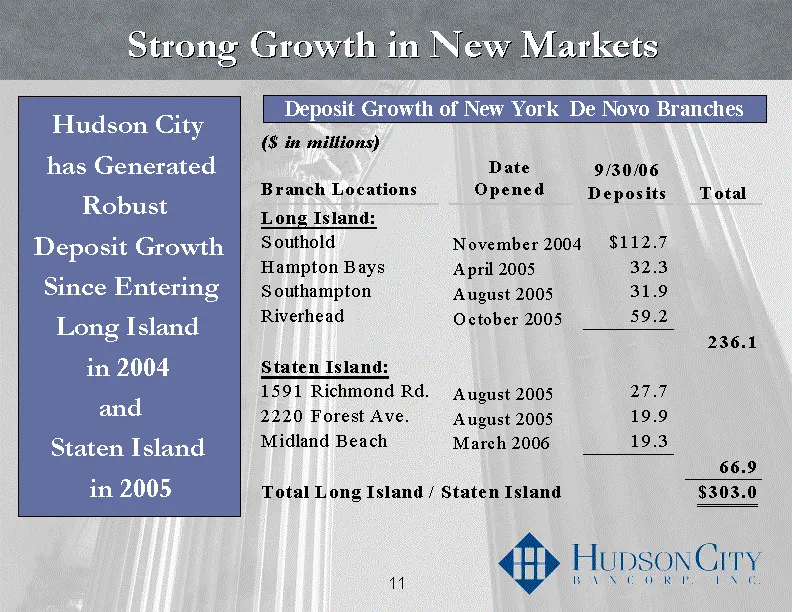
Strong Growth in New Markets Hudson City has Generated Robust Deposit Growth Since Entering Long Island in 2004 and Staten Island in 2005
Slide 11: Expanded Presence in Desirable Markets
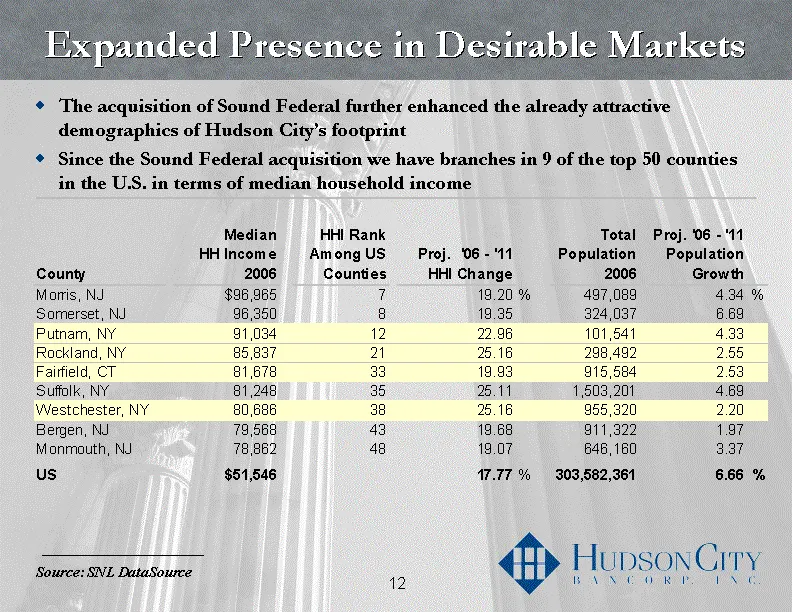
Expanded Presence in Desirable Markets The acquisition of Sound Federal further enhanced the already attractive demographics of Hudson City's footprint Since the Sound Federal acquisition we have branches in 9 of the top 50 counties in the U.S. in terms of median household income ___________________
Slide 12: Hudson City's Financial Review
Hudson City's Financial Review 25
Slide 13: Strong Asset Growth
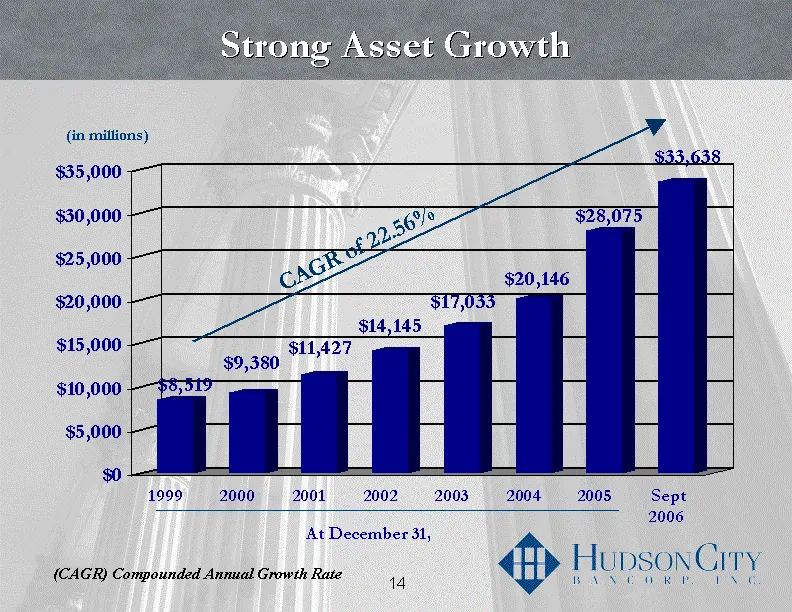
Strong Asset Growth (in millions) At December 31, (CAGR) Compounded Annual Growth Rate 27
Slide 14: Residential Mortgage Lending Growth
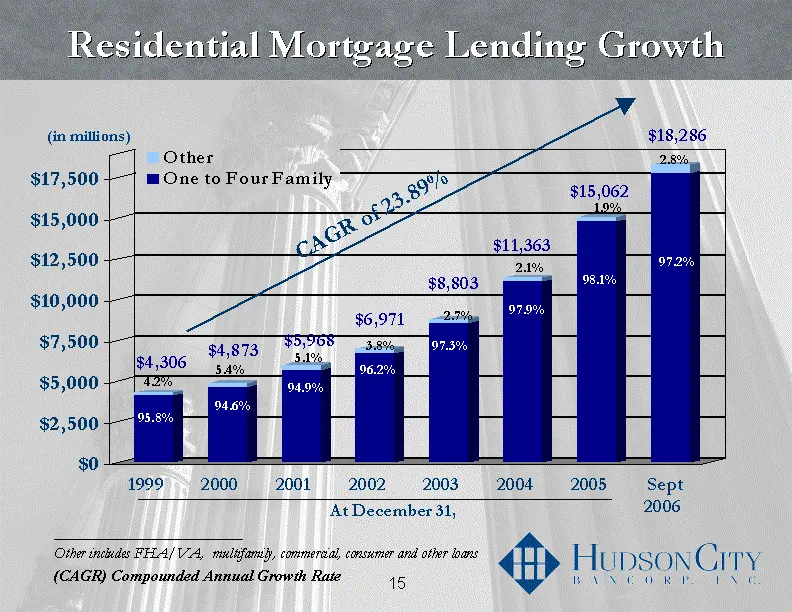
Residential Mortgage Lending Growth 29
Slide 15: Conservative Loan Underwriting
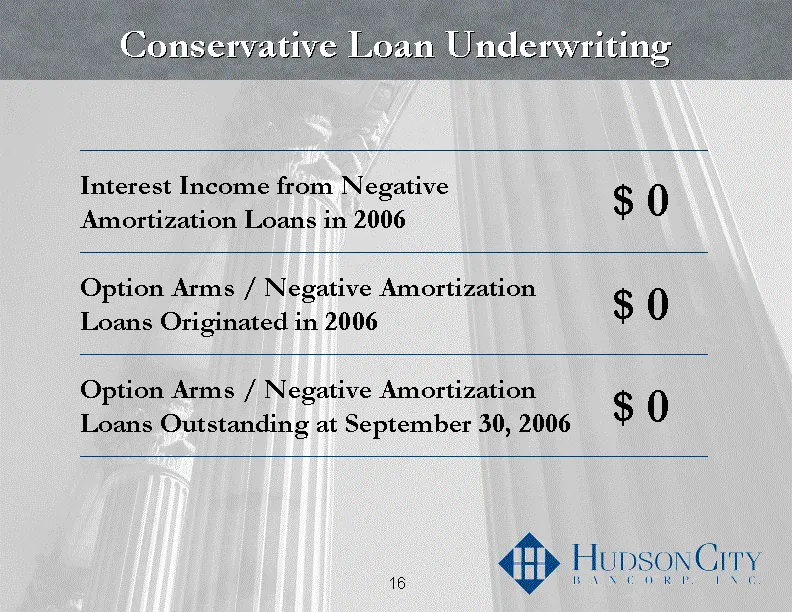
Conservative Loan Underwriting Interest Income from Negative Amortization Loans in 2006 $ 0 Option Arms / Negative Amortization Loans Originated in 2006 $ 0 Option Arms / Negative Amortization Loans Outstanding at September 30, 2006 $ 0
Slide 16: Consistently Superior Credit Quality
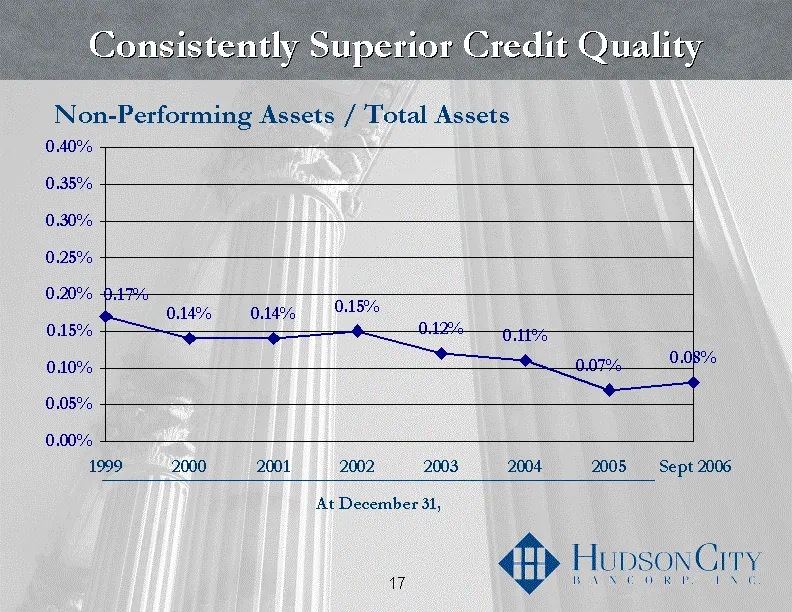
Consistently Superior Credit Quality Non-Performing Assets / Total Assets At December 31,
Slide 17: Industry-Leading Operational Efficiency
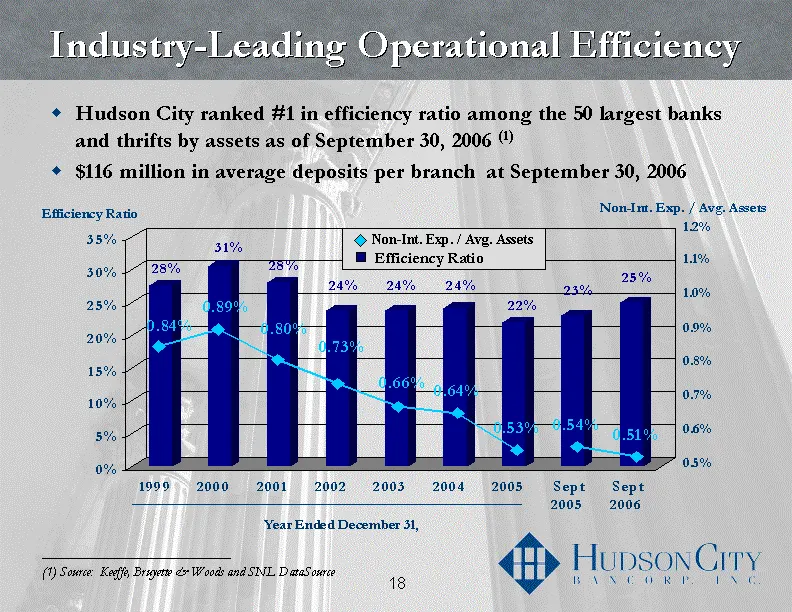
Industry-Leading Operational Efficiency Hudson City ranked #1 in efficiency ratio among the 50 largest banks and thrifts by assets as of September 30, 2006 (1) $116 million in average deposits per branch at September 30, 2006
Slide 18: High Efficiency
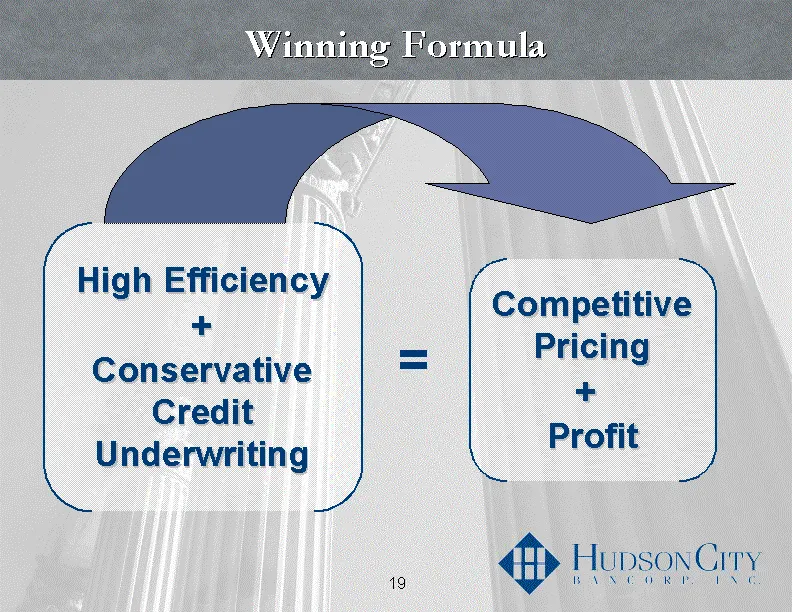
High Efficiency Competitive + i : = Pricing Conservative = : + Credit Profit Underwriting elu Bp HupsonCiry
Slide 19: Earnings and Dividend Growth
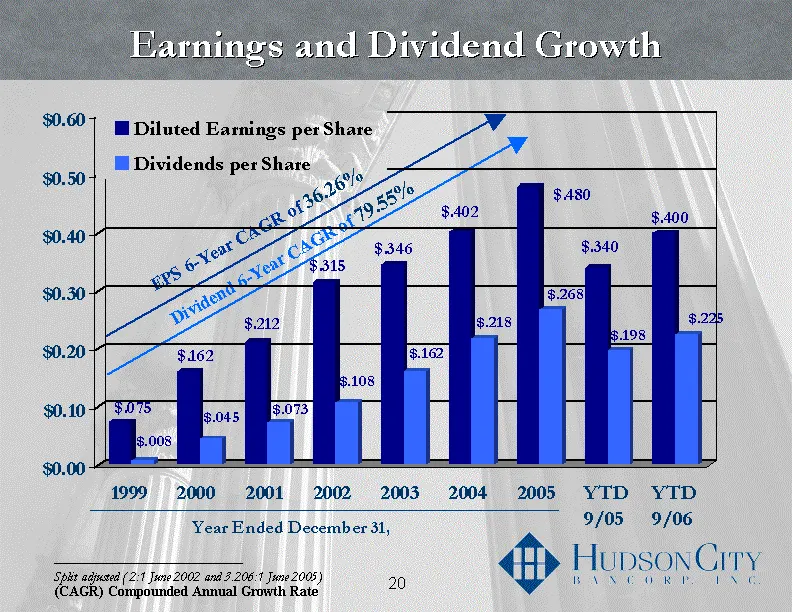
Earnings and Dividend Growth Dividend 6-Year CAGR of 79.55% ___________________________ Split adjusted ( 2:1 June 2002 and 3.206:1 June 2005) Year Ended December 31, EPS 6-Year CAGR of 36.26% 39 (CAGR) Compounded Annual Growth Rate
Slide 20: Cumulative Cash Returned to Shareholders
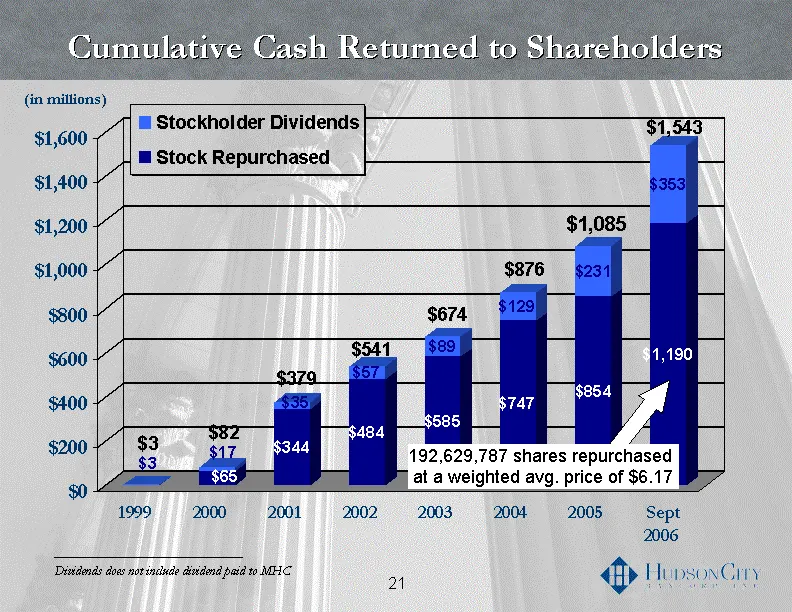
Cumulative Cash Returned to Shareholders (in millions) ___________________________ Dividends does not include dividend paid to MHC 41 192,629,787 shares repurchased at a weighted avg. price of $6.17
Slide 21: HCBK Ownership Breakdown
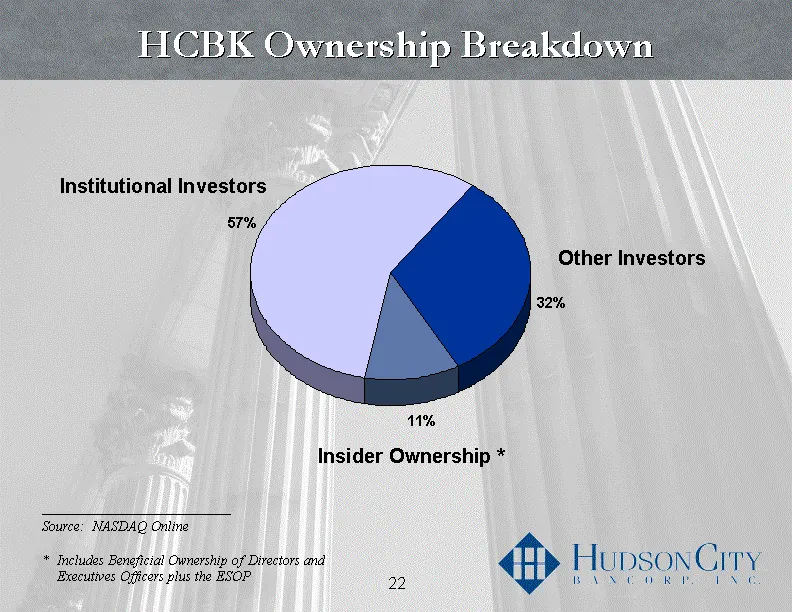
HCBK Ownership Breakdown Institutional Investors Other Investors Insider Ownership * ___________________________ Source: NASDAQ Online * Includes Beneficial Ownership of Directors and Executives Officers plus the ESOP
Slide 22: Leader in Corporate Governance
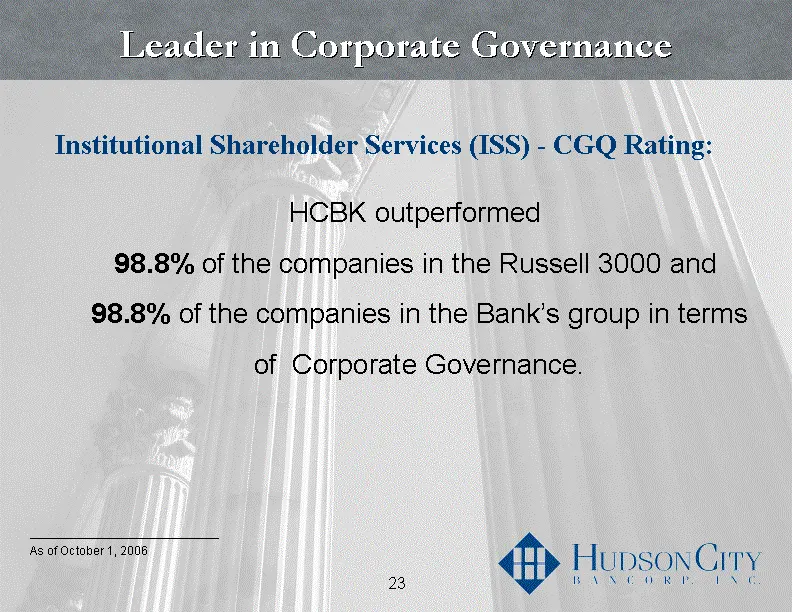
Leader in Corporate Governance Institutional Shareholder Services (ISS) - CGQ Rating: HCBK outperformed 98.8% of the companies in the Russell 3000 and 98.8% of the companies in the Bank's group in terms of Corporate Governance. ___________________________ As of October 1, 2006
Slide 23: Superior Stock Price Performance
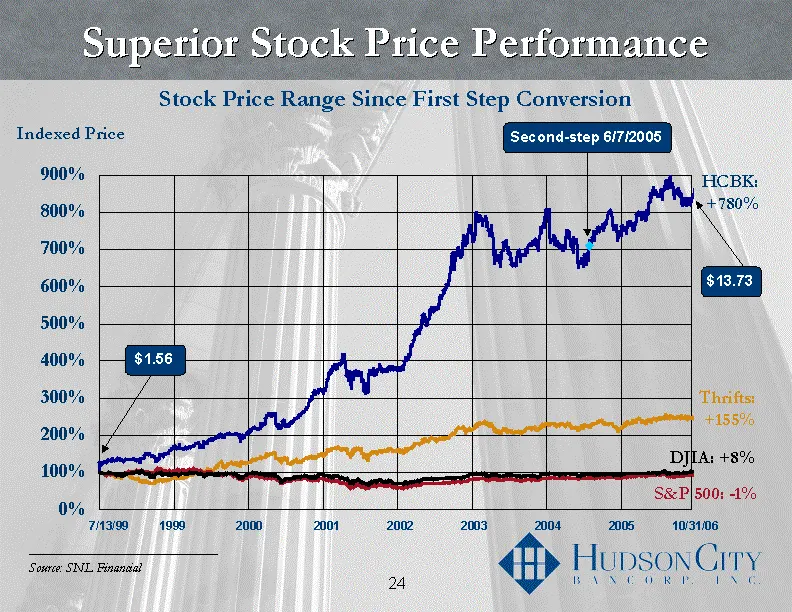
Superior Stock Price Performance
Slide 24: Hudson City Named Best Performer by WSJ
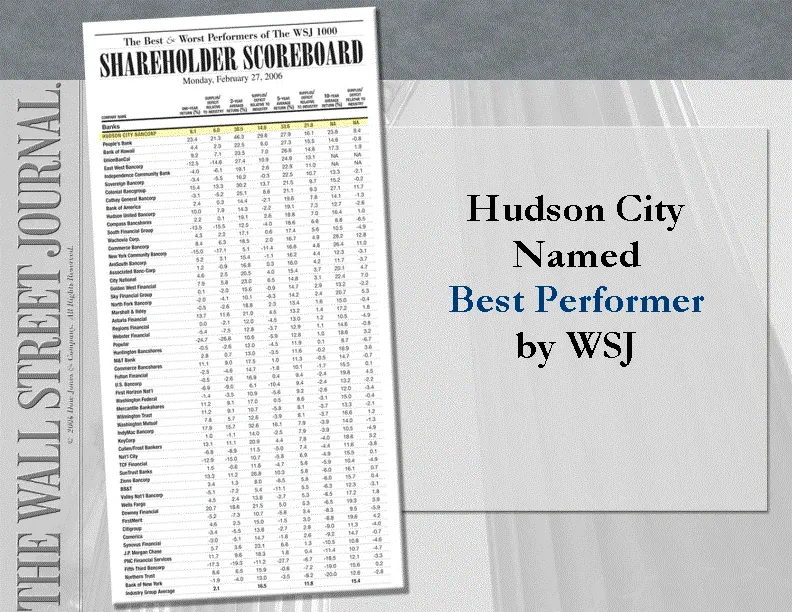
Hudson City Named Best Performer by WSJ
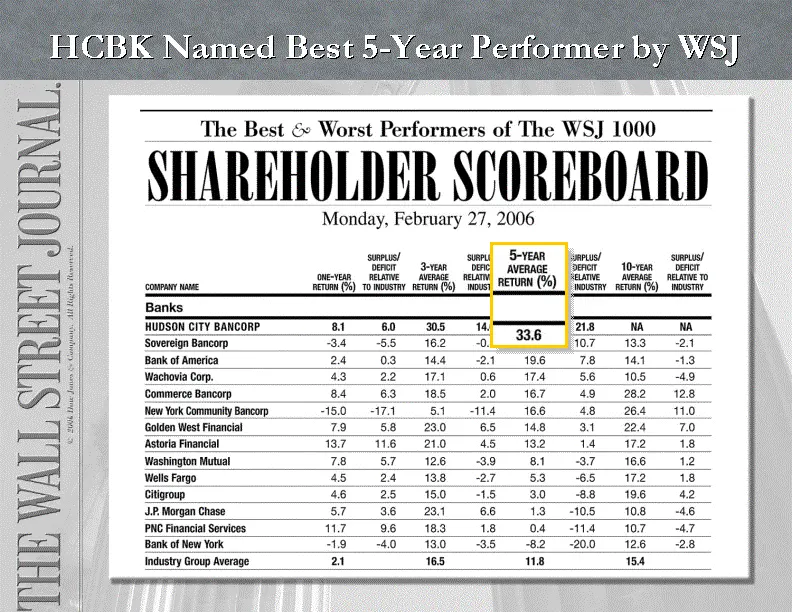
Slide 25: HCBK Named Best 5-Year Performer by WSJ
HCBK Named Best 5-Year Performer by WSJ

Slide 26: oe Se eee
oe Se eee HupsonCiry NC OR FP, Sat oo
Source: SEC EDGAR · 8-K filed Dec 7, 2006
More decks from Hudson City Bancorp Inc
 Citigroup 2013 US Financial Services Conference30 slides · Mar 6, 2013
 BancAnalysts Association of Boston Conference 201229 slides · Nov 2, 2012
 Barclays Global Financial Services Conference 201234 slides · Sep 10, 2012
 Merger or Acquisition (August 2012)32 slides · Aug 27, 2012
 Shareholder Meeting (April 2012)20 slides · Apr 25, 2012
 Shareholder Meeting (April 2011)38 slides · Apr 19, 2011