Hudson City Bancorp — Citigroup 2013 US Financial Services Conference
30 slides from Hudson City Bancorp's conference presentation, Mar 6, 2013

Slide 1: Rule 425 filing legend and forward-looking statements
Filed by M&T Bank Corporation Pursuant to Rule 425 under the Securities Act of 1933 and deemed filed pursuant to Rule 14a-12 of the Securities Exchange Act of 1934 Subject Company: Hudson City Bancorp, Inc. (Commission File No. 0-26001) Cautionary Statements Regarding Forward-Looking Information Thi
Slide 2: Citigroup 2013 US Financial Services Conference
Citigroup 2013 US Financial Services Conference March 6, 2013
Slide 3: Disclaimer
Disclaimer This presentation contains forward looking statements within the meaning of the Private Securities Litigation Reform Act of 1995 giving M&T’s expectations or predictions of future financial or business performance or conditions. Forward-looking statements are typically identified by words
Slide 4: Who is M&T Bank Today?
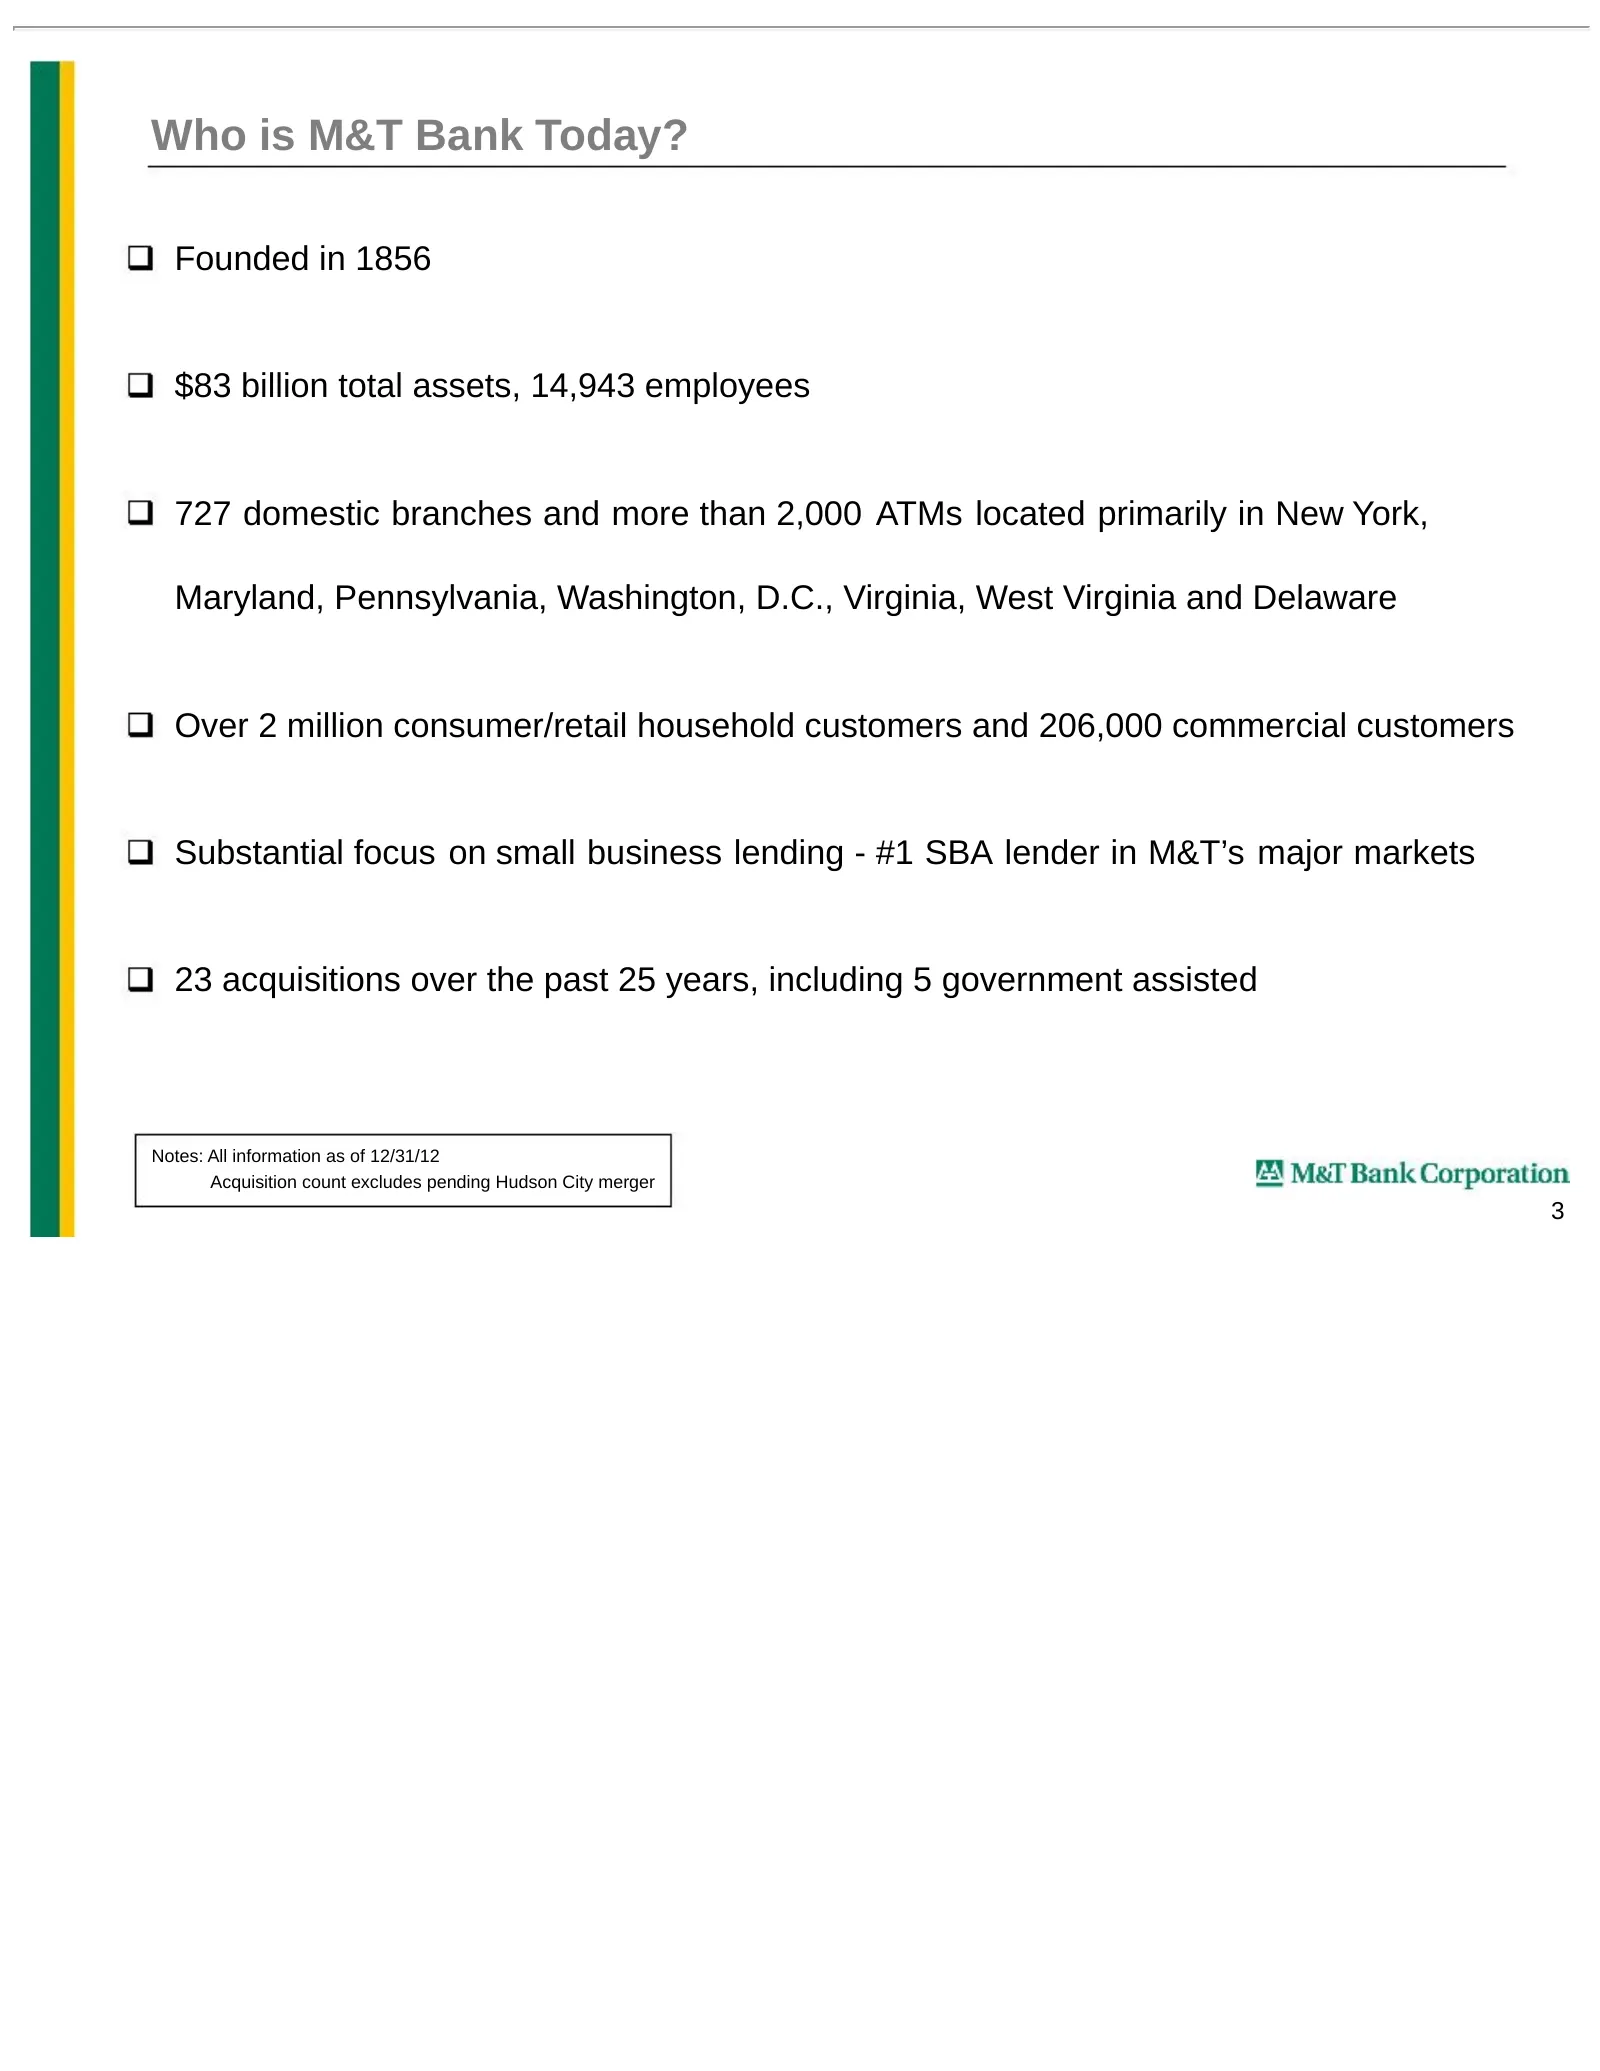
Who is M&T Bank Today? Founded in 1856 $83 billion total assets, 14,943 employees 727 domestic branches and more than 2,000 ATMs located primarily in New York, Maryland, Pennsylvania, Washington, D.C., Virginia, West Virginia and Delaware Over 2 million consumer/retail household customers and 206,00
Slide 5: M&T's Time-tested Business Model
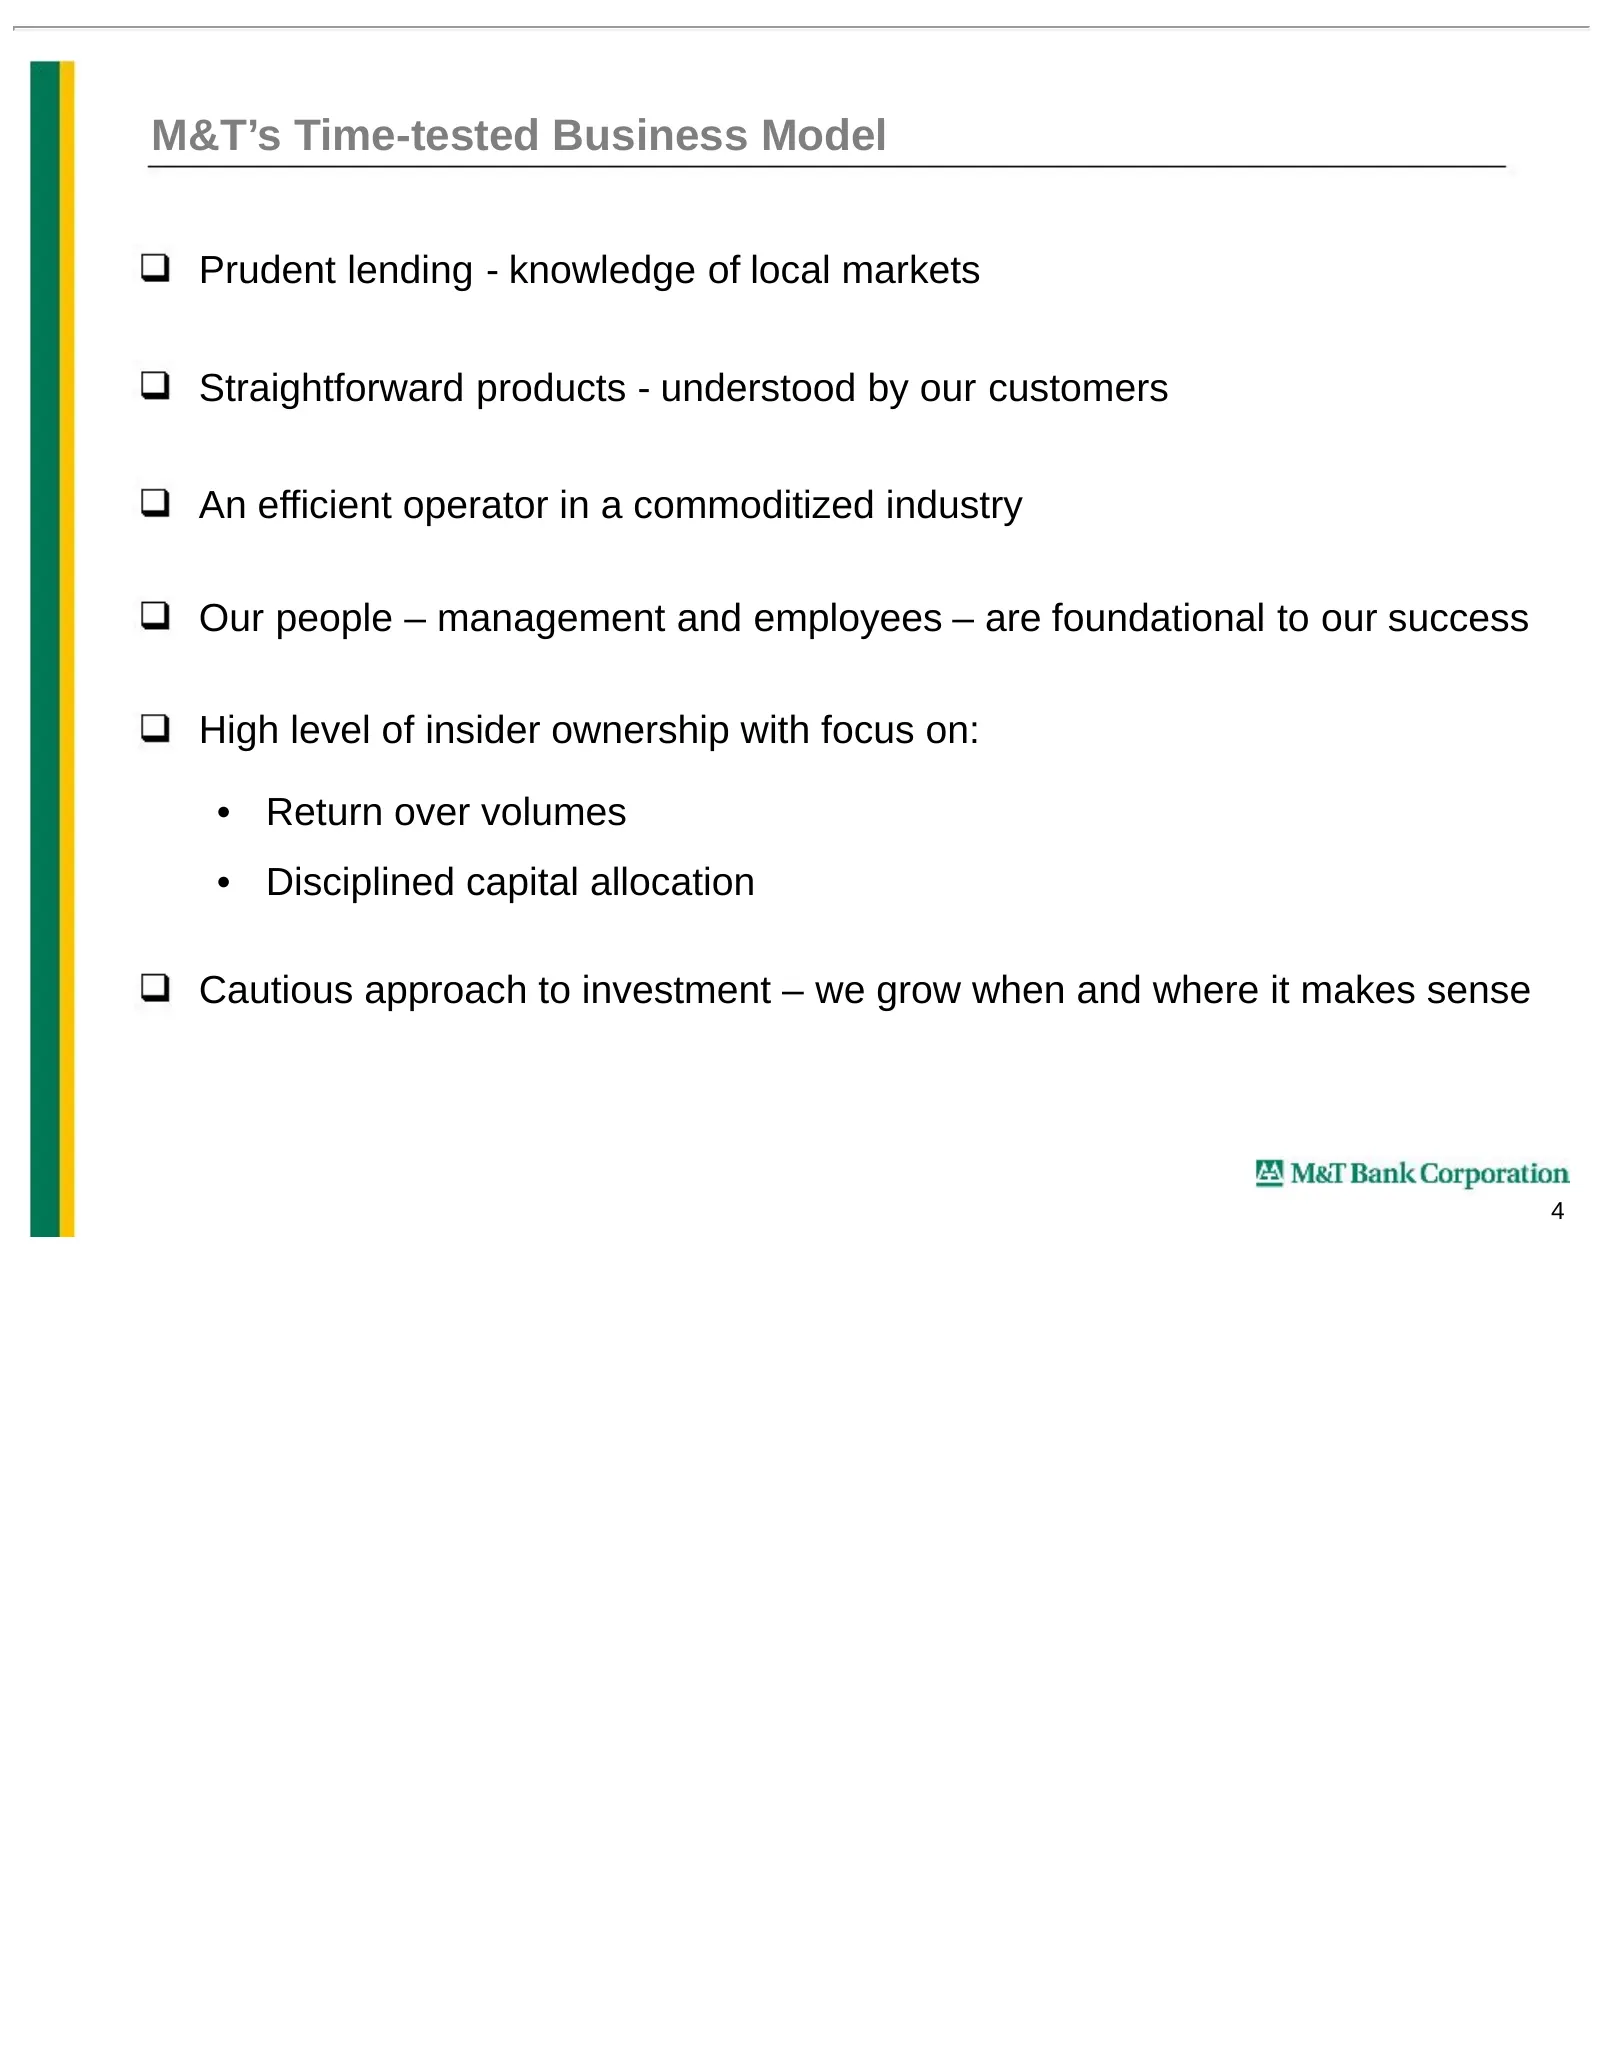
M&T’s Time-tested Business Model Prudent lending - knowledge of local markets Straightforward products - understood by our customers An efficient operator in a commoditized industry Our people – management and employees – are foundational to our success High level of insider ownership with focus on:
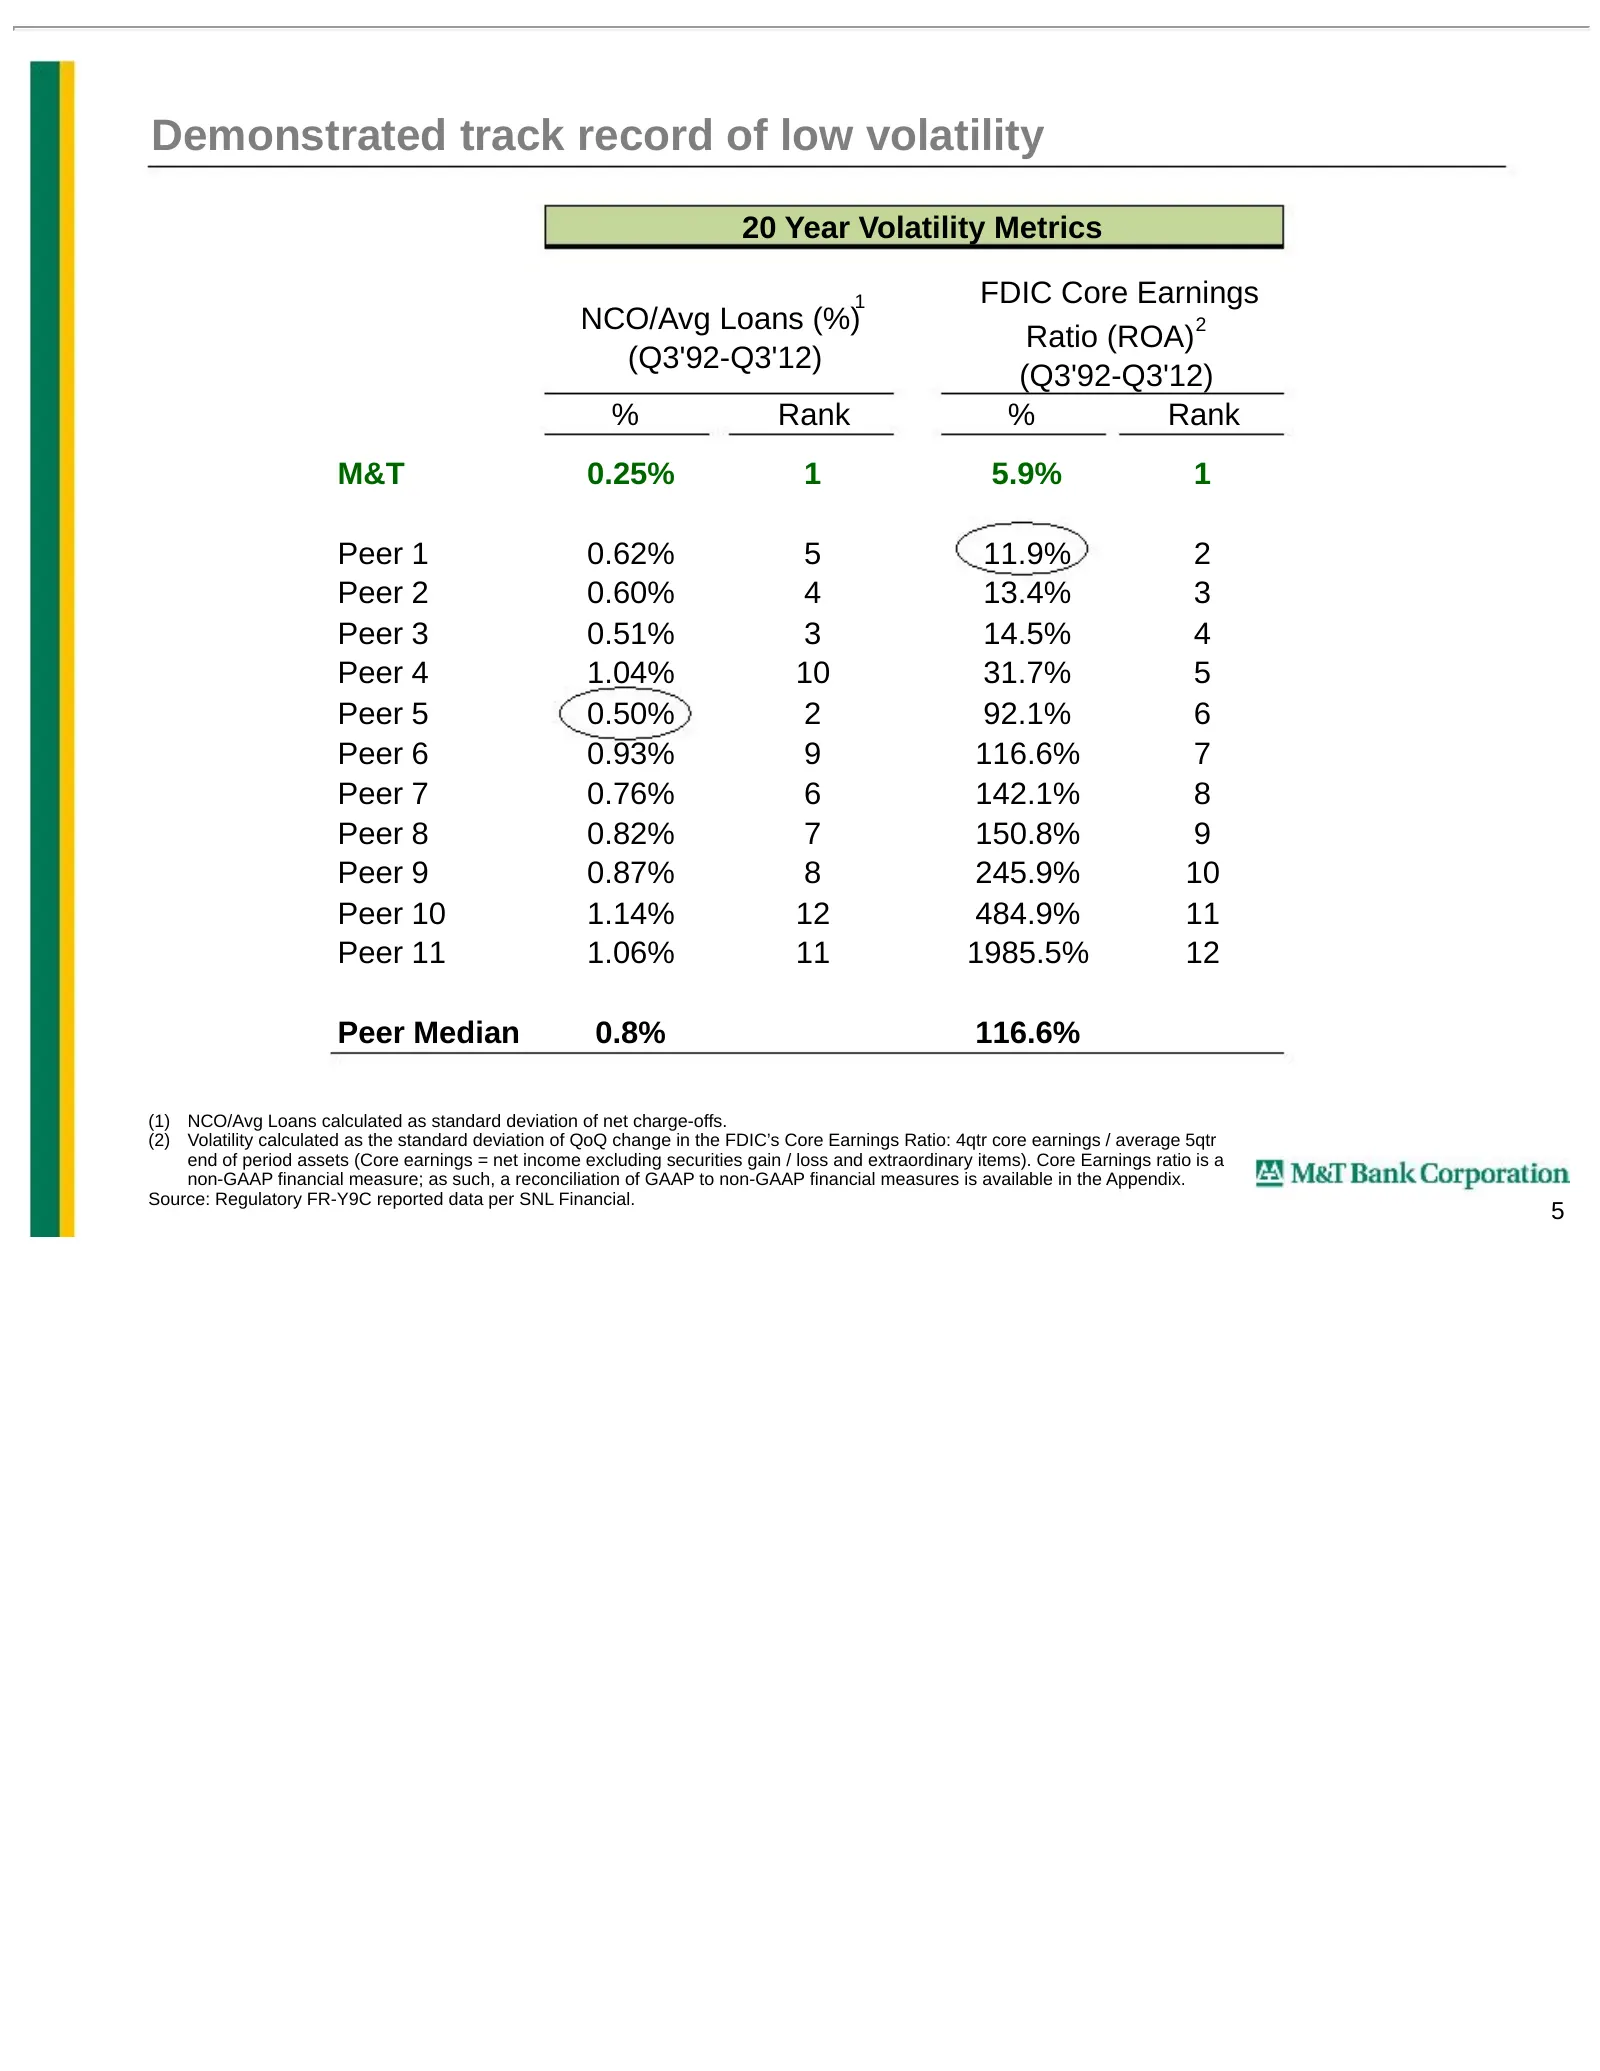
Slide 6: Demonstrated track record of low volatility
Demonstrated track record of low volatility 20 Year Volatility Metrics 1 FDIC Core Earnings NCO/Avg Loans (%) 2 Ratio (ROA) (Q3'92-Q3'12) (Q3'92-Q3'12) % Rank % Rank M&T 0.25% 1 5.9% 1 Peer 1 0.62% 5 11.9% 2 Peer 2 0.60% 4 13.4% 3 Peer 3 0.51% 3 14.5% 4 Peer 4 1.04% 10 31.7% 5 Peer 5 0.50% 2 92.1% 6
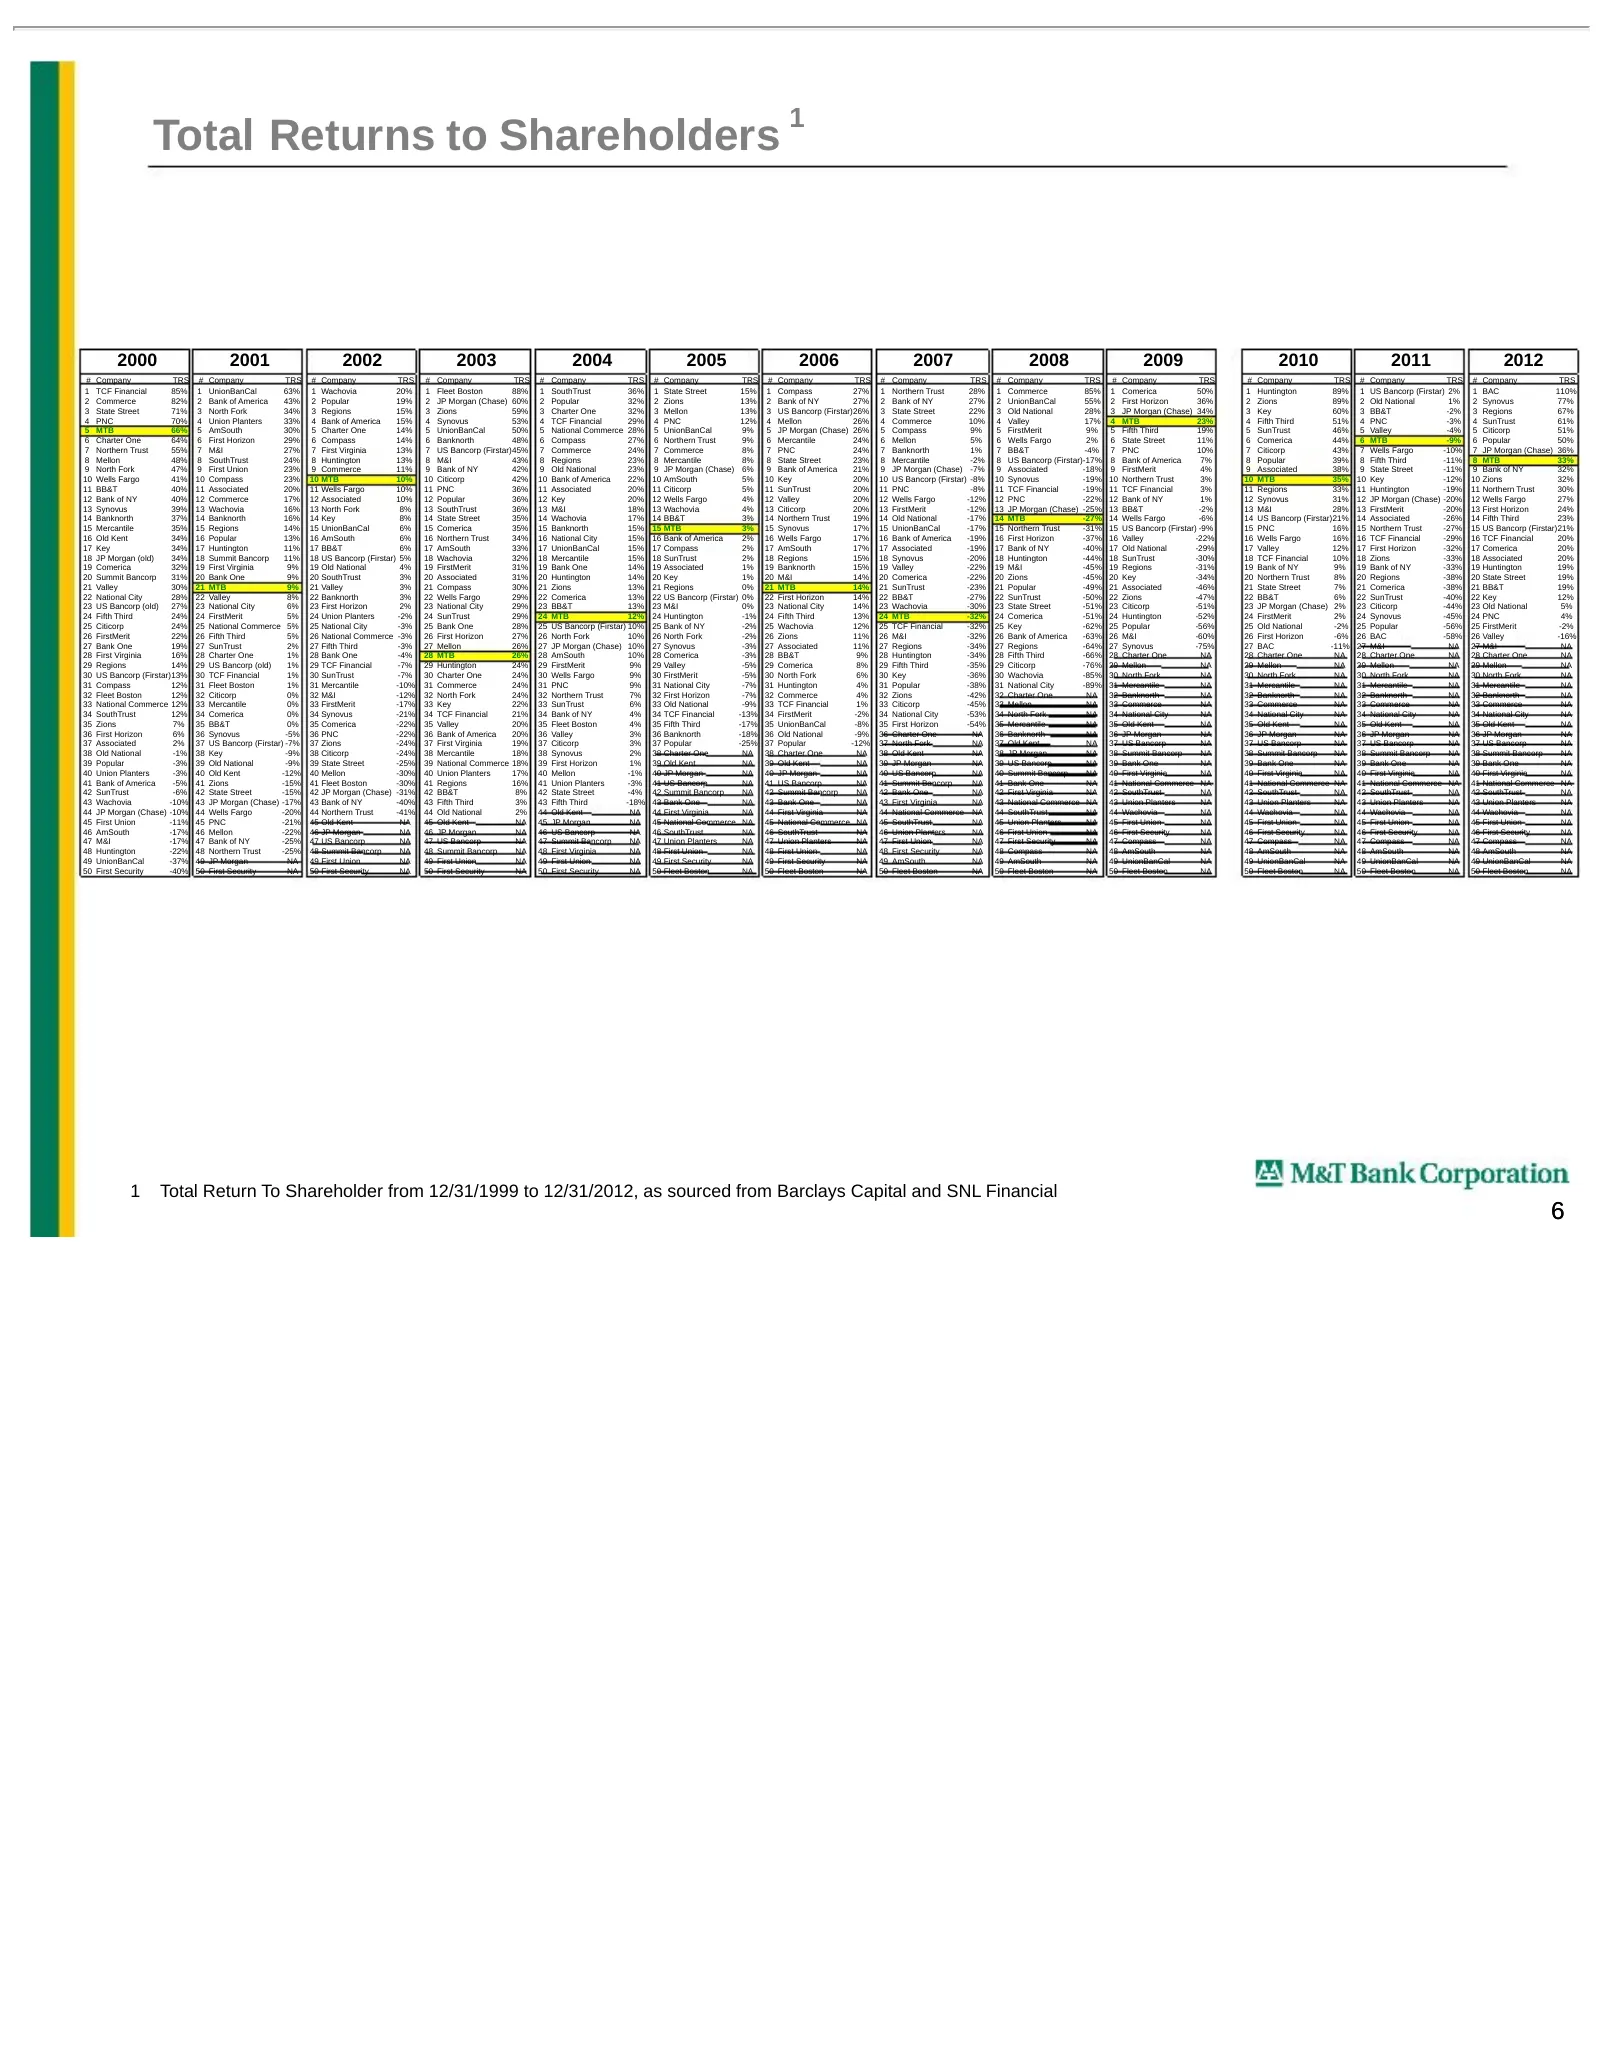
Slide 7: Total Returns to Shareholders
1 Total Returns to Shareholders 2000 2001 2002 2003 2004 2005 2006 2007 2008 2009 2010 2011 2012 # Company TRS # Company TRS # Company TRS # Company TRS # Company TRS # Company TRS # Company TRS # Company TRS # Company TRS # Company TRS # Company TRS # Company TRS # Company TRS 1 TCF Financial 85% 1
Slide 8: Financial Review
Financial Review f\ MaT Bank Corporation 7
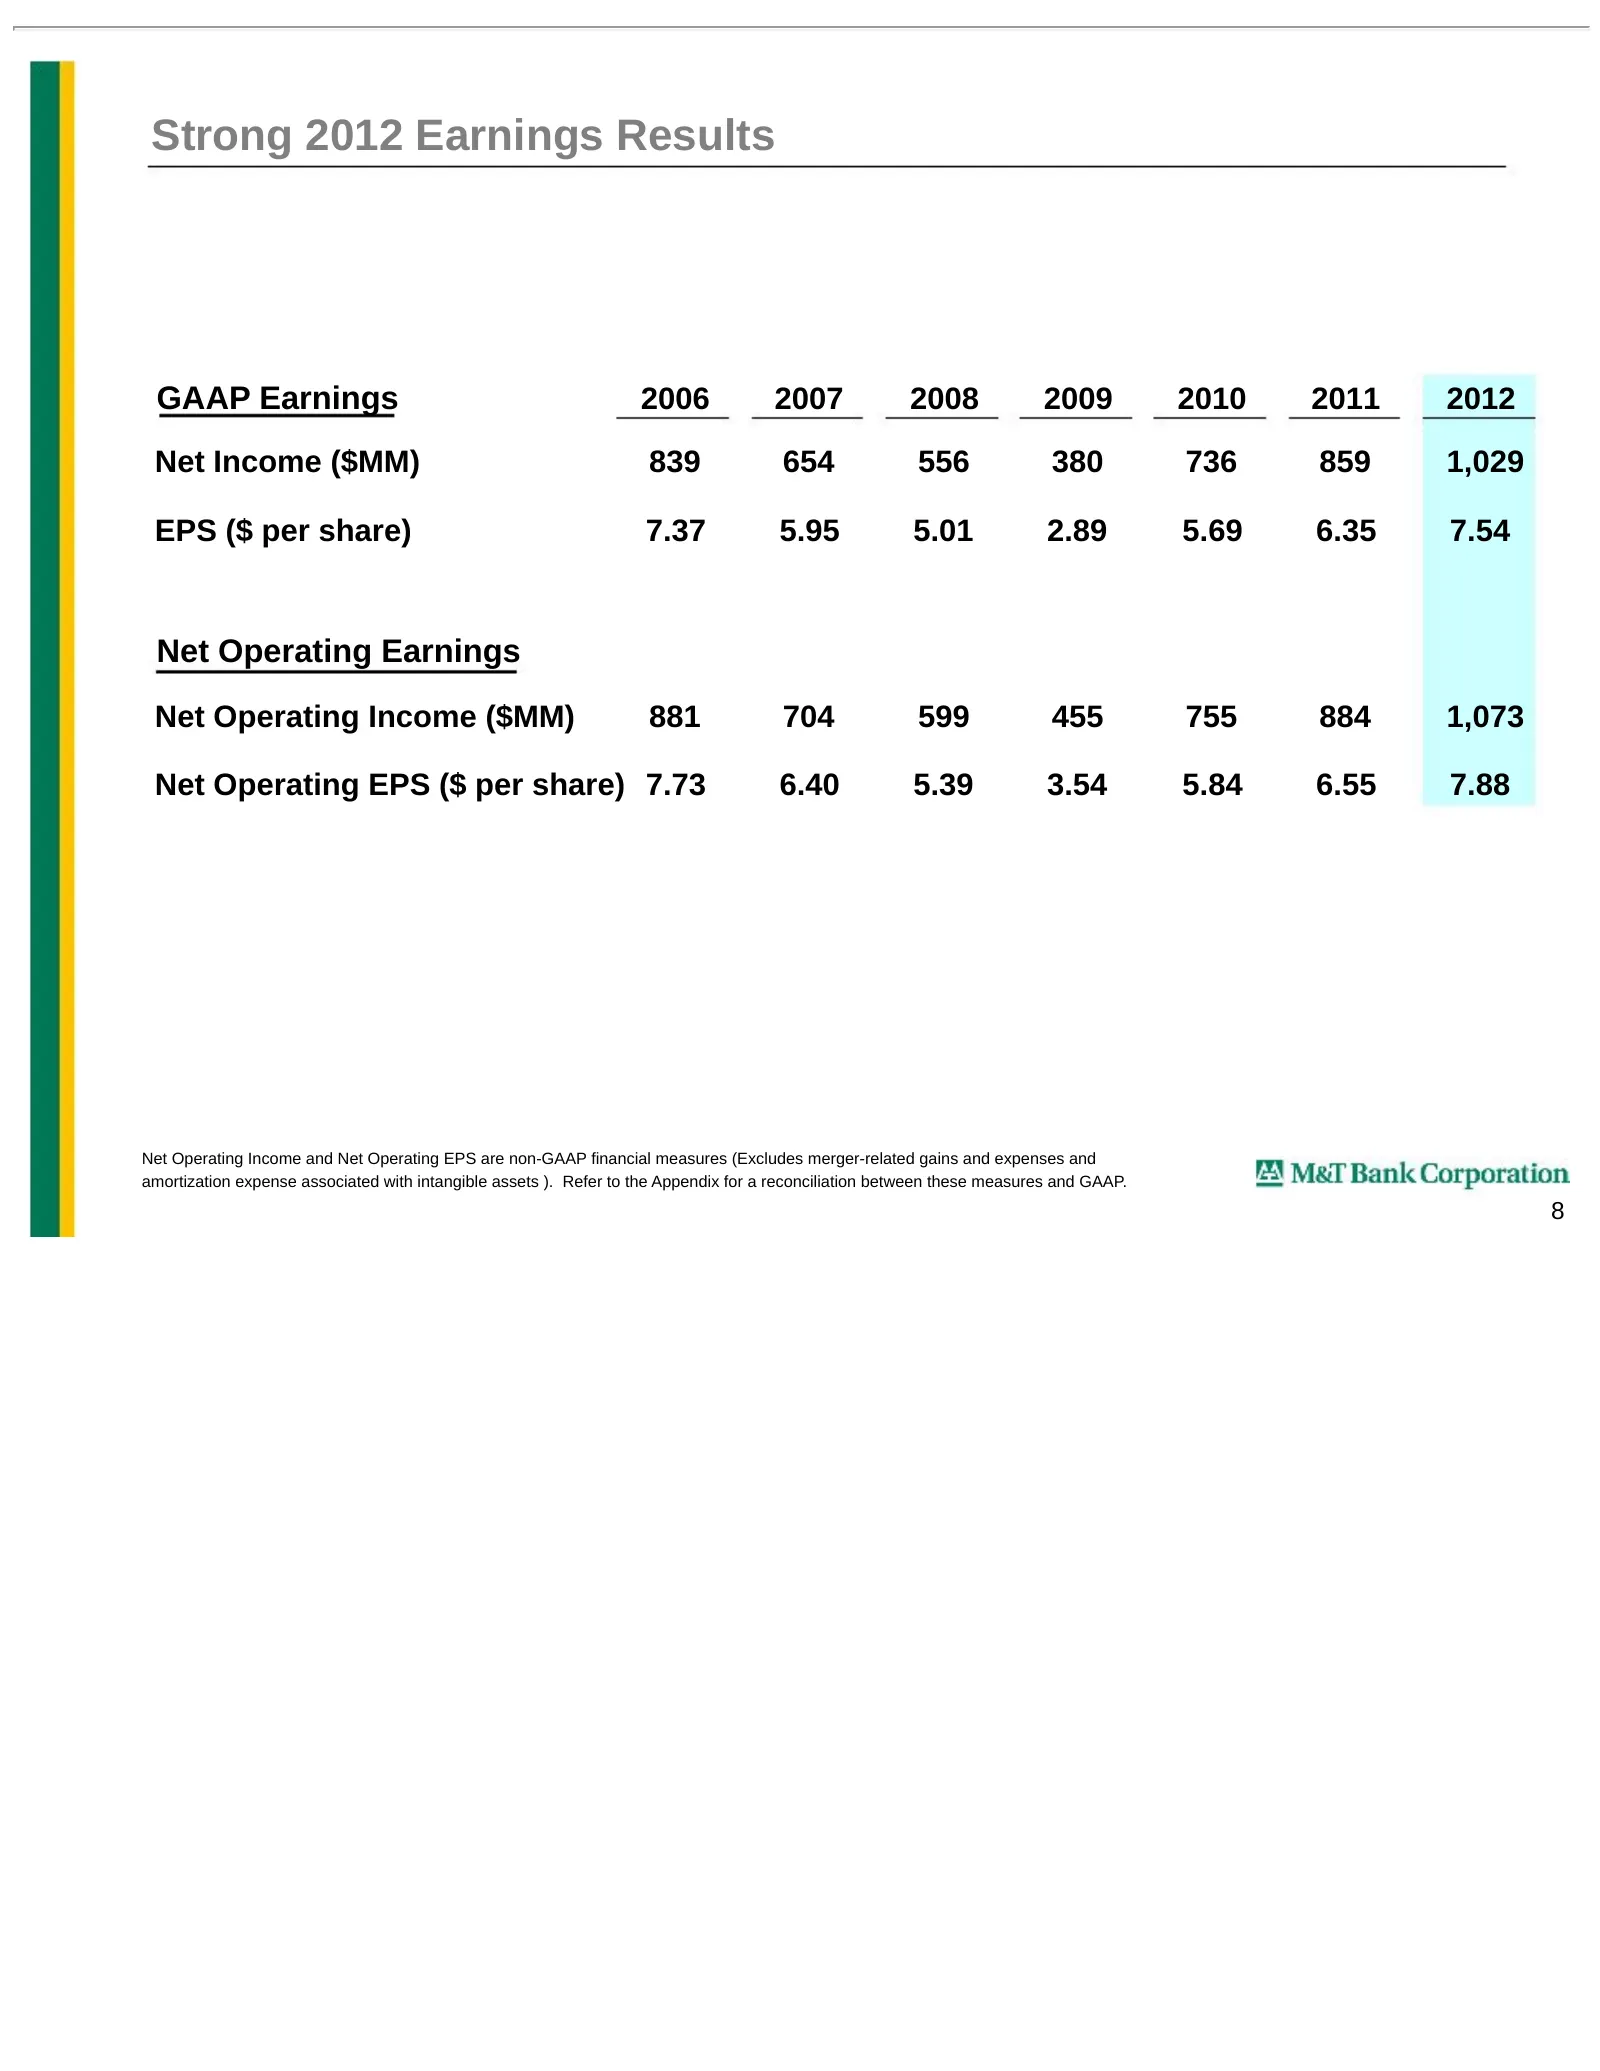
Slide 9: Strong 2012 Earnings Results
Strong 2012 Earnings Results GAAP Earnings 2006 2007 2008 2009 2010 2011 2012 Net Income ($MM) 839 654 556 380 736 859 1,029 EPS ($ per share) 7.37 5.95 5.01 2.89 5.69 6.35 7.54 Net Operating Earnings Net Operating Income ($MM) 881 704 599 455 755 884 1,073 Net Operating EPS ($ per share) 7.73 6.40
Slide 10: Key Ratios
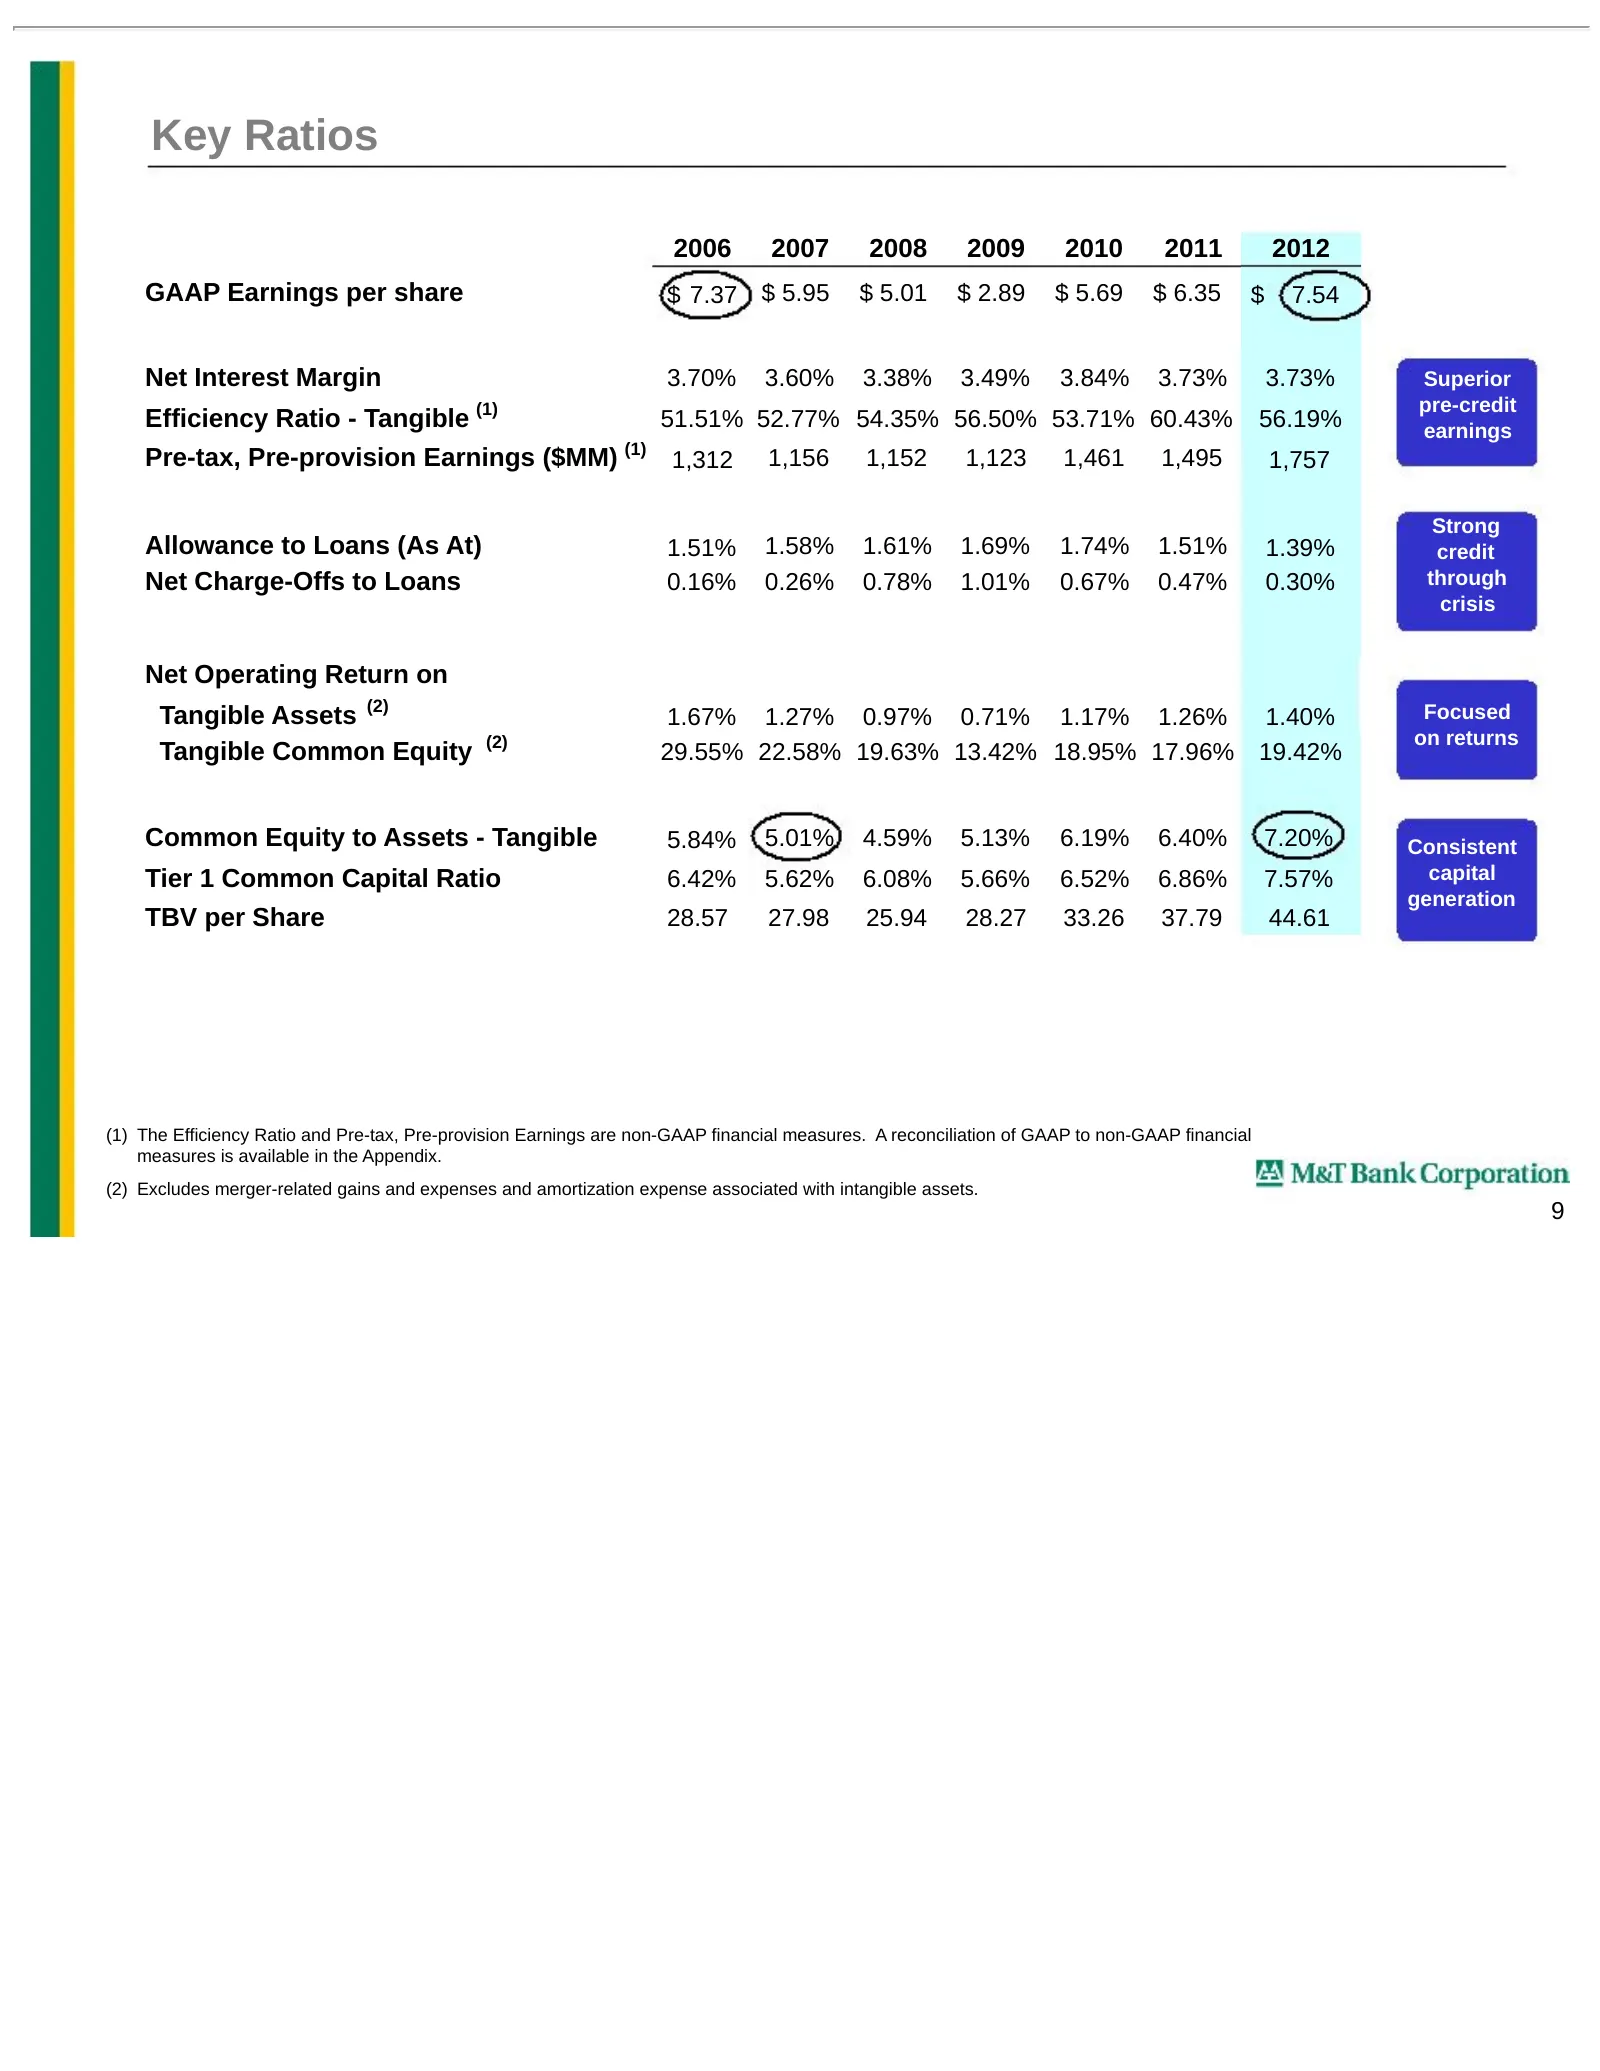
Key Ratios 2006 2007 2008 2009 2010 2011 2012 GAAP Earnings per share $ 7.37 $ 5.95 $ 5.01 $ 2.89 $ 5.69 $ 6.35 $ 7.54 Net Interest Margin 3.70% 3.60% 3.38% 3.49% 3.84% 3.73% 3.73% Superior (1) pre-credit Efficiency Ratio - Tangible 51.51% 52.77% 54.35% 56.50% 53.71% 60.43% 56.19% earnings (1) Pre-t
Slide 11: Strength and Stability Through the Great Recession
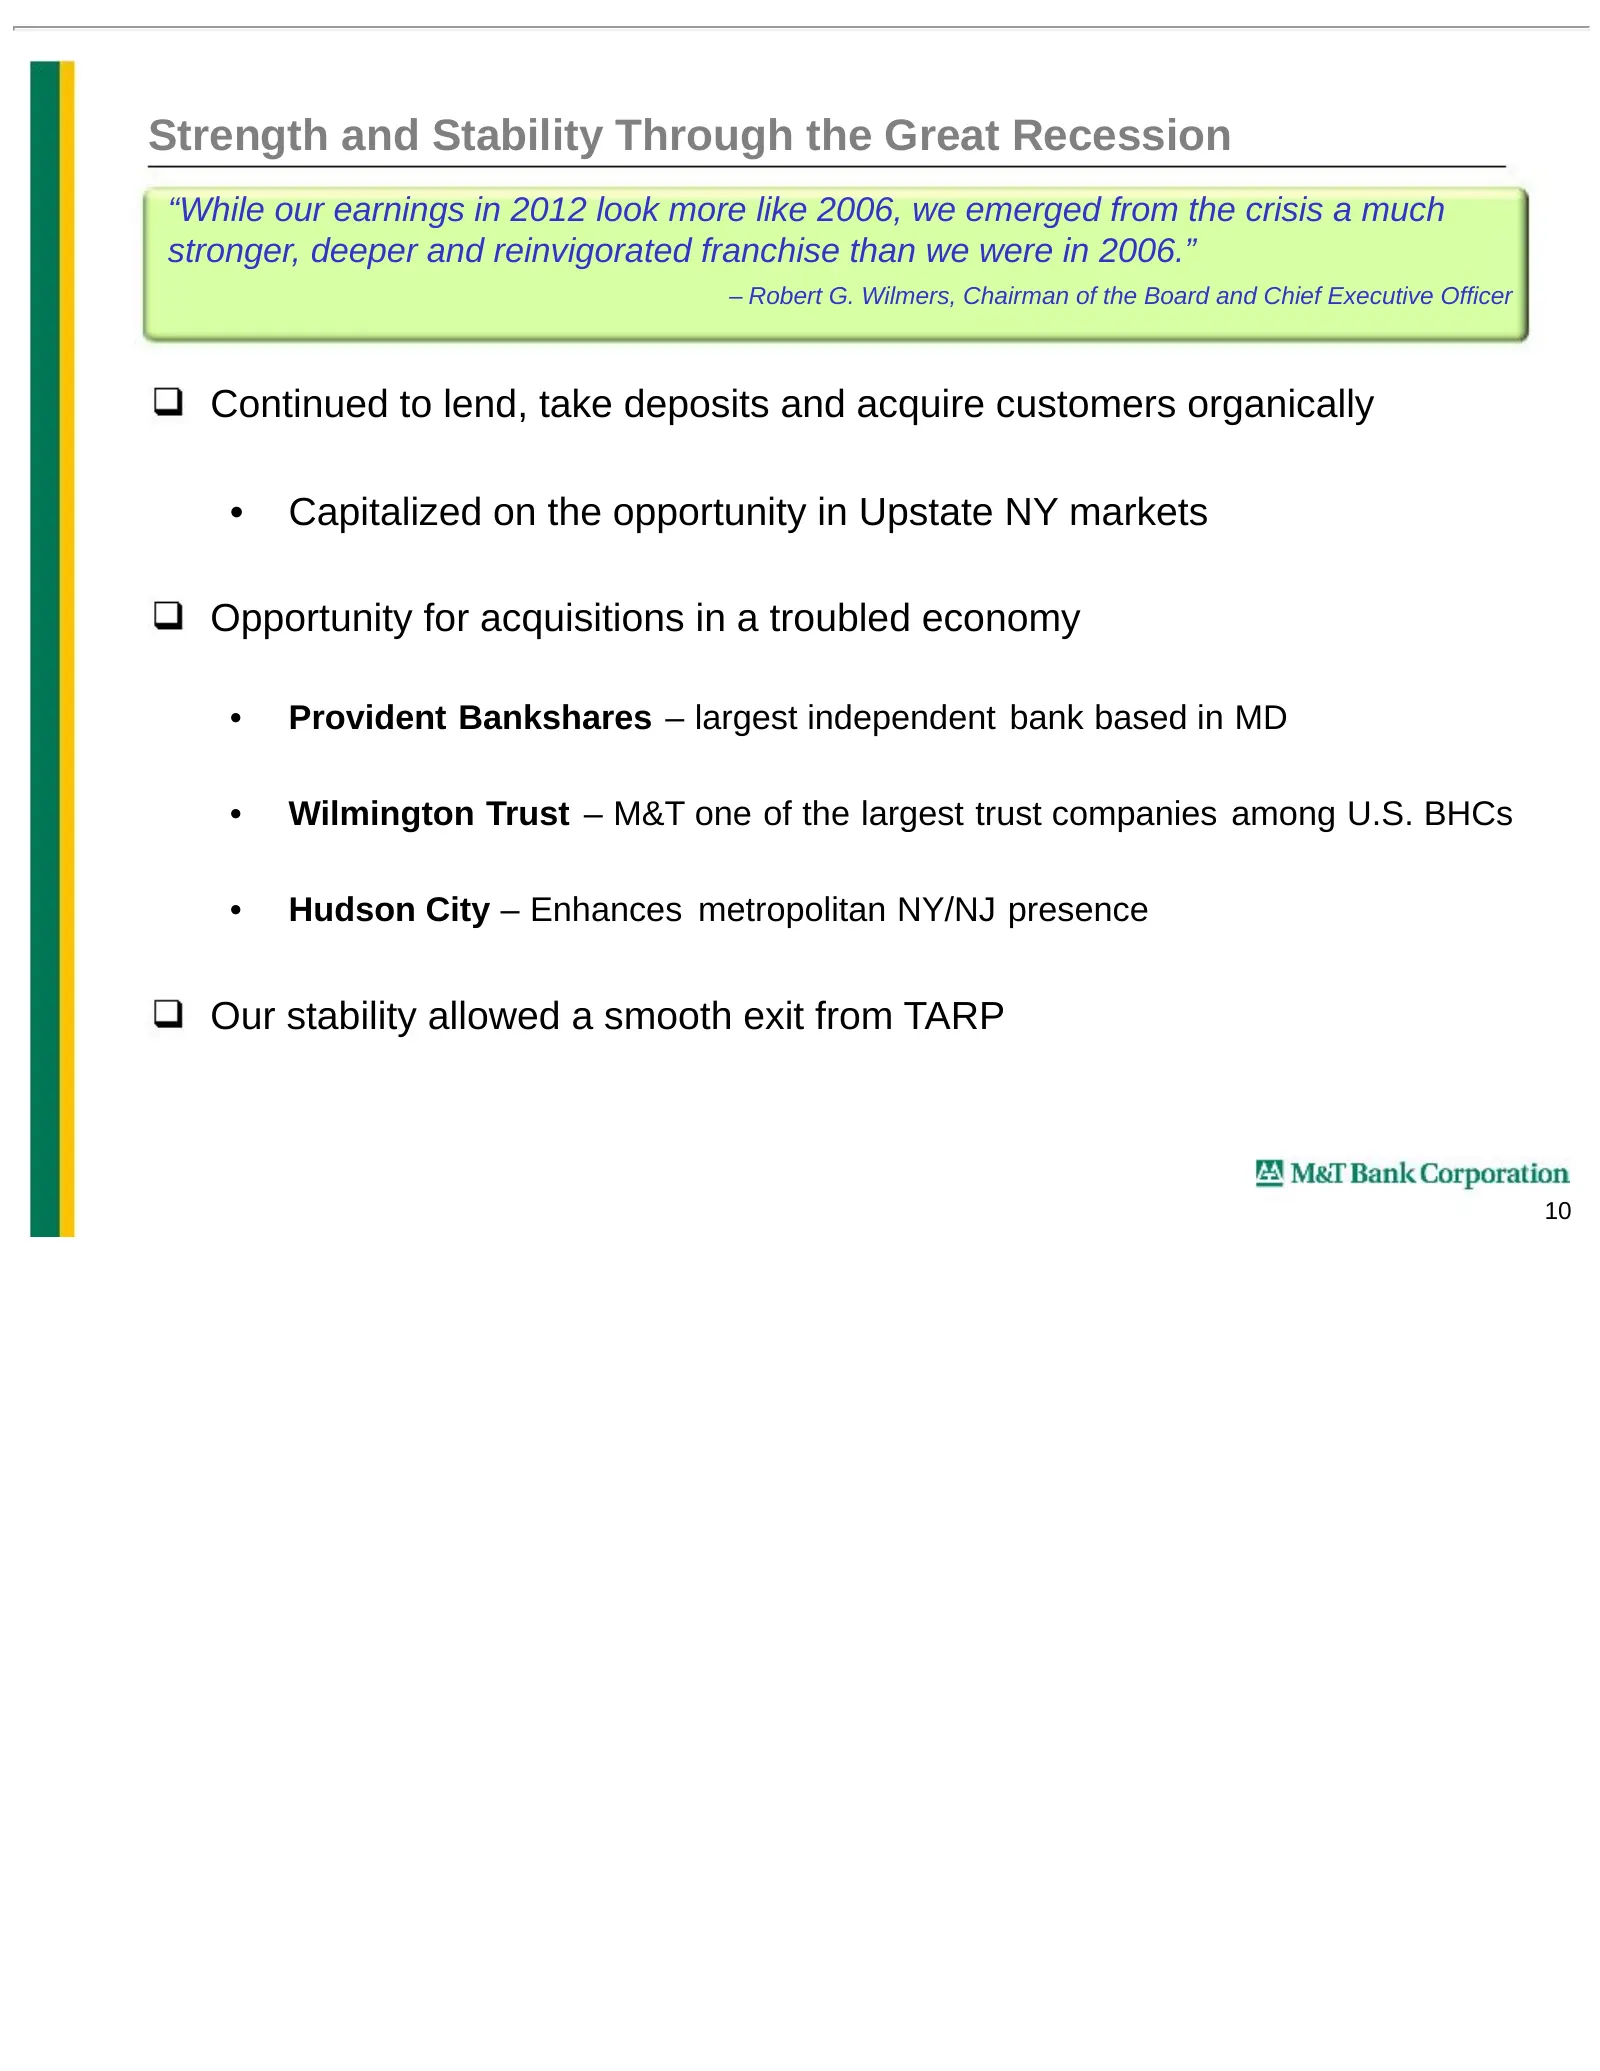
Strength and Stability Through the Great Recession “While our earnings in 2012 look more like 2006, we emerged from the crisis a much stronger, deeper and reinvigorated franchise than we were in 2006.” – Robert G. Wilmers, Chairman of the Board and Chief Executive Officer Continued to lend, take dep
Slide 12: M&T's Geographic Footprint - 2006
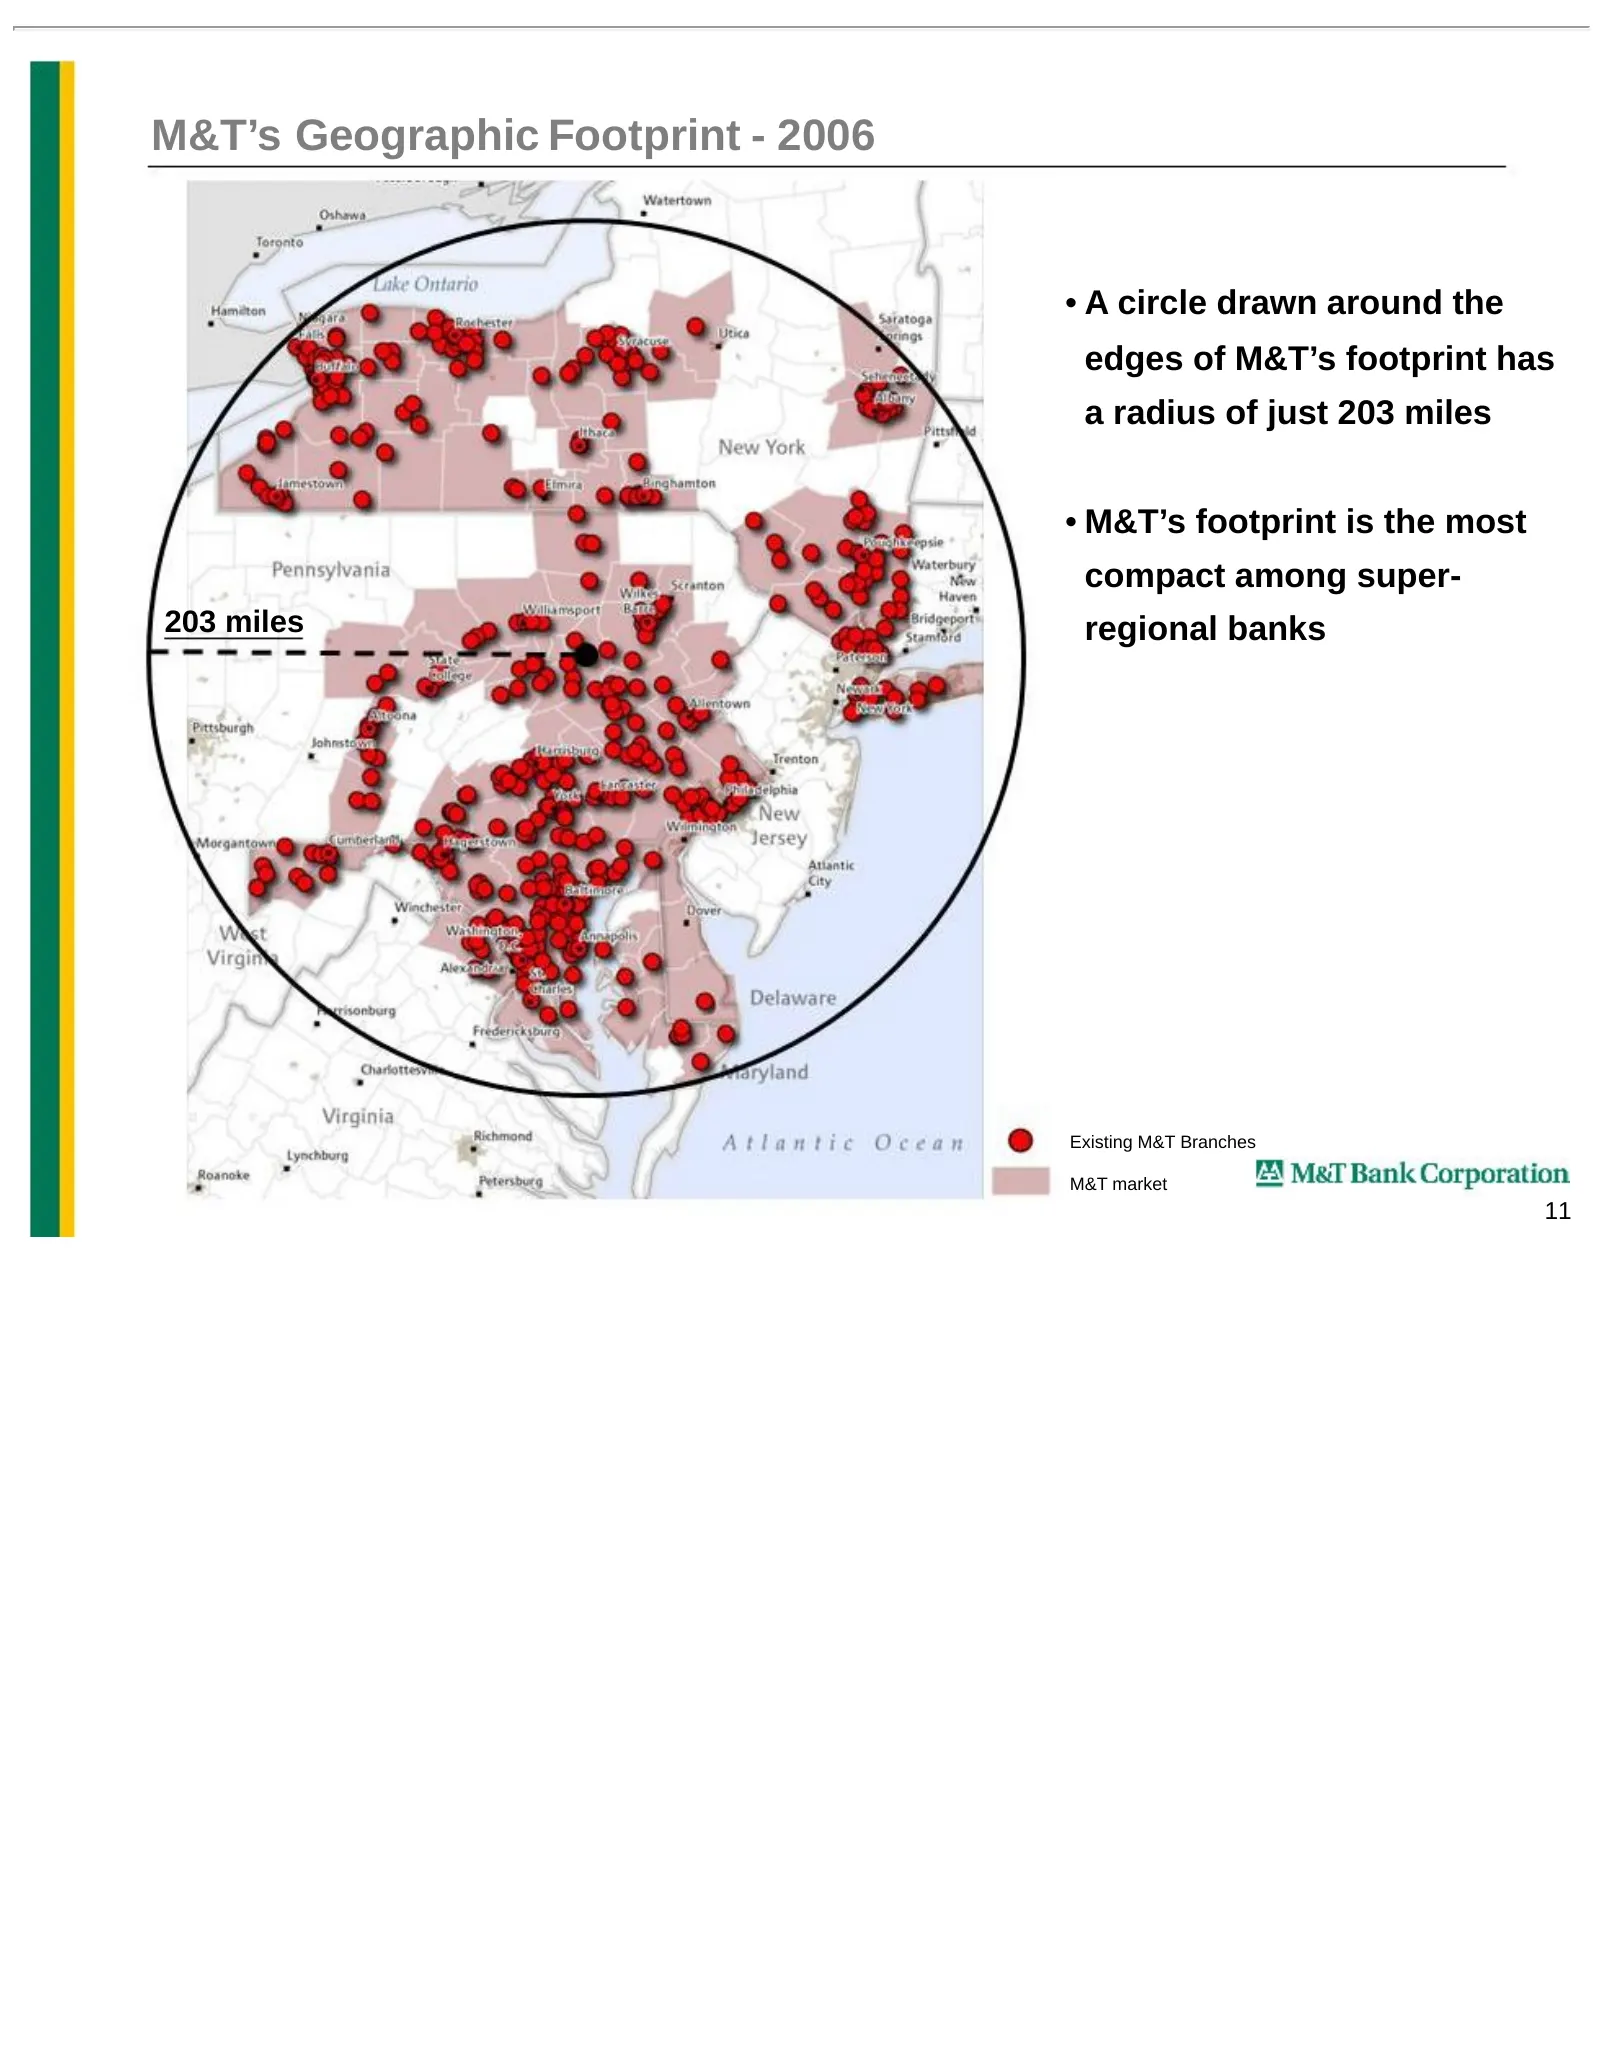
M&T’s Geographic Footprint - 2006 • A circle drawn around the edges of M&T’s footprint has a radius of just 203 miles • M&T’s footprint is the most compact among super- 203 miles regional banks Existing M&T Branches M&T market 11
Slide 13: M&T's Acquisitions vs. Bank Deals > than $1B since 2000
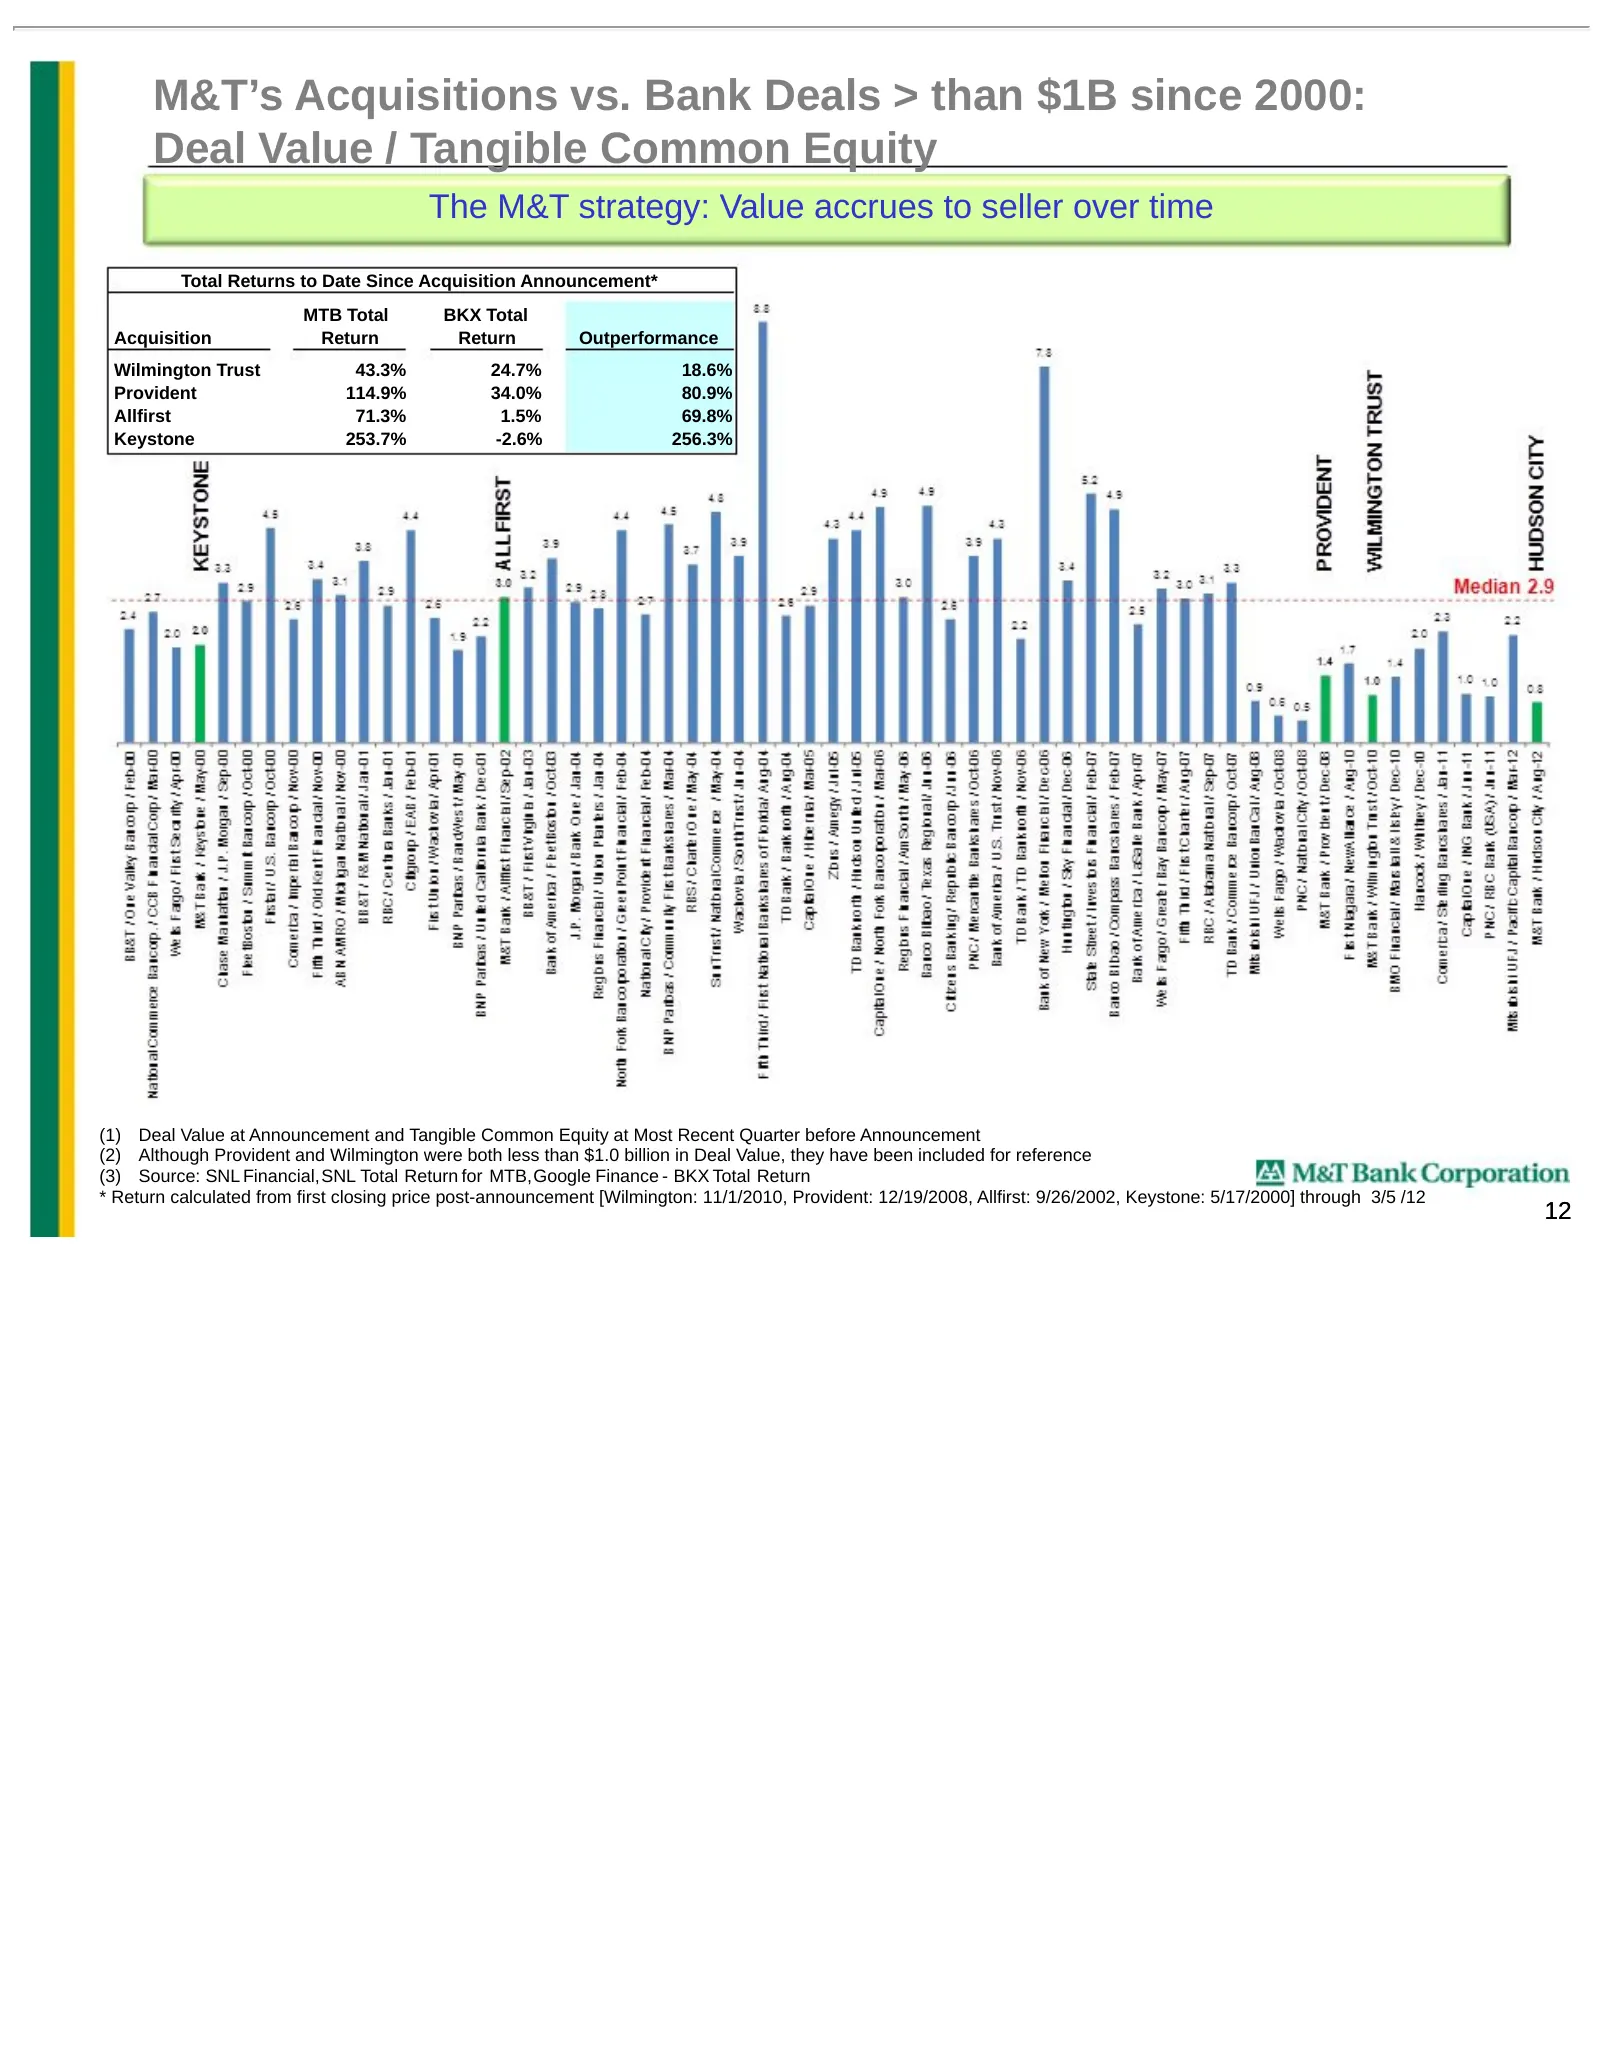
M&T’s Acquisitions vs. Bank Deals > than $1B since 2000: Deal Value / Tangible Common Equity The M&T strategy: Value accrues to seller over time Total Returns to Date Since Acquisition Announcement* MTB Total BKX Total Acquisition Return Return Outperformance Wilmington Trust 43.3% 24.7% 18.6% Provi
Slide 14: Deploying Capital Where and When it Makes Sense
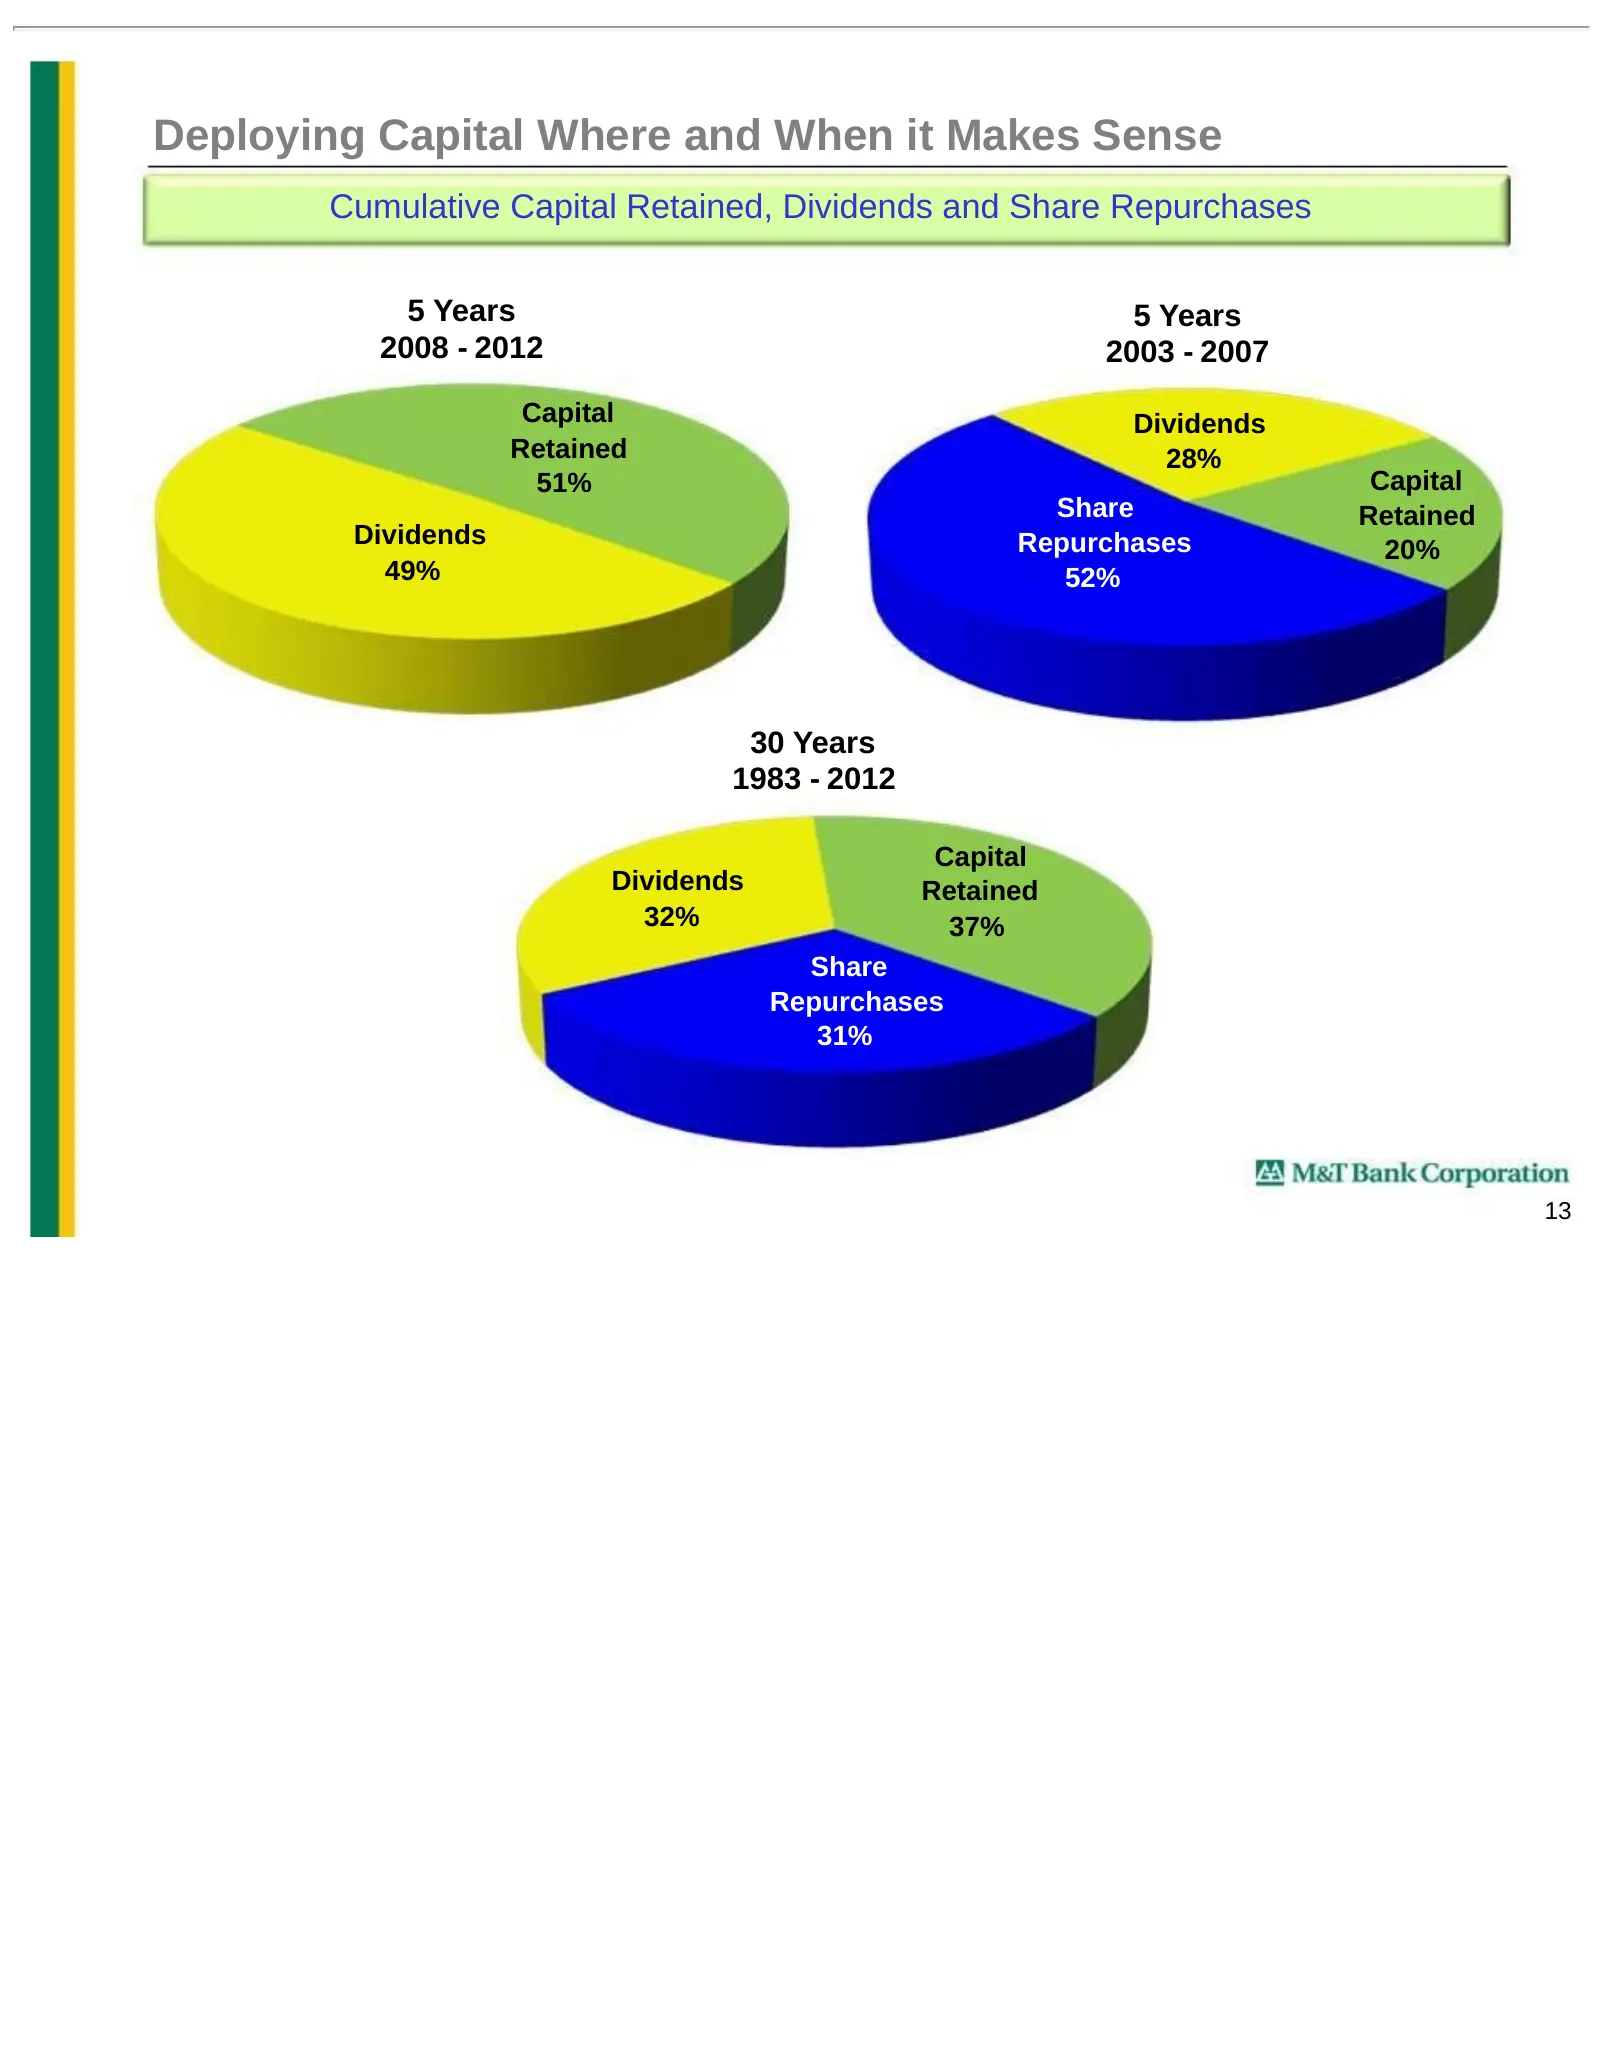
Deploying Capital Where and When it Makes Sense Cumulative Capital Retained, Dividends and Share Repurchases 5 Years 5 Years 2008 - 2012 2003 - 2007 Capital Dividends Retained 28% 51% Capital Share Retained Dividends Repurchases 20% 49% 52% 30 Years 1983 - 2012 Capital Dividends Retained 32% 37% Sha
Slide 15: M&T's Proforma Geographic Footprint - 2013
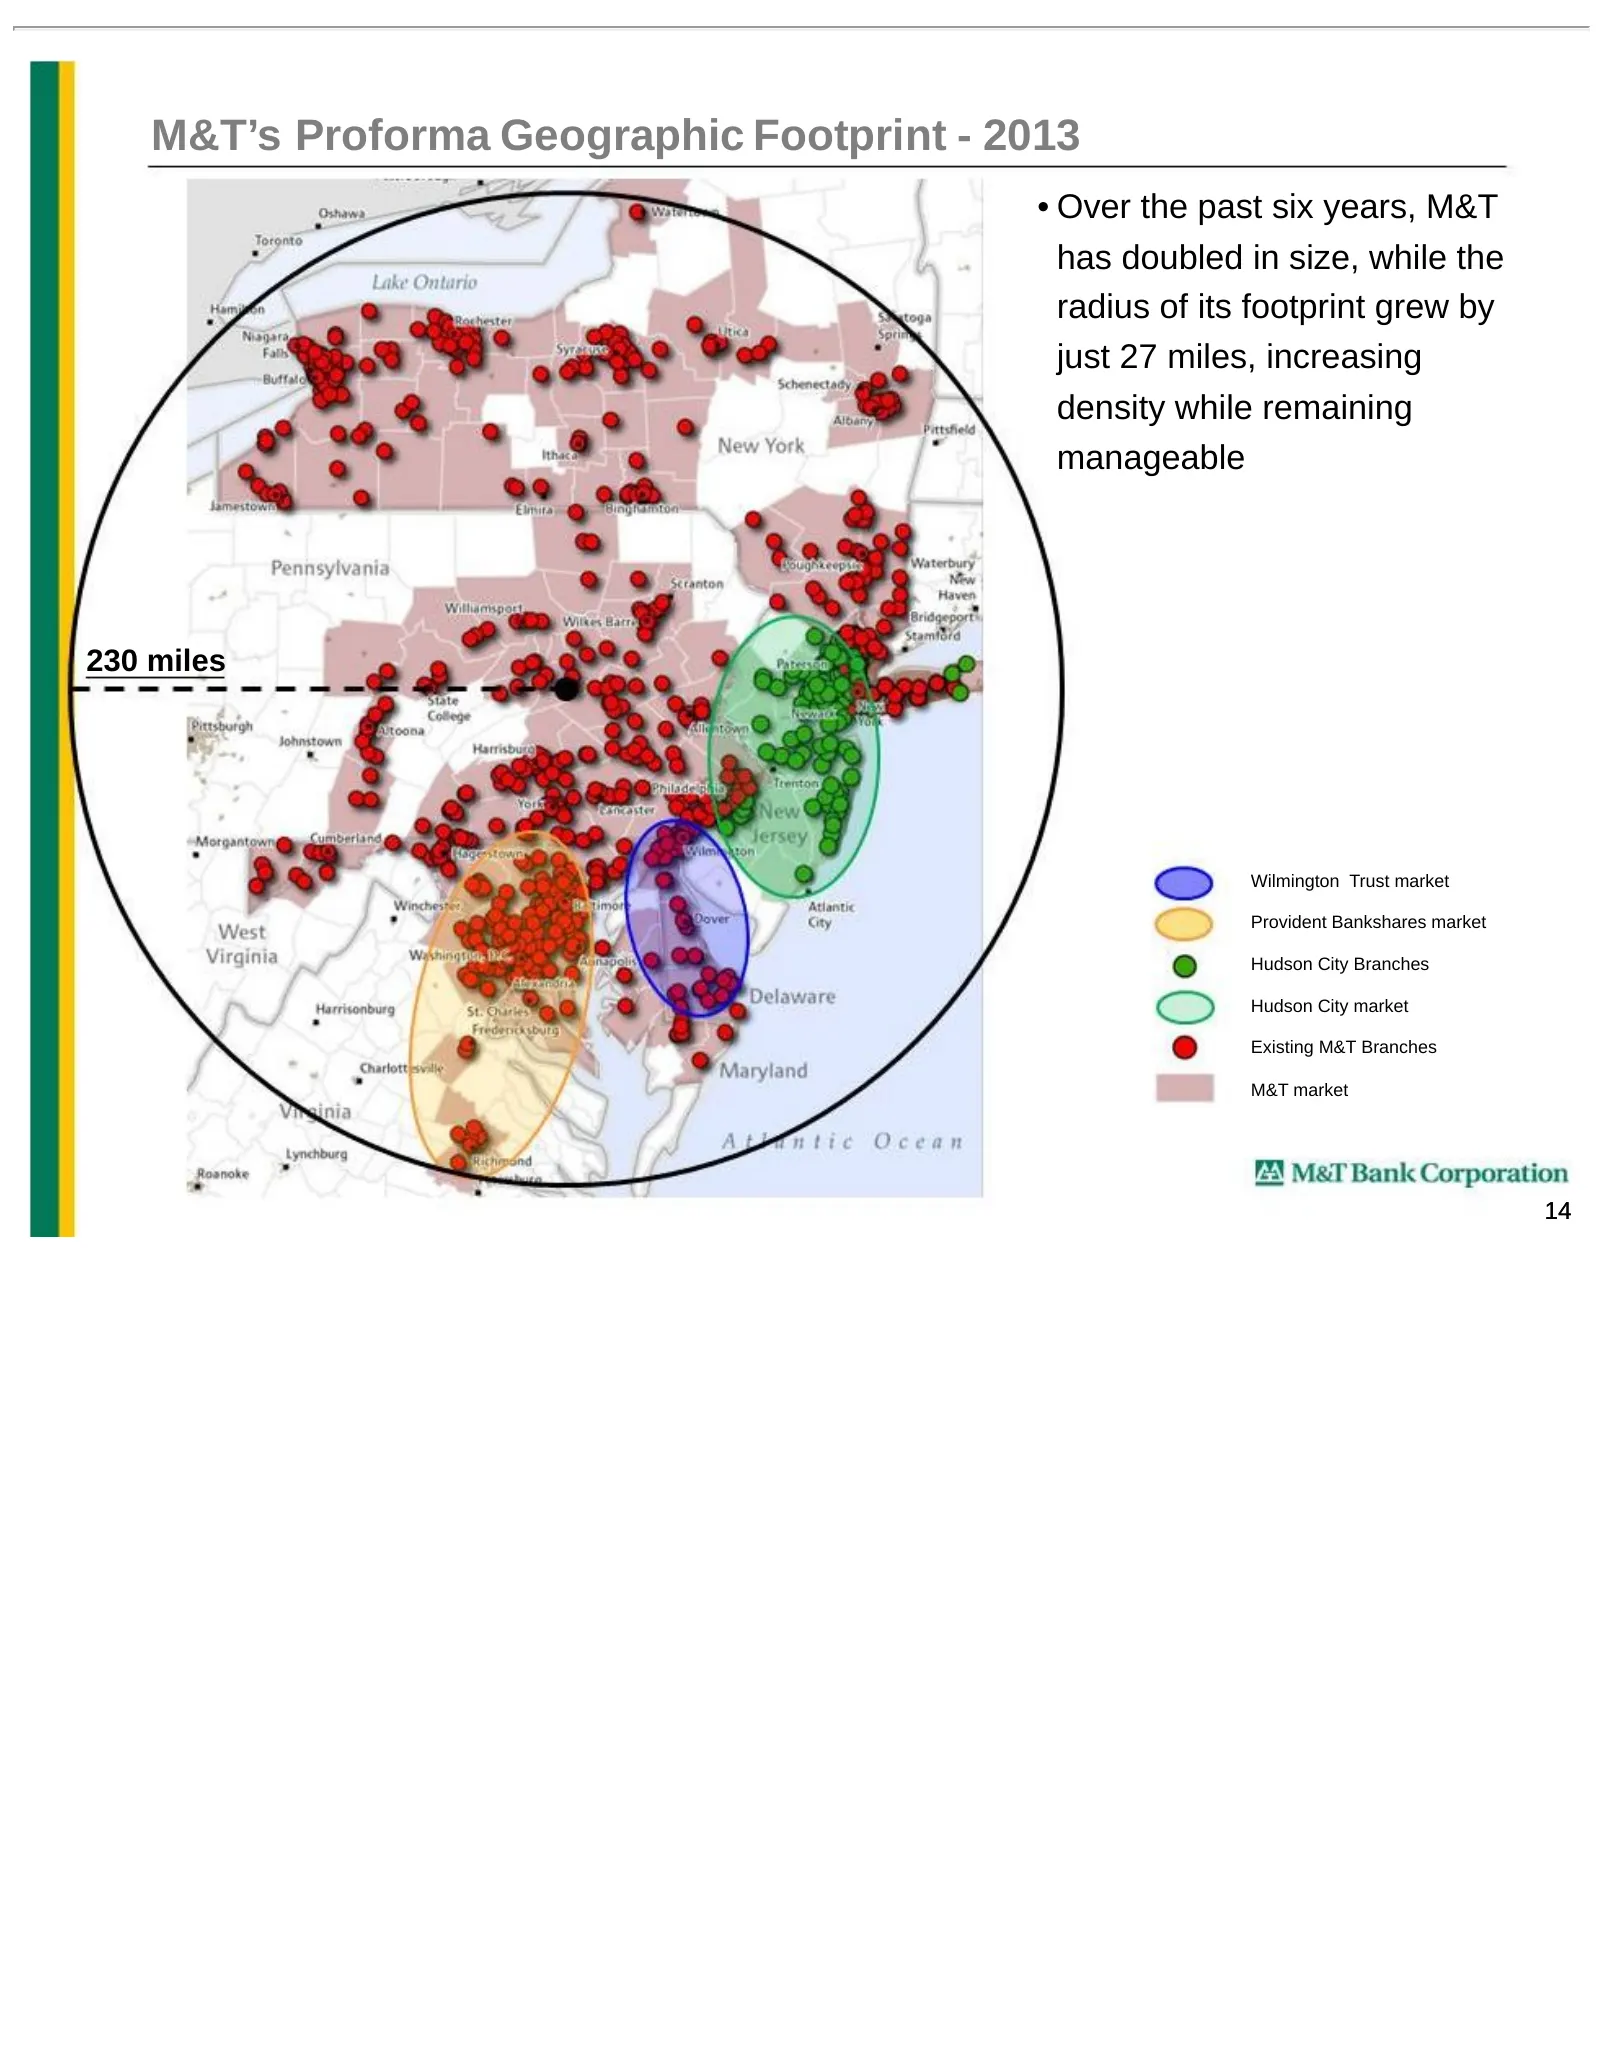
M&T’s Proforma Geographic Footprint - 2013 • Over the past six years, M&T has doubled in size, while the radius of its footprint grew by just 27 miles, increasing density while remaining manageable 230 miles Wilmington Trust market Provident Bankshares market Hudson City Branches Hudson City market
Slide 16: Our People are Foundational to our Success
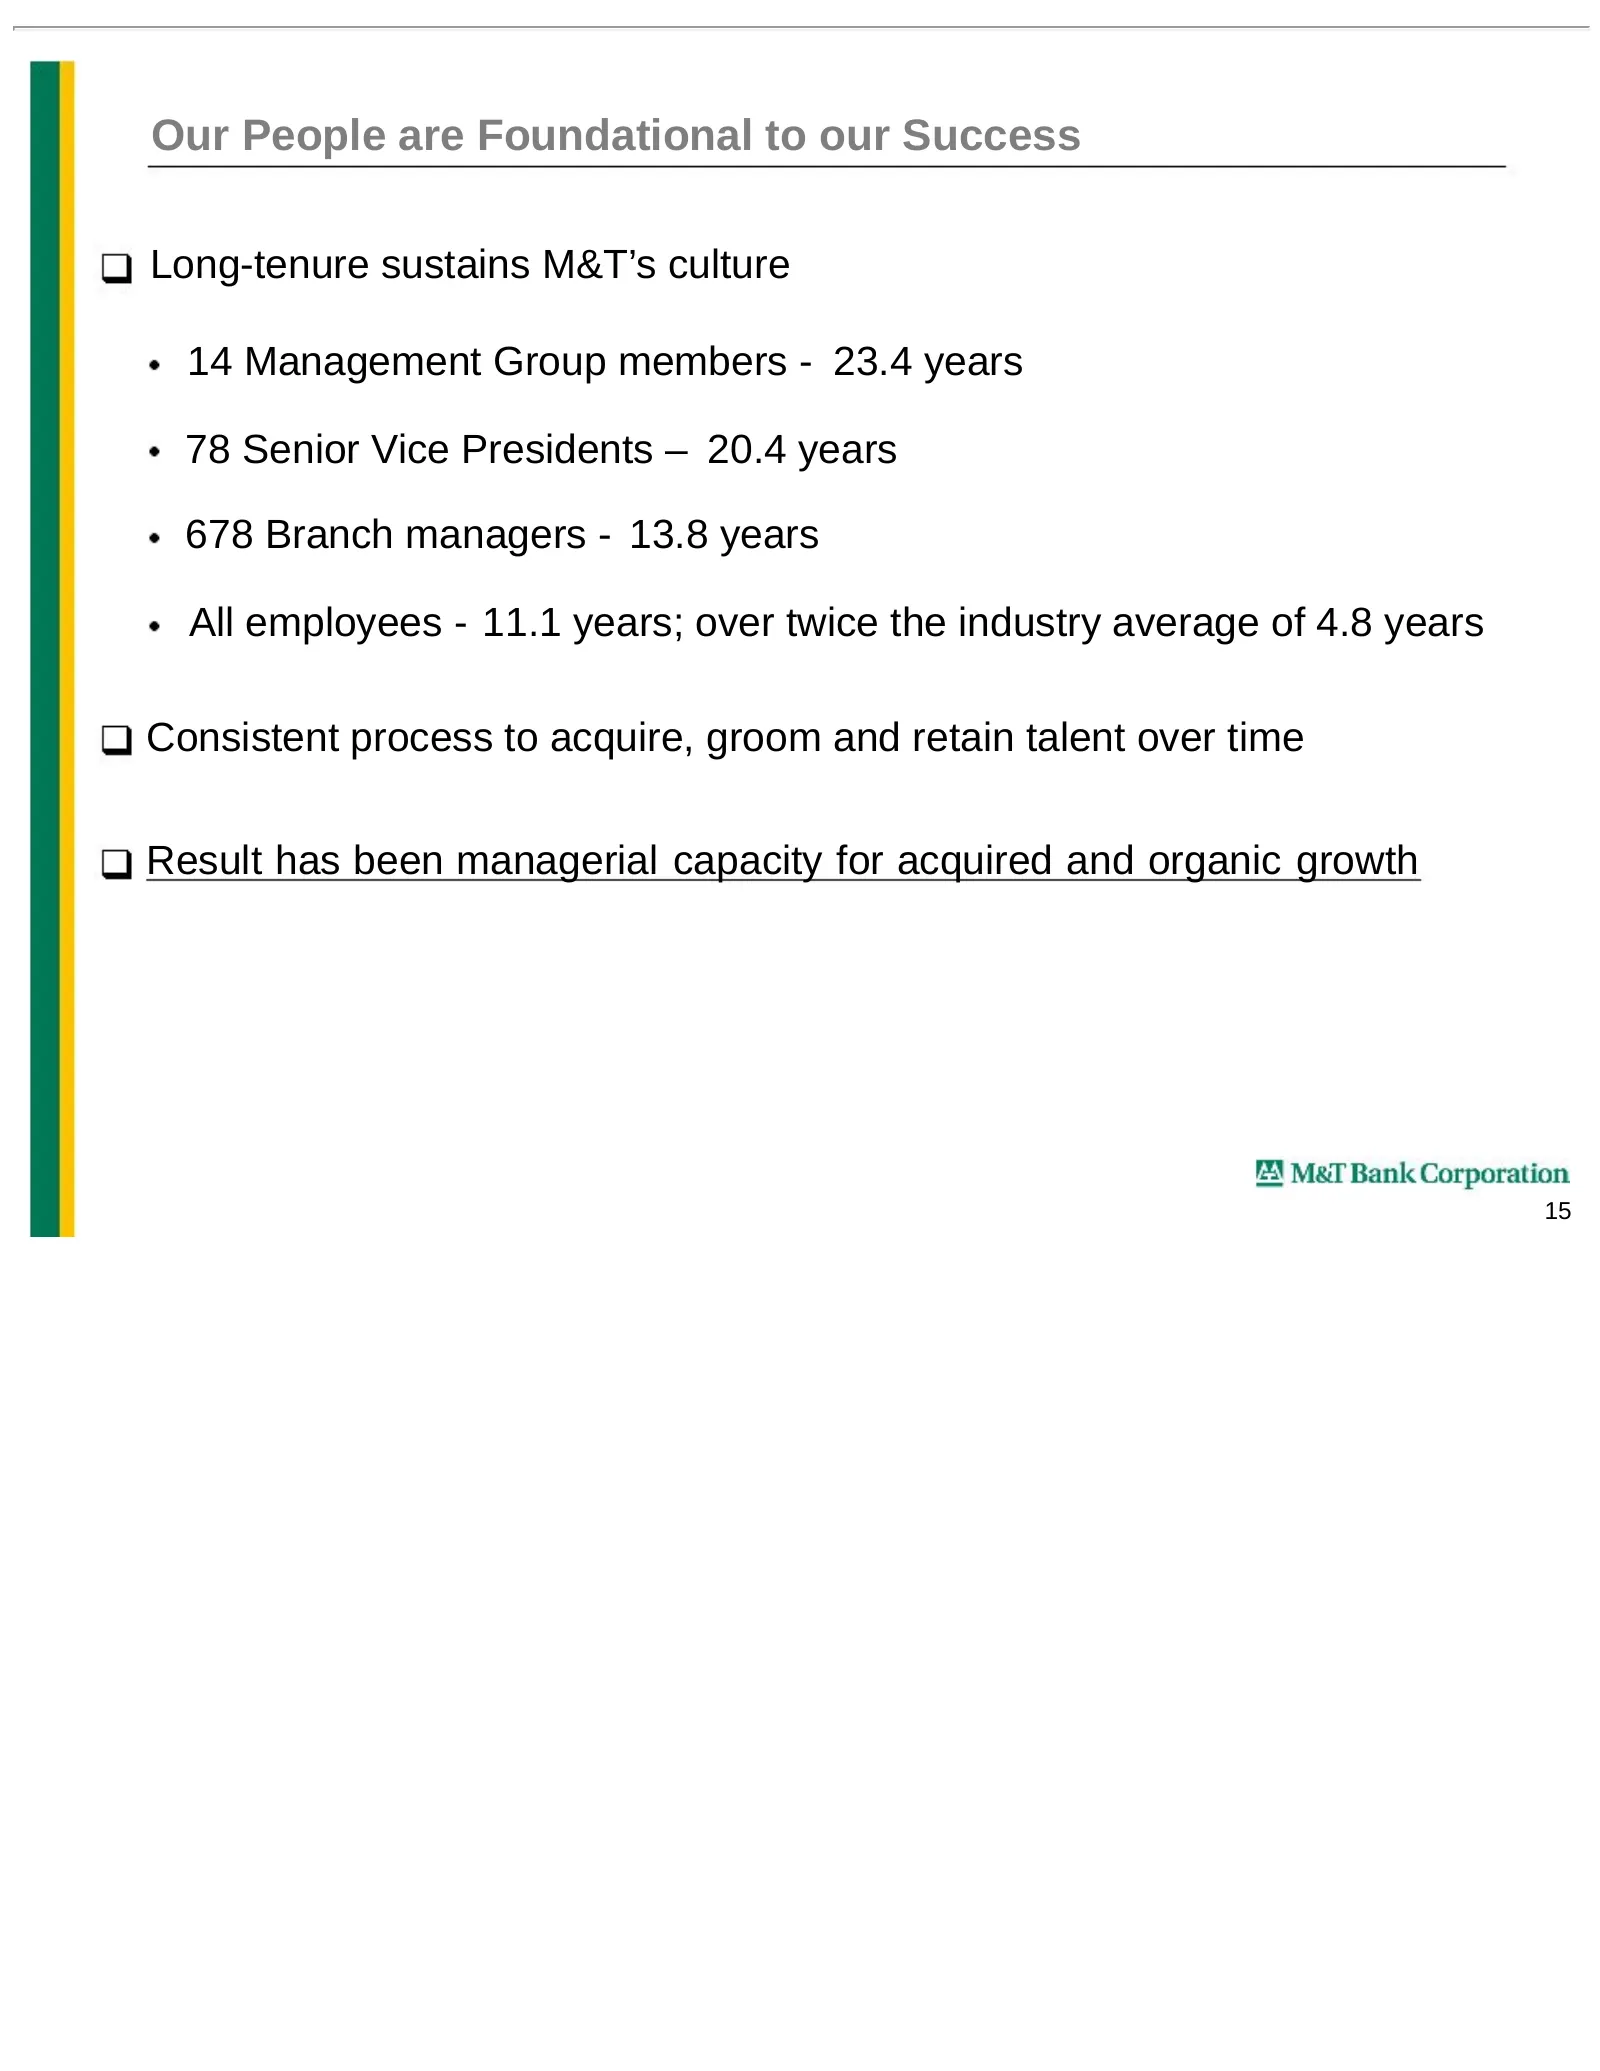
Our People are Foundational to our Success Long-tenure sustains M&T’s culture 14 Management Group members - 23.4 years 78 Senior Vice Presidents – 20.4 years 678 Branch managers - 13.8 years All employees - 11.1 years; over twice the industry average of 4.8 years Consistent process to acquire, groom
Slide 17: Broader, Denser Franchise
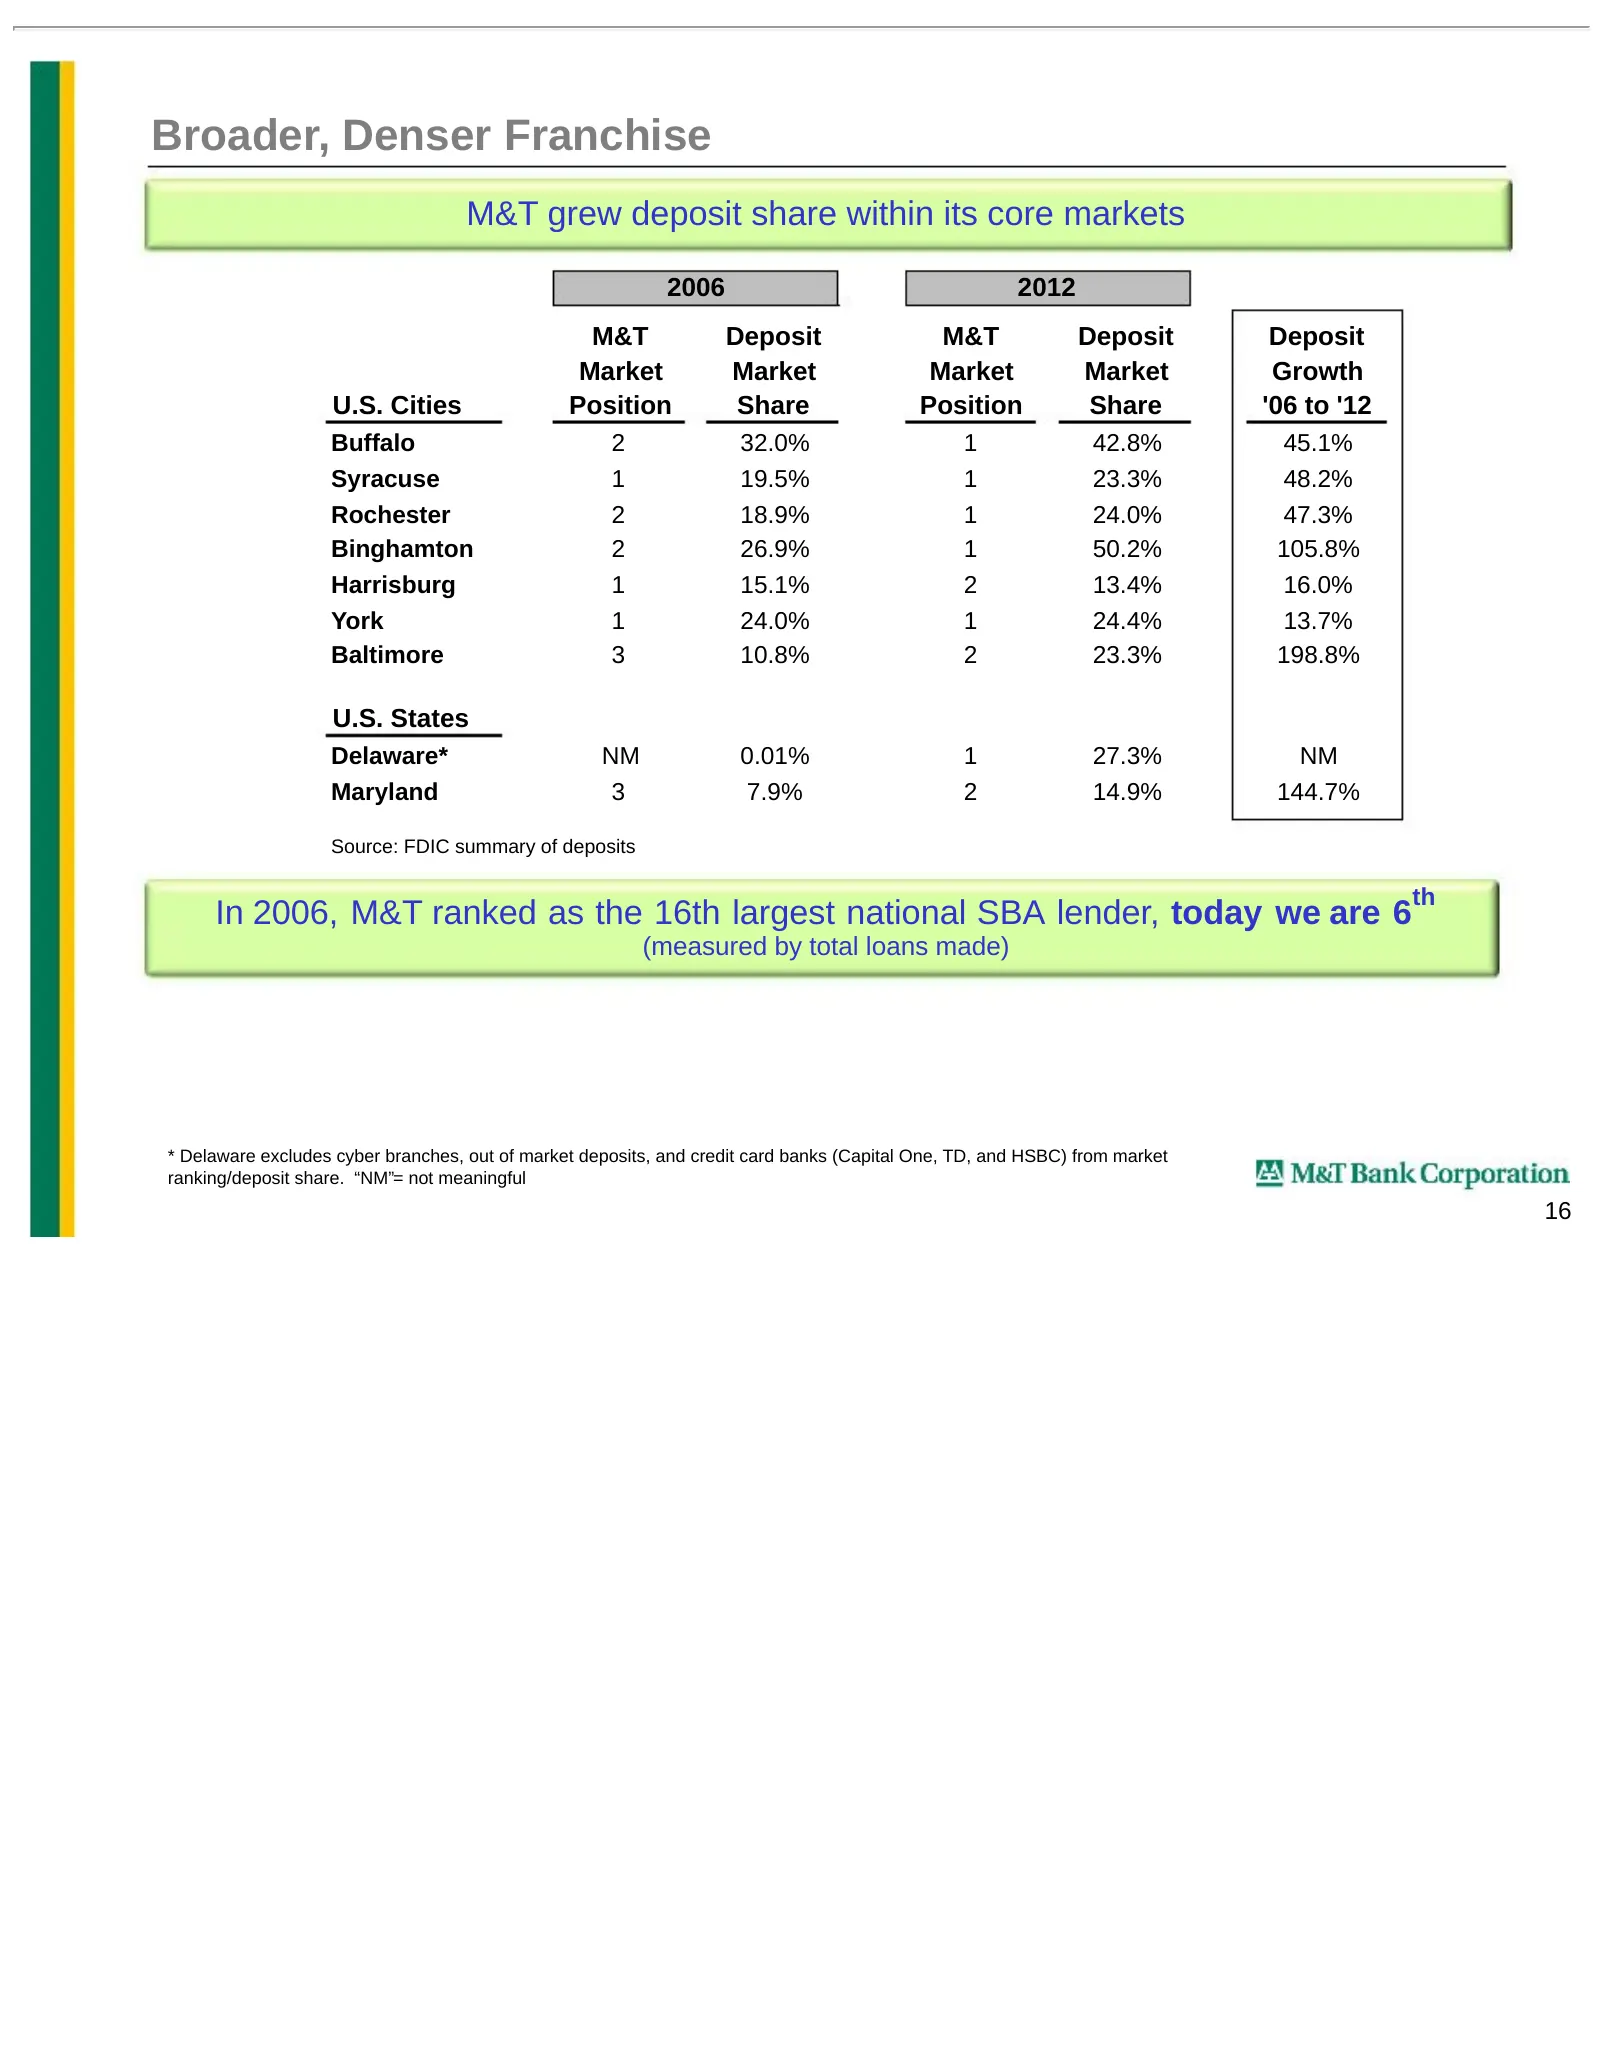
Broader, Denser Franchise M&T grew deposit share within its core markets 2006 2012 M&T Deposit M&T Deposit Deposit Market Market Market Market Growth U.S. Cities Position Share Position Share '06 to '12 Buffalo 2 32.0% 1 42.8% 45.1% Syracuse 1 19.5% 1 23.3% 48.2% Rochester 2 18.9% 1 24.0% 47.3% Bing
Slide 18: M&T's Traditional Strengths
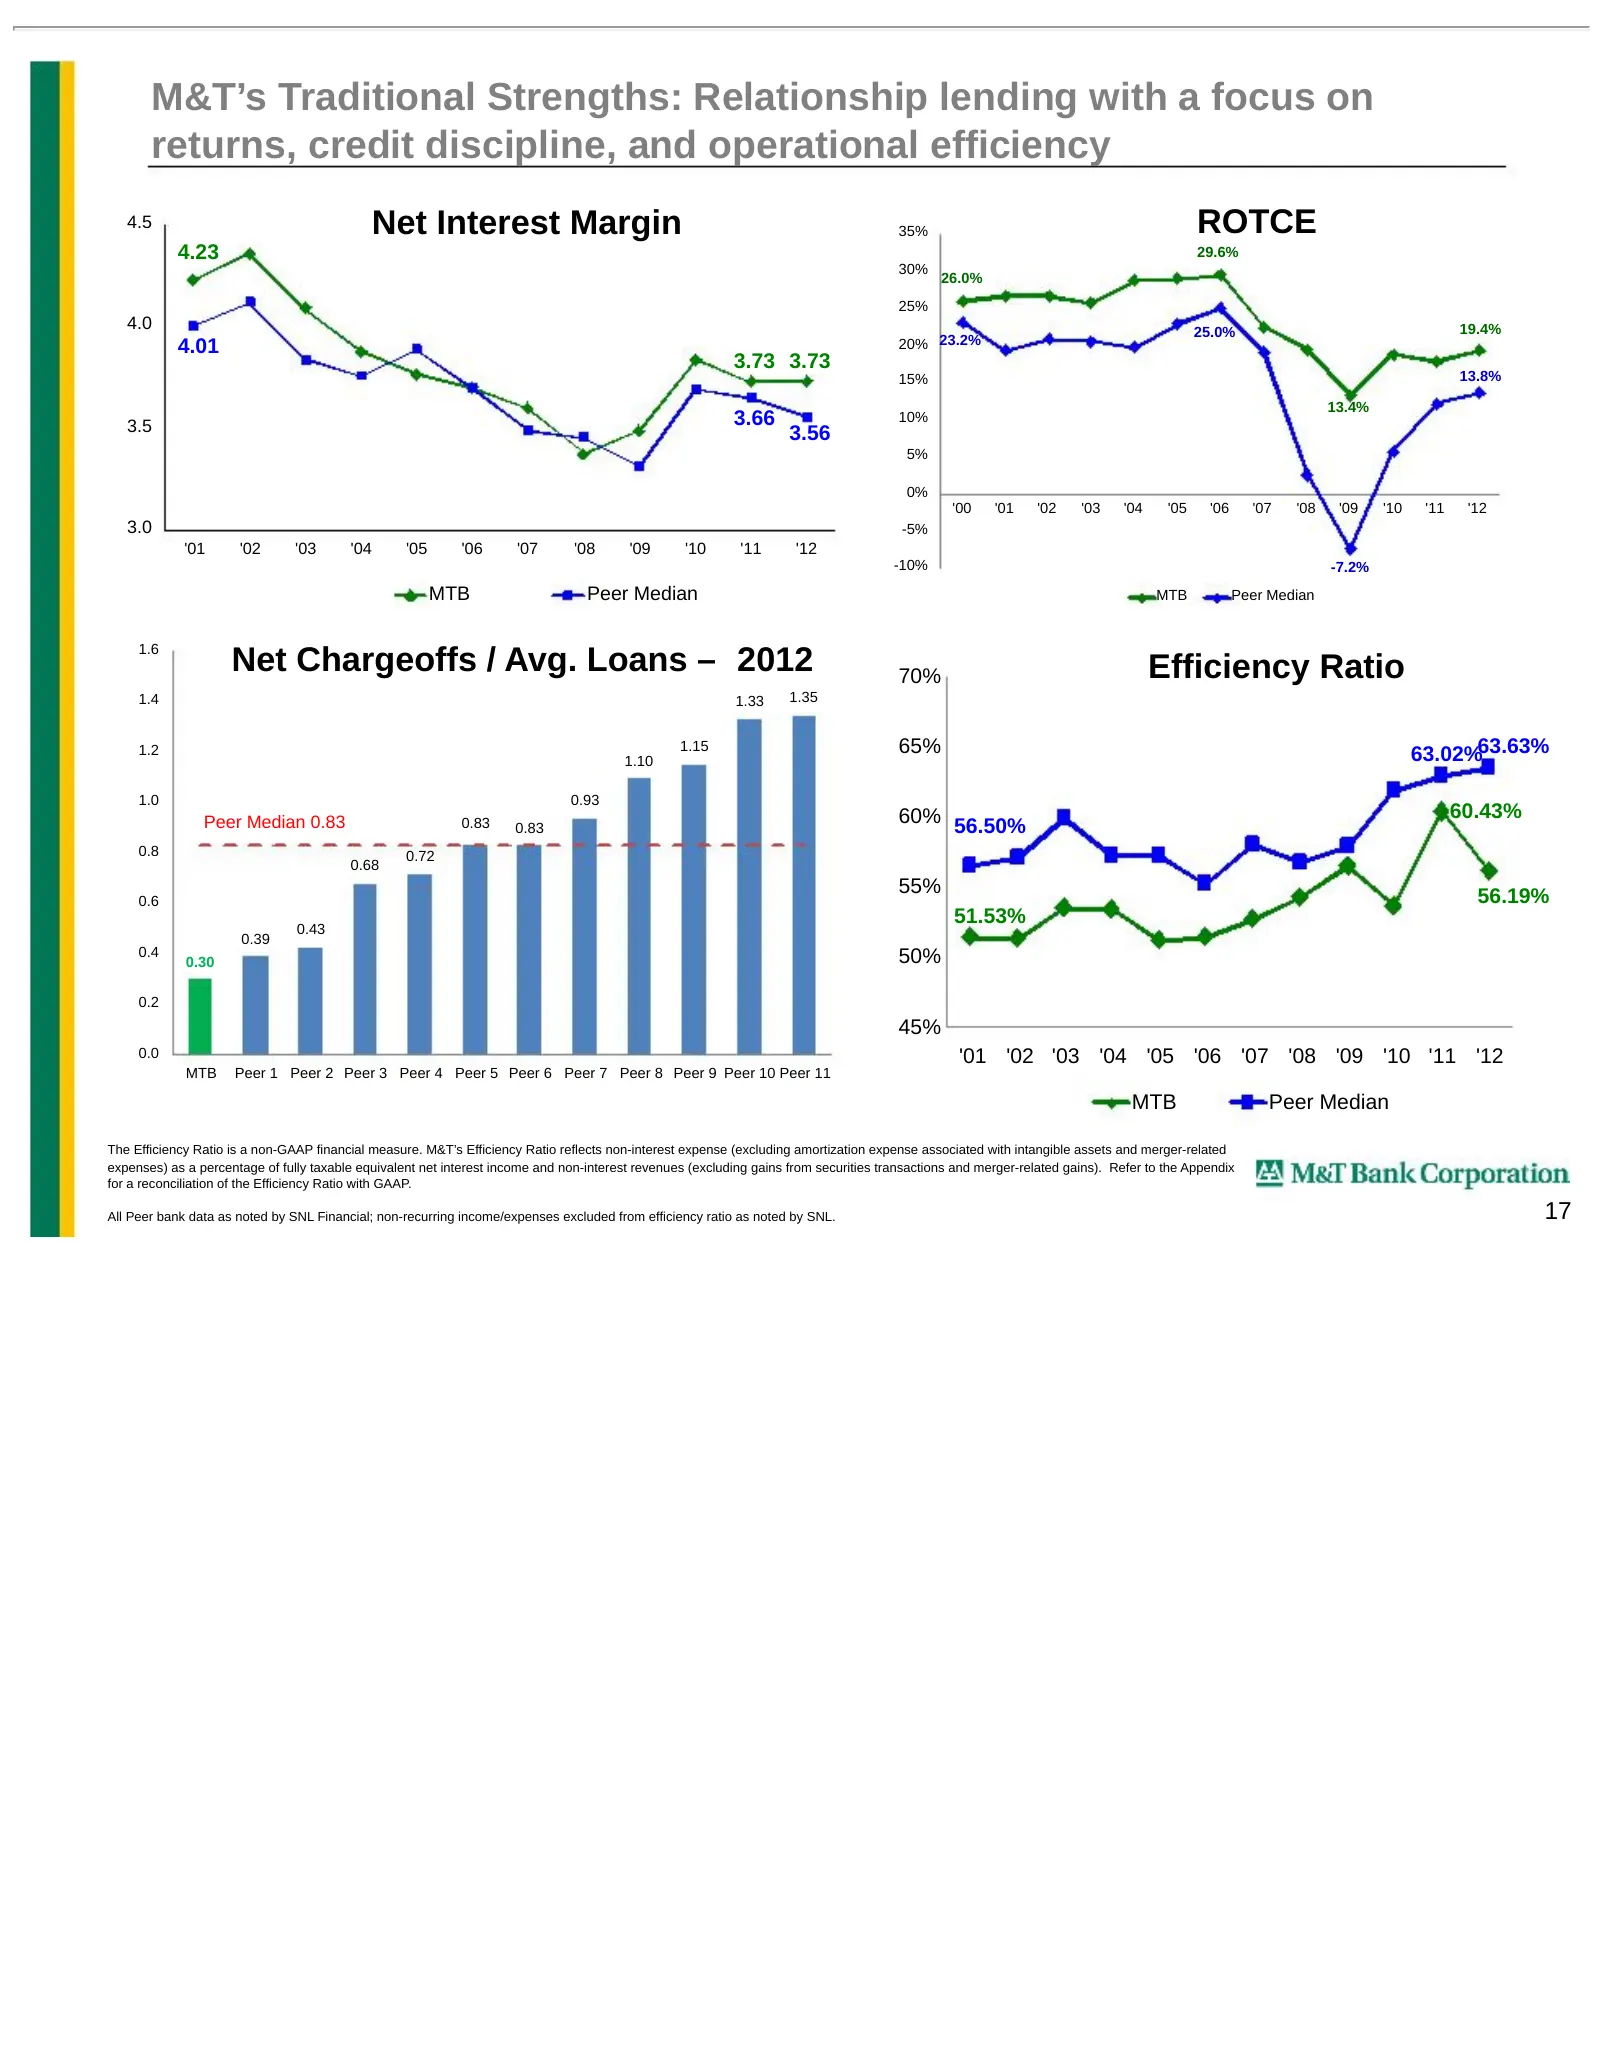
M&T’s Traditional Strengths: Relationship lending with a focus on returns, credit discipline, and operational efficiency 4.5 Net Interest Margin 35% ROTCE 4.23 29.6% 30% 26.0% 25% 4.0 25.0% 19.4% 4.01 20% 23.2% 3.73 3.73 15% 13.8% 13.4% 3.5 3.66 10% 3.56 5% 0% '00 '01 '02 '03 '04 '05 '06 '07 '08 '09
Slide 19: A History of Above-Average Shareholder Returns
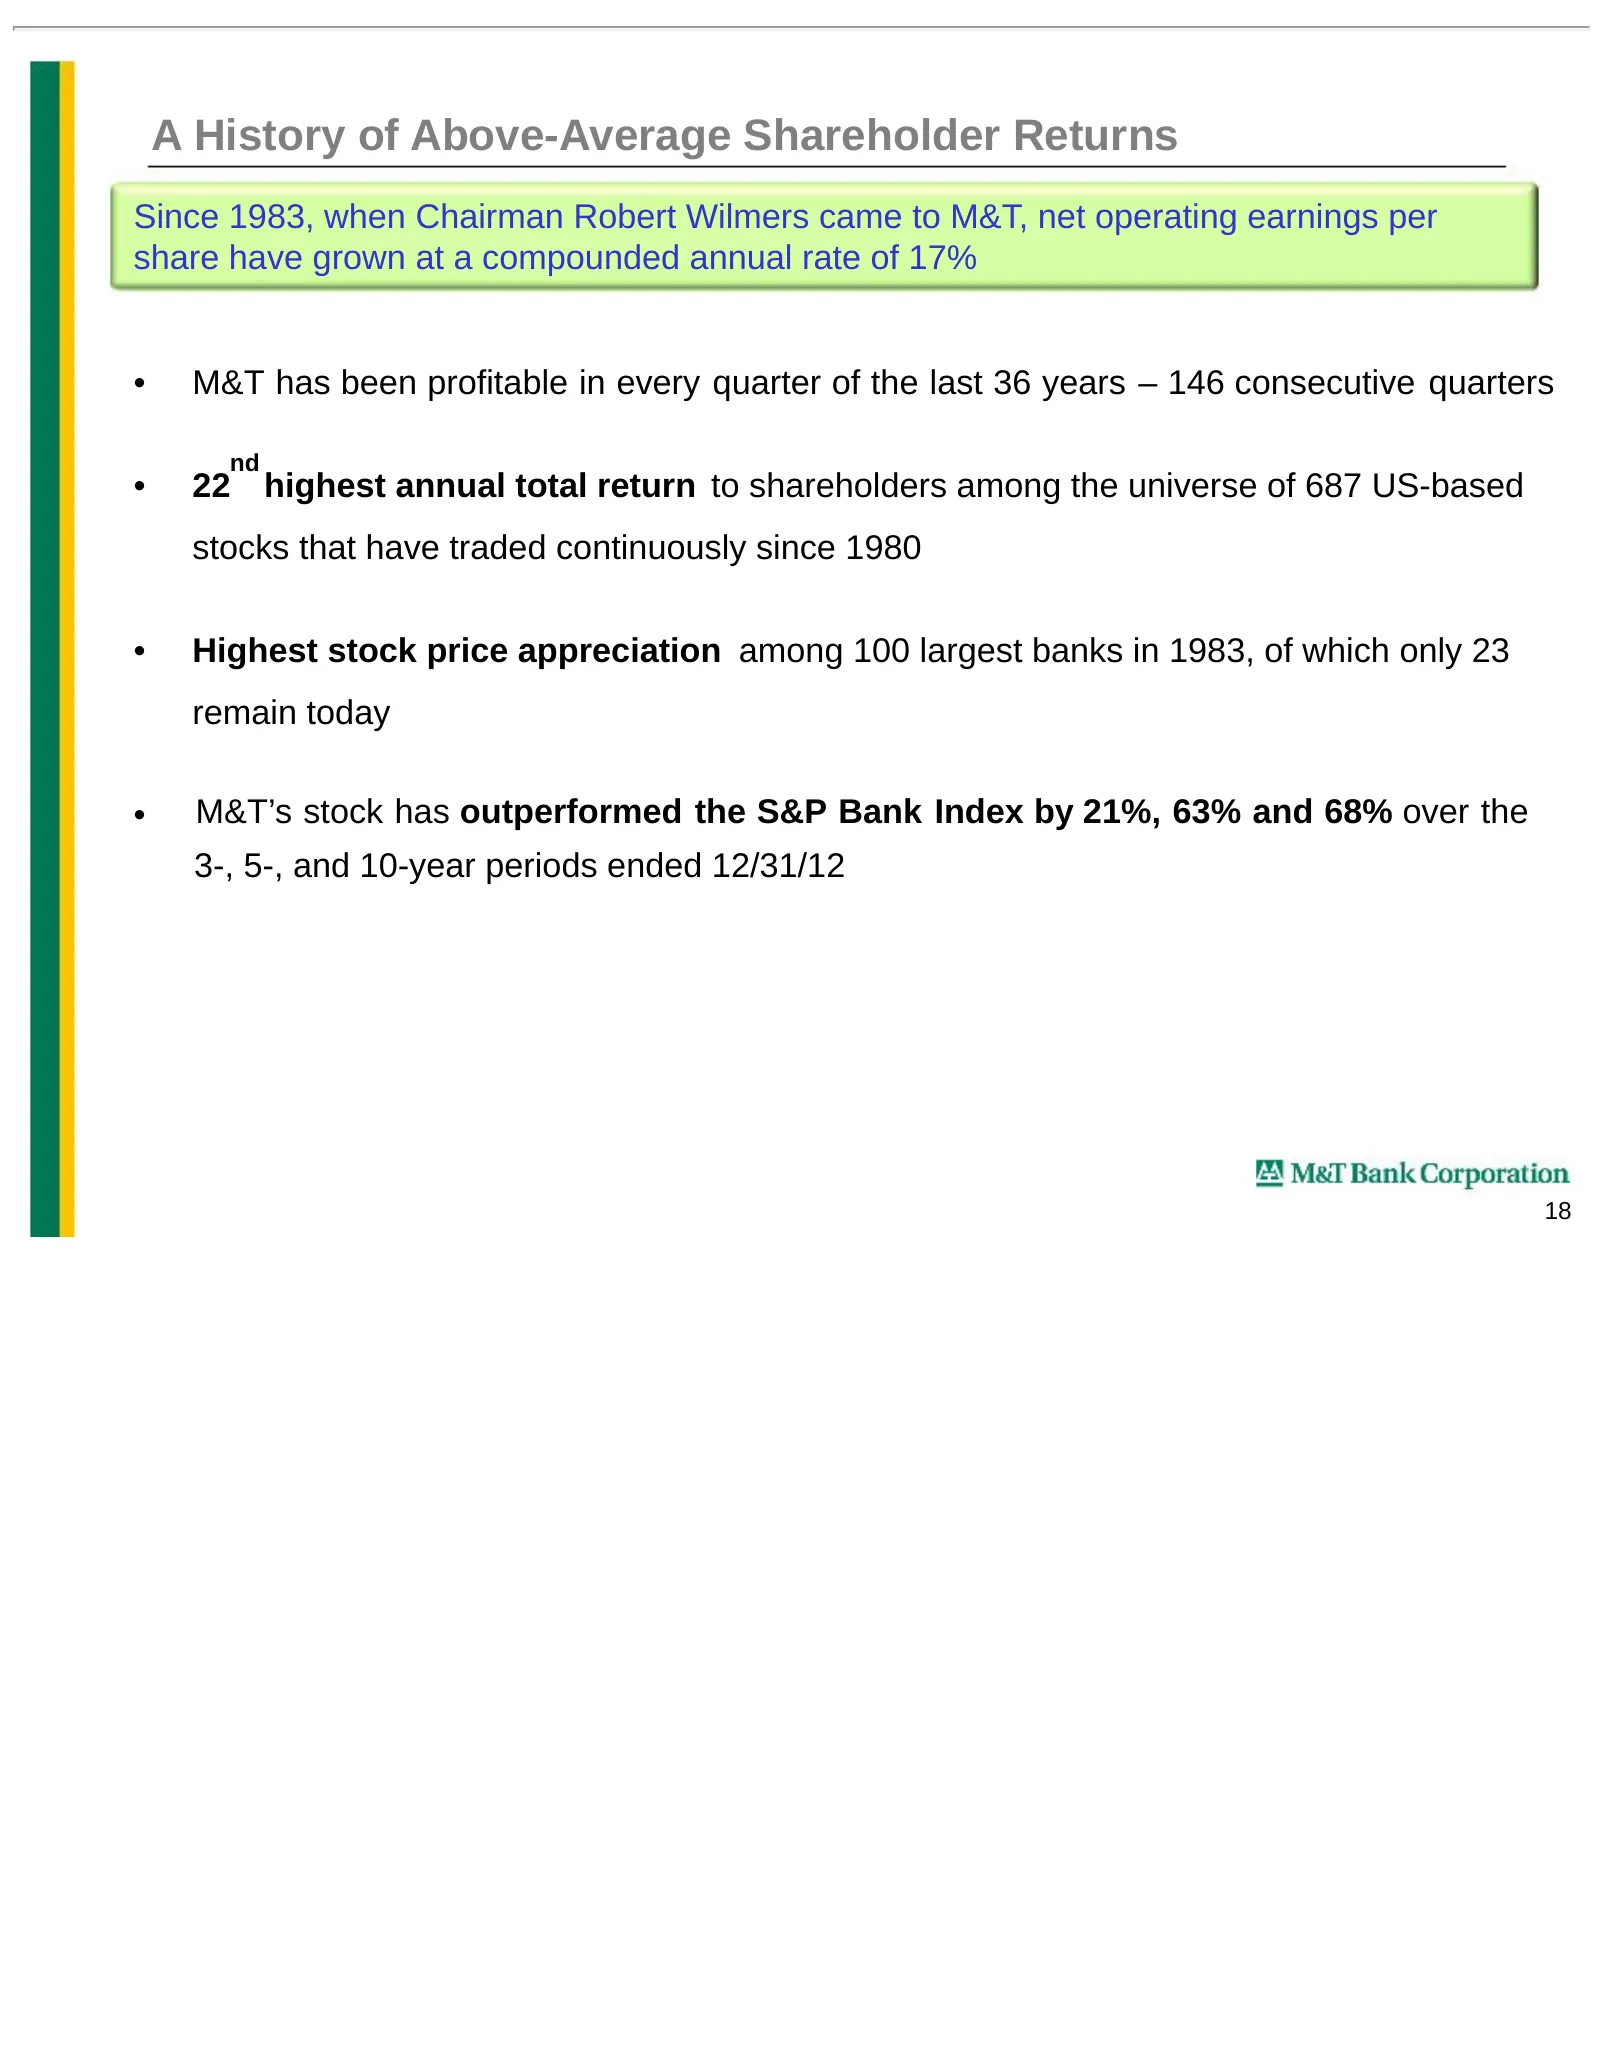
A History of Above-Average Shareholder Returns Since 1983, when Chairman Robert Wilmers came to M&T, net operating earnings per share have grown at a compounded annual rate of 17% • M&T has been profitable in every quarter of the last 36 years – 146 consecutive quarters nd • 22 highest annual total
Slide 20: Earnings & Dividend Growth: 1983 – 2012
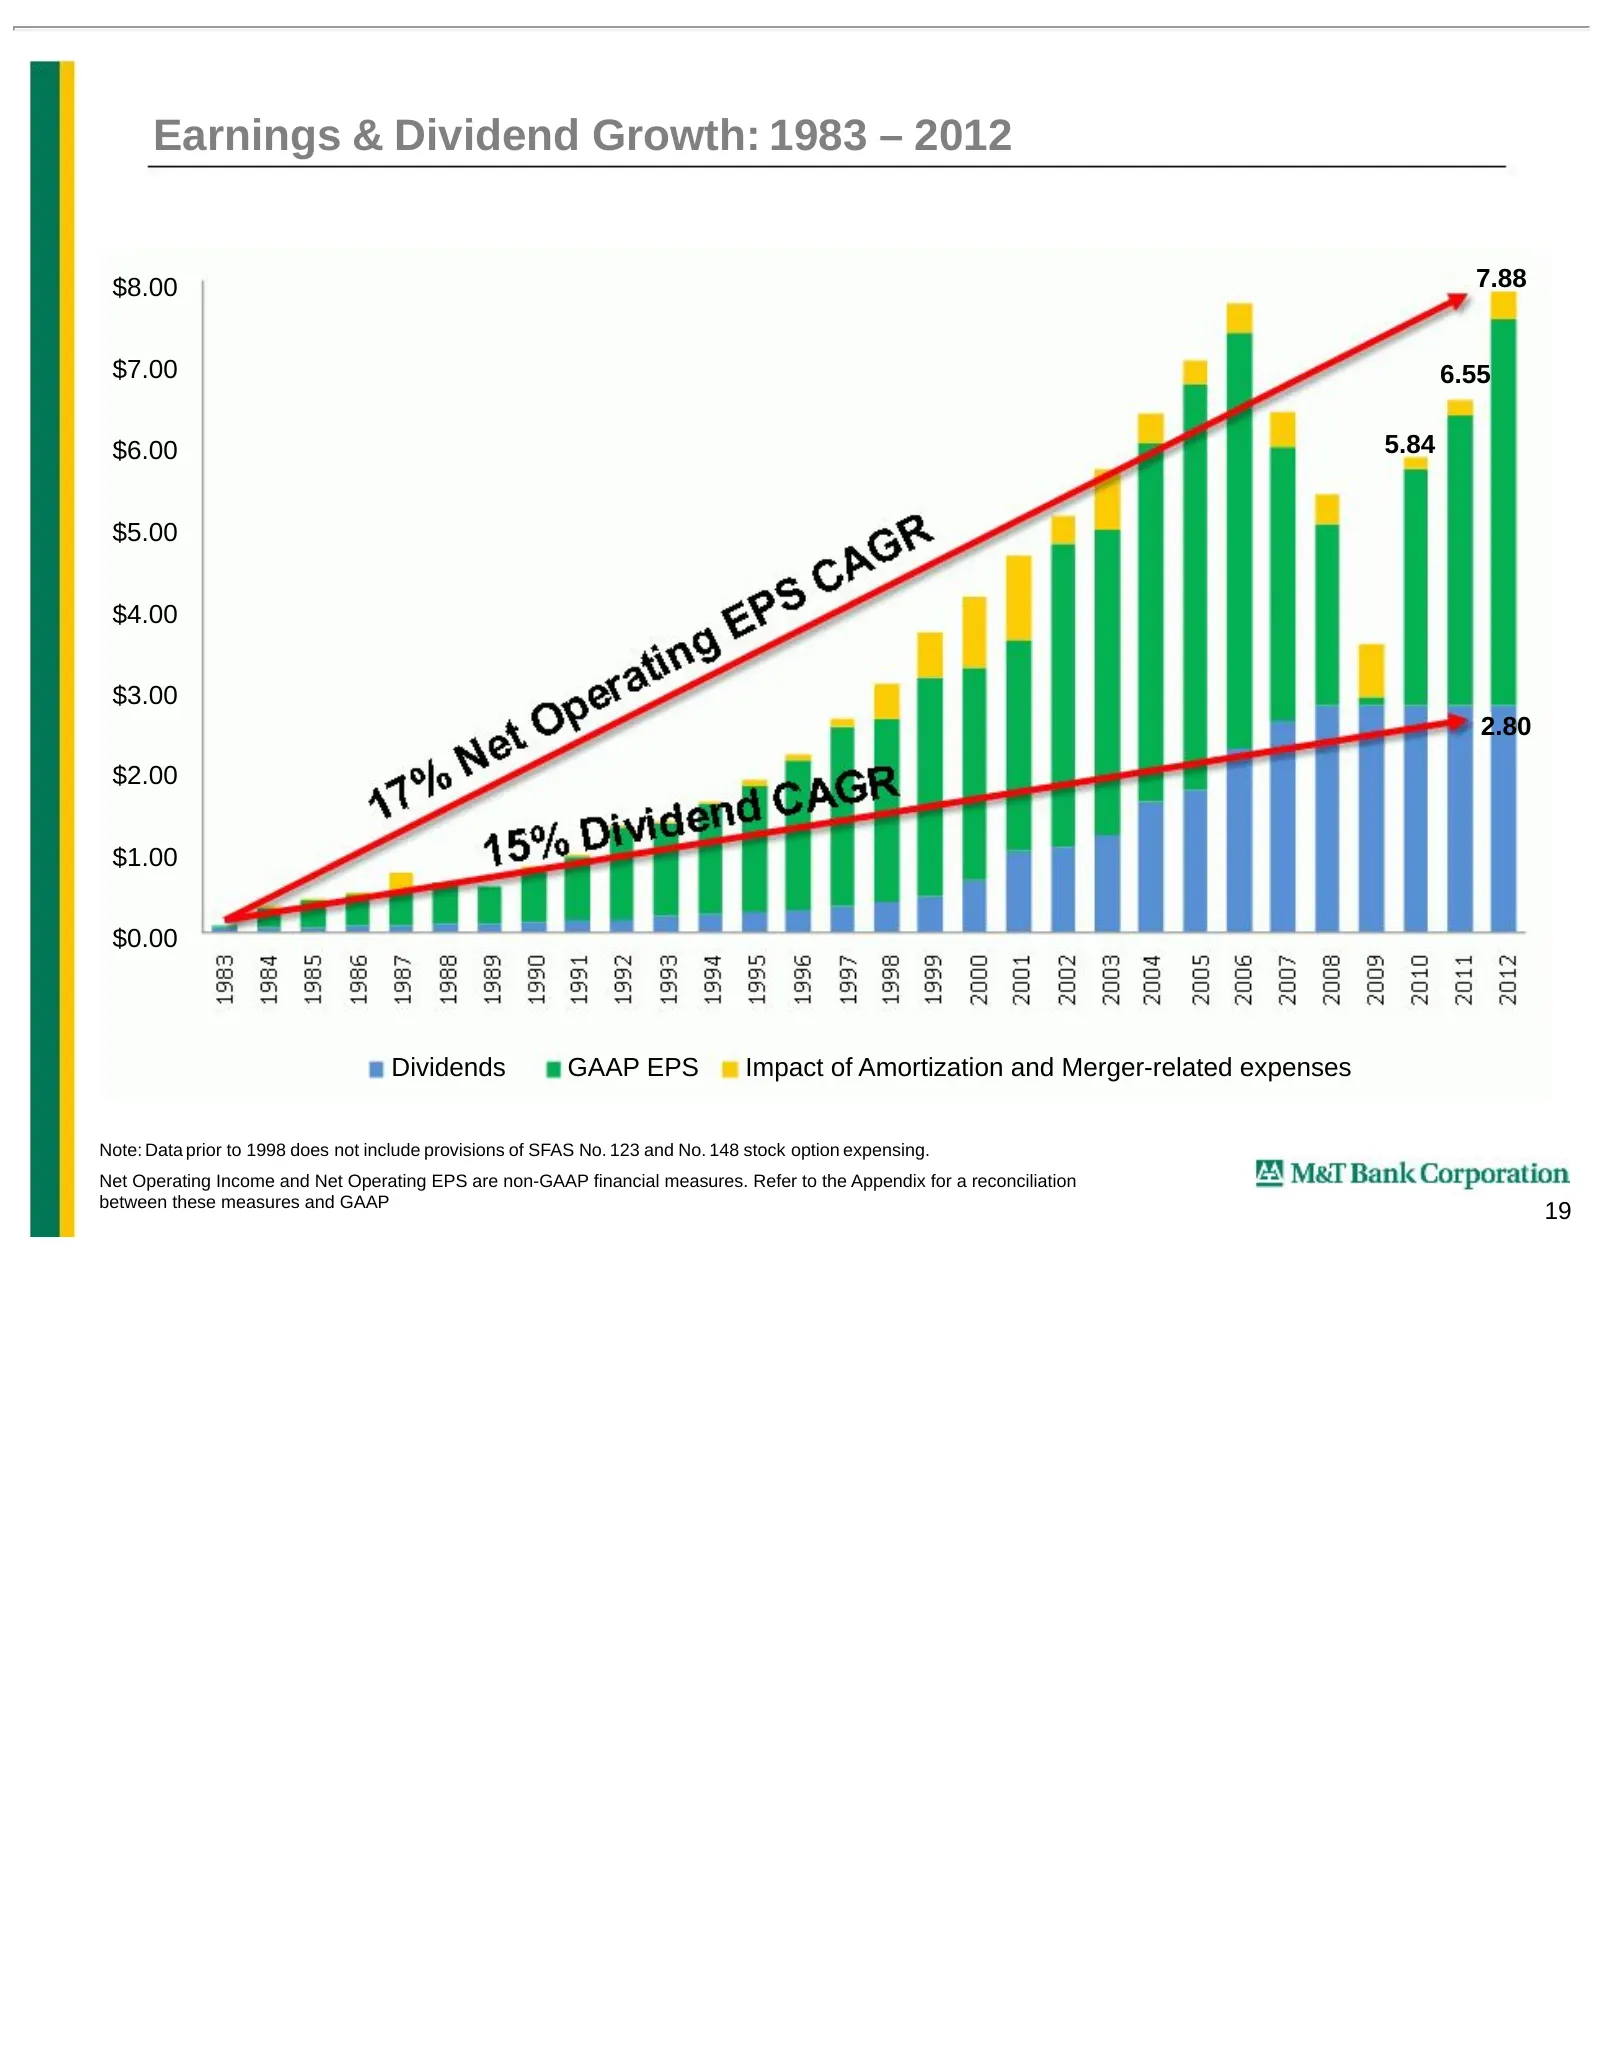
Earnings & Dividend Growth: 1983 – 2012 $8.00 7.88 $7.00 6.55 $6.00 5.84 $5.00 $4.00 $3.00 2.80 $2.00 $1.00 $0.00 Dividends GAAP EPS Impact of Amortization and Merger-related expenses Note: Data prior to 1998 does not include provisions of SFAS No. 123 and No. 148 stock option expensing. Net Operati

Slide 21: Updates
Updates f\ MaT Bank Corporation 20
Slide 22: Update on Hudson City merger
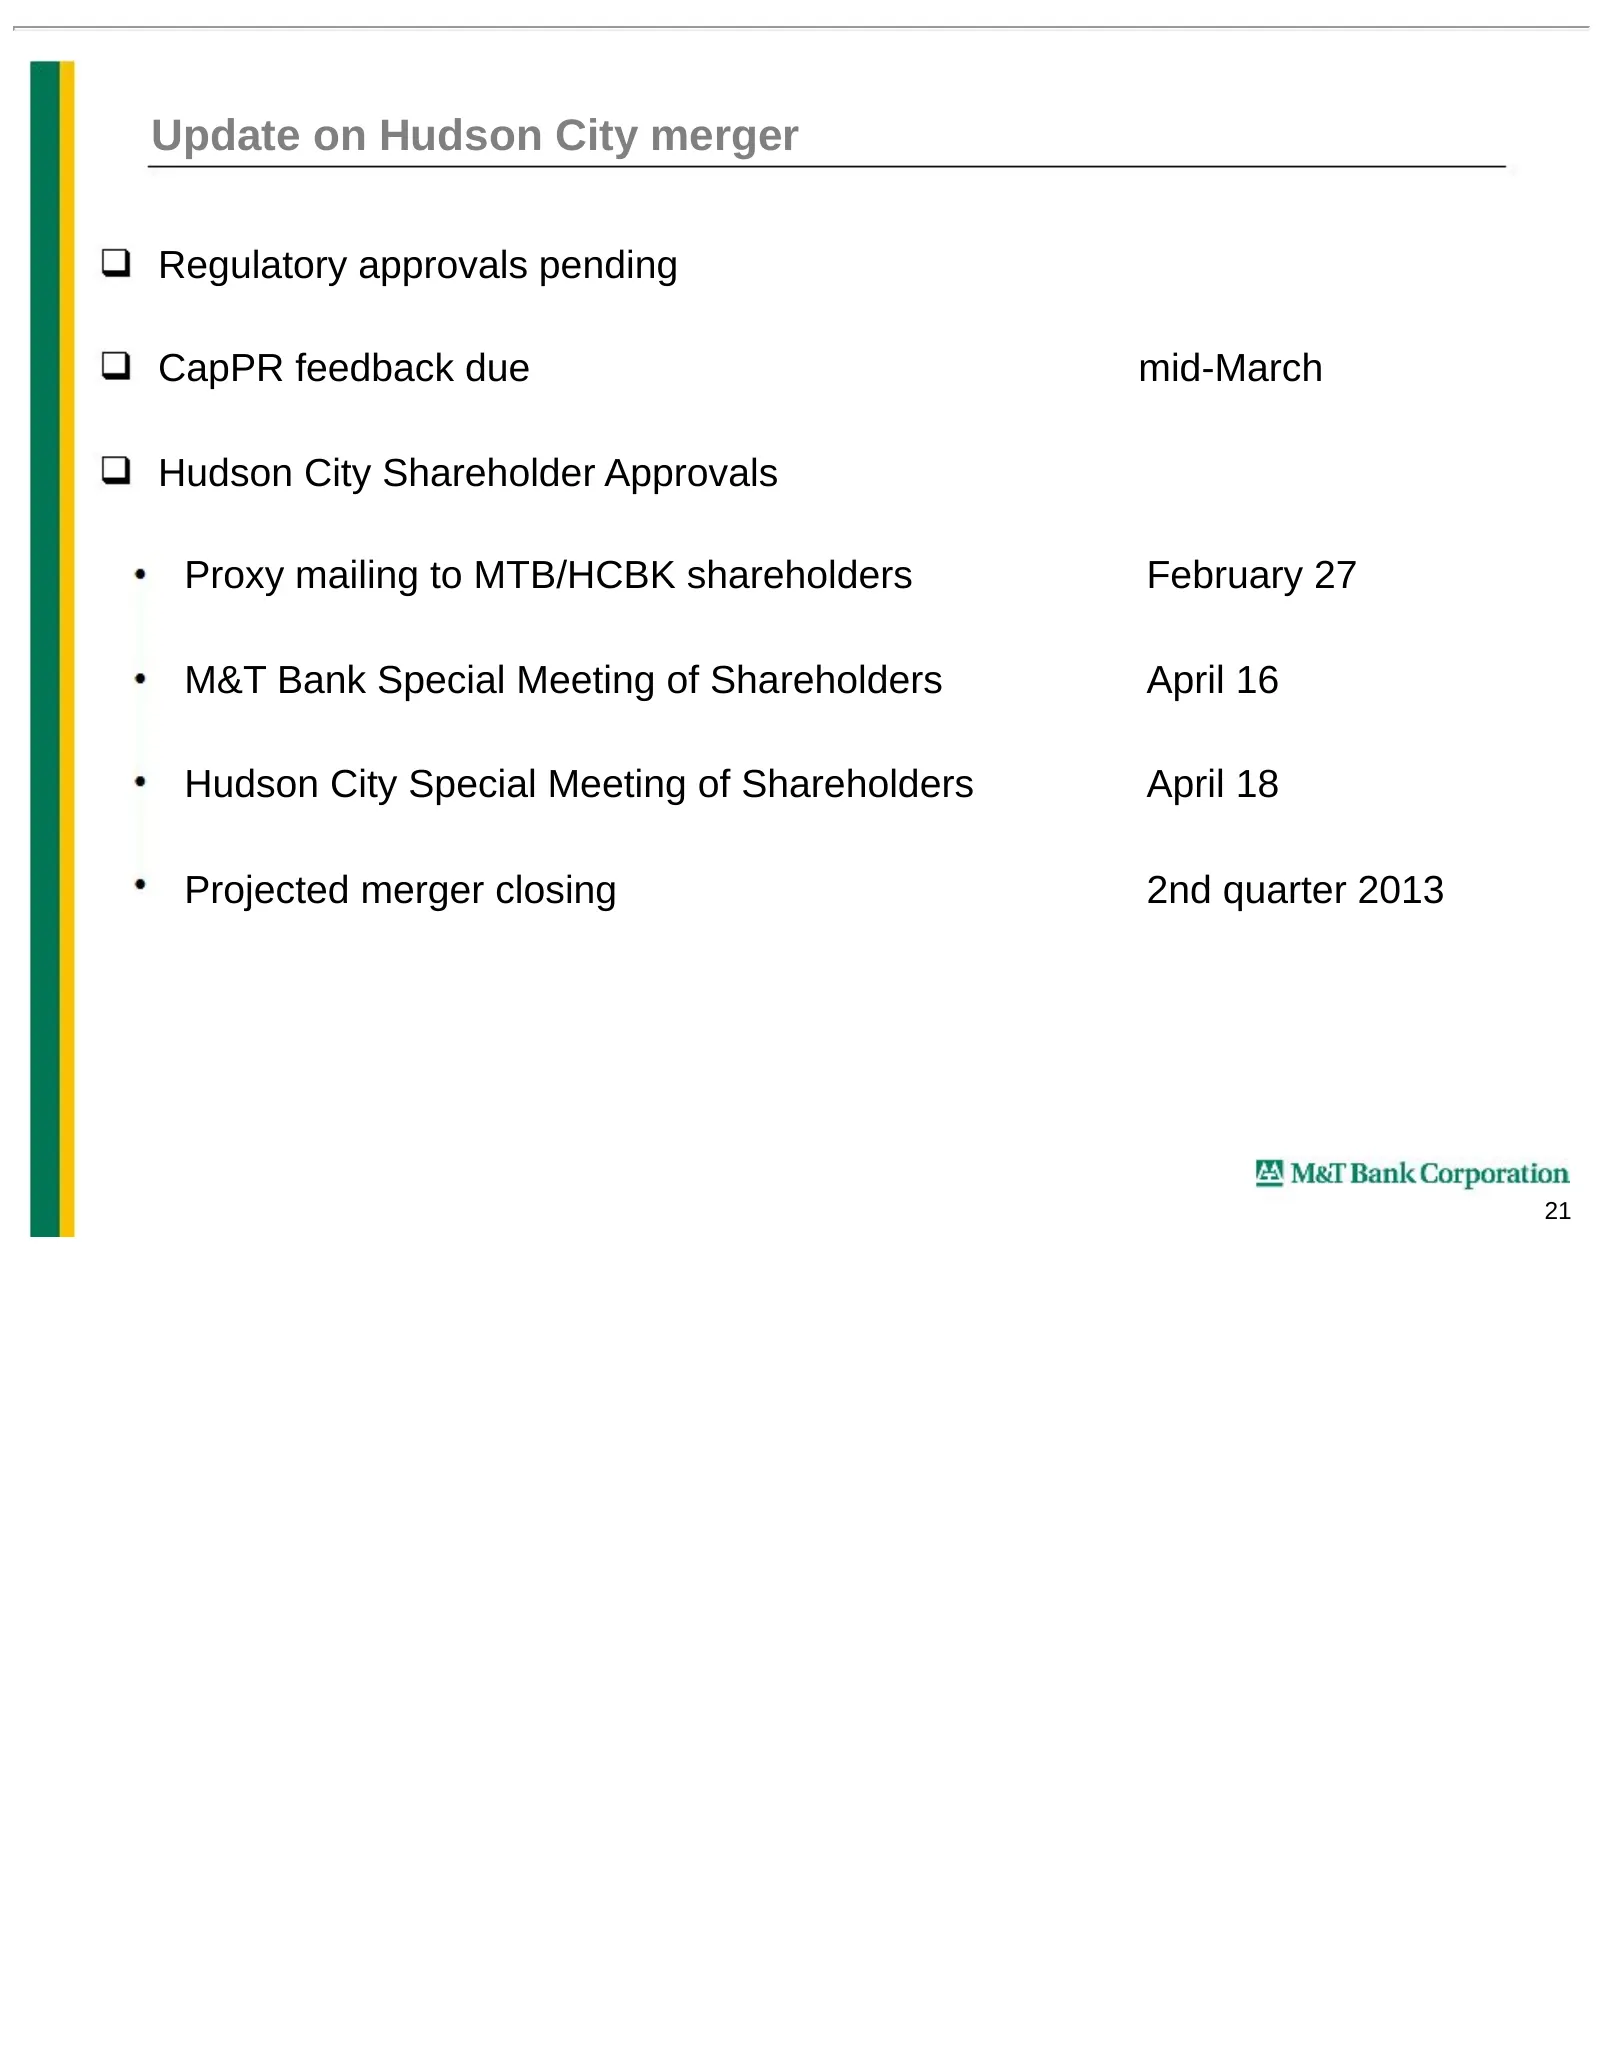
Update on Hudson City merger Regulatory approvals pending CapPR feedback due mid-March Hudson City Shareholder Approvals Proxy mailing to MTB/HCBK shareholders February 27 M&T Bank Special Meeting of Shareholders April 16 Hudson City Special Meeting of Shareholders April 18 Projected merger closing
Slide 23: Update on Hudson City merger (continued)
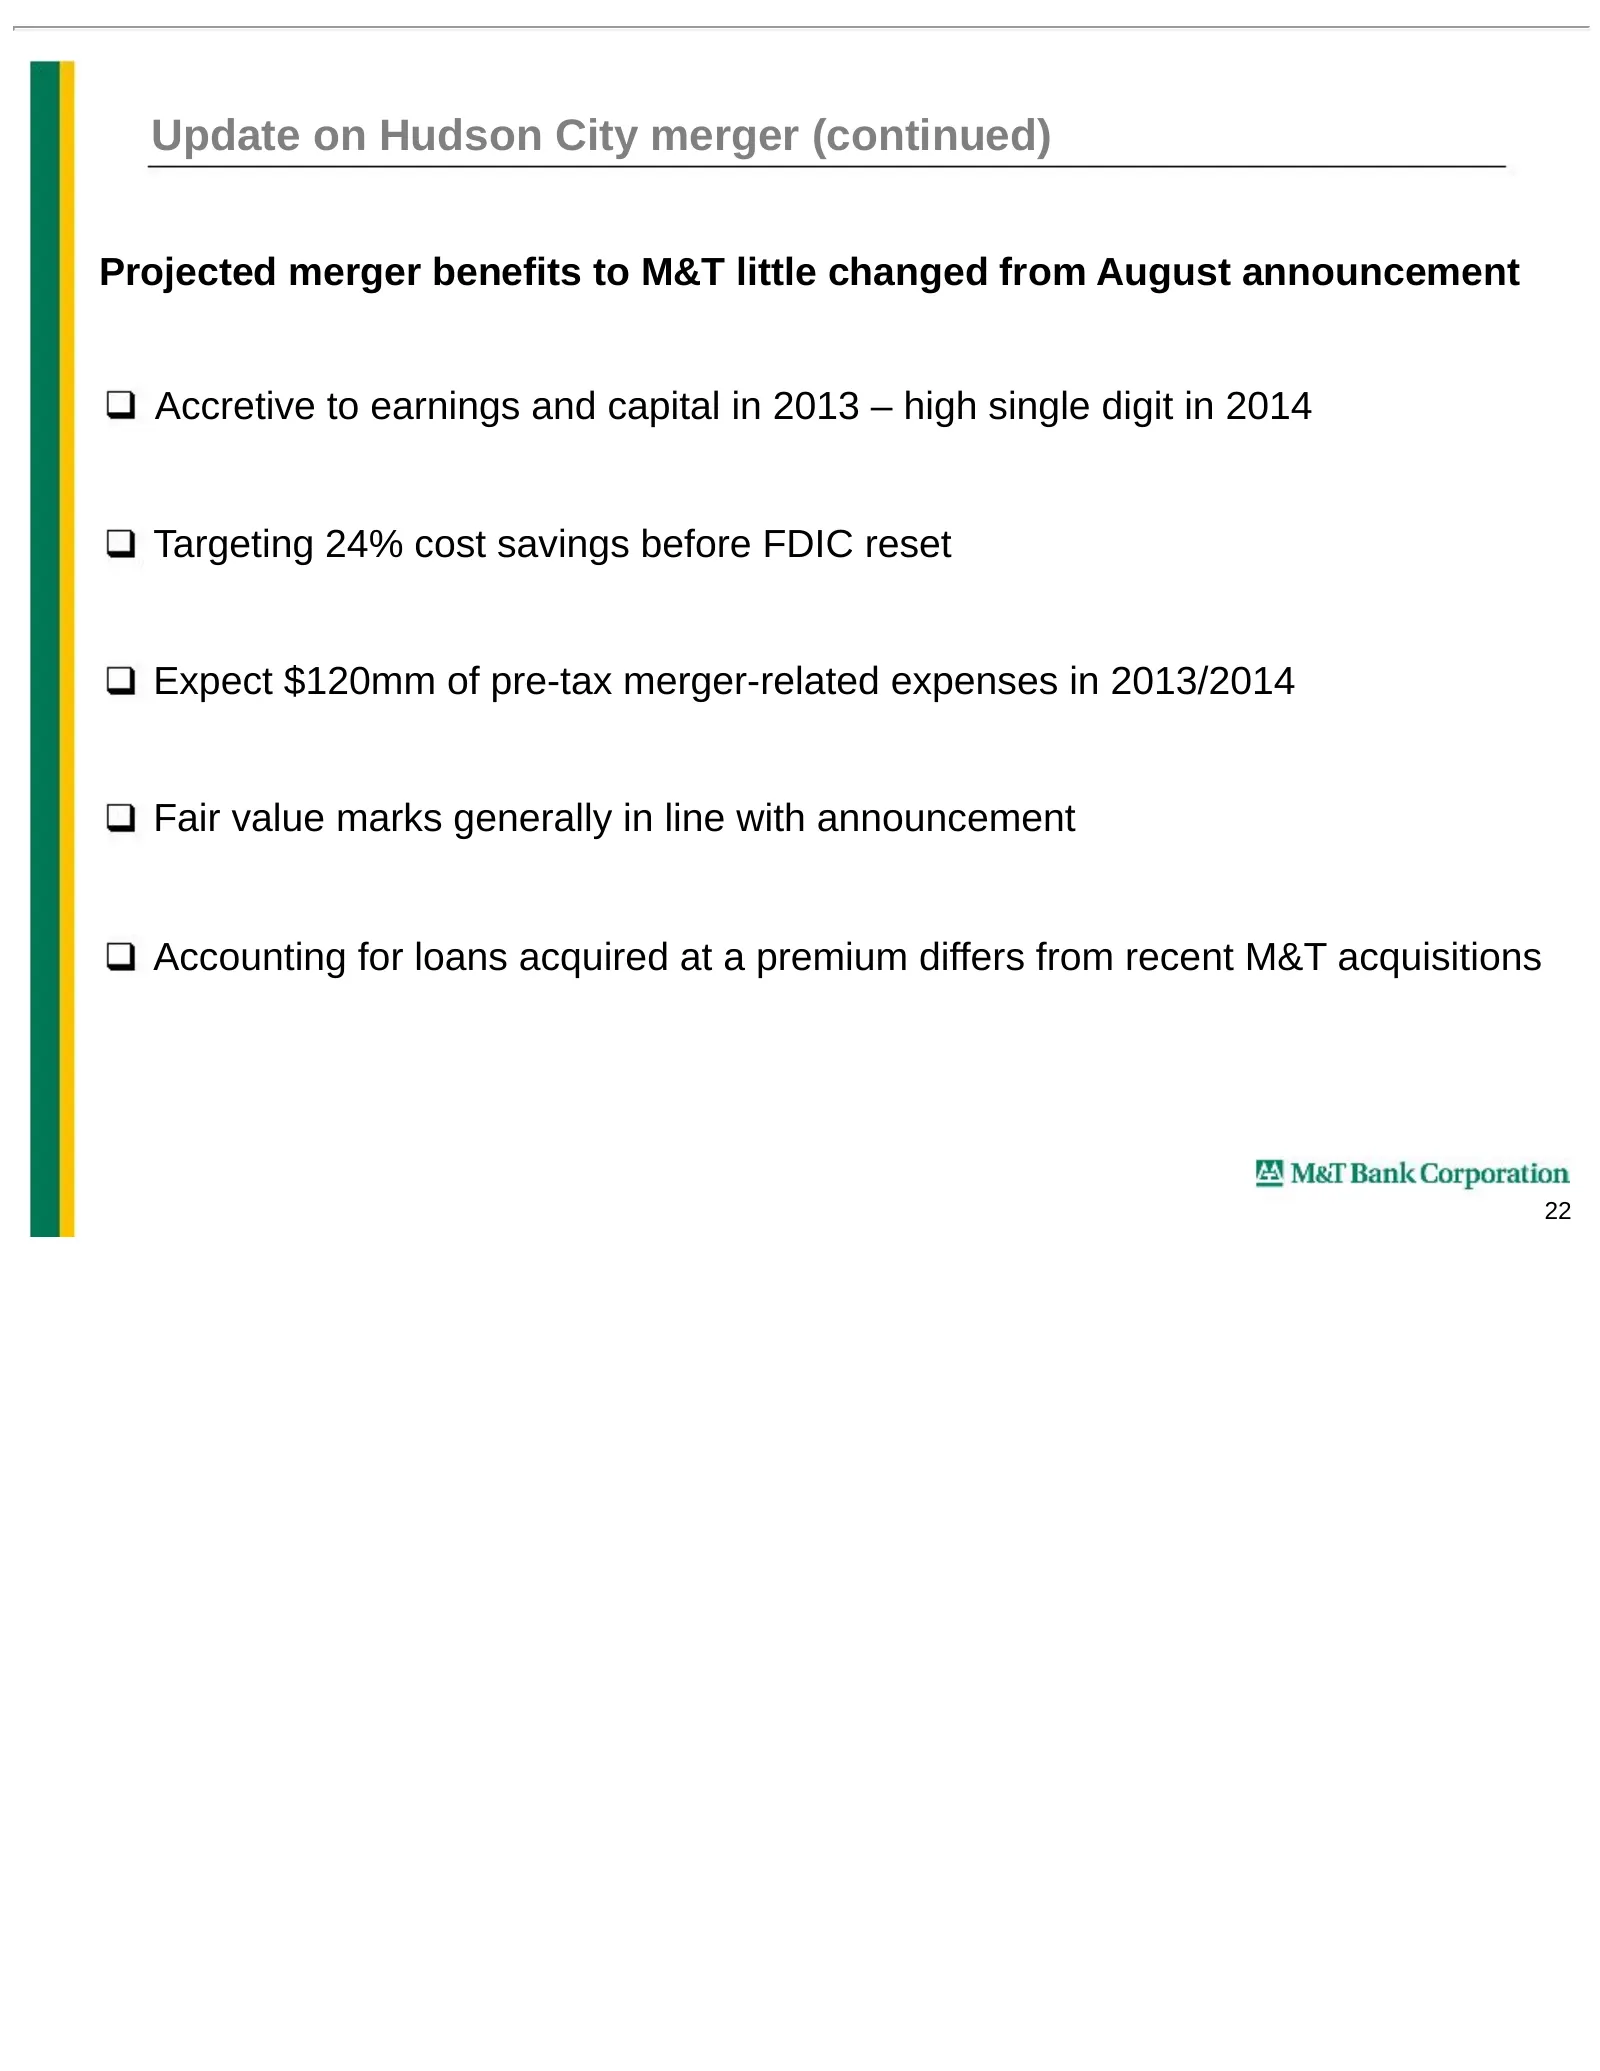
Update on Hudson City merger (continued) Projected merger benefits to M&T little changed from August announcement Accretive to earnings and capital in 2013 – high single digit in 2014 Targeting 24% cost savings before FDIC reset Expect $120mm of pre-tax merger-related expenses in 2013/2014 Fair valu
Slide 24: Outlook
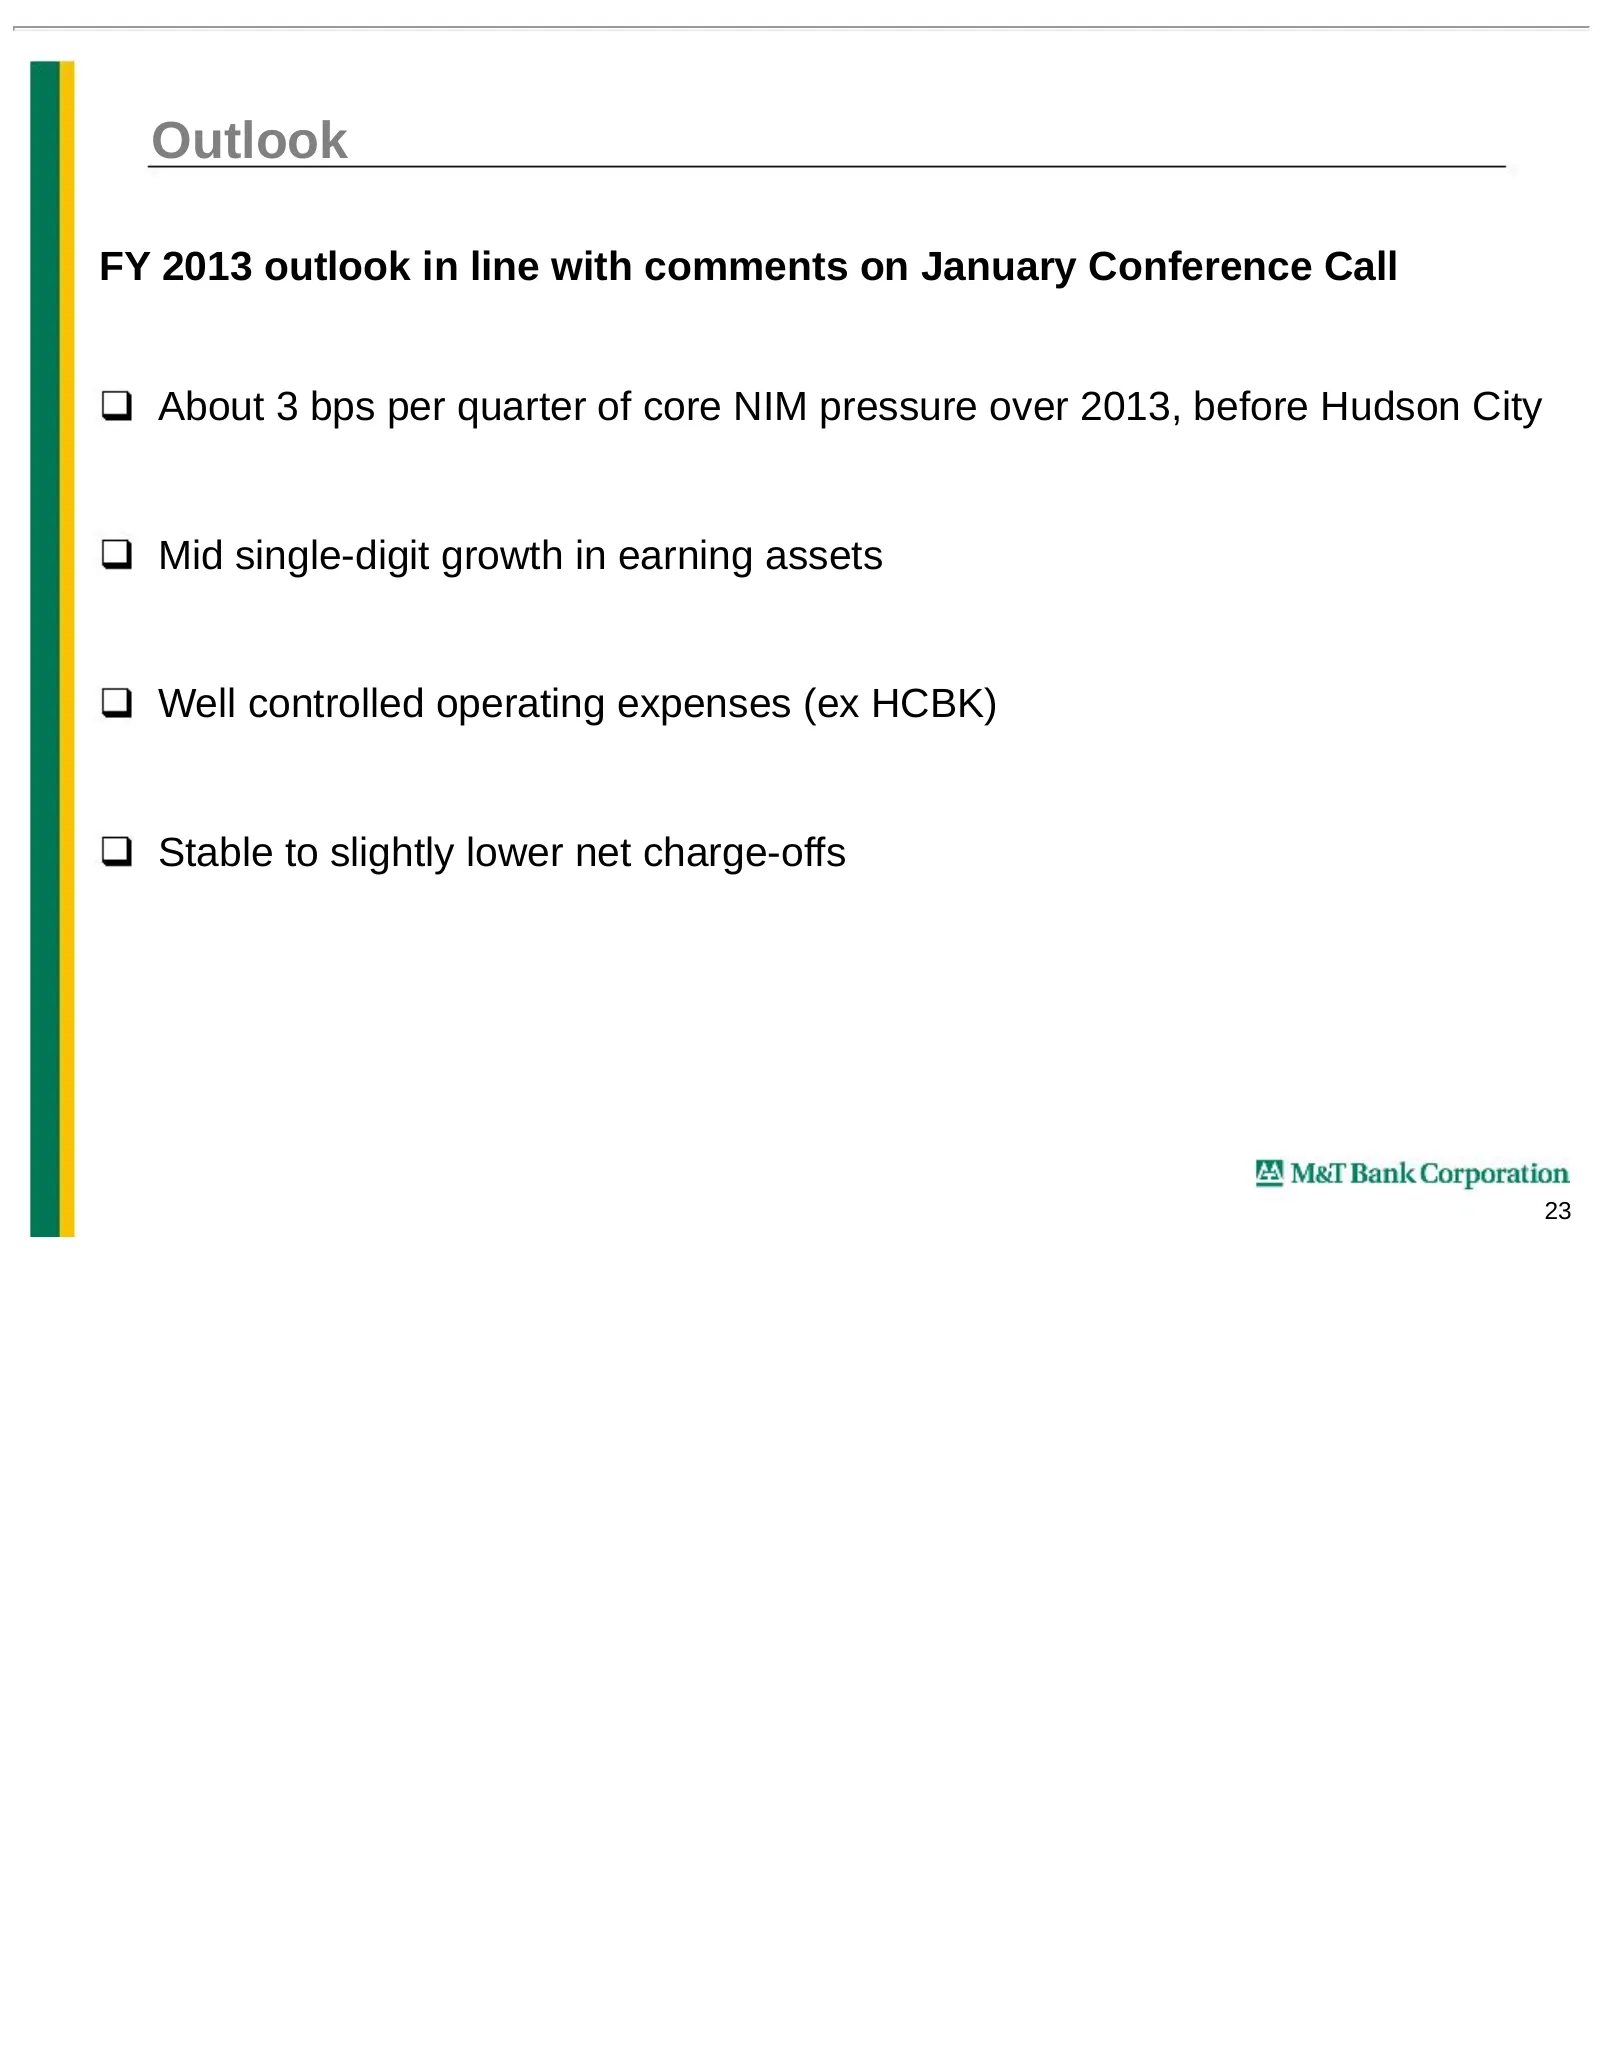
Outlook FY 2013 outlook in line with comments on January Conference Call About 3 bps per quarter of core NIM pressure over 2013, before Hudson City Mid single-digit growth in earning assets Well controlled operating expenses (ex HCBK) Stable to slightly lower net charge-offs 23
Slide 25: Appendix
Appendix f\ MaT Bank Corporation 24
Slide 26: Reconciliation of GAAP to Non-GAAP measures
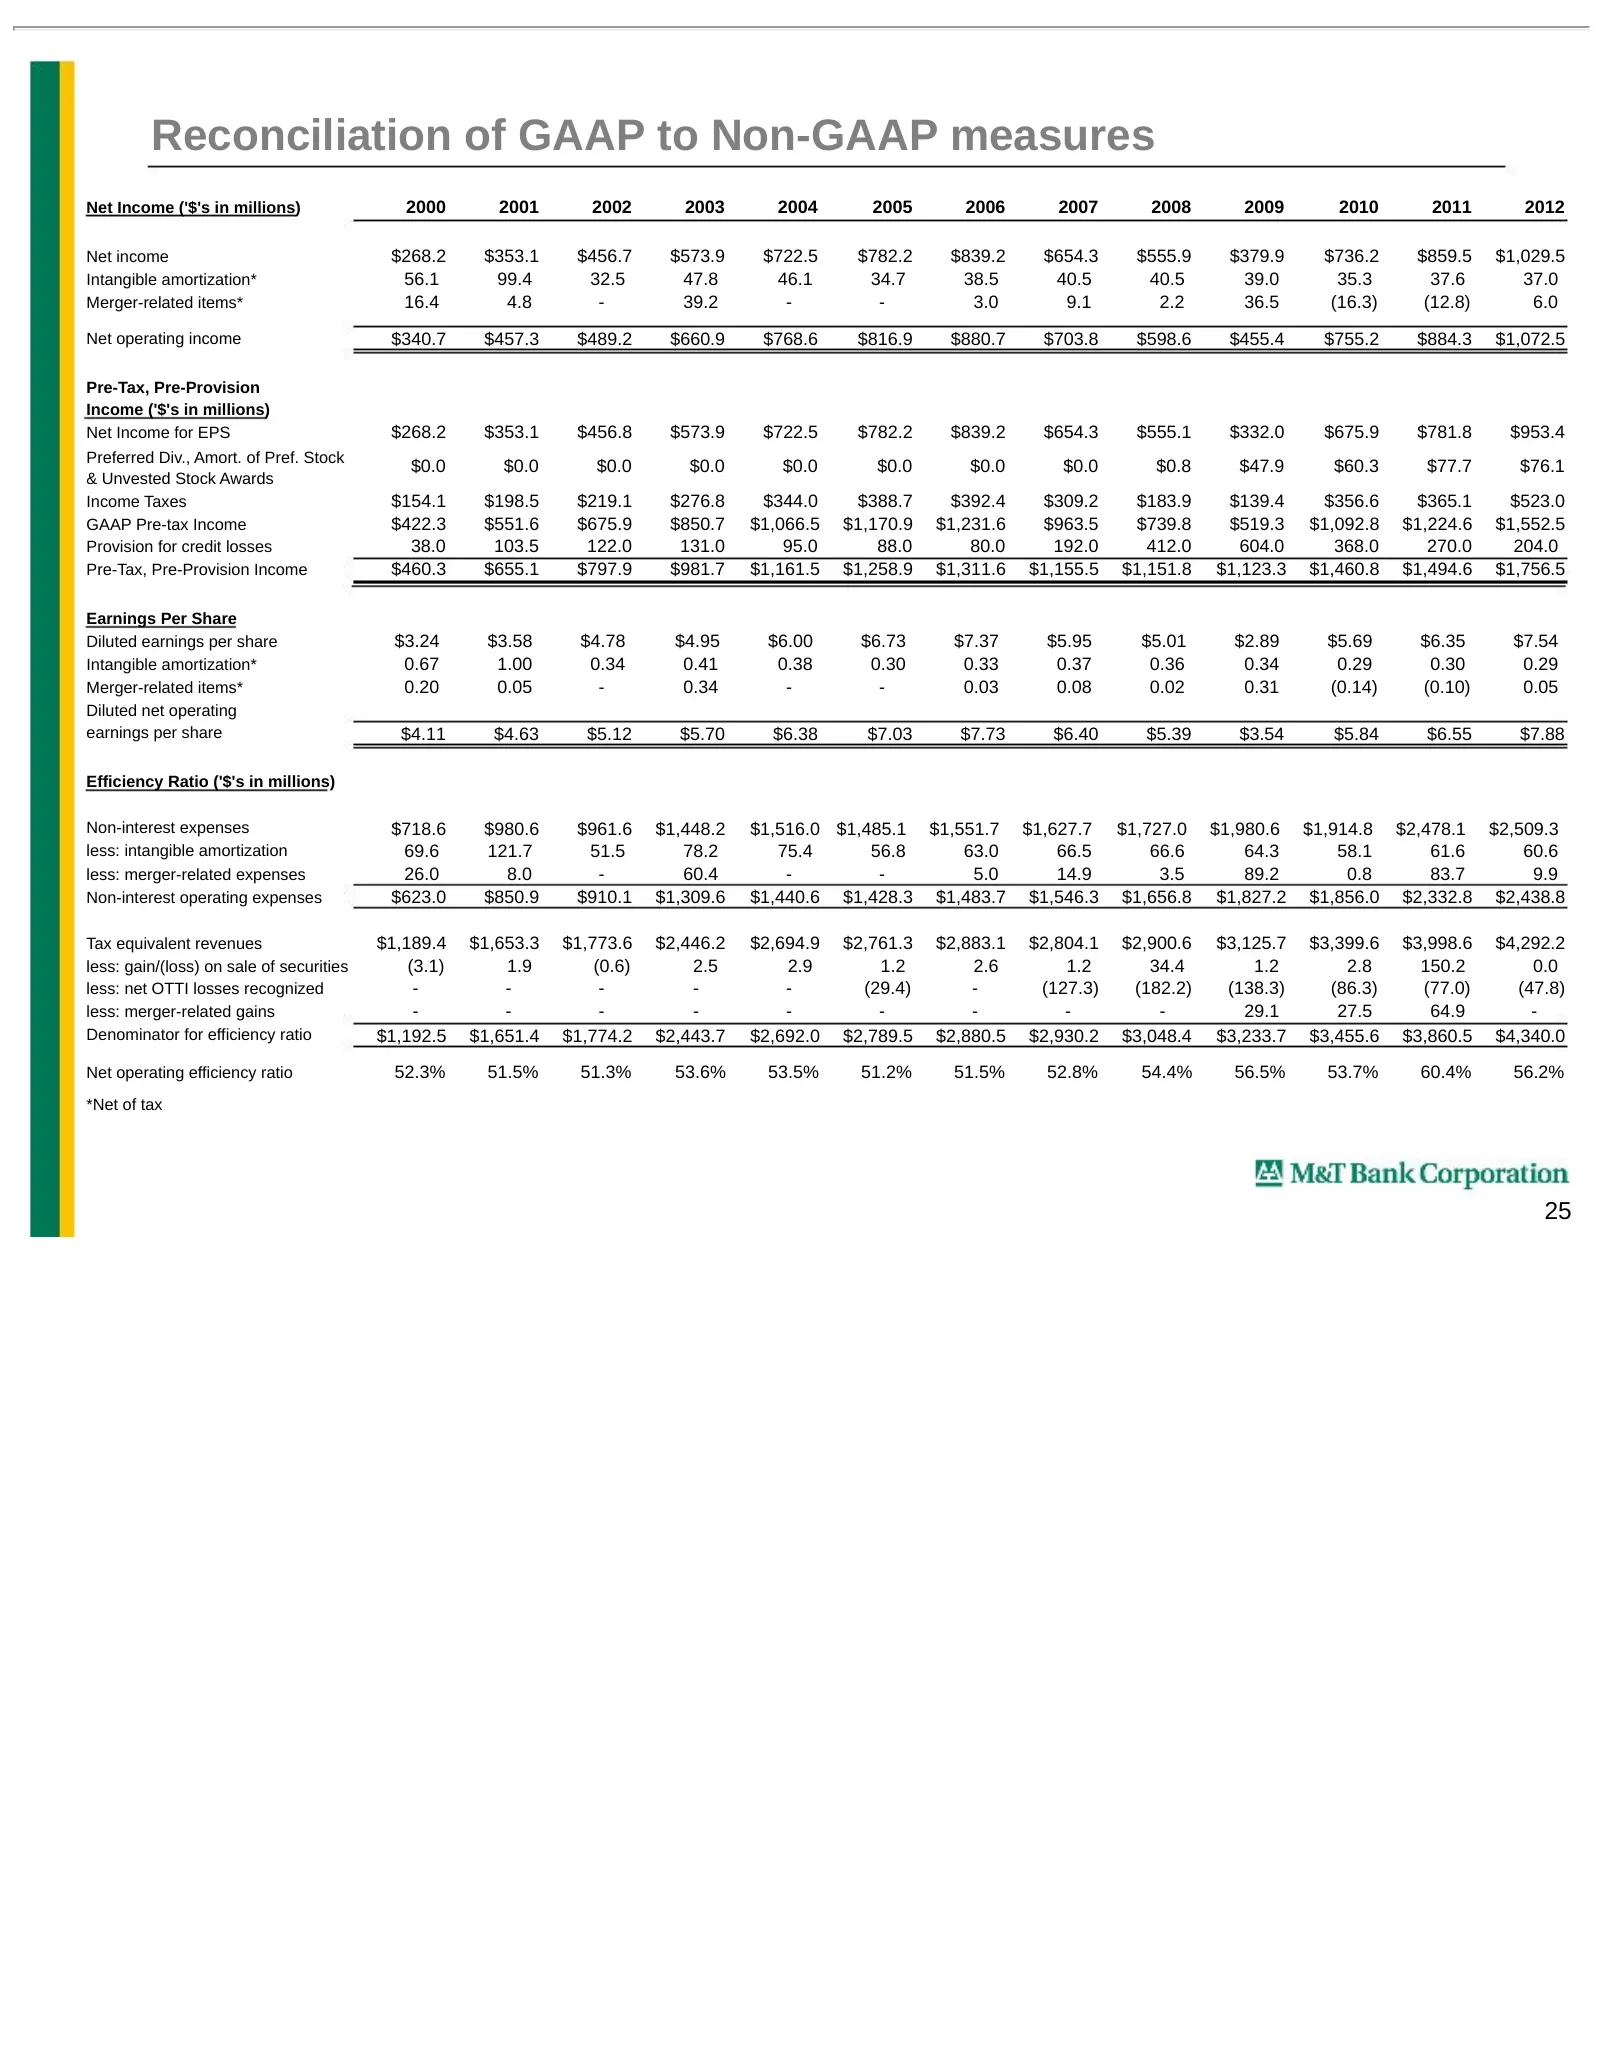
Reconciliation of GAAP to Non-GAAP measures Net Income ('$'s in millions) 2000 2001 2002 2003 2004 2005 2006 2007 2008 2009 2010 2011 2012 Net income $268.2 $353.1 $456.7 $573.9 $722.5 $782.2 $839.2 $654.3 $555.9 $379.9 $736.2 $859.5 $1,029.5 Intangible amortization* 56.1 99.4 32.5 47.8 46.1 34.7 38
Slide 27: Reconciliation of GAAP to Non-GAAP measures
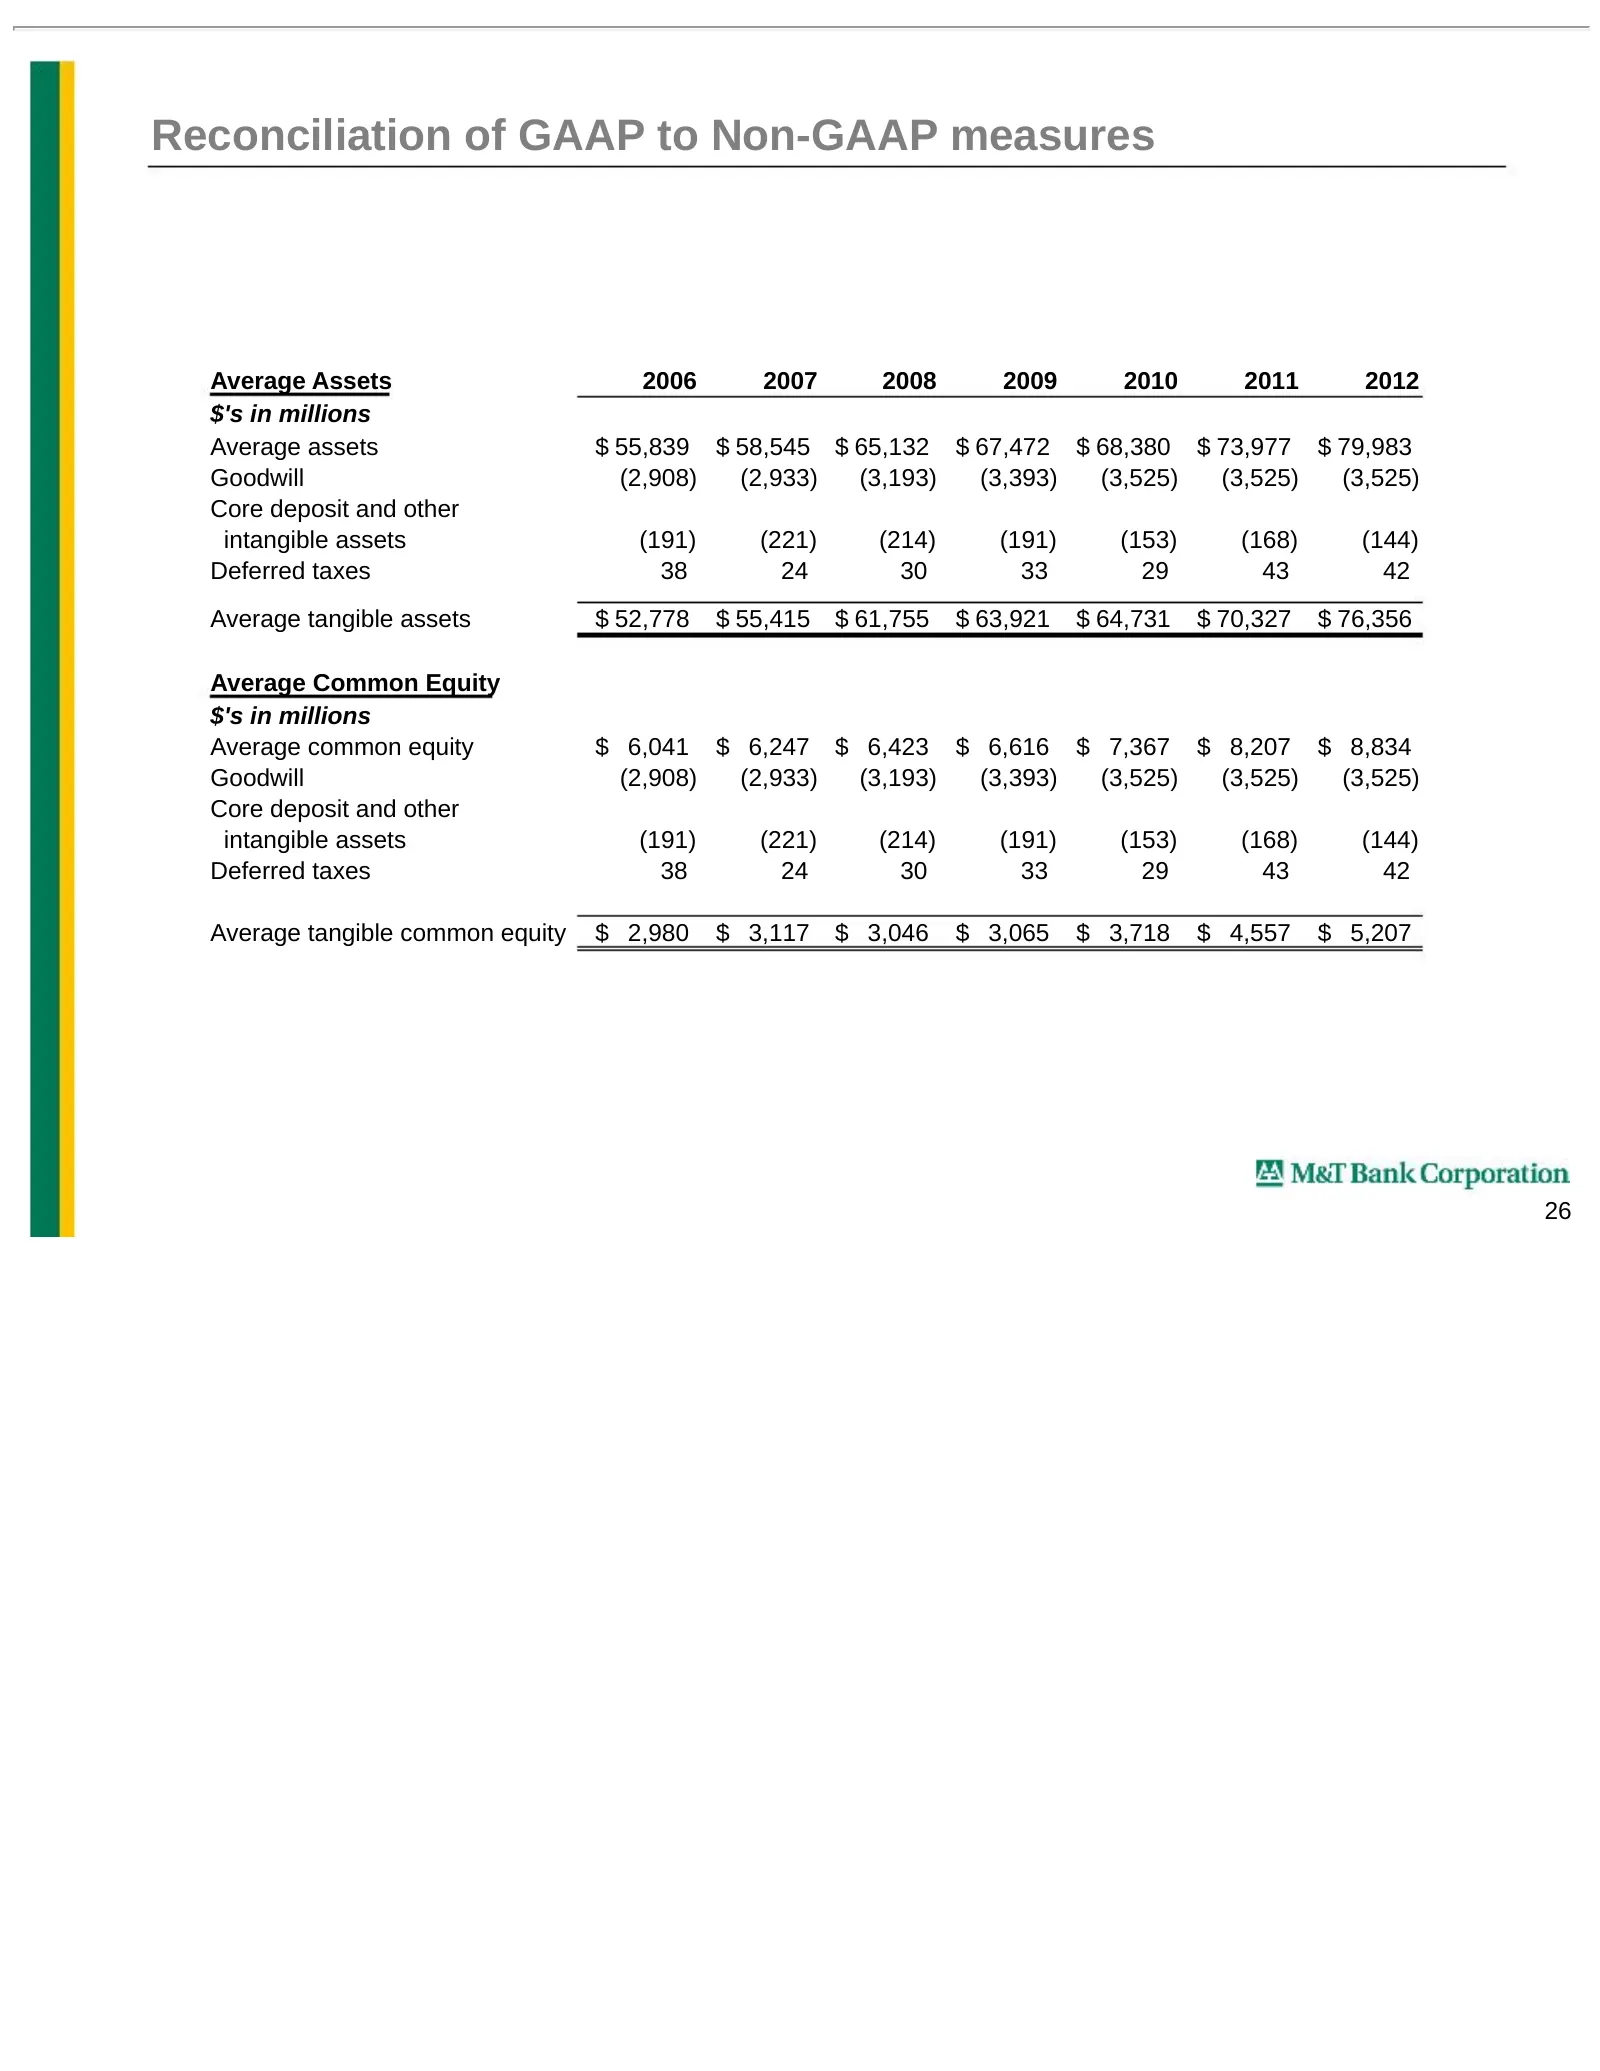
Reconciliation of GAAP to Non-GAAP measures Average Assets 2006 2007 2008 2009 2010 2011 2012 $'s in millions Average assets $ 55,839 $ 58,545 $ 65,132 $ 67,472 $ 68,380 $ 73,977 $ 79,983 Goodwill (2,908) (2,933) (3,193) (3,393) (3,525) (3,525) (3,525) Core deposit and other intangible assets (191)
Slide 28: Reconciliation of GAAP to Non-GAAP measures
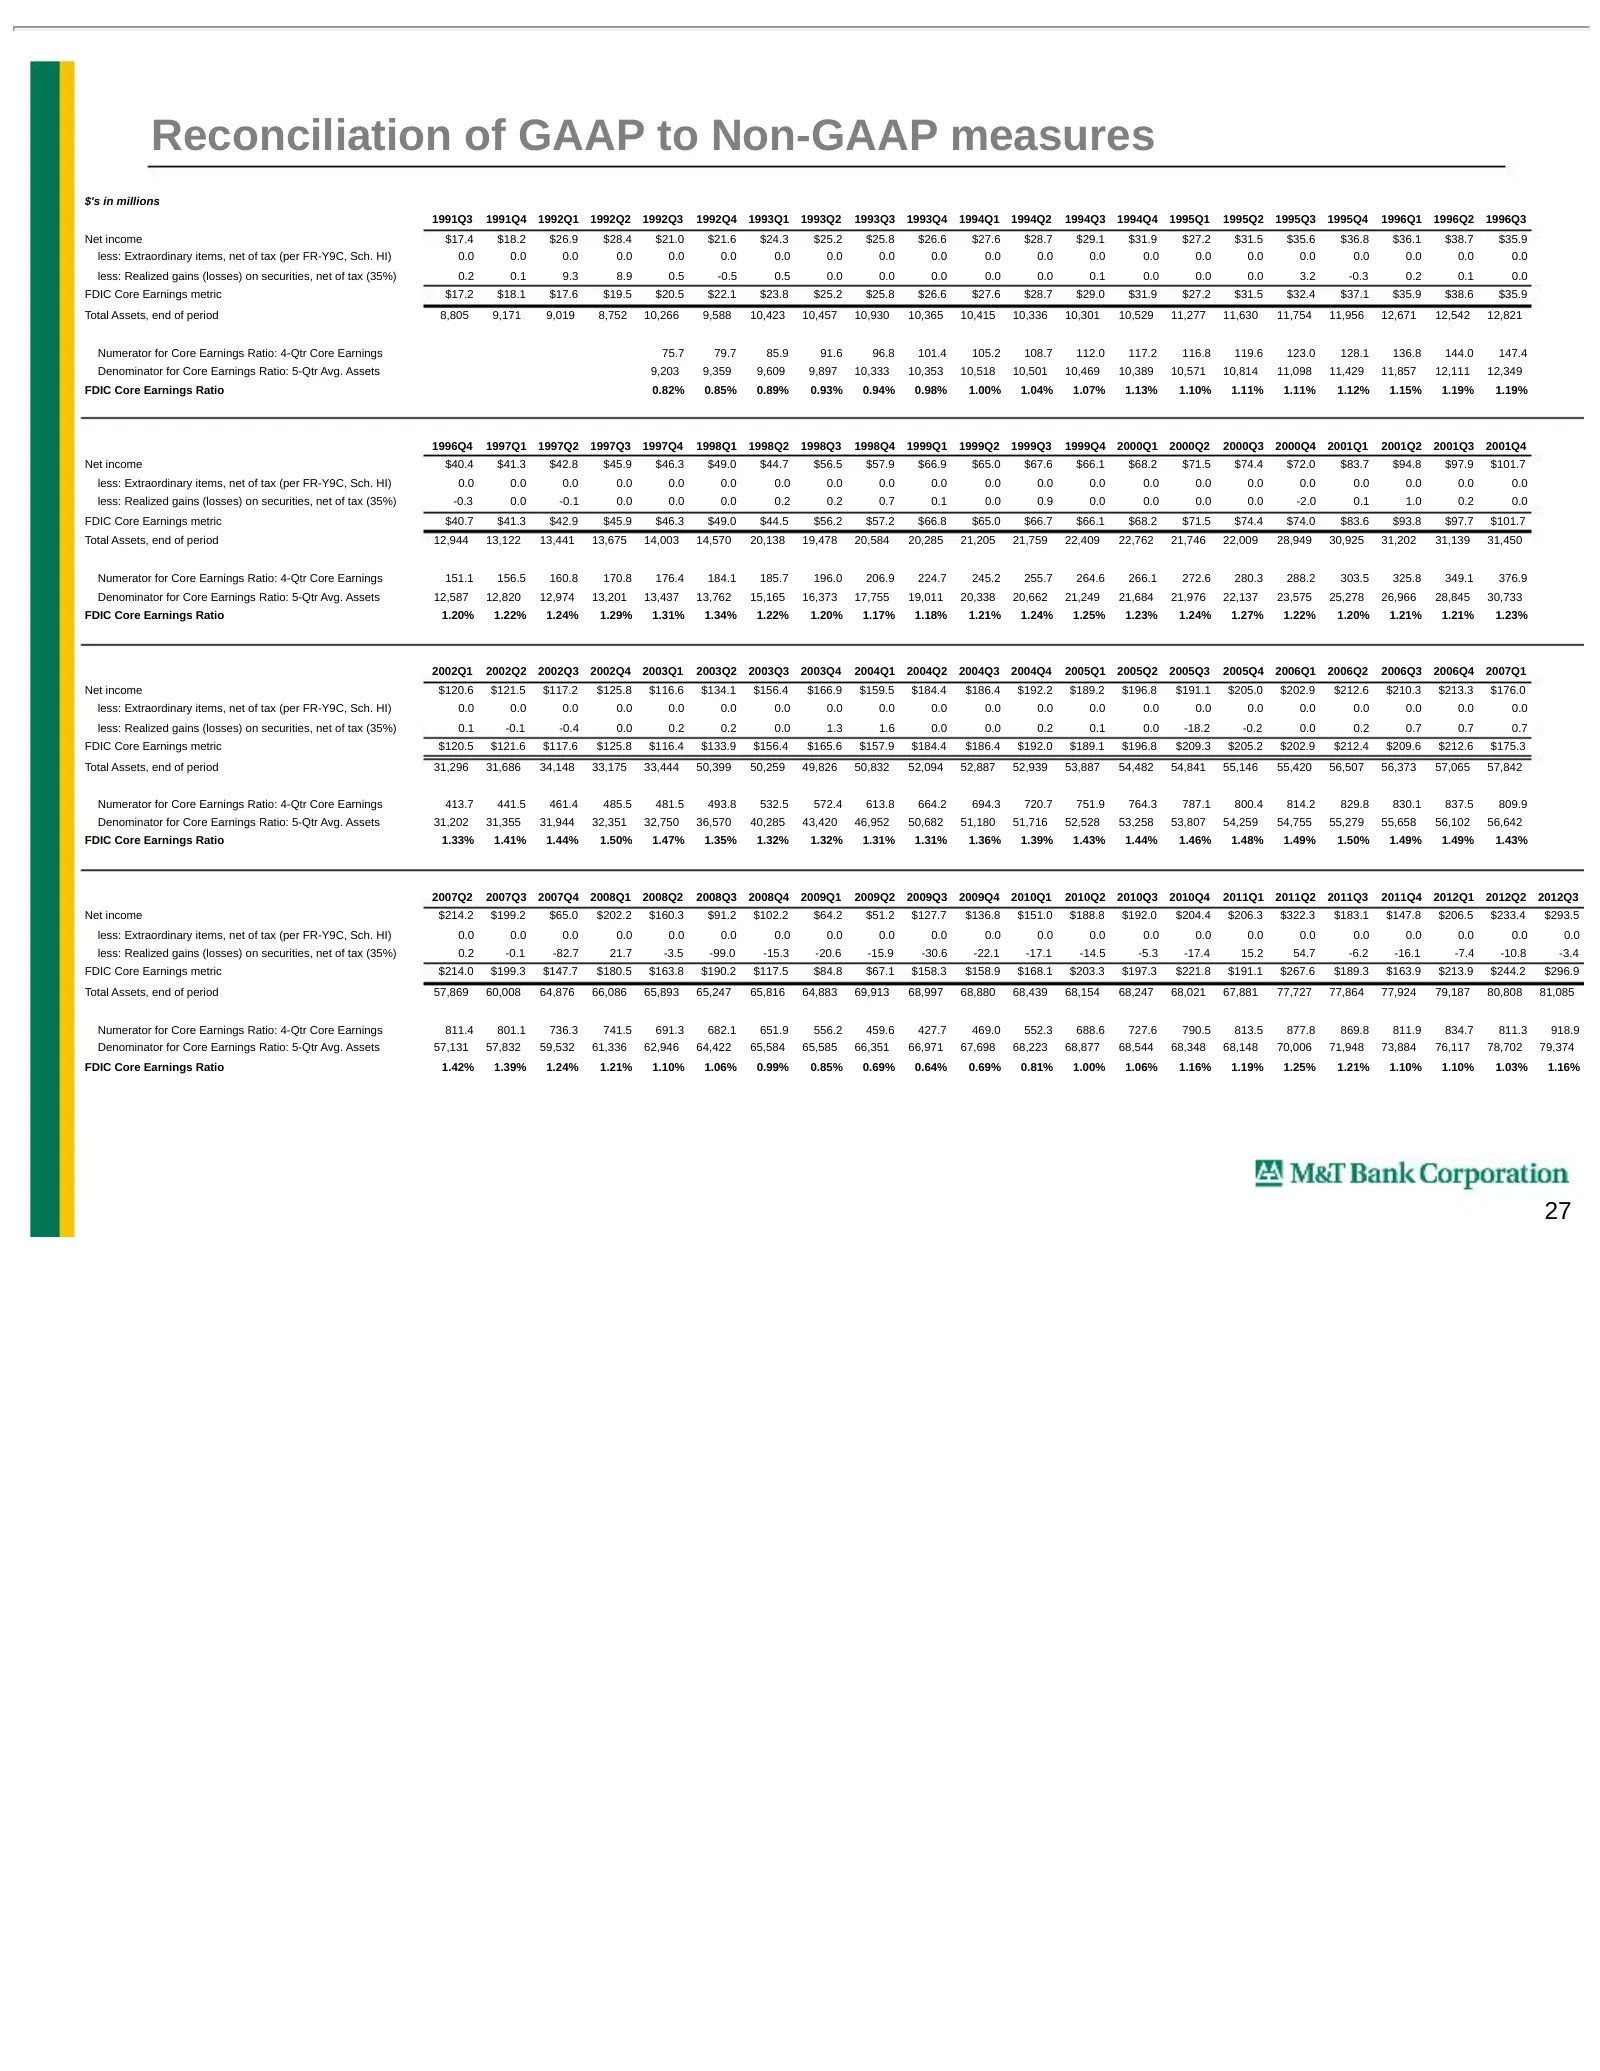
Reconciliation of GAAP to Non-GAAP measures $'s in millions 1991Q3 1991Q4 1992Q1 1992Q2 1992Q3 1992Q4 1993Q1 1993Q2 1993Q3 1993Q4 1994Q1 1994Q2 1994Q3 1994Q4 1995Q1 1995Q2 1995Q3 1995Q4 1996Q1 1996Q2 1996Q3 Net income $17.4 $18.2 $26.9 $28.4 $21.0 $21.6 $24.3 $25.2 $25.8 $26.6 $27.6 $28.7 $29.1 $31.
Slide 29: Among the remaining, M&T ranks 1st in stock price growth
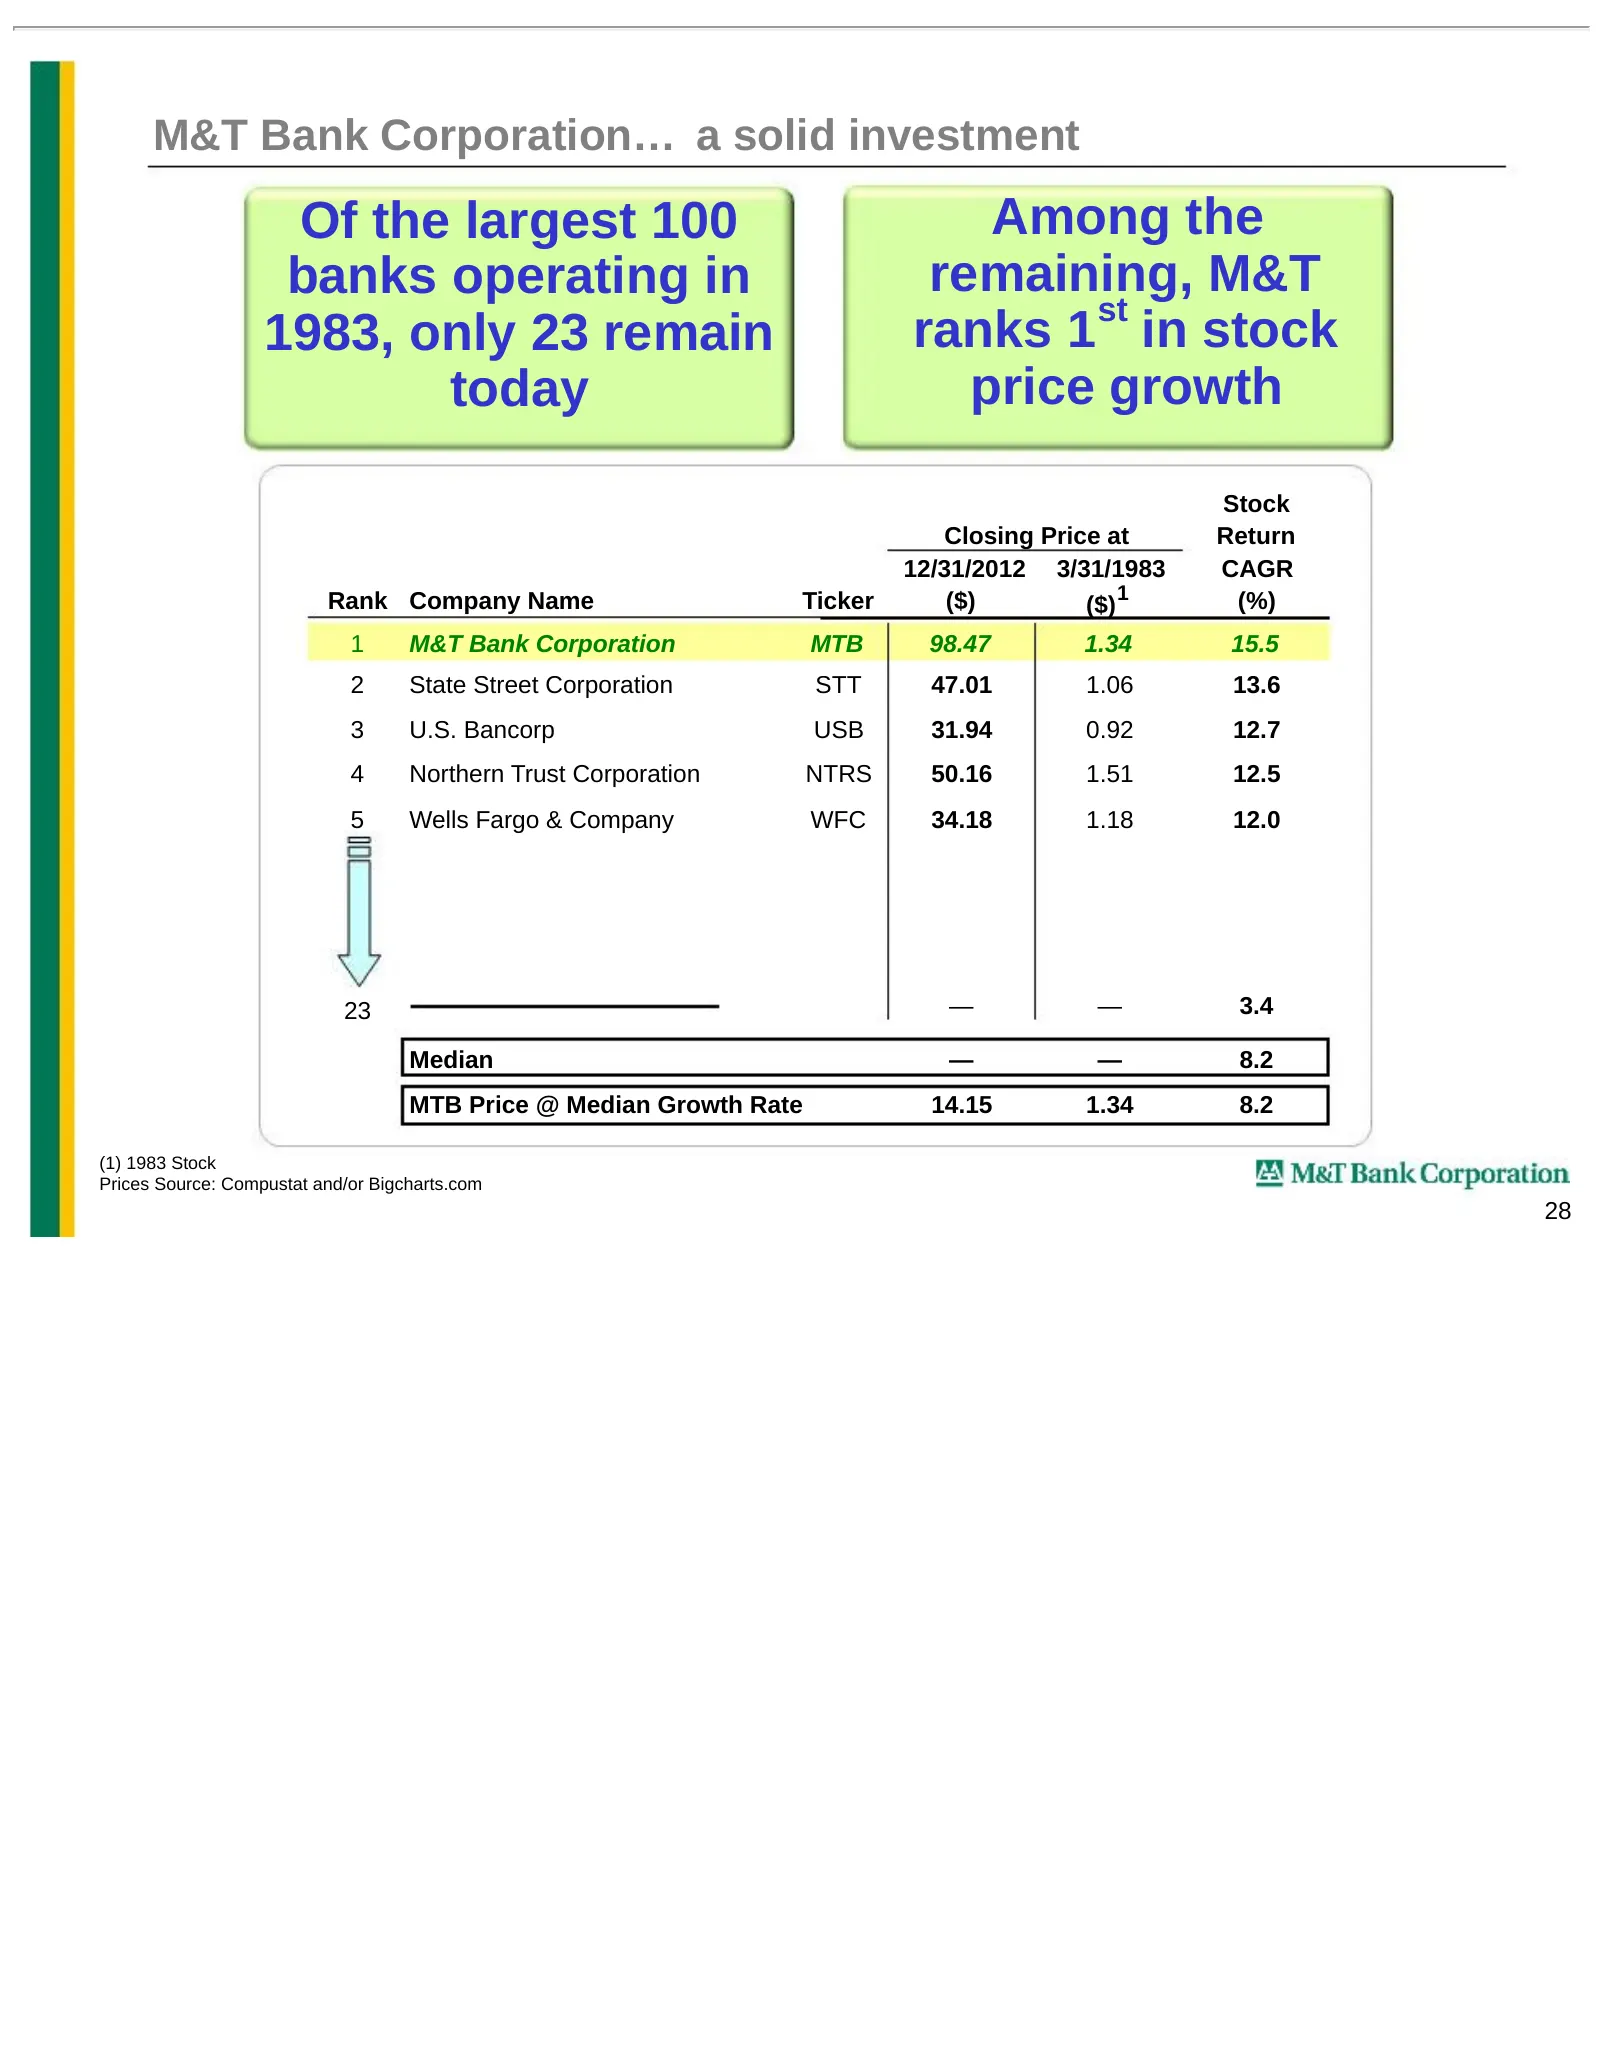
M&T Bank Corporation… a solid investment Of the largest 100 Among the banks operating in remaining, M&T 1983, only 23 remain ranks 1st in stock today price growth Stock Closing Price at Return 12/31/2012 3/31/1983 CAGR Rank Company Name Ticker ($) 1 (%) ($) 1 M&T Bank Corporation MTB 98.47 1.34 15.5
Slide 30: 19.6% Annual rate of return since 1980
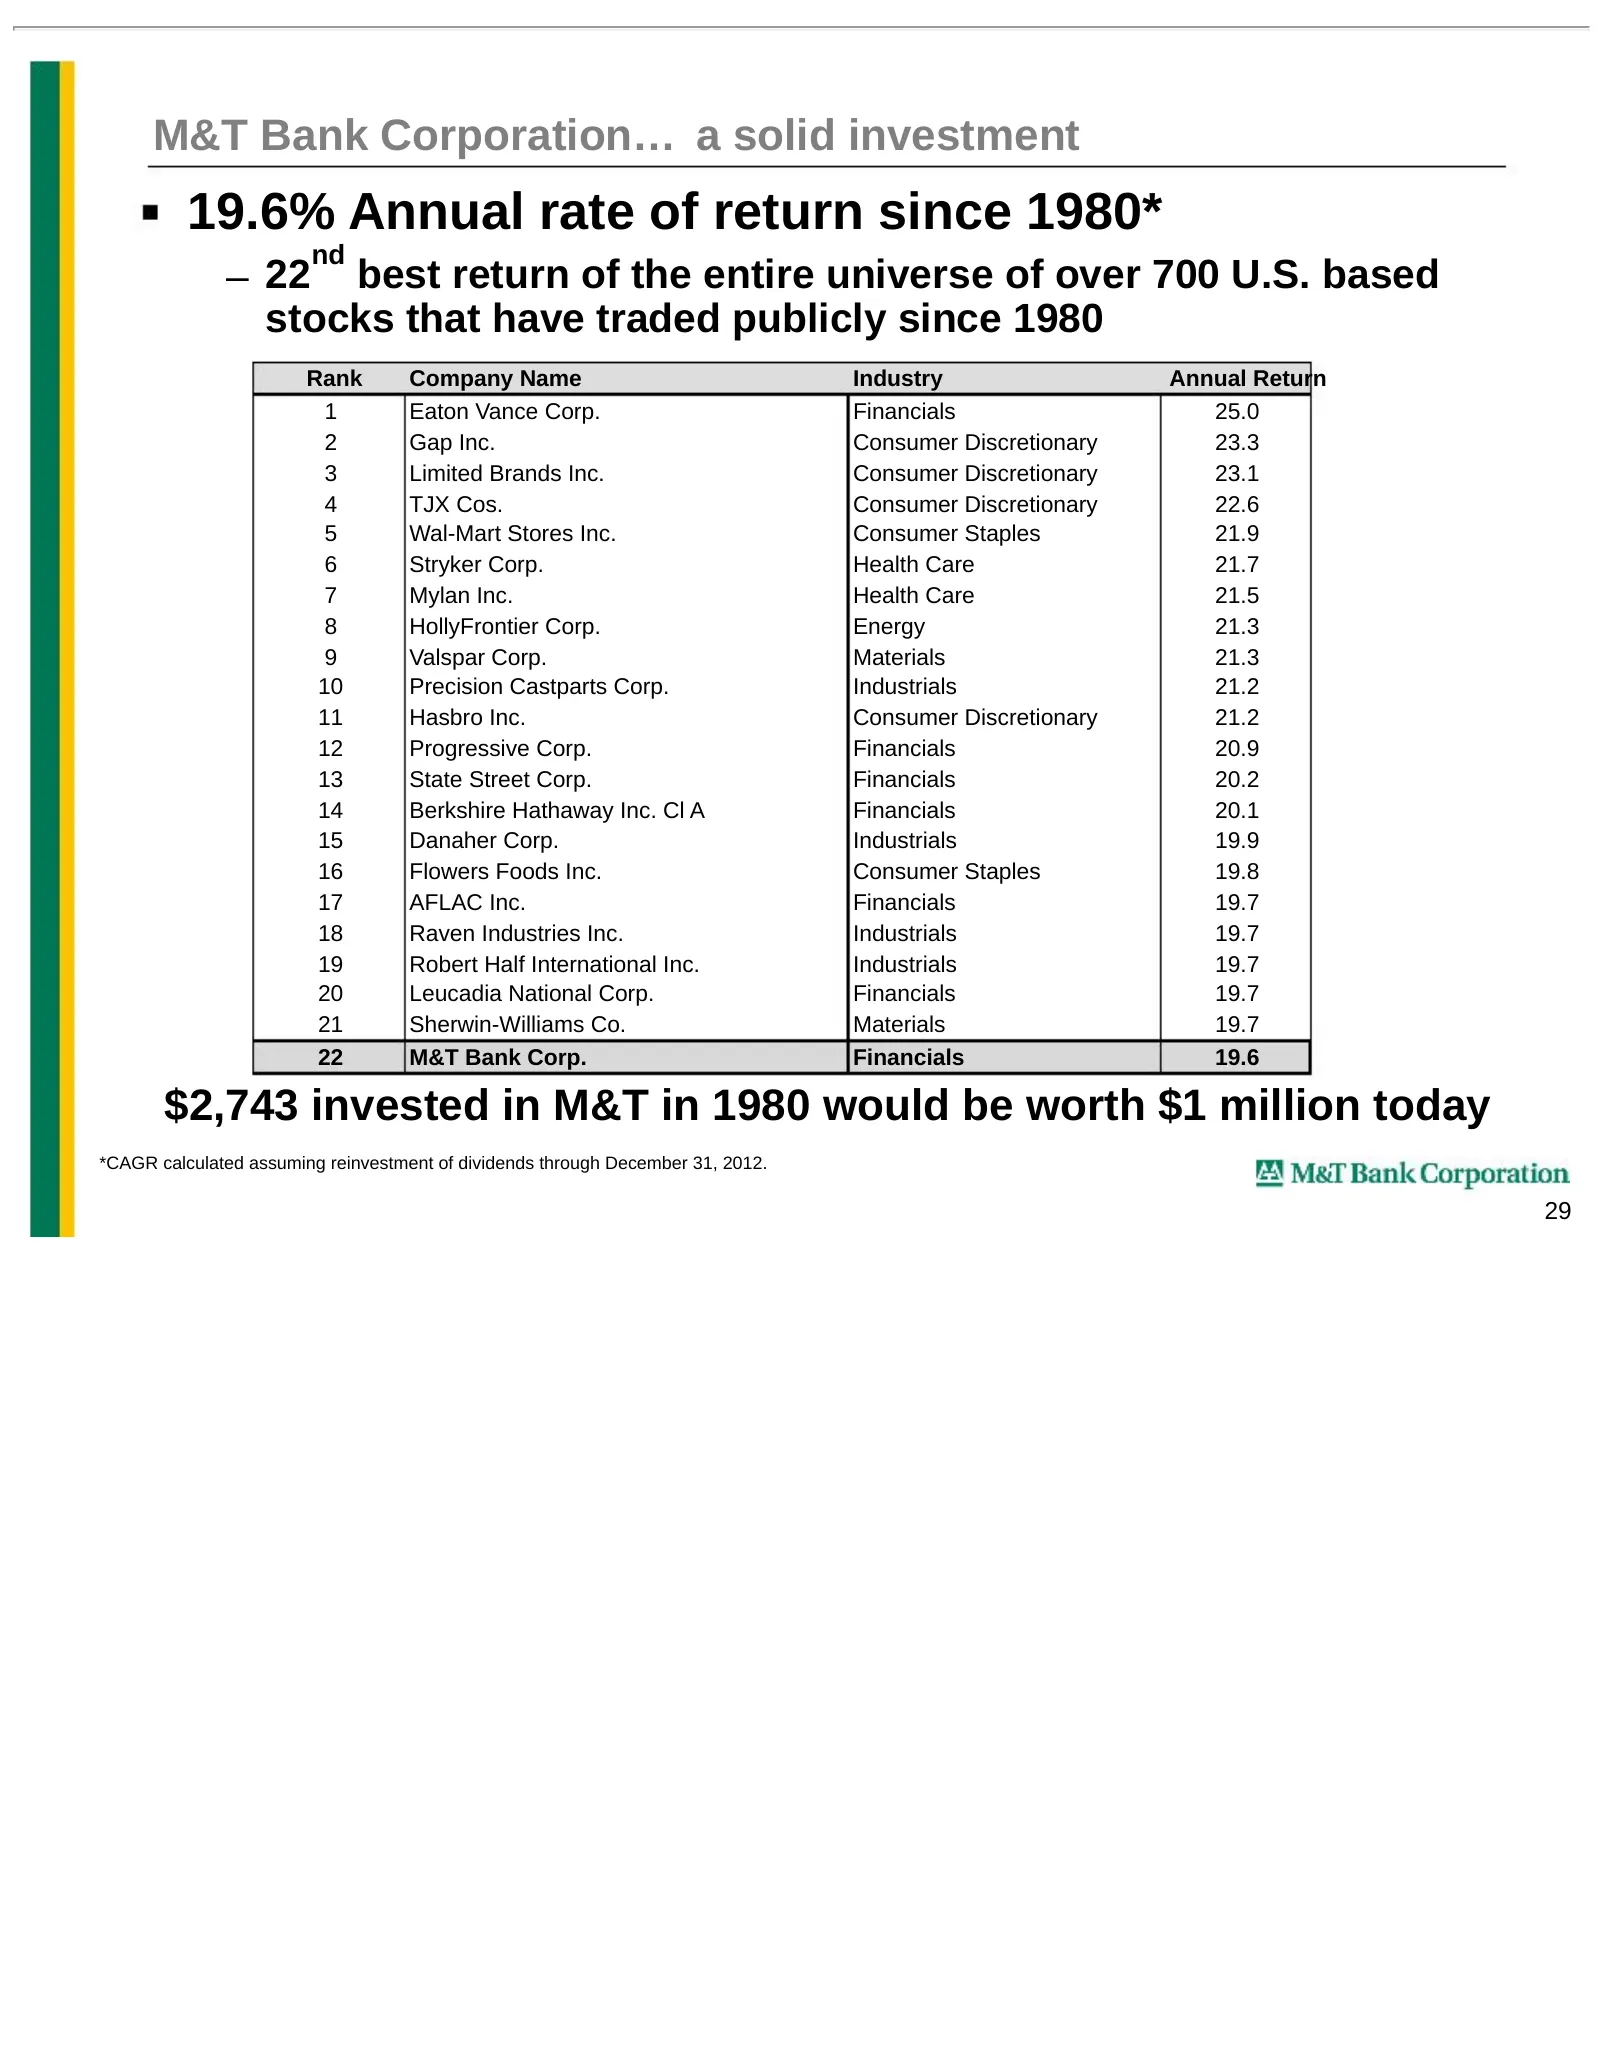
M&T Bank Corporation… a solid investment 19.6% Annual rate of return since 1980* nd – 22 best return of the entire universe of over 700 U.S. based stocks that have traded publicly since 1980 Rank Company Name Industry Annual Return 1 Eaton Vance Corp. Financials 25.0 2 Gap Inc. Consumer Discretionar
Source: SEC EDGAR · 425 filed Mar 6, 2013
More decks from Hudson City Bancorp Inc
 BancAnalysts Association of Boston Conference 201229 slides · Nov 2, 2012
 Barclays Global Financial Services Conference 201234 slides · Sep 10, 2012
 Merger or Acquisition (August 2012)32 slides · Aug 27, 2012
 Shareholder Meeting (April 2012)20 slides · Apr 25, 2012
 Shareholder Meeting (April 2011)38 slides · Apr 19, 2011
 Barclays Capital Global Financial Services Conference 201041 slides · Sep 13, 2010